Journal of Anatomy - pcnjeffery/papers/JANAT-216b.pdf · Division of Human Anatomy ... with...
14
Do agility and skull architecture influence the geometry of the mammalian vestibulo-ocular reflex? Nathan Jeffery and Philip G. Cox Division of Human Anatomy and Cell Biology, School of Biomedical Sciences, University of Liverpool, Liverpool, UK Abstract The spatial arrangement of the semicircular canals and extraocular muscles of the eye has been of considerable interest, particularly to researchers working on adaptations of the vestibulo-ocular reflex. Here we offer the first, extensive comparative analysis of the spatial relationships between each extraocular muscle and the canal providing its primary excitatory stimulus. The sample consisted of 113 specimens, representing 51 extant mam- malian species. Hypotheses tested included that variations in the spatial alignments are linked with differences of skull morphology and with differences of agility during locomotion. Internal morphologies were visualized with magnetic resonance imaging and were measured with landmark-based vectors and planes. Values for body mass and agility were taken from the existing literature. Data were investigated for trends and associations with standard bivariate and multivariate statistical methods as well as with phylogenetically adjusted bivariate methods. The findings clearly show that species differences in the alignment of each extraocular muscle relative to the canal providing its primary excitatory stimulus are closely associated with changes of orbit morphology. The results also indicate that the actions of the oblique muscles interchange with those of the superior and inferior recti muscles when comparing lateral-eyed (rabbit) with frontal-eyed species (cat). There was only weak evidence to support the notion that canal–muscle alignments differ significantly among species according to how agile they are. The results suggest that semicircular canal morphology is arranged primarily for detecting head movements and then secondarily, if at all, for diminishing the burden of transforming vestibulo-ocular reflex signals in the most agile species. Key words agility; convergence; extraocular; frontation; orbit; semicircular. Introduction Gaze stabilization by the vestibulo-ocular reflex (VOR) depends on the ability of a chain of neurons to transform signals representing the planes of the semicircular canals into signals that represent the pull directions of the extraoc- ular muscles (e.g. Graf et al. 1993; Brettler & Baker, 2001; Raphan & Cohen, 2002). The complex functional network of interconnections that governs this transformation is underpinned by a set of six primary couplings, each consist- ing of an extraocular muscle and the canal that provides its primary excitatory stimulus (Szenta ´ gothai, 1950; Fritzsch, 1998; Graf & Klam, 2006; Fig. 1). Numerous researchers have investigated the functional and structural associations of these six primary pairs to gain insights into the basic workings of the VOR and its evolutionary adaptations (e.g. Simpson & Graf, 1981; Ezure & Graf, 1984a,b; Daunicht & Pellionisz, 1987; Spoor & Zonneveld, 1998; Rabbitt, 1999; Raphan & Cohen, 2002; Cox & Jeffery, 2007, 2008). Here we employ a comparative analysis of the spatial alignment of primary canal-muscle pairs to address some fundamental questions regarding the influence of skull architecture on the alignments and the possible link with interspecific dif- ferences of agility during locomotion. Previous studies have shown that the primary canal– muscle alignments vary between canals, between species as well as during development (e.g. Ezure & Graf, 1984a; Cox & Jeffery, 2008). For example, in the cat, the arrangements found with regard to the lateral canal are closer to parallel than the equivalent alignments found in relation to the anterior canal, though this is not the case for all species (see Cox & Jeffery, 2008). Current data for interspecific differ- ences only cover a small number of species, including humans, cats and rabbits, as well as a few rodents (e.g. Simpson & Graf, 1981; Ezure & Graf, 1984a,b; Daunicht & Pellionisz, 1987; Cox & Jeffery, 2008). Recently, Cox & Jeffery (2008) increased the number of specimens sampled to 53 adults representing seven mammalian species. They Correspondence Nathan Jeffery, Division of Human Anatomy and Cell Biology, School of Biomedical Sciences, University of Liverpool, Sherrington Build- ings, Ashton Street, Liverpool L69 3GE, UK. T: + 44 151 7945514; F: + 44 151 7945517; E: [email protected] Accepted for publication 7 January 2010 Article published online 23 February 2010 ª 2010 The Authors Journal compilation ª 2010 Anatomical Society of Great Britain and Ireland J. Anat. (2010) 216, pp496–509 doi: 10.1111/j.1469-7580.2010.01211.x Journal of Anatomy
Transcript of Journal of Anatomy - pcnjeffery/papers/JANAT-216b.pdf · Division of Human Anatomy ... with...

Do agility and skull architecture influence thegeometry of the mammalian vestibulo-ocular reflex?Nathan Jeffery and Philip G. Cox
Division of Human Anatomy and Cell Biology, School of Biomedical Sciences, University of Liverpool, Liverpool, UK
Abstract
The spatial arrangement of the semicircular canals and extraocular muscles of the eye has been of considerable
interest, particularly to researchers working on adaptations of the vestibulo-ocular reflex. Here we offer the
first, extensive comparative analysis of the spatial relationships between each extraocular muscle and the canal
providing its primary excitatory stimulus. The sample consisted of 113 specimens, representing 51 extant mam-
malian species. Hypotheses tested included that variations in the spatial alignments are linked with differences
of skull morphology and with differences of agility during locomotion. Internal morphologies were visualized
with magnetic resonance imaging and were measured with landmark-based vectors and planes. Values for body
mass and agility were taken from the existing literature. Data were investigated for trends and associations
with standard bivariate and multivariate statistical methods as well as with phylogenetically adjusted bivariate
methods. The findings clearly show that species differences in the alignment of each extraocular muscle relative
to the canal providing its primary excitatory stimulus are closely associated with changes of orbit morphology.
The results also indicate that the actions of the oblique muscles interchange with those of the superior and
inferior recti muscles when comparing lateral-eyed (rabbit) with frontal-eyed species (cat). There was only weak
evidence to support the notion that canal–muscle alignments differ significantly among species according to
how agile they are. The results suggest that semicircular canal morphology is arranged primarily for detecting
head movements and then secondarily, if at all, for diminishing the burden of transforming vestibulo-ocular
reflex signals in the most agile species.
Key words agility; convergence; extraocular; frontation; orbit; semicircular.
Introduction
Gaze stabilization by the vestibulo-ocular reflex (VOR)
depends on the ability of a chain of neurons to transform
signals representing the planes of the semicircular canals
into signals that represent the pull directions of the extraoc-
ular muscles (e.g. Graf et al. 1993; Brettler & Baker, 2001;
Raphan & Cohen, 2002). The complex functional network
of interconnections that governs this transformation is
underpinned by a set of six primary couplings, each consist-
ing of an extraocular muscle and the canal that provides its
primary excitatory stimulus (Szentagothai, 1950; Fritzsch,
1998; Graf & Klam, 2006; Fig. 1). Numerous researchers have
investigated the functional and structural associations of
these six primary pairs to gain insights into the basic
workings of the VOR and its evolutionary adaptations (e.g.
Simpson & Graf, 1981; Ezure & Graf, 1984a,b; Daunicht &
Pellionisz, 1987; Spoor & Zonneveld, 1998; Rabbitt, 1999;
Raphan & Cohen, 2002; Cox & Jeffery, 2007, 2008). Here we
employ a comparative analysis of the spatial alignment of
primary canal-muscle pairs to address some fundamental
questions regarding the influence of skull architecture on
the alignments and the possible link with interspecific dif-
ferences of agility during locomotion.
Previous studies have shown that the primary canal–
muscle alignments vary between canals, between species as
well as during development (e.g. Ezure & Graf, 1984a; Cox &
Jeffery, 2008). For example, in the cat, the arrangements
found with regard to the lateral canal are closer to parallel
than the equivalent alignments found in relation to the
anterior canal, though this is not the case for all species (see
Cox & Jeffery, 2008). Current data for interspecific differ-
ences only cover a small number of species, including
humans, cats and rabbits, as well as a few rodents (e.g.
Simpson & Graf, 1981; Ezure & Graf, 1984a,b; Daunicht &
Pellionisz, 1987; Cox & Jeffery, 2008). Recently, Cox & Jeffery
(2008) increased the number of specimens sampled to
53 adults representing seven mammalian species. They
Correspondence
Nathan Jeffery, Division of Human Anatomy and Cell Biology, School
of Biomedical Sciences, University of Liverpool, Sherrington Build-
ings, Ashton Street, Liverpool L69 3GE, UK. T: + 44 151 7945514;
F: + 44 151 7945517; E: [email protected]
Accepted for publication 7 January 2010
Article published online 23 February 2010
ªª 2010 The AuthorsJournal compilation ªª 2010 Anatomical Society of Great Britain and Ireland
J. Anat. (2010) 216, pp496–509 doi: 10.1111/j.1469-7580.2010.01211.x
Journal of Anatomy

reported that the posterior canal – contralateral inferior rec-
tus (PSC-cIR) angle is about 30� in the rabbit but closely
aligned in the guinea pig (� 0�) and misaligned in the oppo-
site direction by 15� in humans. This amounted to a 45�range of variation across the seven species studied. The rab-
bit and human also occupied the extremes for measure-
ments of the anterior canal – ipsilateral superior rectus (ASC-
iSR; )21� rabbit to +13� human), the anterior canal – contra-
lateral inferior oblique (ASC-cIO; )15� rabbit to +30� human)
as well as the posterior canal – ipsilateral superior oblique
(PSC-iSO; )13� rabbit to +17� human) and lastly, the lateral
canal – contralateral lateral rectus (LSC-cLR; )25� rabbit to
+15� human). The sequence for the lateral canal – ipsilateral
medial rectus (LSC-iMR) is slightly different, with a range of
variation marked by the rat ()13�) at one end and humans
(+19�) at the other, with cats showing the closest alignment
(� 0�). In an earlier paper, Cox & Jeffery (2007) also
observed that these angles are not fixed during early in ute-
ro development. The angles varied throughout most of the
prenatal period from a state of misalignment towards, but
never actually reaching, a more parallel geometry.
Although it is not entirely clear what influences changes
in the alignment of the primary canal–muscle pairs, Cox &
Jeffery (2008) favour Simpson & Graf’s (1981) hypothesis
that differences of skull architecture are primarily responsi-
ble, particularly changes of orbit position within the skull.
Across adult mammals, and during prenatal development,
there is a trend in which the bony orbits, and presumably
the eye and extraocular muscles, shift position towards the
midline (orbital convergence) and towards the front of the
skull (orbital frontation) (see Noble et al. 2000; Jeffery et al.
2007; Heesy, 2008; see also Fig. 2). Another architectural
feature to consider is the orientation of the petrous bones
that encapsulate the semicircular canals. The angle between
the long axes of the petrous bones has been shown to vary
significantly across adult extant primates and fossil homi-
nids, as well as during primate fetal development (Spoor,
1997; Jeffery, 2003). For instance, Spoor (1997) documented
that in adult modern humans the petrous axes are more
coronally orientated than in other extant great apes and
fossil hominids. Jeffery & Spoor (2002) showed a similar
coronal re-orientation of the petrous bones with increasing
human fetal age. Assuming the arrangement of the canals
is fixed within the petrous bone, any petrous re-orientation
will shift the positions of the semicircular canals contained
therein relative to the axes of the extraocular muscles. Such
changes may compensate or exacerbate misalignments due
to concomitant changes of orbit morphology and extraocu-
lar muscle geometry. Because of the limited range of spe-
cies studied so far, Simpson & Graf (1981) and, more
Fig. 1 Illustration showing the primary
functional couplings between each
extraocular muscle and the canal providing
the excitatory stimulus. SO, superior oblique;
IO, inferior oblique; SR, superior rectus; IR,
inferior rectus; MR, medial rectus; LR, lateral
rectus; ASC, anterior semicircular canal; PSC,
posterior semicircular canal; LSC, lateral
semicircular canal; VIII, vestibular part of
vestibulo-cochlear nerve; VN, vestibular nuclei;
MLF, medial longitudinal fasciculus; III,
oculomotor nucleus; IV, trochlear nucleus; VI,
abducent nucleus.
ªª 2010 The AuthorsJournal compilation ªª 2010 Anatomical Society of Great Britain and Ireland
Geometry of the mammalian vestibulo-ocular reflex, N. Jeffery and P. G. Cox 497

recently, Cox & Jeffery (2008) were unable to establish sta-
tistically the nature of the interspecific differences of align-
ment in relation to changes of skull morphology. Here we
examine the potential influence of skull architecture by
testing the following hypothesis with a larger and more
diverse sample of mammals:
Hypothesis 1 – skull architecture
This states that interspecific changes in the angle between
each extraocular muscle and the canal providing its primary
excitatory stimulus are due to alterations of orbital fronta-
tion, orbital convergence and petrous orientation. The null
prediction is that changes of canal–muscle angles are inde-
pendent of changes in orbit and petrous position.
The overall functional demands placed on the VOR trans-
formation can be simplified in terms of the frequency and
erraticism of head movements, collectively referred to here
as agility, together with the extent of any spatial mismatch
in the primary canal–muscle planes. This basic formulization
raises an interesting question: does the greater functional
challenge of integrating divergent canal–muscle axes place
any tangible limit on the range of head movements that a
species can effectively transform into extraocular muscle
pull directions? Or, can the neuron chain adequately trans-
form any spatial mismatch for any range of agility, implying
that the spatial arrangement of the canals and muscles is
inconsequential (see for example work on frogs by Pantle &
Dieringer, 1998)? Previous studies have linked canal orienta-
tions and relative canal sizes to differences of agility (e.g.
Spoor & Zonneveld, 1998; Spoor et al. 2007; Yang & Hullar,
2007). More specifically, Spoor & Zonneveld (1998) pro-
posed that the empirical association of canal morphology
with agility partly results from the functional and spatial
requirements of the vestibulo-ocular reflex. Here we test
the following hypothesis in order clarify the notion of a
spatial constraint on the ability of the VOR to compensate
for agile movements:
Hypothesis 2 – agility
This suggests that among fast-moving, agile species the
additional functional demands of erratic and high fre-
quency head movements has favoured a closer alignment
of canal–muscle planes. This predicts that the misalignment
measured among agile species will be significantly less than
that in slower moving species. The prediction will be tested
by comparing published data on agility (e.g. Spoor et al.
2007) against alignment angles. Note that the wording of
the hypothesis is a matter of convenience and does not
purport to distinguish cause from effect. In other words, if
we do observe a link, we cannot determine whether it is
agility constraining canal–muscle orientation, canal–muscle
orientation constraining agility or some other undefined
influence.
Methods
Sample and imaging
Image data were collected and collated for 113 specimens, rep-
resenting 51 extant mammalian species from 15 eutherian
orders (as defined by Wilson & Reeder, 2005). Specimens were
A B
C D Fig. 2 Sketches of a European rabbit skull
(Oryctolagus cuniculus; A,C) and a chimp
skull (Pan troglodytes; B,D) in superior (A,B)
and lateral (C,D) profile illustrating differences
of orbital convergence towards the midline
(A,B) and orbital frontation towards the
horizontal plane (C,D) (See Noble et al. 2000
& Heesy, 2004).
ªª 2010 The AuthorsJournal compilation ªª 2010 Anatomical Society of Great Britain and Ireland
Geometry of the mammalian vestibulo-ocular reflex, N. Jeffery and P. G. Cox498

Tab
le1
Sam
ple
det
ails
and
mea
sure
men
tdat
a(u
nits
are
deg
rees
unle
ssoth
erw
ise
stat
ed;
refe
rto
Table
2fo
rm
easu
rem
ent
abbre
viat
ions)
.
ªª 2010 The AuthorsJournal compilation ªª 2010 Anatomical Society of Great Britain and Ireland
Geometry of the mammalian vestibulo-ocular reflex, N. Jeffery and P. G. Cox 499
kindly provided by numerous institutions and were imaged on
seven different systems (see Table 1 and Acknowledgements for
details). The majority of specimens were imaged with the
4.7 Tesla imaging and spectroscopy unit (Sisco-Varian, USA) at
Queen Mary, University of London, with a T2-weighted spin-
echo multi-slice sequence (TE = 20–50 ms; TR = 8000–16 000 ms).
Data were zero-filled to between 256 · 256 and 512 · 512 data
points, Fourier transformed and exported as raw binary files
representing fields of view (FOV) from 30.8 to 115.2 mm. Slice
thickness ranged from 0.24 to 0.90 mm. Similar apparatus and
comparable sequences were used to acquire data on the other
systems (see Table 1 for details). Data for 13 specimens, includ-
ing all the modern humans, were provided by James Rilling
(Emory University), Dirk Bartz (University of Leipzig) and the
NIH Virtual Human Project (http://www.nlm.nih.gov/research/
visible/). Slices for all 113 specimens were interpolated to form
isometric voxels (vertices ranging from 0.05 to 0.9 mm) with the
bicubic spline function in IMAGEJ (W. Rasband, National Institute
of Mental Health, Bethesda).
Measurements
Landmarks representing the semicircular canals, extraocular
muscles, orbits, midline and petrous bones were taken from
each set of the images using AMIRA 5.2 (Mercury Systems Inc.,
Chelmsford, MA, USA). Each extraocular muscle [ipsilateral supe-
rior rectus (iSR), medial rectus (iMR) and superior oblique (iSO),
and contralateral inferior rectus (cIR), lateral rectus (cLR) and
inferior oblique (cIO)] was represented by two landmarks, the
origin and an insertion of that muscle. Vectors representing
each muscle in a three-dimensional space were calculated from
the landmark co-ordinates for the origin and insertion. The ves-
tibular apparatus was defined by a series of 3D landmarks again
using AMIRA 5.2. Each landmark series traces the voxels at the
centre of the canal lumen and the voxels that continue the arc
of the canal through the vestibule. Landmarks were positioned
with reference to at least three slice directions and 3D represen-
tations. The number of points recorded varied between eight
and 42 per canal depending on the resolution of the image and
the relative size of the canal, but in all cases they were close
enough to capture accurately the entire circumference of the
canal including the entire duct, ampulla and utricle. Planes of
best fit for the anterior, posterior and lateral semicircular canals
(ASC, PSC, LSC) were calculated from the landmark sets using a
principal components analysis. Further groups of landmarks
were recorded to define the midsagittal plane, the long axis of
the petrous bone, the cranial base, and the convergence and
frontation of the orbit. Angles were calculated between each
canal plane and the vectors of the two muscles principally acti-
vated by that canal using the dot product and the right-hand
rule (see Table 2). Further details concerning the measurements
are given in Table 2 and Cox & Jeffery (2008).
Species were coded by P.G.C. for agility from one to six with
reference to the values published by Spoor et al. (2007), one
being the least agile and six the most agile. Only one species,
Choloepus didactylus, fell within agility category 1 and was
grouped with category 2. Primate body masses were taken from
Smith & Jungers (1997), Galidia elegans was from Macdonald
(2001), and all others were from Silva & Downing (1995). Where
the sex was known, mean values for that sex were calculated.
Where the sex was unknown, the mean of values marked ‘both’
was calculated.1yk
,Y
erk
es
Reg
ion
al
Pri
mate
Rese
arc
hC
en
ter
(Jim
Ril
lin
g);
uc,
Un
ivers
ity
Co
lleg
eLo
nd
on
;al,
Un
ivers
ity
of
Live
rpo
ol
An
ato
my
Dep
art
men
t;n
s,N
ati
on
al
Mu
seu
ms
of
Sco
tlan
d;
ca,
Un
ivers
ity
Mu
seu
mo
fZo
olo
gy,
Cam
bri
dg
e;
vh,
Vis
ual
Hu
man
Pro
ject
;d
b,
Dir
kB
art
z,U
niv
ers
ity
of
Leip
zig
;vl
,V
ete
rin
ary
Sch
oo
l,U
niv
ers
ity
of
Live
rpo
ol;
hv,
Mu
seu
mo
fC
om
para
tive
Zo
olo
gy,
Harv
ard
;cb
,C
ard
iff
Sch
oo
lo
fB
iom
ed
ical
Scie
nce
s;cs
,U
KC
eta
cean
Stra
nd
ing
sIn
vest
igati
on
Pro
gra
mm
e;
qc,
Qu
een
Mary
,U
niv
ers
ity
of
Lon
do
n(s
ee
Ack
no
wle
dg
em
en
tsfo
r
furt
her
deta
ils)
.2m
a–
7.0
Tesl
a(M
ag
nex-
SMIS
,U
K),
Un
ivers
ity
of
Man
chest
er
[T2-w
eig
hte
dsp
in-e
cho
mu
lti-
slic
ese
qu
en
ce(T
E=
55
ms;
TR
=6000–7
000
ms)
;512
·512
matr
ix
rep
rese
nti
ng
27–6
4m
mFO
V;
slic
eth
ickn
ess
was
0.3
2m
m];
qm
–4.7
Tesl
a(S
isco
-Vari
an
,U
SA),
Qu
een
Mary
,U
niv
ers
ity
of
Lon
do
n[T
2-w
eig
hte
dsp
in-e
cho
mu
lti-
slic
ese
qu
en
ce(T
E=
20–
50
ms;
TR
=800–1
600
ms)
.256
·256
or
512
·512
matr
ix,
rep
rese
nti
ng
30.8
to115.2
mm
FOV
.Sl
ice
thic
kn
ess
ran
ged
fro
m0.2
4to
0.9
0m
m];
ml
–1.5
Tesl
a(S
ymp
ho
ny,
Siem
en
s),
Mag
neti
cR
eso
nan
cean
dIm
ag
eA
naly
sis
Rese
arc
hC
en
tre,
Un
ivers
ity
of
Live
rpo
ol
[T2-w
eig
hte
d3D
turb
osp
inech
ose
qu
en
ce(T
E=
82–9
0m
s;TR
=1500–2
000
ms)
.M
atr
ices
ran
gin
g
fro
m256
·256
to512
·512,
rep
rese
nti
ng
FOV
sfr
om
to100
to340
mm
.Sl
ice
thic
kn
ess
ran
ged
fro
m0.3
–0.5
mm
];p
n–
7.0
&14.1
Tesl
a(V
ari
an
Ino
va,
USA
),H
uck
Inst
itu
teM
ag
neti
c
Reso
nan
ceC
en
tre,
Pen
nSt
ate
Un
ivers
ity
[T2-w
eig
hte
d3D
hard
pu
lse
spin
ech
ose
qu
en
ce(T
E=
12–2
0m
s;TR
=40–1
50
ms)
.Sq
uare
an
dre
ctan
gu
lar
matr
ices
wit
hve
rtic
es
ran
gin
g400
to
800
po
ints
,re
pre
sen
tin
gFO
Vs
fro
m24
to65
mm
.Sl
ice
thic
kn
ess
0.0
4–0
.1m
m];
sg–
4.7
Tesl
a(S
isco
-Vari
an
,U
SA),
Card
iac
&V
asc
ula
rSc
ien
ces,
StG
eo
rge’s
,U
niv
ers
ity
of
Lon
do
n[T
2-
weig
hte
dsp
inech
om
ult
i-sl
ice
seq
uen
ce(T
E=
25
ms;
TR
=1000–1
200).
Matr
ices
ran
gin
gfr
om
256
·256
to512
·512,
rep
rese
nti
ng
FOV
sfr
om
to512
to540
mm
.Sl
ice
thic
kn
ess
0.2
–
0.2
5m
m];
jr–
Imag
es
were
acq
uir
ed
fro
mvo
lun
teers
on
a1.5
TPh
ilip
sN
Tsy
stem
(Ph
ilip
NT
syst
em
(Ph
ilip
sM
ed
ical,
Neth
erl
an
ds)
[T2-w
eig
hte
din
vers
ion
reco
very
seq
uen
ce
(TR
=3000
ms;
TE
=40
ms;
TI
=200
ms)
.Fi
eld
of
view
was
260
mm
rep
rese
nte
db
ya
zero
-fill
ed
matr
ixo
f512
·512.
Slic
es
were
2m
mth
ick.]
;d
b–
Vo
lun
teers
were
imag
ed
on
a1.5
T
Son
ata
Syst
em
(Sie
men
s,G
erm
an
y)[T
2-w
eig
hte
d3D
Co
nst
ruct
ive
Inte
rfere
nce
inSt
ead
ySt
ate
(CIS
S)se
qu
en
ce(T
R=
13
ms;
TE
=5.9
ms)
.Th
eim
ag
em
atr
ices
were
256
·256,
rep
rese
nti
ng
FOV
of
230
mm
an
dsl
ice
thic
kn
ess
was
0.9
mm
.];
vh–
two
cryo
sect
ion
ed
sub
ject
s(o
ne
male
an
do
ne
fem
ale
)p
ub
lish
ed
by
the
Vis
ible
Hu
man
Pro
ject
(htt
p:/
/
ww
w.n
lm.n
ih.g
ov/
rese
arc
h/v
isib
le/)
.Im
ag
em
atr
ices
were
op
tim
ized
for
mu
ltip
lan
ar
refo
rmatt
ing
wit
h648
·740
pix
els
rep
rese
nti
ng
an
FOV
of
207
·234
mm
an
dan
eff
ect
ive
slic
e
thic
kn
ess
of
1m
m.3
All
pri
mate
bo
dy
mass
es
taken
fro
mSm
ith
&Ju
ng
ers
(1997),
Gali
dia
ele
gan
sfr
om
Macd
on
ald
(2001),
all
oth
ers
fro
mSi
lva
&D
ow
nin
g(1
995).
Wh
ere
sex
iskn
ow
n,
mean
of
valu
es
for
that
sex
calc
ula
ted
.W
here
sex
isu
nkn
ow
n,
mean
of
valu
es
of
bo
thse
xes
were
calc
ula
ted
.4A
gil
ity
valu
es
taken
fro
mSp
oo
ret
al.
(2007)
or
est
imate
db
yau
tho
r
P.G
.C.
ªª 2010 The AuthorsJournal compilation ªª 2010 Anatomical Society of Great Britain and Ireland
Geometry of the mammalian vestibulo-ocular reflex, N. Jeffery and P. G. Cox500

Analysis
Significant deviations from univariate normality in the angular
data were tested for with the Shapiro–Wilk function in PAST
v1.89 (Hammer et al. 2001). In the present sample, absolute
error could in theory increase with body size, as voxels are typi-
cally larger for the larger species due to the physical limitations
of accommodating and imaging these samples. At least two
voxels are required to identify the canal lumen, but in practice
a cube of 3 · 3 · 3 voxels is needed to visualize the lumen in 3D
and then identify the central voxel correctly. To give an indica-
tion of the potential influence of resolution, and indirectly body
size, on the landmarking of the correct voxel we took one large
(giraffe) and one small (mouse) specimen and randomly altered
each x, y and z co-ordinate value by either +1, )1 or 0, repre-
senting the 3 · 3 · 3 voxel matrix. We then recalculated the
angles. The process was repeated 10 times per specimen. In
addition, a one-way ANOVA was calculated for each angular mea-
surement in Microsoft EXCEL 2007 to determine whether the
interspecific variance between species that are represented by
Table 2 Measurement details.
Abbreviation Description
Landmarks
BA Basion: midline point on the anterior margin of the foramen magnum
cIOI Centroid of the contralateral inferior oblique muscle as it inserts on the eyeball
cIOO Centroid of the contralateral inferior oblique muscle near its origin on the orbital wall
cIRI Centroid of the contralateral inferior rectus muscle as it inserts on the eyeball
cLRI Centroid of the contralateral lateral rectus muscle as it inserts on the eyeball
cO Centroid of the contralateral optic nerve as it passes through the optic foramen
cPETap Anteriormost and medialmost point of the contralateral petrous bone
DS Apex of the dorsum sellae in the midsagittal plane
FC Foramen caecum: midline point marking the pit between the crista galli and the endocranial wall
of the frontal bone
iMRI Centroid of the ipsilateral medial rectus muscle as it inserts on the eyeball
iO Centroid of the ipsilateral optic nerve as it passes through the optic foramen
iPETap Anteriormost and medialmost point of the ipsilateral petrous bone
iSOI Centroid of the ipsilateral superior oblique muscle as it inserts on the eyeball
iSOO Point on the medial orbital wall at which the ipsilateral superior oblique muscle abruptly changes
direction (trochlea)
iSRI Centroid of the ipsilateral superior rectus muscle as it inserts on the eyeball
ORBi Inferiormost point on the bony orbital margin
ORBm Medialmost point on the bony orbital margin
ORBs Superiormost point on the bony orbital margin
PETaA Apex of petrous bone in anteriormost coronal slice in which cochlea is visible
PETaM Apex of petrous bone in coronal slice in which internal auditory meatus is visible
PETaP Apex of petrous bone in posteriormost coronal slice in which posterior semicircular canal is visible
PETbA Base of petrous bone in anteriormost coronal slice in which cochlea is visible
PETbM Base of petrous bone in coronal slice in which internal auditory meatus is visible
PETbP Base of petrous bone in posteriormost coronal slice in which posterior semicircular canal is visible
PPS Posterior midsagittal point on the presphenoideum
Muscle vectors
cIO Contralateral inferior oblique muscle: cIOO to cIOI
cIR Contralateral inferior rectus muscle: cO to cIRI
cLR Contralateral lateral rectus muscle: cO to cLRI
iMR Ipsilateral medial rectus muscle: iO to iMRI
iSO Ipsilateral superior oblique muscle: iSOO to iSOI
iSR Ipsilateral superior rectus muscle: iO to iSRI
Semicircular canal planes
ASC Anterior semicircular canal plane of best fit
LSC Lateral semicircular canal plane of best fit
PSC Posterior semicircular canal plane of best fit
Other planes
ORB Orbital convergence plane: plane containing iO, ORBi and ORBs
CRB Cranial base plane: plane containing PPS, cPETap and iPETap
FRO Orbital frontation plane: plane containing ORBi, ORBm and ORBs
PBP Petrous bone plane: plane of best fit of PETaA, PETaM, PETaP, PETbA, PETbM and PETbP
MSP Midsagittal plane: plane containing BA, DS, FC and PPS
ªª 2010 The AuthorsJournal compilation ªª 2010 Anatomical Society of Great Britain and Ireland
Geometry of the mammalian vestibulo-ocular reflex, N. Jeffery and P. G. Cox 501

more than one individual (n = 18) was greater than the intra-
specific variance due to, amongst other things, landmarking
error, sexual dimorphism, and population differences.
A product-moment correlation coefficient matrix was
produced to explore the statistical relationships among the
data. Following convention, agility scores, which are ordinal cat-
egorical values, were treated as forms of continuous measure-
ment data (see Spoor et al. 2007). It is important to appreciate
that closely related species can resemble one another in a hier-
archical fashion due to their shared phylogenetic history as well
as due to shared functional demands. This can lead to increases
of type I, false-positive errors where phylogenetic relationships
are misinterpreted as functional relationships and vice versa
(Garland et al. 2005). Here we repeated the correlation matrix
with standardized phylogenetic independent contrasts (Garland
& Ives, 2000; Garland et al. 2005) computed with MESQUITE v2.5
(Maddison & Maddison, 2008) and the PDAP macro (Midford
et al. 2003). The tree used in the analysis (see Table 1) was
created using topological information and branch length data
taken from Bininda-Emonds et al. (2007).
Tests for significant differences between categories of agility
were carried out initially with Student’s t-tests in Microsoft EXCEL
2007 (two-tailed, equal variance) and then with multiple analy-
sis of covariance (MANCOVA) in SPSS version 16 (SPSS Inc., Chicago,
IL, USA). Agility scores were treated as forms of ordinal data.
With regard to the second hypothesis (see Introduction), the
direction of the angle is not important since, for example, an
alignment of )15� is presumed to place the same functional
demands on the VOR as an angle of +15�. Consequently angles
were standardized to unsigned values.
Results
None of the Shapiro–Wilk tests showed any significant devi-
ation of angular data from a normal distribution (W ranged
from 0.96 to 0.99, P > 0.05). The randomization of co-ordi-
nates showed that variations of angles ranged on average
by 2.3� for the mouse and by 4.2� for the giraffe. The series
of ANOVA computations showed that the interspecific
variance was significantly greater than the intraspecific
variance for all angles among the 18 species represented by
more than one individual (P < 0.001). These findings indi-
cate that interspecific trends are not significantly distorted
by noise from, for example, landmark error and variations
of spatial resolution.
The correlation matrix given in Table 3 highlights several
statistical relationships among the data collected. The phy-
logenetically adjusted coefficients indicate that some of the
standard correlations, particularly the weaker ones, were
influenced by the phylogeny of the sample. Results reveal
that the strongest corrected associations include those
between orbital convergence and the angles involving the
vertical canals (e.g. ASC < iSR, ASC < cIO, PSC < iSO and
PSC < cIR) as well as between orbit frontation and the lat-
eral canal angles (LSC < iMR and LSC < cLR).
Hypothesis 1 predicts that changes of primary pair orien-
tations correlate with changes of orbit and petrous orienta-
tion. Results for the corrected product moment correlations
Tab
le3
Pear
son’s
pro
duct
mom
ent
corr
elat
ion
mat
rix
for
unco
rrec
ted
and
phyl
ogen
etic
ally
corr
ecte
ddat
a.
log
BM
Ag
ilit
yA
SC<
iSR
ASC
<cI
OPSC
<iS
OPSC
<cI
RLS
C<
iMR
LSC
<cL
RM
SP<
OR
BM
SP<
PB
PFR
O<
CR
B
log
BM
)0.3
9)
0.0
20.1
40.1
50.3
80.1
3)
0.0
2)
0.1
5)
0.0
10.4
7
un
corr
ect
ed
corr
ela
tio
ns
Ag
ilit
y)
0.4
7)
0.2
6)
0.3
0)
0.2
9)
0.2
4)
0.2
5)
0.0
60.3
1)
0.3
7)
0.2
2
ASC
<iS
R)
0.0
9)
0.2
10.6
70.4
90.5
50.1
20.3
4)
0.8
70.4
70.1
6
ASC
<cI
O)
0.0
2)
0.0
60.3
50.5
00.6
50.1
00.2
6)
0.8
30.4
00.2
4
PSC
<iS
O0.1
9)
0.2
10.2
30.1
90.2
10.3
90.3
6)
0.5
80.2
00.3
6
PSC
<cI
R0.2
0)
0.1
60.2
30.5
1)
0.1
5)
0.1
00.0
6)
0.7
00.4
00.2
5
LSC
<iM
R0.1
4)
0.0
4)
0.1
0.0
90.4
7)
0.1
10.6
5)
0.1
50.0
10.5
2
LSC
<cL
R)
0.0
40.0
90.0
80.1
70.2
6)
0.1
40.6
1)
0.3
10.2
00.5
6
MSP
<O
RB
)0.1
00.3
3)
0.7
1)
0.5
4)
0.4
7)
0.4
7)
0.0
8)
0.0
6)
0.5
6)
0.3
0
MSP
<PB
P0.0
3)
0.4
00.1
3)
0.2
)0.0
20.0
2)
0.2
4)
0.1
9)
0.1
50.1
8
FRO
<C
RB
0.3
9)
0.0
6)
0.1
1)
0.0
80.3
70.2
40.5
40.4
50.0
10.0
1
Ph
ylo
gen
eti
call
yad
just
ed
corr
ela
tio
ns
To
pri
gh
t–
pro
du
ctm
om
en
tco
rrela
tio
nco
effi
cien
tsfo
rst
an
dard
,u
nco
rrect
ed
data
;b
ott
om
left
–p
rod
uct
mo
men
tco
rrela
tio
nco
effi
cien
tsfo
rp
hyl
og
en
eti
cin
dep
en
den
tco
ntr
ast
s;
sig
nifi
can
tco
rrela
tio
ns
(P<
0.0
5)
are
hig
hli
gh
ted
inb
old
.
ªª 2010 The AuthorsJournal compilation ªª 2010 Anatomical Society of Great Britain and Ireland
Geometry of the mammalian vestibulo-ocular reflex, N. Jeffery and P. G. Cox502

are presented in the last three rows of Table 3. Significant
corrected relationships were observed between orbital fron-
tation and the lateral canal–muscle angles (LSC < iMR and
LSC < cLR) and, to a lesser extent, in relation to the poster-
ior canal ipsilateral superior oblique angle (PSC < iSO). In
addition, orbital convergence was significantly correlated
with the vertical canal–muscle angles (ASC < iSR, ASC < cIO,
PSC < iSO, and PSC < cIR). None of the adjusted compari-
sons involving petrous orientation was significant.
Figures 3 and 4 show plots of the vertical canal–muscle
angles against orbital convergence. Regression lines are
shown for illustrative purposes only. In all four plots there is
a similar trend: the canal–muscle angles are divergent in lat-
eral-eyed species, the canal–muscle angles are close to par-
allel alignment among species like Cyclopes didactylus, and
then the canal–muscle angles diverge in the opposite direc-
tion in frontal-eyed species (e.g. modern humans). A similar
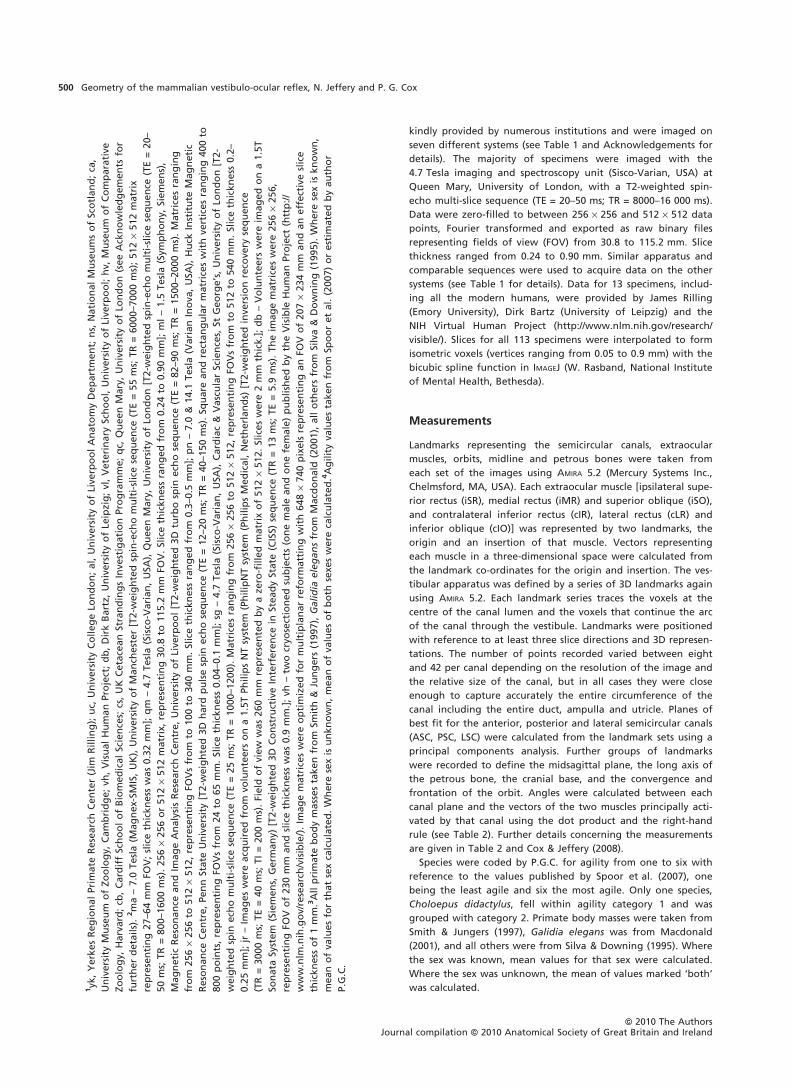
trend was observed in plots of lateral canal angles against
orbital frontation (Fig. 5). These reveal that, as the orbits tilt
forward, the lateral canal–muscle angles initially converge
to parallel alignment and then diverge again as the orbits
continue to frontate. These findings support the hypothesis
that interspecific variations in the spatial relationships of
the VOR are associated with differences of orbit morphol-
ogy but not petrous orientation.
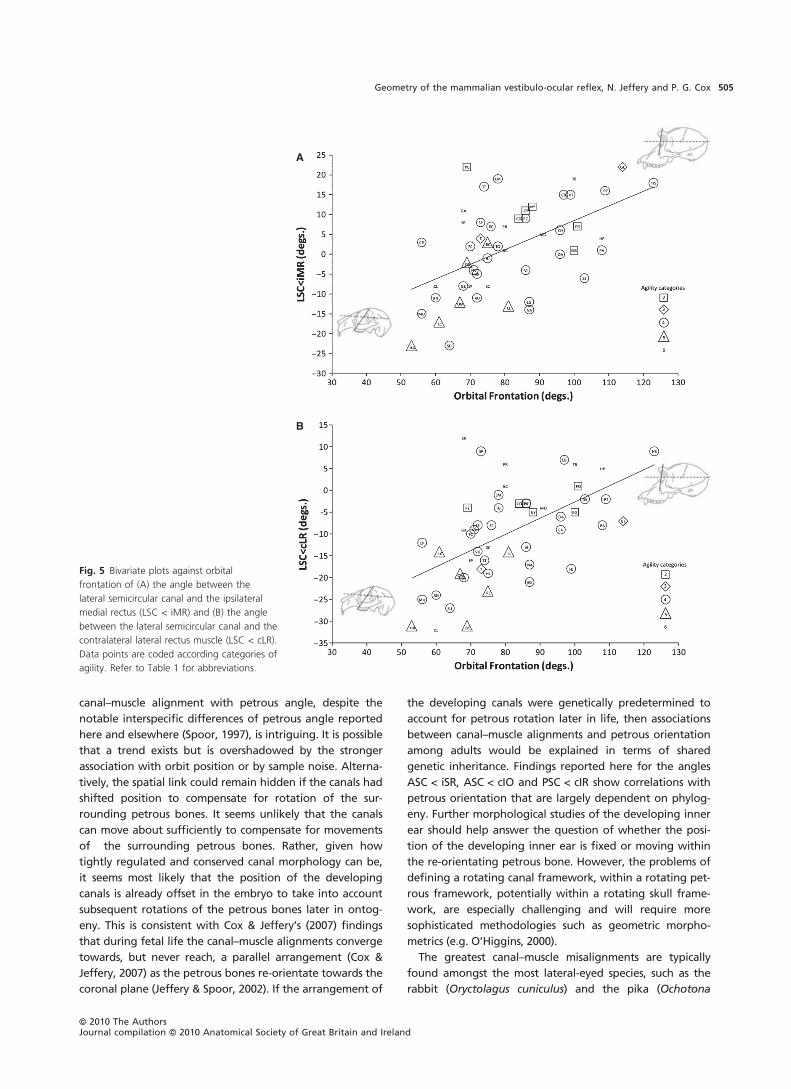
Hypothesis 2 predicts that each category of agility can be
distinguished in terms of primary pair orientations. A simple
pair-wise Student’s t-test was used to determine whether
any of the unsigned angles differ significantly between the
different categories of agility. Results given in Table 4 show
that nine t-tests revealed significant differences between
categories of agility on the basis of canal–muscle angles.
However, only in two cases did the more agile species
have significantly closer alignments than the less agile
species (ASC < cIO, 2 vs. 4 and 2 vs. 6). Taking a more
stringent, Bonferroni-adjusted view of significance levels
A
B
Fig. 3 Bivariate plots against orbital
convergence of (A) the angle between the
anterior semicircular canal and the ipsilateral
superior rectus (ASC < iSR) and (B) the angle
between the anterior semicircular canal and
the contralateral inferior oblique muscle
(ASC < cIO). Data points are coded according
categories of agility. Refer to Table 1 for
abbreviations.
ªª 2010 The AuthorsJournal compilation ªª 2010 Anatomical Society of Great Britain and Ireland
Geometry of the mammalian vestibulo-ocular reflex, N. Jeffery and P. G. Cox 503

(i.e. P < 0.005 rather than < 0.05 as the threshold) leaves
only two significant comparisons involving canal–muscle
angles (ASC < cIO 2 vs. 4 and LSC < cLR 2 vs. 5). Predictions
were also tested with a multiple analysis of covariance
(MANCOVA) with agility set as the independent variable and
primary pair angles as the dependent variables. Table 3 sug-
gests that agility and primary pair angles can also covary
with orbit convergence. Hence, orbit convergence was
included in the MANCOVA as a covariate. Results given in
Table 5 show that there is only a weakly significant
(P = 0.028) differentiation among categories of agility in
terms of the angle LSC < cLR.
Discussion
This paper set out to resolve several enduring questions
regarding the spatial relationships of the semicircular
canals and extraocular muscles that constitute the major
anatomical components of the vestibulo-ocular reflex. Over
100 specimens, representing 51 extant mammalian species
from 15 eutherian orders, were investigated. Findings from
the randomization tests and ANOVAs indicate that noise due
to, for example, differences of image resolution has only a
minimal influence on our findings. Nevertheless, it is impor-
tant to keep in mind that by their very nature, these data
will contain noise that may possibly lead to false-negative
results. We have tried to limit this by carefully formulating
the hypothesis and by approaching the analysis with several
methods (e.g. bivariate, multivariate and phylogenetic inde-
pendent contrasts).
Our results clearly support the view that most of the spa-
tial variation in the VOR system corresponds to shifts in the
position of the extraocular muscles with the surrounding
orbits by way of convergence and frontation but not with
changes of canal position due to petrous re-orientation (see
Cox & Jeffery, 2008). The lack of any significant link of
A
B
Fig. 4 Bivariate plots against orbital
convergence of (A) the angle between the
posterior semicircular canal and the
contralateral inferior rectus (PSC < cIR) and
(B) the angle between the posterior
semicircular canal and the ipsilateral superior
oblique muscle (PSC < iSO). Data points are
coded according categories of agility. Refer to
Table 1 for abbreviations.
ªª 2010 The AuthorsJournal compilation ªª 2010 Anatomical Society of Great Britain and Ireland
Geometry of the mammalian vestibulo-ocular reflex, N. Jeffery and P. G. Cox504
canal–muscle alignment with petrous angle, despite the
notable interspecific differences of petrous angle reported
here and elsewhere (Spoor, 1997), is intriguing. It is possible
that a trend exists but is overshadowed by the stronger
association with orbit position or by sample noise. Alterna-
tively, the spatial link could remain hidden if the canals had
shifted position to compensate for rotation of the sur-
rounding petrous bones. It seems unlikely that the canals
can move about sufficiently to compensate for movements
of the surrounding petrous bones. Rather, given how
tightly regulated and conserved canal morphology can be,
it seems most likely that the position of the developing
canals is already offset in the embryo to take into account
subsequent rotations of the petrous bones later in ontog-
eny. This is consistent with Cox & Jeffery’s (2007) findings
that during fetal life the canal–muscle alignments converge
towards, but never reach, a parallel arrangement (Cox &
Jeffery, 2007) as the petrous bones re-orientate towards the
coronal plane (Jeffery & Spoor, 2002). If the arrangement of
the developing canals were genetically predetermined to
account for petrous rotation later in life, then associations
between canal–muscle alignments and petrous orientation
among adults would be explained in terms of shared
genetic inheritance. Findings reported here for the angles
ASC < iSR, ASC < cIO and PSC < cIR show correlations with
petrous orientation that are largely dependent on phylog-
eny. Further morphological studies of the developing inner
ear should help answer the question of whether the posi-
tion of the developing inner ear is fixed or moving within
the re-orientating petrous bone. However, the problems of
defining a rotating canal framework, within a rotating pet-
rous framework, potentially within a rotating skull frame-
work, are especially challenging and will require more
sophisticated methodologies such as geometric morpho-
metrics (e.g. O’Higgins, 2000).
The greatest canal–muscle misalignments are typically
found amongst the most lateral-eyed species, such as the
rabbit (Oryctolagus cuniculus) and the pika (Ochotona
A
B
Fig. 5 Bivariate plots against orbital
frontation of (A) the angle between the
lateral semicircular canal and the ipsilateral
medial rectus (LSC < iMR) and (B) the angle
between the lateral semicircular canal and the
contralateral lateral rectus muscle (LSC < cLR).
Data points are coded according categories of
agility. Refer to Table 1 for abbreviations.
ªª 2010 The AuthorsJournal compilation ªª 2010 Anatomical Society of Great Britain and Ireland
Geometry of the mammalian vestibulo-ocular reflex, N. Jeffery and P. G. Cox 505
macrotis), and amongst the most frontal-eyed species such
as modern humans and the grey seal (Halichoerus grypus).
In general the closest alignments between canals and mus-
cle planes are found among species with intermediate
forms of orbit orientation (approximately 40–60� relative
to the midline and 70–90� relative to the anterior cranial
base). Such species include the West European hedgehog
(Erinaceus europaeus) and the silky anteater (Cyclopes
didactylus). The intermediate position of the orbit is
similar to the primitive condition seen in, for example,
Zalambdalestes, a Late Cretaceous fossil from Mongolia
that is generally considered to be a stem eutherian
Table 4 Means and pair-wise t-test P-values representing differences between unsigned means within each agility category (two-tailed, equal
variance).
Log BM ASC<iSR ASC<cIO PSC<iSO PSC<cIR LSC<iMR LSC<cLR MSP<ORB MSP<PBP FRO<CRB
Means
2 (n = 6) 3.6 12.0 26.5 16.5 10.8 10.3 3.5 30.5 55.8 88.0
3 (n = 2) 4.7 12.0 10.0 15.5 9.0 13.0 12.5 47.5 42.5 93.5
4 (n = 27) 3.9 12.0 12.3 9.6 9.5 9.3 11.9 45.0 40.7 82.2
5 (n = 6) 3.2 14.7 14.5 19.5 18.5 11.7 22.0 54.5 41.3 67.7
6 (n = 10) 2.4 9.7 13.2 11.8 14.9 7.9 10.4 45.8 35.1 80.0
t-Test
2 vs. 3 0.319 1.000 0.104 0.932 0.824 0.703 0.019 0.105 0.273 0.688
2 vs. 4 0.595 0.992 0.001 0.056 0.680 0.735 0.010 0.012 0.024 0.440
2 vs. 5 0.548 0.615 0.079 0.657 0.169 0.765 0.000 0.015 0.046 0.009
2 vs. 6 0.010 0.366 0.010 0.414 0.506 0.417 0.083 0.017 0.001 0.293
3 vs. 4 0.360 0.995 0.677 0.315 0.915 0.465 0.911 0.782 0.874 0.392
3 vs. 5 0.251 0.785 0.590 0.732 0.221 0.862 0.184 0.619 0.919 0.078
3 vs. 6 0.009 0.608 0.570 0.701 0.548 0.303 0.763 0.847 0.406 0.335
4 vs. 5 0.203 0.497 0.555 0.008 0.006 0.447 0.005 0.119 0.926 0.055
4 vs. 6 0.000 0.411 0.755 0.449 0.092 0.525 0.610 0.857 0.264 0.721
5 vs. 6 0.110 0.218 0.765 0.187 0.542 0.257 0.019 0.233 0.237 0.102
P-values less than 0.05 are shown in bold.
Table 5 MANCOVA of the five agility categories
whilst controlling for differences due to
orbit convergence.Source
Dependent
variable
Type III sum
of squares df
Mean
square F Significance
Corrected Model ASC<iSR 491.54 5 98.31 1.81 0.12998
ASC<cIO 1911.65 5 382.33 7.63 0.00003
PSC<iSO 684.89 5 136.98 1.57 0.18719
PSC<cIR 613.96 5 122.79 1.69 0.15647
LSC<iMR 105.32 5 21.06 0.48 0.79038
LSC<cLR 1162.56 5 232.51 4.35 0.00257
Intercept ASC<iSR 7.41 1 7.41 0.14 0.71361
ASC<cIO 2991.92 1 2991.92 59.69 0.00000
PSC<iSO 1018.37 1 1018.37 11.69 0.00134
PSC<cIR 959.87 1 959.87 13.21 0.00071
LSC<iMR 527.72 1 527.72 11.97 0.00119
LSC<cLR 139.61 1 139.61 2.61 0.11288
Convergence
(MSP<ORB)
ASC<iSR 397.19 1 397.19 7.32 0.00962
ASC<cIO 864.92 1 864.92 17.25 0.00014
PSC<iSO 42.03 1 42.03 0.48 0.49088
PSC<cIR 86.75 1 86.75 1.19 0.28031
LSC<iMR 22.53 1 22.53 0.51 0.47803
LSC<cLR 104.22 1 104.22 1.95 0.16925
Agility ASC<iSR 123.72 4 30.93 0.57 0.68594
ASC<cIO 492.84 4 123.21 2.46 0.05902
PSC<iSO 657.83 4 164.46 1.89 0.12903
PSC<cIR 603.16 4 150.79 2.08 0.09980
LSC<iMR 92.11 4 23.03 0.52 0.71922
LSC<cLR 642.29 4 160.57 3.01 0.02783
ªª 2010 The AuthorsJournal compilation ªª 2010 Anatomical Society of Great Britain and Ireland
Geometry of the mammalian vestibulo-ocular reflex, N. Jeffery and P. G. Cox506

(Novacek et al. 1997; Wible et al. 2004). Analysis of the
reconstruction of Zalambdalestes lechei given in Wible
et al. (2004, p.89) indicates an orbital convergence of
between 35� and 45�. It could be speculated therefore
that the extreme forms of orbital convergence and diver-
gence are derived features from an underlying, and per-
haps biophysically optimal, condition in which the canal
and muscle planes are closer to parallel.
Differences of canal–muscle planes between a lateral-
and a frontal-eyed species (rabbit and cat) were previously
reported by Simpson & Graf (1981) and later by Ezure &
Graf (1984b). Their results are not directly comparable
because the authors reflected planes onto the ipsilateral
side and in the latter paper the authors consolidated func-
tionally distinct muscle vectors into three muscle planes (iIR-
iSR, iSO-iIO, and iMR-iLR). Nonetheless, their findings
showed that alignments are similar between the cat and
rabbit, with the possible exception of the angles PSC < iSO
and PSC < iIR. These two angles showed species differences
of approximately 20� and the closest alignment was seen in
the rabbit. Simpson & Graf (1981) also reiterate previous
observations that pitching the head back and forth can lead
to vertical compensatory eye movements in frontal-eyed
species but torsional movements in lateral-eyed species.
From this, and from their own observations that the pri-
mary pair geometries are roughly similar in the cat and the
rabbit, the authors infer that differences of compensatory
movements must be due to differences in the secondary
actions of the extraocular muscles and related neuronal
connections (see also Ezure & Graf, 1984b). Our results, rep-
resenting samples of eight or more individuals per species,
do not completely concur with these interpretations, show-
ing, for instance, that the angle ASC < iSR is much closer to
parallel alignment in the cat (13�) than in the rabbit ()24�).We also show that all of the remaining canal–muscle angles
differ between cats and rabbits, with the possible exception
of LSC < iMR. Indeed, our findings reveal a possible reversal
in the relative positions and primary actions of the extraoc-
ular muscles with respect to the anterior canal in frontal- vs.
lateral-eyed species. In, for example, the cat, grey seal,
modern human and other great apes, the plane of the
anterior canal is more closely aligned with the superior rec-
tus than with the inferior oblique. By contrast, in, for exam-
ple, the rabbit, the elephant shrew (Rhynchocyon cirnei)
and the sheep (Ovis aries), the plane of the anterior canal is
closer to that of the inferior oblique than the superior rec-
tus. This could explain, in terms of primary muscle actions,
the differences in the compensatory movements of the eyes
seen between lateral- and frontal-eyed species (Simpson &
Graf, 1981).
We have shown that there are no tangible differences of
agility in species with divergent or with close to parallel
vertical canal–muscle pairs. Findings do suggest that differ-
ences of agility are only weakly associated with differences
in the spatial arrangement of the lateral canal and the
contralateral lateral rectus muscle. The pair-wise t-tests indi-
cate that this distinction occurs primarily between agility
categories 2v5 and 4v5. However, contrary to hypothesis 2,
the closest alignments were found in the least agile species.
The observed discrimination probably reflects several nested
trends representing phylogeny, differences due to orbit ori-
entation and perhaps also differences in the function of the
canals. For example, Fitzpatrick et al. (2006) suggests that
the lateral canal commands navigation, whereas the ante-
rior and posterior canals command reflex adjustments in
response to movement. Such functional differences could
explain why we find the only distinction among agility cate-
gories with the lateral canal alignment LSC < cLR and why
Spoor et al. (2007) have found that the strongest compara-
tive link of agility is in relation to the size of the lateral
canal.
The observed differentiation between categories of agil-
ity in terms of orbit and petrous orientation is worth dis-
cussing briefly (refer to Tables 3 and 4). Findings from our
sample indicate that the least agile species are more likely
to exhibit cranial morphologies at either end of the range
compared with the most agile species, which typically span
the middle range of observed skull morphologies. Given
the results reported above, it seems unlikely that these
skull–agility associations are simply the spatial by-products
of VOR function. Rather, as the orbits form an integral part
of the face and are carried forward in the direction of
movement, it seems likely that the observed distinction of
agility in terms of orbit orientation reflects a stronger,
underlying link with how the head is held during locomo-
tion. Similarly, the petrous bones occupy a region of the
skull that defines head orientation in relation to the axial
skeleton. These findings imply that the link between head
orientation during movement and the geometry of the
semicircular canals is of far greater importance than the
spatial arrangement of the VOR system.
Our results support the view that VOR circuitry has the
capacity, whether that be inherent or learned, to respond
to the range of functional challenges found among extant
mammals and that the spatial arrangement of the extraocu-
lar muscles relative to the semicircular canals is of limited
functional significance. Findings indicate that the canal
morphology is arranged primarily for perceiving canal–head
movements and then secondarily, if at all, for yielding accu-
rately encoded spatial signals for compensatory movements
of the eyes (see also Spoor et al. 2007; Yang & Hullar, 2007).
The next step is to elaborate further the spatial relation-
ships of the canals with respect to the rest of the skull and
how these relationships correspond to functional differ-
ences.
Acknowledgements
First of all we would like to thank the Biotechnology and Bio-
logical Sciences Research Council for funding this work (grant
ªª 2010 The AuthorsJournal compilation ªª 2010 Anatomical Society of Great Britain and Ireland
Geometry of the mammalian vestibulo-ocular reflex, N. Jeffery and P. G. Cox 507

no. BBD0000681). For allowing access to specimens we would
like to thank the following: Liz Chadwick (Cardiff University);
Rob Asher, Adrian Friday, Ray Symonds and Matt Lowe
(University Museum of Zoology, Cambridge); Chris Faulkes and
Haidee Price-Thomas (Queen Mary, University of London); Fay
Penrose (University of Liverpool Veterinary School); Fred Spoor
(University College London); Andrew Kitchener, Jerry Herman
and Phil Howard (National Museums of Scotland); Judith Chupa-
sko (Museum of Comparative Zoology, Harvard University); Bob
Connolly (University of Liverpool); Rod Penrose (UK Cetacean
Strandings Investigation Programme). We also thank Dirk Bartz
(University of Leipzig) and Jim Rilling (Emory University) for pro-
viding additional MR datasets of modern humans and apes. For
assistance with the imaging we would like to thank: Bill Bimson
and Valerie Adams (Magnetic Resonance and Image Analysis
Research Centre, University of Liverpool); Karen Davies and
Steve Williams (Imaging Science and Biomedical Engineering,
University of Manchester); Alasdair Preston [Queen Mary, Uni-
versity of London, and lately Preclinical Imaging Unit, Institute
of Psychiatry, King’s College London (funded by the British
Heart Foundation)]; Franklyn Howe (Cardiac and Vascular Sci-
ences, St George’s, University of London); Andrew Webb and
Thomas Neuberger (Huck Institute Magnetic Resonance Centre,
Penn State University). Finally, we thank two anonymous refer-
ees and the editor, Professor Dan Lieberman, for helpful com-
ments and suggestions for improvements to this paper.
References
Bininda-Emonds ORP, Cardillo M, Jones KE (2007) The delayed
rise of present-day mammals. Nature 446, 507–512.
Brettler SC, Baker JF (2001) Directional sensitivity of anterior,
posterior, and horizontal canal vestibulo-ocular neurons in
the cat. Exp Brain Res 140, 432–442.
Cox PG, Jeffery N (2007) Morphology of the mammalian
vestibulo-ocular reflex: the spatial arrangement of the human
fetal semicircular canals and extraocular muscles. J Morphol
268, 878–890.
Cox PG, Jeffery N (2008) Geometry of the semicircular canals
and extraocular muscles in rodents, lagomorphs, felids and
modern humans. J Anat 213, 583–596.
Daunicht WJ, Pellionisz AJ (1987) Spatial arrangement of the
vestibular and the oculomotor system in the rat. Brain Res
435, 48–56.
Ezure K, Graf W (1984a) A quantitative analysis of the spatial
organization of the vestibulo-ocular reflexes in lateral- and
frontal-eyed animals – I. Orientation of semicircular canals
and extraocular muscles. Neuroscience, 12, 85–93.
Ezure K, Graf W (1984b) A quantitative analysis of the spatial
organization of the vestibulo-ocular reflexes in lateral- and
frontal-eyed animals ) II. Neuronal networks underlying
vestibulo-oculomotor coordination. Neuroscience, 12, 95–109.
Fitzpatrick RC, Butler JE, Day BL (2006) Resolving head rotation
for human bipedalism. Curr Biol 16, 1509–1514.
Fritzsch B (1998) Evolution of the vestibulo-ocular system.
Otolaryngol Head Neck Surg 119, 182–192.
Garland T Jr, Ives AR (2000) Using the past to predict the
present: confidence intervals for regression equations in
phylogenetic comparative methods. Am Nat 155, 346–364.
Garland T Jr, Bennett AF, Rezende EL (2005) Phylogenetic
approaches in comparative physiology. J Exp Biol 208, 3015–
3035.
Graf W, Klam F (2006) The vestibular system: functional and
comparative anatomy, evolution and development. Comptes
Rendus Palevol 5, 637–655.
Graf W, Baker J, Peterson BW (1993) Sensorimotor
transformation in the cat’s vestibuloocular reflex system. I.
Neuronal signals coding spatial coordination of compensatory
eye movements. J Neurophysiol 70, 2425–2441.
Hammer Ø, Harper DAT, Ryan PD (2001) PAST: Palaeontological
Statistics software package for education and data analysis.
Palaeontologica Electronica 4, 9.
Heesy CP (2004) On the relationship between orbit orientation
and binocular visual field overlap in mammals. Anat Rec Part
A 281, 1104–1110.
Heesy CP (2008) Ecomorphology of orbit orientation and the
adaptive significance of binocular vision in primates and other
mammals. Brain Behav Evol 71, 54–67.
Jeffery N (2003) Brain expansion and comparative prenatal
ontogeny of the non-hominoid primate cranial base. J Hum
Evol 45, 263–284.
Jeffery N, Spoor F (2002) Brain size and the human cranial base:
a prenatal perspective. Am J Phys Anthropol 118, 324–340.
Jeffery N, Spoor F (2004) Prenatal growth and development of
the modern human labyrinth. J Anat 204, 71–92.
Jeffery N, Davies K, Kockenberger W, et al. (2007) Craniofacial
growth in fetal Tarsius bancanus: brains, eyes and nasal septa.
J Anat 210, 703–722.
Macdonald DW (2001) The New Encyclopedia of Mammals.
Oxford: Oxford University Press.
Maddison WP, Maddison DR (2008) Mesquite: a modular system
for evolutionary analysis. Version 2.6: http://mesquiteproject.
org.
Midford PE, Garland TJ, Maddison DR (2003) PDAP package for
Mesquite.
Noble VE, Kowalski EM, Ravosa MJ (2000) Orbit orientation and
the function of the mammalian postorbital bar. J Zool 250,
405–418.
Novacek MJ, Rougier GW, Wible JR, et al. (1997) Epipubic bones
in eutherian mammals from the late Cretaceous of Mongolia.
Nature 389, 483–486.
O’Higgins P (2000) The study of morphological variation in the
hominid fossil record: biology, landmarks and geometry.
J Anat 197, 103–120.
Pantle C, Dieringer N (1998) Spatial transformation of
semicircular canal signals into abducens motor signals. A
comparison between grass frogs and water frogs. J Comp
Physiol 182, 475–487.
Rabbitt RD (1999) Directional coding of three-dimensional
movements by the vestibular semicircular canals. [erratum
appears in Biol Cybern 2000 Apr;82(4):355]. Biol Cybern 80,
417–431.
Raphan T, Cohen B (2002) The vestibulo-ocular reflex in three
dimensions. Exp Brain Res 145, 1–27.
Silva M, Downing JA (1995) CRC Handbook of Mammalian Body
Masses. New York: CRC.
Simpson JI, Graf W (1981) Eye-muscle geometry and
compensatory eye movements in lateral-eyed and frontal-eyed
animals. Ann N Y Acad Sci, 374, 20–30.
Smith RJ, Jungers WL (1997) Body mass in comparative
primatology. J Hum Evol 32, 523–559.
Spoor F (1997) Basicranial architecture and relative brain size of
Sts 5. (Australopithecus africanus) and other Plio-Pleistocene
hominids. S Afr J Sci 93, 182–187.
ªª 2010 The AuthorsJournal compilation ªª 2010 Anatomical Society of Great Britain and Ireland
Geometry of the mammalian vestibulo-ocular reflex, N. Jeffery and P. G. Cox508
Spoor F, Zonneveld F (1998) Comparative review of the human
bony labyrinth. Yearb Phys Anthropol, 41, 211–251.
Spoor F, Garland T, Krovitz G, et al. (2007) The primate
semicircular canal system and locomotion. Proc Natl Acad Sci
U S A 104, 10808–10812.
Szentagothai J (1950) The elementary vestibulo-ocular reflex
arc. J Neurophysiol 13, 395–407.
Wible JR, Novacek MJ, Rougier GW (2004) New data on the
skull and dentition in the Mongolian Late Cretaceous
eutherian mammal Zalambdalestes. Bull Am Mus Nat Hist 281,
1–144.
Wilson DE, Reeder DM (2005) Mammal Species of the World.
Baltimore: Johns Hopkins Press.
Yang A, Hullar TE (2007) Relationship of semicircular canal size
to vestibular-nerve afferent sensitivity in mammals.
J Neurophysiol 98, 3197–3205.
ªª 2010 The AuthorsJournal compilation ªª 2010 Anatomical Society of Great Britain and Ireland
Geometry of the mammalian vestibulo-ocular reflex, N. Jeffery and P. G. Cox 509