Jorgen Peddersen, Sri Parameswaran Schoolof …sridevan/index_files/04196148.pdf · Jorgen...
6
9A-5 CLIPPER: Counter-based Low Impact Processor Power Estimation at Run-time Jorgen Peddersen, Sri Parameswaran School of Computer Science and Engineering, The University of New South Wales National ICT Australia, The University of New South Wales* Sydney, NSW 2052, Australia [email protected],[email protected] ABSTRACT Numerous dynamic power management techniques have been pro- posed which utilize the knowledge of processor power/energy con- sumption at run-time. So far, no efficient method to provide run-time power/energy data has been presented. Current measurement systems draw too much power to be used in small embedded designs and ex- isting performance counters can not provide sufficient information for run-time optimization. This paper presents a novel methodology to solve the problem of run-time power optimization by designing a pro- cessor that estimates its own power/energy consumption. Estimation is performed by the addition of small counters that tally events which consume power. This methodology has been applied to an existing processor resulting in an average power error of 2% and energy esti- mation error of 1.5%. The system adds little impact to the design, with only a 4.9% increase in chip area and a 3% increase in average power consumption. A case study of an application that utilizes the proces- sor showcases the benefits the methodology enables in dynamic power optimization. 1. INTRODUCTION Power and energy consumption are becoming the most dominant bottlenecks constraining today's embedded systems. Reducing energy consumption, benefits the system by performing longer on limited bat- tery supplies, reducing product weight by eliminating the need for heat sinks, and increasing reliability by dissipating less energy and running cooler. Batteries have a very limited amount of energy they can sup- ply, and when power peaks over certain levels, the capacity of the bat- tery drops more rapidly than usual[l]. Recently, many methods have been designed to manage these power problems at all levels of design. These methods can be broadly split into static and dynamic methods. For clarification, we use these terms to mean managing power stati- cally or dynamically, not managing static power or dynamic power. Static power management involves predicting, simulating or profil- ing applications to record their performance and optimize power/ per- formance trade-offs to cater for the data set. All decisions are made before run-time, so worst case conditions are typically used to guar- antee that constraints are met. Dynamic power management for embedded systems allows tuning of hardware/software parameters to perform trade-offs between power consumption and performance of applications during execution. Dy- namic techniques can make use of operational parameters of the sys- tem at run-time and make decisions that alter the future operation of the system. However, dynamic power management is stymied by the lack of methods to efficiently obtain run-time measurements of power or en- ergy consumption. Several techniques for dynamic power manage- ment have been proposed that require knowledge of how much en- ergy has actually been consumed by the device to make run-time de- cisions[2, 3, 4]. Providing these values in a stand-alone system is difficult as measurement systems for power and energy usage draw too much power themselves, making potential savings useless. *National ICT Australia is funded through the Australian Govern- ment's Backing Australia's Ability initiative, in part through the Aus- tralian Research Council. 90 Totai Energy 2 05mJ Totai Energy =2 56mJ I85 85 E E L,75 'P [ 5 j il L65 60 60 0 5 10 15 20 25 30 35 0 5 10 15 20 25 30 35 Time (ms) Time (ms) (a) Simple Image (b) Complex Image Figure 1: JPEG Power Comparison Data dependent applications, e.g. multimedia, have no concept of the type of data they will be operating on until the data arrives at run-time. The type of data greatly affects the execution paths caus- ing vastly different power and energy consumption. It is impossible to design static power algorithms to manage this class of applications due to this unpredictable behavior. Due to data dependence, dynamic power optimization methods are required to analyze recent operation and make decisions to manage future operation of the system. Other examples of data dependence include RF systems, where transmit and receive power changes for differing situations; and packet based unre- liable communication systems, where selected packets can be dropped if power consumption becomes critical. Motivation The motivation for this work stems from two disparate, yet synergistic observations. The first observation is that there is significant corre- lation between the function a processor is performing and its power consumption. The second is that many applications operate quite dif- ferently depending on their data input. The first observation leads to event based macro modeling[5], which allows us to count events in the system that contribute power to gain an adequate representation of power consumption. Over time, we only need to look at control signals to find these events; due to the ran- domness of data, the data signals tend to only provide random noise in the power trace. When combined with regression based modeling techniques[6], we can generate an accurate model to estimate power consumption of a device from its control signals. The claims of the second observation are demonstrated by Figure 1. This shows the power waveform for two differing images encoded by a JPEG application. The execution time and average power for the two images differ, and energy use varies by 20%. If the data dependent algorithms of the second observation could gain knowledge of their run-time power consumption, they could make trade-offs to optimize quality of service under power constraints. The first observation provides that knowledge via the addition of on-chip estimation of power using macro modeling. This estimation technique opens the door to a new breed of enhanced dynamic power manage- ment techniques for stand-alone systems with power constraints. This work, for the first time, presents a methodology to modify a processor so that it can estimate its own power consumption at run- time by utilizing small counters attached to the control path of the de- sign. We call this methodology CLIPPER, or Counter-based Low Im- pact Processor Power Estimation at Run-time. The counters have little impact upon the power consumption and area of the system. CLIPPER is a generic methodology which can be applied to a wide range of pro- cessors, enabling and enhancing the use of many dynamic power opti- mization techniques. Application adaptation techniques greatly bene- fit from knowledge of energy consumption to handle run-time energy 1-4244-0630-7/07/$20.00 C 2007 IEEE. 890
Transcript of Jorgen Peddersen, Sri Parameswaran Schoolof …sridevan/index_files/04196148.pdf · Jorgen...

9A-5
CLIPPER: Counter-based Low Impact Processor Power Estimation atRun-time
Jorgen Peddersen, Sri ParameswaranSchool of Computer Science and Engineering, The University of New South Wales
National ICT Australia, The University of New South Wales*Sydney, NSW 2052, Australia
[email protected],[email protected]
ABSTRACTNumerous dynamic power management techniques have been pro-posed which utilize the knowledge of processor power/energy con-sumption at run-time. So far, no efficient method to provide run-timepower/energy data has been presented. Current measurement systemsdraw too much power to be used in small embedded designs and ex-isting performance counters can not provide sufficient information forrun-time optimization. This paper presents a novel methodology tosolve the problem of run-time power optimization by designing a pro-cessor that estimates its own power/energy consumption. Estimationis performed by the addition of small counters that tally events whichconsume power. This methodology has been applied to an existingprocessor resulting in an average power error of 2% and energy esti-mation error of 1.5%. The system adds little impact to the design, withonly a 4.9% increase in chip area and a 3% increase in average powerconsumption. A case study of an application that utilizes the proces-sor showcases the benefits the methodology enables in dynamic poweroptimization.
1. INTRODUCTIONPower and energy consumption are becoming the most dominant
bottlenecks constraining today's embedded systems. Reducing energyconsumption, benefits the system by performing longer on limited bat-tery supplies, reducing product weight by eliminating the need for heatsinks, and increasing reliability by dissipating less energy and runningcooler. Batteries have a very limited amount of energy they can sup-ply, and when power peaks over certain levels, the capacity of the bat-tery drops more rapidly than usual[l]. Recently, many methods havebeen designed to manage these power problems at all levels of design.These methods can be broadly split into static and dynamic methods.For clarification, we use these terms to mean managing power stati-cally or dynamically, not managing static power or dynamic power.
Static power management involves predicting, simulating or profil-ing applications to record their performance and optimize power/ per-formance trade-offs to cater for the data set. All decisions are madebefore run-time, so worst case conditions are typically used to guar-antee that constraints are met.Dynamic power management for embedded systems allows tuning
of hardware/software parameters to perform trade-offs between powerconsumption and performance of applications during execution. Dy-namic techniques can make use of operational parameters of the sys-tem at run-time and make decisions that alter the future operation ofthe system.
However, dynamic power management is stymied by the lack ofmethods to efficiently obtain run-time measurements of power or en-ergy consumption. Several techniques for dynamic power manage-ment have been proposed that require knowledge of how much en-ergy has actually been consumed by the device to make run-time de-cisions[2, 3, 4]. Providing these values in a stand-alone system isdifficult as measurement systems for power and energy usage drawtoo much power themselves, making potential savings useless.
*National ICT Australia is funded through the Australian Govern-ment's Backing Australia's Ability initiative, in part through the Aus-tralian Research Council.
90 Totai Energy 2 05mJ Totai Energy =2 56mJ
I85 85
E E
L,75 'P[ 5 j il
L6560 60
0 5 10 15 20 25 30 35 0 5 10 15 20 25 30 35
Time (ms) Time (ms)
(a) Simple Image (b) Complex Image
Figure 1: JPEG Power Comparison
Data dependent applications, e.g. multimedia, have no concept ofthe type of data they will be operating on until the data arrives atrun-time. The type of data greatly affects the execution paths caus-ing vastly different power and energy consumption. It is impossibleto design static power algorithms to manage this class of applicationsdue to this unpredictable behavior. Due to data dependence, dynamicpower optimization methods are required to analyze recent operationand make decisions to manage future operation of the system. Otherexamples of data dependence include RF systems, where transmit andreceive power changes for differing situations; and packet based unre-liable communication systems, where selected packets can be droppedif power consumption becomes critical.MotivationThe motivation for this work stems from two disparate, yet synergisticobservations. The first observation is that there is significant corre-lation between the function a processor is performing and its powerconsumption. The second is that many applications operate quite dif-ferently depending on their data input.The first observation leads to event based macro modeling[5], which
allows us to count events in the system that contribute power to gainan adequate representation of power consumption. Over time, we onlyneed to look at control signals to find these events; due to the ran-domness of data, the data signals tend to only provide random noisein the power trace. When combined with regression based modelingtechniques[6], we can generate an accurate model to estimate powerconsumption of a device from its control signals.The claims of the second observation are demonstrated by Figure 1.
This shows the power waveform for two differing images encoded bya JPEG application. The execution time and average power for thetwo images differ, and energy use varies by 20%.
If the data dependent algorithms of the second observation couldgain knowledge of their run-time power consumption, they could maketrade-offs to optimize quality of service under power constraints. Thefirst observation provides that knowledge via the addition of on-chipestimation of power using macro modeling. This estimation techniqueopens the door to a new breed of enhanced dynamic power manage-ment techniques for stand-alone systems with power constraints.
This work, for the first time, presents a methodology to modify aprocessor so that it can estimate its own power consumption at run-time by utilizing small counters attached to the control path of the de-sign. We call this methodology CLIPPER, or Counter-based Low Im-pact Processor Power Estimation at Run-time. The counters have littleimpact upon the power consumption and area of the system. CLIPPERis a generic methodology which can be applied to a wide range of pro-cessors, enabling and enhancing the use of many dynamic power opti-mization techniques. Application adaptation techniques greatly bene-fit from knowledge of energy consumption to handle run-time energy
1-4244-0630-7/07/$20.00 C 2007 IEEE. 890

9A-5
constraints (see Section 6). Additionally, hardware techniques suchas Dynamic Voltage Scaling (DVS) can use power data to performtime/power trade-offs and manage heat consumption, although theseDVS techniques are outside the scope of this paper.
Limitations ofPerformance CountersMany modern high performance processors already have counters in-cluded in the processor to count system events for statistics relatedpurposes[7, 8]. These counters often overlap with the events neededto model the power effectively at run-time. Although there are manyevents that can be detected and counted by these systems, there is alimitation to the number of simultaneous events that can be countedin a single execution[7]. Run-time power calculation is performedin multiple execution passes with different counters being used eachtime. Hence these processor types cannot be used to provide therun-time feedback of power consumption which motivates this paper.Additionally, performance counters are only included on high perfor-mance processors, so they may not be suitable for smaller embeddedsystems. The methodology described in this paper is applicable toany type or size of processor, and attempts to minimize the additionalhardware required while allowing run-time feedback to the applicationso power optimization decisions can be made.
OrganizationThe rest of the paper is organized as follows. We review others' worksrelated to this topic in Section 2. Section 3 discusses the CLIPPERmethodology while Section 4 demonstrates an application of CLIP-PER to a processor based on the SimpleScalar architecture. Resultsof experiments performed on this processor are given in Section 5. Acase study of an application which CLIPPER enables is provided inSection 6, then Section 7 draws conclusions.
2. RELATED WORKReduction of power/energy consumption of embedded systems has
been a major field of research for the past few decades[9], coveringboth software and hardware approaches. Some of the proposed hard-ware techniques include Dynamic Voltage Scaling[9, 10] and Adap-tive Body Biasing[ll , 12, 13]. Proposed software methods includePower-Aware Task Scheduling[14, 15], Power Macro Modeling[16]and Application Adaptation[2].
Powerscope[17] is a system designed to measure run-time powerconsumption and is used as a tool for power-aware computing. It wasdesigned to be used with the tool Odyssey[2] to allow run-time appli-cation adaptation trade-offs to manage power consumption of a run-time system. However, this measurement procedure is power hungryand is not feasible for stand-alone embedded systems.Many power estimation techniques have been proposed at all lev-
els of design[16, 18, 19]. Macro modeling has emerged as one of therecurring themes of these works, as it provides simplified models foreach of the devices in the system to estimate their power consump-tion. This is typically applied at the RTL, but may also be applied atother levels of design. Macro modeling can also be applied throughinstruction level analysis techniques[20, 21]. These techniques usesoftware simulators to assign power levels to each type of instructionexecuted in the system. Bellosa showed in [5] that event based powermacro modeling is an effective method for producing power modelsfor various components of processors.
Wattch[22] is a tool that macro models the SimpleScalar simula-tor[23]. This system calculates power for a theoretical implementa-tion of the SimpleScalar processor using power models of componentsfrom typical superscalar processors. The tool is useful for analyzingpower and can be used to test dynamic power management models,however it is only a simulation tool and has no underlying hardwaremodel to provide a true self estimation system.
Contreras and Martonosi, in [24], use existing Hardware Perfor-mance Counters (HPCs) in the Intel PXA255 processor to count fiveevents in the system to calculate average power consumption with anerror of 4%. However, the authors point out that the processor canonly count two event types during any single execution, so multiplepasses are needed to achieve the stated accuracy.
In [25], Haid et al. presents JouleDoc (an audio processing sys-tem), the only previous attempt we can find to estimate and feedbackpower/energy usage of a stand-alone embedded system at run-time.JouleDoc is a co-processor which utilizes macro modeling to estimatepower of its single application. JouleDoc uses eight counters to es-
timate energy consumption with an error of 5%. The JouleDoc co-processor adds approximately 12,000 gates to the area of the system.
In contrast to [24] which requires existing performance countersto estimate power, CLIPPER shows how and where to insert coun-ters into any processor system to estimate power accurately with min-imal impact. In addition, our system allows run-time feedback ofpower/energy consumption rather than needing to execute the algo-rithm multiple times. In comparison to [25], our method allows forgeneral systems to be characterized, as no method to apply the Joule-Doc solution to systems apart from the selected application specificsystem is provided. Despite its generality, CLIPPER also exhibitssmaller impact upon the system due to lack of a co-processor and theuse of smaller fixed increment counters.
Thus, the contributions of our paper are as follows:* For the first time, we present a methodology to add dedicated
fixed increment counters to a processor system so that it canestimate its own power/energy consumption at run-time.
* A method is proposed to show how and where counters shouldbe placed to provide desired accuracy with minimal impact.
* We demonstrate via a benchmark application how feedback pro-vided by run-time power estimation can be used to dynamicallyoptimize performance under energy constraints.
3. METHODOLOGYThe CLIPPER methodology makes use of the techniques of system
decomposition theory[26] and regression analysis[27]. This allows usto decompose the system into components that are analyzed separatelyto determine how their power consumption is related to events that oc-cur in the component. The embedded system can hence be modeled bycounting the events that occur and calculating the power. The mech-anisms to find these events, compute the relationship of the events topower and provide run-time feedback of the power consumption toapplications at run-time is detailed in this section.
3.1 TheorySystem decomposition theory originated from the ontological model
of an information system decomposition. The following basic defini-tions and theorems are obtained from [26], though a far more detaileddescription is given in the same paper.
* A system, u, comprises a set of events.* An event, c, is a boolean value representing the present state of
one or more control signals.* An event space, S, is a multi-dimensional hypercube, where
each dimension corresponds to an event and each point is a stateof the system
* A function, f, over a parameter space, S, is a function that cor-responds to a power model of the component.
* A system 6- is a subsystem of u, and of is a supersystem of 6- ifand only if the composition of 6- is a subset of the compositionof v.
* A decomposition of a system of is a set of subsystems D(uf){oi}iEI, such that each event in the system is included in atleast one of the subsystems.
Let D(o-) = {oi}iEI be a decomposition v. The event space S(D) ofthe decomposition is:
S(D) =_ S(D(a)) = (giEIS(,7j)Let ci be an event in an ordered and finite set Si. C is an n tu-
ple of events, C = {Cl, C2, ..., Cn}. Let C1 be an x tuple of events{c1,c2, ...,cx}and C2be an n-x tuple of events {cx+l, cx+2, . .., Cn}such that n tuple C can be expressed as {Cl, C2}. In addition, a func-tion, f (Cl, C2), is independent of C2 if f (Cl, C2) = f (C1) whichcan be completely represented by events in Cl.
There are three requirements to ensure a valid system decomposi-tion: i) the system must have a well-defined structure; ii) the systemmust only be represented by a known set of the events; iii) a changein an event, that belongs to a subsystem, must result in a significantchange on the function of the subsystem. The reasons that systemdecomposition theory is applicable to modeling power of embeddedsystems : i) a system can be split into components that contributepower (e.g. dividers, caches, ALUs); and, ii) we can determine events
891
_ ~ ~~r-------------1RTL Processor RTL Processor CLIPPER
Model with Counters Methodology
Synthesis (t) PoweSynthesis (V) Power
I el alculation (ttt) IGte Level Calculation (VII)1I Model PowerMoe PbO
V\/6vf__Simulation (tI Wefoiirm Simulation (Vt) I vefvirrm II+ Analysis (tIV) + Power MacroSwitching Switching Modeling (VIII)lActivity E Activity
I___________ -_.L d~~Power Tablel IEstimationSystem
Figure 2: CLIPPER Methodology
Figure 3: Event Analysis Flow
in components that affect operation of the component or other com-ponents. These events typically represent the state of operation of thecomponent (e.g. a divider in use, a cache miss, a cache hit etc.) andthe more important events can be used to calculate power consumptionof the system.
Regression analysis is an analysis method that expresses a model as
a function of parameters. Each of the events in the system is modeledas consuming a particular energy amount. For example, a model of a
system, M(uf), is expressed as a linear function of el, e2,..e.,e, whereeach ei is a detected event of the system and can be represented as
follows:M(u7) ='mo + mIeI +m2e2 + +mnen
where ml, ... Tnnare coefficients of the events el, ... Cnand mo is a
base value. The function can take other forms of expression, such as
quadratic or polynomial etc. The coefficients of the parameters, andthe relationship of the model (i.e. linear, quadratic, polynomial etc)can be determined (if such a relationship exists) by commercial tools,when a sample dataset and parameters are given.
3.2 CLIPPERThe CLIPPER methodology is outlined in further detail in Figure 2.
The input is a synthesizable RTL description of a processor. Step I ofCLIPPER synthesizes the processor to produce a gate-level model.
Step II simulates the gate level model of the processor to recordits cycle-by-cycle switching activity. An application that tests many
operating conditions of the processor is used when simulating to de-termine all possible power conditions. This application includes all ofthe instruction set, memory operations, I/O type instructions, differenttypes of loops etc. and also makes good use of different states of thecache or caches utilized by the system.
In Step III, the switching activity is used by a power analysis toolsuch as Synopsys Primepower[28] to determine the power consump-tion of the processor. This power calculation provides a waveform forpower consumption which is used to analyze the processor to deter-mine which events in the system are responsible for most of the powerconsumption so a macro model can be made.
Event AnalysisStep IV of the CLIPPER methodology, expanded in Figure 3, dis-covers events used to create a macro model of the system. We firstutilize the system decomposition theory to split the processor into it'smodules for separate analysis. The power of each of the separate com-ponents can be analyzed to determine the events that contribute to itspower. As the power of the system will be the sum of the power ofthe components, only those components that demonstrate large vari-ation in their power consumption during run-time are required to beanalyzed. Those models with minor variation can effectively be mod-eled with a constant value for power consumption. Module selectionis performed by ranking all modules in the design by their power vari-ation (max. power - min. power) and selecting the modules with thehighest variation.
Changes in the powerconsumption of a system are often detectableby thecontrol signals of the design. Therefore, the values or tran-sitions of one or morecontrol signals can be tested to detect thesechanges. Thecombination of thesecontrol signals iscalled an event,with eachcontrol signal being acondition for that event to occur.
Algorithm 1 is used to find events within modules. This algorithmcreates a set of events, events= {ei,. ..,en}, for each module to char-acterize the system. An event ei is represented as a set of controlsignals{Cl,. .., Ck} which form the conditions of the event. The algo-rithm first discovers events and then simplifies them to reduce com-plexity.
Algorithm1 Find Events Causing Power Consumptionfor all m in selected modules do
//Step 1: Find events for each change in powerOrder power changes of module m into PI ... n
Where PI is largest and Pn is smallest viable sizeLet events= {eie,.,en} with all ei emptyfor all Pi in PI ...Pn do
Let c be a set containing all control signals that switch near time of Pifor all cj in c do
// Test if the control signalsoften contribute powerif c correlates with power waveform thenXdd cj to ei
//Step 2: Remove superfluous control signals from eventsfor all ei in events do
for all cj, Ck in ei doif c occurs whenever ck occurs in the simulation trace then
iemove Ck from eiI/Step 3: Remove duplicate eventsfor all ei, ej in events do
if ei contains same signals as ej thenDelete e
/Output each event that remainsfor all e in events do
print Control signals ofe
Step 1 of the algorithm analyzes each power change in the sys-tem and creates events to attribute to the change. Control signals thatchange at the time of the change in power are correlated with power.Correlation is performed by looking at the power waveform wheneverthe control signal has the same value or transition of value. If poweroften has a similar change or similar level as it does at the current time,it is likely that the control signal contributes to the change and can beadded to the list of control signals defining an event.
Step 2 attempts to simplify many of the events by reducing the num-ber of controlling signals. This is due to groups of signals that switchsimultaneously, e.g. if one signal is the logical NOT of another, or thelogical AND of two others. If there exists a signal that switches atleast whenever a second signal switches, the second signal is superflu-ous and is removed from the event.
Step 3 removes events that are duplicated due to the same changesin the system occurring. Events are then output to be added to thesystem.
Events selected by the algorithm are converted to logic circuits fordetection. Each event is formed by taking the AND of its conditions.Events that occur due to transitions of signals also require additionalflip-flops to detect the change.
After event selection, a linear regression is performed to reduce thenumber of events in the system. Any events found to contribute littleto the power in a regression are removed from the system. This helpsto counter some of the redundancy of the provided algorithm.
Power contributions of external devices are also modeled. These de-vices include off-board memory, additional analog circuitry or user in-terfaces. Off-chip peripheral components are analyzed using the abovemethod to provide additional events into the power estimation system.If power variance is small compared to average power of the system,the component is modeled as maintaining a constant average value forpower consumption.3.2.1 CountersCounters are added to the design to tally occurrences of events.
These counters are fixed increment counters to reduce their impactupon the area and power consumption of the system. Specific triggerevents increment the counters. Additionally, a counter is automati-cally reset by hardware whenever the counter is read, so that powerconsumption will be valid between accesses of the counters.
Counters are interfaced to the processor so that they do not severelyimpact upon power consumption when read. Counters are interfaced
892
9A-5
PowerProcessor WaveformModules
Module Event -_
Seletn Analysis
Selected Event l l hlModules Selection Eet 11

9A-5
DataCache
+1|+1 +1 +1 +1 +1+1 Counters
Multiplexo
Data Cache Bus
Figure 4: Counter Setup Example
via memory mapped I/O in a reserved memory space avoiding the datacache. Figure 4 depicts this method. An address decoding multiplexoris used to interface the counters to the data cache bus. Control signalsare taken from various modules and include combinational logic todecode events.
For the system implementation in this paper we used equal sized32-bit counters. This is the data bus width of the processor whichallows the most amount of time to pass between reads. Despite theirsize, impact of these counters is still small, so we didn't further reducethe width of the counters.
3.2.2 Macro ModelingThe counters are added to the original RTL processor model. The
newly created model, located at the top right of Figure 2, is passedthrough the same synthesis, simulation and power calculation flow asbefore to model the added impact of the counters to the system (StepsV, VI and VII of Figure 2).
Note that as the counters are small compared to the processor, theimpact is not large enough to change the modules or events that werechosen by the earlier steps. The contributions of the events and idlepower will increase due to the addition of the counters, but not by asignificant amount (see Section 5).
Regression analysis is applied to the power calculations to find ac-tual contributions to power of the specific events in Step VIII of Fig-ure 2. Power is linearly related to the events in the system. Each eventis associated with a power calculation which represents the contribu-tion to power consumption each time the event occurs. i.e. for everyevent ei, there is an average additional power pi which is caused bythe event. In addition, a base power po is provided by the regression torepresent static power consumption and average power consumptionof non-modeled components. These results are tabulated into an arrayof power values that will be utilized by the software loop to calculatethe estimated run-time energy and power consumption.3.2.3 SoftwareA software loop calculates total energy between counter readings
by employing the following equation:CC X Pbase + Ein ei X PiEtot-= i=
fwhere n is the number of events, f is the current clock frequency ofthe processor, CC is the number of clock cycles from the last energyreading, Pbase is the base power used every cycle (due to static leakagepower and average dynamic power of unselected modules), ei is thecounter value for event i and pi is the power contribution of that event.
Average power for the period between reading of the counters isfound by:
p _Etot x fn+ i x PiPave - Cc Pbase + Cc
This calculation is performed at recurring locations in an algorithm'stask flow. For example, after each frame of a video application or af-ter each line of processing in an image encoding application. Thisminimizes software impact.Where the system has multiple states, such as if DVS were applied,
a multi-dimensional version of the power array (one row per state) canbe used. Analysis of this is outside of the scope of this paper.
4. EXPERIMENTAL SETUPWe tested the CLIPPER methodology by applying it to a publicly
available processor described in [29]. This processor is defined inRTL VHDL and implements all integer instructions of the Simple-Scalar[23] PISA instruction set as an in-order, six-stage pipeline pro-cessor. Synopsys Design Compiler[28] was used to synthesize theprocessor in Steps I and V of Figure 2. Synthesis was performed with
Table 1: Metrics With and Without CountersOriginal Modified % Increase
Gate Area (NANDs) 127994 134238 4.9%Total Power (mW) 77.19 79.48 3.0%
the 180nm TOWER library available from Synopsys with a clock fre-quency of 125MHz.
ModelSim[30] was used in Steps II and VI to perform gate levelsimulation of the synthesized processor. The processor was connectedto simulated memories and an application was executed so that in-ternal signal changes are stored in a Value Change Dump (VCD) file.Periodic readings of power counters were also taken during ModelSimsimulation to allow us to determine estimation accuracy.To perform Steps III and VII, the VCD produced by ModelSim was
analyzed by Synopsys Primepower[28] to model power. By analyz-ing the design and switching activity from the VCD, Primepower pro-duces an accurate prediction of how much power the synthesized chipwould actually consume per clock cycle.The module selection stage resulted in five components being cho-
sen for power consumption. The chosen modules were the divider,multiplier, register file, instruction cache and data cache. Event anal-ysis found nine events in the system that were used to model theselected modules. These events included cache memory being reador written and the divider or multiplier being utilized. An additionalevent was added to measure time.The CLIPPER methodology allows the addition of events to model
off-chip circuitry such as external memory. We have a DRAM powermodel derived from data sheets that can be modeled exactly by addingtwo events to the design. However, we have no other tools to moreaccurately estimate or measure power consumption of external mem-ory chips. Therefore, we chose to ignore memory power contributionsin our accuracy analysis as the actual model is equivalent to the esti-mation model, providing no benefit to proving the validity of the ap-proach. Incidentally, the average power of the DRAMs is about equalto the average power of the processor.
Control of most counters was determined by an existing control sig-nal, while other events required nominal logic gates or flip-flops to beadded to test multiple signals. The counters were interfaced by mem-ory mapped I/O, bypassing data cache as shown in Figure 4.
5. RESULTSThis section lists some of the tests that were performed to discover
the impact upon the experimental system and test the accuracy of theprediction mechanism.Power contributions for each of the selected events were calculated
using Step VIII of the CLIPPER flow (see Figure 2). The dividercaused the greatest impact upon power, doubling the power consump-tion of the chip for three cycles each time it was used. The divider,multiplier and instruction cache each needed only one event to accu-rately model their power contribution. The register file contributedto power when there was a register write or the registers selected forreading were changed between instructions. The data cache providesthe remaining four events (miss, write-back, read hit and write hit).ImpactTable 1 compares the area and power metrics of the original processorand the processor with added power counters. The first column namesthe metric. The second column gives values for the original processor,while the third gives the values for the modified processor with ad-ditional counters. The final column shows percentage increase of themetrics. Area values include interconnect area and were calculatedafter synthesis of the processor with Synopsys Design Compiler and/* energy arr contains the energy contributions* of each of the counters. POW NUM is the* number of counters including time count
unsigned int energy_arr[POW NUM] {19, 31,10,...};
int calc_energy(void) Iunsigned int i, energy = 0;for (i = O; i < POW NUM; i++)
/* Counters are mapped to the memory in int* sizes from address 0 to POW NUM-1
energy += energy_arr[i] * ( *((int *)(i * 4))}return energy;
Figure 6: Sample Energy Calculation Loop
893
*
*
*
*
*/) i

90-Measured-Estimated 85
l6525 30~~~~~~~~~~3
0 5 10 15 20Time(ms)
(a) cjpeg
25 30
eaa su edriEstimated
90
85
§~80-E
70-
bU 6 0e
0 5 10 15 20 25 30 0
Time (is)
(b) qsort
Figure 5: Measured vs. Estimated Power
l~~~~~~~~~~-MeasuredI-Esti m a~~~~~~- stmted
r-I1 I1l-Iq
10 15 20
Time (is)
(c) tiff2rgba
Table 2: Power and Energy ErrorsBench- Cycles Power Error Energy (mJ) Energymark (mils.) Avg Max Measured Estimated Errorg721e 2.9 0.77% 4.97% 1.566 1.577 0.74%g721d 2.6 0.48% 5.05% 1.441 1.448 0.47%cjpeg 4.2 1.27% 6.86% 2.559 2.564 0.21%qsort 3.7 0.85% 4.80% 2.124 2.118 -0.24%
rawcaudio 3.2 1.45% 8.04% 1.988 1.961 -1.35%rawdaudio 2.9 0.58% 2.30% 1.793 1.793 -0.03%tiff2bw 3.1 0.89% 6.00% 1.924 1.925 0.03%tiff2rgba 2.8 1.58% 6.24% 1.685 1.705 1.22%
were converted to the equivalent number of NAND gates. Total aver-age power was provided after simulation of some test applications inSynopsys Primepower. The impact upon area of the processor is only4.9% and average total power only increases by 3%. Note that our tencounter design of 6,224 gates uses about half the gates of JouleDoc'seight counter, 12,000 gate system.The function shown in Figure 6 was simulated in ModelSim to de-
termine additional software impact. Note that this loop also accountsfor energy used during its own execution; as order is preserved, anyenergy not seen in the current iteration will be seen in the next it-eration. When applied to the SimpleScalar processor, the compiledloop executes 95 instructions taking 232 clock cycles with pipelinestalls and cache misses taken into account. Small applications requireexecution of the loop at most every 100,000 cycles representing only0.23% of the execution time. Note that we do not wish to add hardwareto the design to aid this calculation (such as a dedicated multiplier) asthe infrequency of execution does not justify the persistent area andpower costs of additional hardware.AccuracyFigure 5 shows power estimation results for cjpeg(5(a)), qsort(5(b))and tiff2rgba(5(c)) from the MiBench testbench suite[31]. Each graphshows both measured and estimated values of power calculated bySynopsys Primepower and the processor power counters respectively.Power was sampled at a period of 10,000 clock cycles. The closenessof the waveforms in each graph demonstrates high accuracy.
Table 2 summarizes the estimation results for several testbench ap-plications. The applications were cjpeg, qsort, tiff2bw and tiff2rgbafrom MiBench[3 1]; and rawcaudio, rawdaudio, g721e and g721d fromMediabench[32]. Column 1 states the name of the benchmark be-ing executed while Column 2 lists the number of clock cycles takento execute the benchmark. Columns 3 and 4 show the accuracy ofpower calculations as an average for all samples as well as the maxi-mum per sample error respectively (sample period is 10,000 cycles).Columns5 and 6 show the measured and estimated energy consumedover the run-time of the application. The final column shows error inenergy estimation, with the sign indicating whether energy was over-or under-estimated. The table shows that the average absolute errorfor power calculation is less than 2%. The maximum sample powererror is larger (e.g. 8% for rawcaudio), but this is only at a few pointsthroughout each trace. Energy estimation has a total error less than1.5% over all applications. These results show we are more accuratethan JouleDoc which has an error of 5%, despite our generic approach.
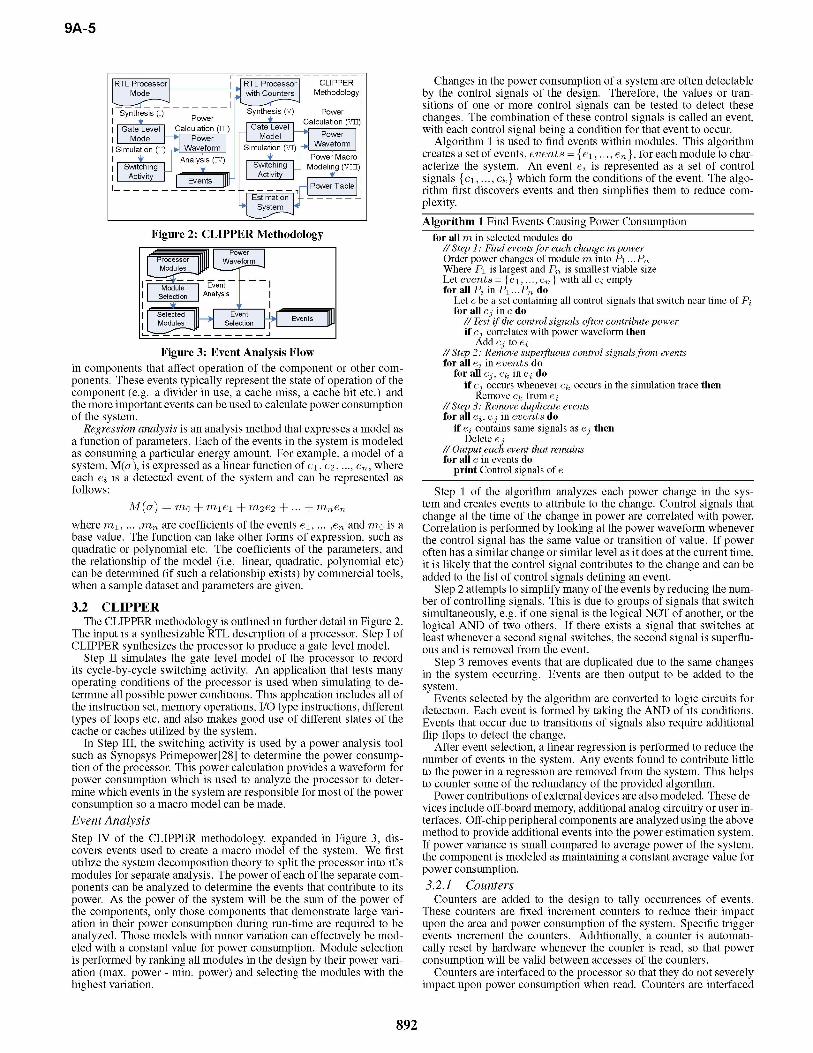
In Figure 7 we show how choosing the number of modules andevents that are selected affects the accuracy of the estimation proce-dure. We removed less significant events from the event list and cre-ated new macro models with the remaining counters. Figures 7(a),7(b) and 7(c) show accuracy graphs utilizing 2, 5 and 8 counters re-spectively for the qsort benchmark. This demonstrates how addingmore counters to the processor increases accuracy of the estimation.Note that Figure 7(c) bears resemblance to Figure 5(b), showing thatqsort could have utilized fewer counters to achieve similar results, al-
though this trend is not seen across all benchmarks.
6. CASE STUDYTo demonstrate how a CLIPPER processor can be used for run-time
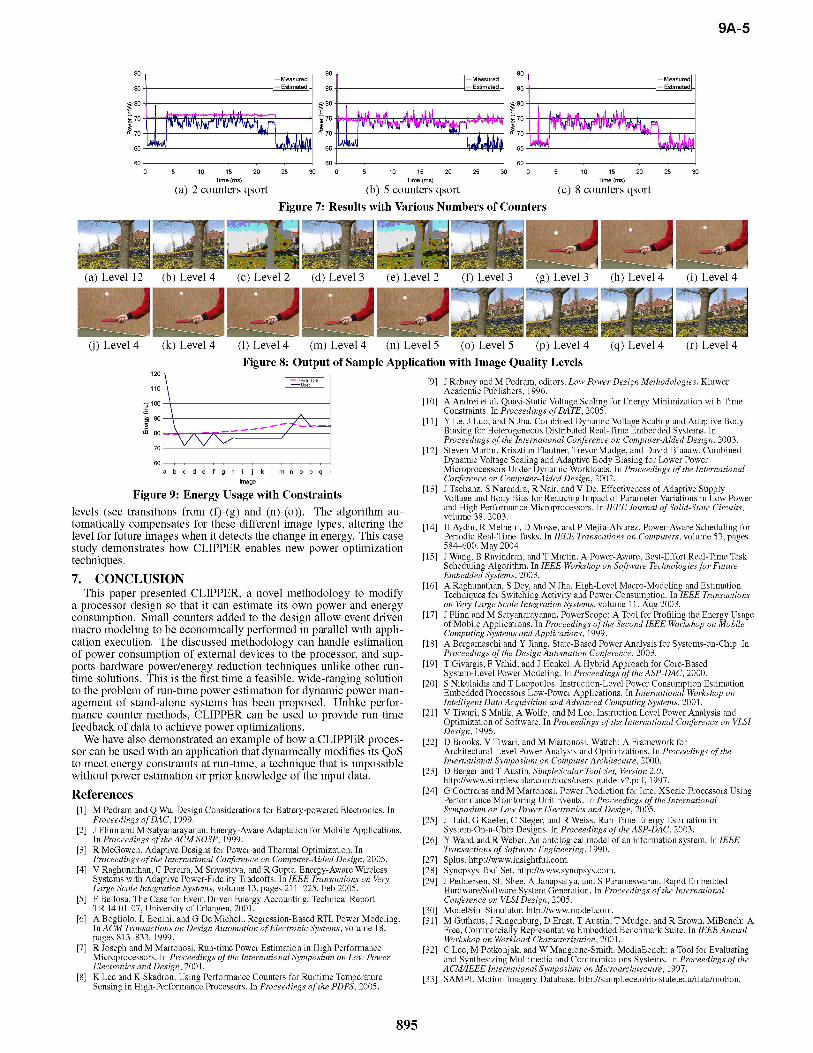
power optimization, an application was modified to utilize the powerestimation of the SimpleScalar processor described above. The JPEGbenchmark was converted into a motion JPEG encoder. This applica-tion was then modified to make use of the processor to optimize it'squality under a given energy constraint. A stream of images from theflower garden and table tennis sequences[33] were encoded with en-ergy calculated after each image. The modified application is able toencode images at various quality levels, for which approximate ratiosof energy consumption were calculated. Twelve quality levels werecreated by choosing between DCT routines and varying compressionrate. An additional level (level 0) was created that drops color infor-mation and encodes images in black and white to save computationtime and energy.
Algorithm 2 is a dynamic algorithm used to determine which qual-ity level will be used for future images. It assumes that future im-ages will be similar to the current image when making decisions. Thenumber of images that remain to be encoded is N, R is the remain-ing energy to encode those images, L is the current quality level withmaximum MAX, and le-vels is an array storing the relative energyconsumption of each quality level. The values of this array were pre-computed by executing the algorithm on a range of images at the var-ious quality levels and comparing the average energy consumption.Within an iteration of the main loop,E represents the energy of themost recently encoded image andI is used to calculate the qualitylevel of the next image.
Algorithm 2 Application Decision AlgorithmN <- Number of images to encodeR <- Total available energyL <- MAXwhile N> 0 doEncode image at level LE <- calc energy(); HI Get energy of encoded imageN-N -1;R-R -E;ifE> R thenN
HI Energy is too high, reduce level until it meets constraintif L :A 0 then
I - L -1; 11Start form next level downwhileI > 0 and E x levels[l]> R dolevels[L] N
I I- 1;
elseHI Energy is OK, increase level if it will stay under constraintwhile I <MAX andE X levels[l+1] R dolevels[L]- N
I*- +1;L I- 11 H Set level for further images
Figure 8 shows the output of a sample execution of the motion JPEGalgorithm described above. Figure 9 shows both the energy usage ofeach image in the stream and the available energy per image for fu-ture images. Available energy per image is calculated by dividingtotal energy remaining by the number of images left to encode (RIN).The algorithm can encode images at quality levels from 0 to 12 withlower levels being very lossy to demonstrate extreme conditions. Thefirst image is computed at maximum quality (level 12), and furtherimages use Algorithm 2 to change the quality level. Figure 9 demon-strates how the algorithm finds the correct power level at which toencode images to maximize quality while attempting to stay underthe available energy consumption level. Also note the garden imagestake more energy to encode than the table tennis images at equivalent
894
9A-5
90
85
80-E
B775
00L700
65
60
kk drvvWjkn
10 15 20
7065
-MeasuredEstimated
...lltkjvwlvvU1 A
90
85
a 80E,, 75-
00570
65-
- MeasuredEstimatedW
90
85
cz-80-
- MeasuredEstimatedW
) ubU uubU0 5 10 15 20 25 30 0 5 10 15 20 25 30 0 5 10 15 20 25 30
Time (ms) Time (ms) Time (ms)
(a) 2 counters qsort (b) 5 counters qsort (c) 8 counters qsort
(a) LeVel 1L (fD) LeVel 4
(j) Level 4 (k) Level 4
Figure 7: Results with Various Numbers of Counters
(c) Level 2 (d) Level 3 (e) Level 2 (f) Level 3 (g)
(1) Level 4 (in) Level 4 (n) Level 5 (o) Level 5 (p)
LeVel J (n) LeVel 4 (1) LeVel 4
Level 4 (q) Level 4 (r) Level 4
120 -\
100
90 A
80
Figure 8: Output of Sample Application with Image Quality Levels
a b c d e f g h k I m n o p q r
Image
Figure 9: Energy Usage with Constraintslevels (see transitions from (f)-(g) and (n)-(o)). The algorithm au-tomatically compensates for these different image types, altering thelevel for future images when it detects the change in energy. This casestudy demonstrates how CLIPPER enables new power optimizationtechniques.
7. CONCLUSIONThis paper presented CLIPPER, a novel methodology to modify
a processor design so that it can estimate its own power and energyconsumption. Small counters added to the design allow event drivenmacro modeling to be economically performed in parallel with appli-cation execution. The discussed methodology can handle estimationof power consumption of external devices to the processor, and sup-ports hardware power/energy reduction techniques unlike other run-time solutions. This is the first time a feasible, wide-ranging solutionto the problem of run-time power estimation for dynamic power man-agement of stand-alone systems has been proposed. Unlike perfor-mance counter methods, CLIPPER can be used to provide run-timefeedback of data to achieve power optimizations.We have also demonstrated an example of how a CLIPPER proces-
sor can be used with an application that dynamically modifies its QoSto meet energy constraints at run-time, a technique that is impossiblewithout power estimation or prior knowledge of the input data.
References[1] M Pedram and Q Wu. Design Considerations for Battery-powered Electronics. In
Proceedings of DAC, 1999.[2] J Flinn and M Satyanarayanan. Energy-Aware Adaptation for Mobile Applications.
In Proceedings of the ACM SOSP, 1999.[3] R McGowen. Adaptive Designs for Power and Thermal Optimization. In
Proceedings of the International Conference on Computer-Aided Design, 2005.[4] V Raghunathan, C Pereira, M Srivastava, and R Gupta. Energy-Aware Wireless
Systems with Adaptive Power-Fidelity Tradeoffs. In IEEE Transactions on VeryLarge Scale Integration Systems, volume 13, pages 211-225. Feb 2005.
[5] F Bellosa. The Case for Event Driven Energy Accounting. Technical ReportTR-14-01-07, University of Erlangen, 2001.
[6] A Bogliolo, L Benini, and G De Micheli. Regression-Based RTL Power Modeling.In ACM Transactions on Design Automation of Electronic Systems, volume 18,pages 813-833. 1999.
[7] R Joseph and M Martonosi. Run-time Power Estimation in High PerformanceMicroprocessors. In Proceedings of the International Symposium on Low PowerElectronics and Design, 2001.
[8] K Lee and K Skadron. Using Performance Counters for Runtime TemperatureSensing in High-Performance Processors. In Proceedings of the PDPS, 2005.
[9] J Rabaey and M Pedram, editors. Low Power Design Methodologies. KluwerAcademic Publishers, 1996.
[10] A Andrei et al. Quasi-Static Voltage Scaling for Energy Minimization with TimeConstraints. In Proceedings ofDATE, 2005.
[11] Y Le, J Luo, and N Jha. Combined Dynamic Voltage Scaling and Adaptive BodyBiasing for Heterogeneous Distributed Real-Time Embedded Systems. InProceedings of the International Conference on Computer-Aided Design, 2003.
[12] Steven Martin, Krisztian Flautner, Trevor Mudge, and David Blaauw. CombinedDynamic Voltage Scaling and Adaptive Body Biasing for Lower PowerMicroprocessors Under Dynamic Workloads. In Proceedings of the InternationalConference on Computer-Aided Design, 2002.
[13] J Tschanz, S Narendra, R Nair, and V De. Effectiveness of Adaptive SupplyVoltage and Body Bias for Reducing Impact of Parameter Variations in Low Powerand High Performance Microprocessors. In IEEE Journal of Solid-State Circuits,volume 38. 2003.
[14] H Aydin, R Melhem, D Mosse, and P Mejia-Alvarez. Power-Aware Scheduling forPeriodic Real-Time Tasks. In IEEE Transcations on Computers, volume 53, pages584-600. May 2004.
[15] J Wang, B Ravindran, and T Martin. A Power-Aware, Best-Effort Real-Time TaskScheduling Algorithm. In IEEE Workshop on Software Technologies for FutureEmbedded Systems, 2003.
[16] A Raghunathan, S Dey, and N Jha. High-Level Macro-Modeling and EstimationTechniques for Switching Activity and Power Consumption. In IEEE Transactionson Very Large Scale Integration Systems, volume 11. Aug 2003.
[17] J Flinn and M Satyanarayanan. PowerScope: A Tool for Profiling the Energy Usageof Mobile Applications. In Proceedings of the Second IEEE Workshop on MobileComputing Systems and Applications, 1999.
[18] A Bergamaschi and Y Jiang. State-Based Power Analysis for Systems-on-Chip. InProceedings of the Design Automation Conference, 2003.
[19] T Givargis, F Vahid, and J Henkel. A Hybrid Approach for Core-BasedSystem-Level Power Modeling. In Proceedings of the ASP-DAC, 2000.
[20] S Nikolaidis and T Laopoulos. Instruction-Level Power Consumption EstimationEmbedded Processors Low-Power Applications. In International Workshop onIntelligent Data Acquisition and Advanced Computing Systems, 2001.
[21] V Tiwari, S Malik, A Wolfe, and M Lee. Instruction Level Power Analysis andOptimization of Software. In Proceedings of the International Conference on VLSIDesign, 1996.
[22] D Brooks, V Tiwari, and M Martonosi. Wattch: A Framework forArchitectural-Level Power Analysis and Optimizations. In Proceedings of theInternational Symposium on ComputerArchitecture, 2000.
[23] D Berger and T Austin. SimpleScalar Tool Set, Version 2.0.http://www.simplescalar.com/docs/users guide v2.pdf, 1997.
[24] G Contreras and M Martonosi. Power Prediction for Intel XScale Processors UsingPerformance Monitoring Unit Events. In Proceedings of the InternationalSymposium on Low Power Electronics and Design, 2005.
[25] J Haid, G Kaefer, C Steger, and R Weiss. Run-Time Energy Estimation inSystem-On-a-Chip Designs. In Proceedings of the ASP-DAC, 2003.
[26] Y Wand and R Weber. An ontological model of an information system. In IEEETransactions of Software Engineering. 1990.
[27] Splus. http://www.insightful.com.[28] Synopsys Tool Set. http://www.synopsys.com.[29] J Peddersen, SL Shee, A Janapsatya, and S Parameswaran. Rapid Embedded
Hardware/Software System Generation. In Proceedings of the InternationalConference on VLSI Design, 2005.
[30] ModelSim Simulator. http://www.model.com.[31] M Guthaus, J Ringenburg, D Ernst, T Austin, T Mudge, and R Brown. MiBench: A
Free, Commercially Representative Embedded Benchmark Suite. In IEEE AnnualWorkshop on Workload Characterization, 2001.
[32] C Lee, M Potkonjak, and W Mangione-Smith. MediaBench: a Tool for Evaluatingand Synthesizing Multimedia and Communicatons Systems. In Proceedings of theACM/IEEE International Symposium on Microarchitecture, 1997.
[33] SAMPL Motion Imagery Database. http://sampl.ece.ohio-state.edu/data/motion.
895
90
85
;80E,, 75-
00570
65-
r,n-
9A-5
E
060
65 -i"~4
'k I t, I AL, 1, AIv .ulfovii.l'wqVI&I \m,VWA.l
70
60
bU
I
Il
a)
LU