Joint Research Centre - ec.europa.eu · food products would change energy intake (-154 kJ/day in...
31
The European Commission’s science and knowledge service Joint Research Centre
Transcript of Joint Research Centre - ec.europa.eu · food products would change energy intake (-154 kJ/day in...

The European Commission’s science and knowledge service
Joint Research Centre

- Update on ongoing JRC study -
Overview of existing and proposed FOP schemes, including literature review of research regarding
the development of the schemes, their impact on consumers and other effects
Joint meeting on front-of-pack nutrition labelling between Working Group of the Standing Committee on Plants, Animals, Food and Feed - Regulation (EU) No 1169/2011 on the provision of food information to consumers (FIC) & Advisory Group on the Food chain, Animal and Plant Health
Brussels, 22 October 2018
Stefan Storcksdieck genannt Bonsmann, Jan Wollgast, Ginevra Marandola, and Emanuele Ciriolo JRC.F.1 Health in Society & JRC.I.2 Foresight, Behavioural Insights and Design for Policy

Content – part I
• FOP labelling effects on diet & health • Associations of diet quality with health outcomes
• Effect of FOP labels on food perception
• Effect of FOP labels on food selection in online choice tasks
• Effect of FOP labels on food selection in offline choice tasks
• Meal selection/preparation studies
• Modelling studies estimating FOP labelling impact on nutrient intakes
• Modelling studies estimating FOP labelling impact on health
• FOP labelling effects on reformulation

FOP labelling effects on diet & health
• Associations of diet quality with health outcomes FSA-NPS DIa score positively associated with
• CVD risk in NutriNet1 and SU.VI.MAX2 cohorts; Hazard Ratio (HR) of 1.4-1.61
in poorest compared to best diet quality quartile
• Cancer risk in SU.VI.MAX3 and EPIC4 cohorts; HR of 1.07-1.34 in poorest
compared to best diet quality quintile
• Higher BMI in men in SU.VI.MAX cohorts 1 and 25; Odds Ratio of 1.12 for
overweight, 1.16 for obesity per 1-point increase in the FSA-NPS DI score
NB: Study cohorts tended to be healthier than average population.
aFood Standards Agency Nutrient Profile System Diet Index 1Adriouch et al. 2016; 2Adriouch et al 2017; 3Donnenfeld et al. 2015; 4Deschasaux et al. 2018; 5Julia et al. 2015

FOP labelling effects on diet & health
• Effect of FOP labels on food perception • NL: Highlighting reduced salt content on chicken soup either explicitly or
through "healthy choice" logo – without actually changing it – reduced
expected liking; no impact of label on actual liking1
• AUS: Testing regular, -15% salt, and -30% salt variants of chicken noodle
soup, a "Pick the Tick" logo did not compromise expected and actual liking
relative to no label control2
NB: Attention should be paid to label features and socio-cultural context in order to
achieve desired impact.
1Liem et al. 2012a 2Liem et al. 2012b
FOP labelling effects on diet & health
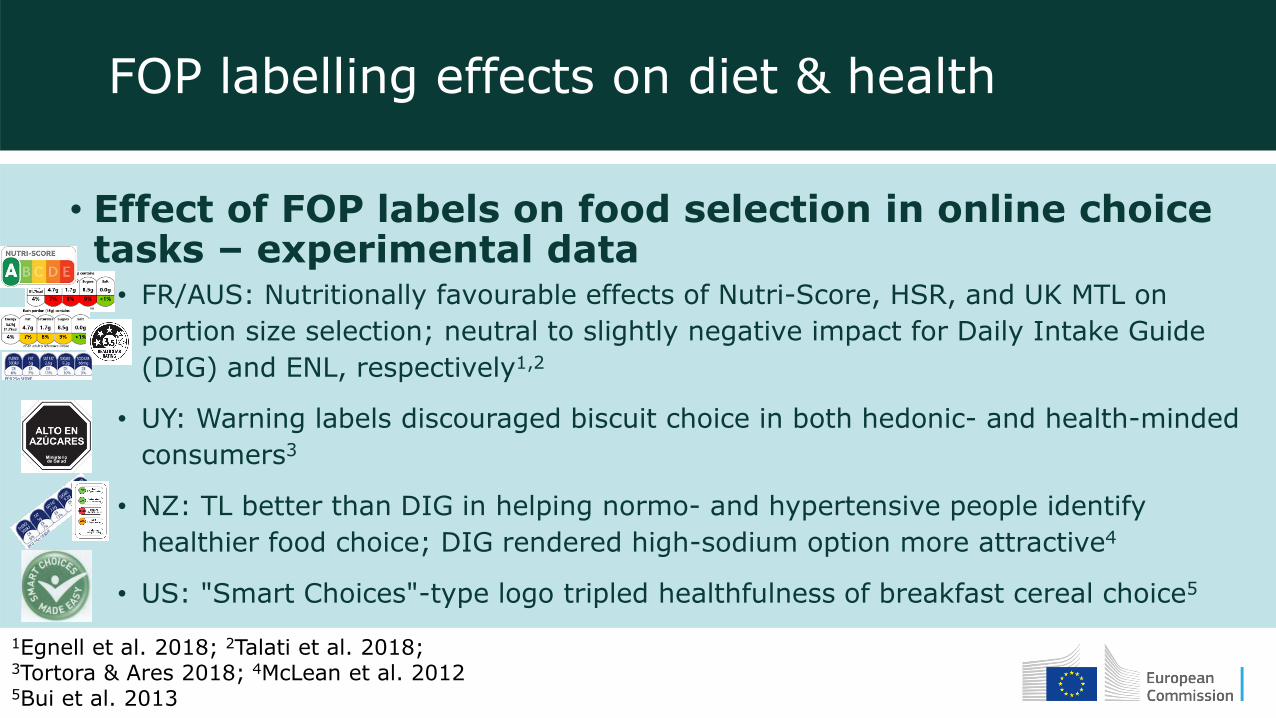
• Effect of FOP labels on food selection in online choice tasks – experimental data • FR/AUS: Nutritionally favourable effects of Nutri-Score, HSR, and UK MTL on
portion size selection; neutral to slightly negative impact for Daily Intake Guide
(DIG) and ENL, respectively1,2
• UY: Warning labels discouraged biscuit choice in both hedonic- and health-minded
consumers3
• NZ: TL better than DIG in helping normo- and hypertensive people identify
healthier food choice; DIG rendered high-sodium option more attractive4
• US: "Smart Choices"-type logo tripled healthfulness of breakfast cereal choice5
1Egnell et al. 2018; 2Talati et al. 2018; 3Tortora & Ares 2018; 4McLean et al. 2012 5Bui et al. 2013

FOP labelling effects on diet & health
• Effect of FOP labels on food selection in offline choice tasks – experimental data • US: In fake supermarket, marginally beneficial effects of TL-coded Facts-Up-
Front label, but only when combined with in-aisle explanation; no effect of
Facts-Up-Front alone1
• UK: Consumers willing to pay more for shopping baskets that have no red TL
for any nutrient; substantially less concern for switching from amber to
green2
NB: Importance of accompanying education measures.
1Graham et al. 2017 2Balcombe et al. 2010

FOP labelling effects on diet & health
• Meal selection/preparation studies (examples) – experimental data • DE: In subjects asked to compose a day’s food basket, no overall difference
of FOP labels (MTL, healthy choice tick, GDA, TL-coded GDA) on energy and
nutrient content; by product category, TL best on dairy products and Tick logo
on breakfast cereals1
• AUS: In subjects asked to serve themselves adequate portions of breakfast
cereal, fruit salad, and chocolate, and a three-component meal from a fake food
buffet, no impact of calorie or HSR labelling2
• NL: No impact of GDA labelling on soft drink portion choice in cinemas3
1Borgmeier & Westenhoefer 2009 2Brown et al. 2017 3Vermeer et al. 2011
FOP labelling effects on diet & health
• Modelling studies - FOP labelling impact on nutrient intakes • CA: Replacing any products with one or more red lights by similar foods not
bearing any red lights where available, or otherwise by the healthiest option:
Lower intake in energy (-5%), total fat (-13%), saturated fat intake (-14%),
and sodium (-6%). No effect on sugar intake1
• MX: Using MCNE nutrient profile criteria, intake reductions in energy (-5.4%),
saturated fatty acids (-18.9%), trans fat (-20%), total sugar (-36.8%), and
sodium (-10.7%), plus increase in fibre intake (+15.5%). With COFEPRIS criteria
(similar to EU Pledge), changes for trans fat (-20%) and sodium (-9.7%)2
1Emrich et al. 2017 2Mendoza et al. 2018

FOP labelling effects on diet & health
• Modelling studies - FOP labelling impact on nutrient intakes • FR: Shifting diets towards products with better Nutri-Score resulted in more
people achieving dietary recommendations; substitution scenarios resulted in
lower intakes in fat, sugars, and added sugars, and increased fibre intake; effects
more pronounced in people with Western or Traditional compared to healthy diet1
• NL: Shifting towards Choices-labelled products, lower intake in energy (-15%),
sodium (-23%), and trans fats (-63%), with other nutrients to limit (total fat,
total sugar, saturated fat) falling between sodium and trans fat reduction levels.
Positive nutrients increased between 5% (folic acid) and 28% (fibre)2
1Julia et al. 2016 2Roodenburg et al. 2009

FOP labelling effects on diet & health
• Modelling studies - FOP labelling impact on nutrient intakes • NZ: Pick the Tick programme compared to counterfactual of no programme
reduced daily intakes in saturated fat (-1 g; -3.2%), sodium (-38 mg; -1.1%),
and energy (-72 kJ; -0.8%)1
• FI: Replacing foods from four food groups majorly contributing to intakes of hard
fat, sodium, and fibre with products complying with Heart Symbol criteria
reduced intake of hard fat by 34.6% (14.3 -> 9.9E%), salt by 11%
(7.6 -> 6.8 g/day)2
1Wilson et al. 2014 2Raulio et al. 2017

FOP labelling effects on diet & health
• Modelling studies - FOP labelling impact on nutrient intakes
Consistently switching to Keyhole products would improve daily intakes as follows:
• SE: total calories (-11%), fat (-29%), saturated fat (-40%), and added sugar
(-9%); dietary fibre intake (+30%), wholegrain (+754%)1
• DK: energy (-1000 kJ), saturated fat (-27%), salt (-1 g), wholegrain (+76%),
dietary fibre (+18%)2
• NO: total fat (-11.4 g, -13%), saturated fat (-8.9 g, -26.5%), and energy (-403
kJ, -4.3%); dietary fibre intake increased (4.7 g, 19.3%)3
1Amcoff et al. 2015 2Biltoft-Jensen et al. 2015 3Astrup et al. 2015

FOP labelling effects on diet & health
• Modelling studies - FOP labelling impact on health • AUS: HSR-motivated product reformulation with subsequent reductions in energy
intakes could lead to body weight reductions and gain in healthy life years1
• AUS: 10% shift towards healthier options with mandatory TL labelling on selected
food products would change energy intake (-154 kJ/day in men, -88 kJ/d in
women), with subsequent reductions in weight (-1.6 kg for men, 0.9 kg for
women); if 10% of population responded, 45,000 DALYsa could be averted2
• NL: If whole population switched to Choices-labelled products where possible,
improved blood lipids would yield 1.59% reduced risk of myocardial infarction3
NB: Scenarios usually rely on very optimistic assumptions.
1Mantilla Herrera et al. 2018 2Sacks et al. 2011 3Vyth et al. 2012
aDisability-Adjusted Life Years

FOP labelling effects on reformulation
• Self-report data suggest… (examples) • NL: Choices logo led to reformulation of 168 out of 821 products (20%) assessed1
• Soups category most frequently affected
• Largest changes seen for sodium and fibre in sandwich category
• NZ: HSR products (n=807; 5.3% of all products) higher in energy and protein but
lower in saturated fat, total sugars, and sodium compared to non-HSR products2
• significant changes observed for overall mean energy (-29 KJ/100 g), sodium
(-49 mg/100 g), and fibre (+0.5 g/100 g)
• CL: 18% of 5,343 products evaluated in 2016 had been reformulated3
1Vyth et al. 2010 2Ni Mhurchu et al. 2017 3Chilean Ministry of Health 2017

Reminder
• Methodological issues • Study design
• Experimental vs. empirical
• Within-label variation
• e.g. 5-CNL vs. Nutri-Score; variants of Multiple Traffic Lights
• Research question
• FOP labels differ in their ability to answer different research questions

Content – part II
Evidence on consumer purchasing behaviour
1. Empirical versus experimental data
2. Empirical studies on consumers (retailers data)
3. Empirical studies on consumers (other facilities data)
4. Remarks/ideas for future research on consumers behaviour
Evidence on impact on supply side (reformulation)
5. FoP: empirical studies on suppliers and reformulation
6. What happened in the US, on calorie posting
7. Concrete idea(s) for future research
1st part
2nd part
Impact on Purchasing Decisions
Main Results:
Significant effect in presence of a dietary goal (Machin et al. 2018; Van Herpen
& Van Trijp 2011) Non-existent or marginal effect due to:
More salient factors: prices and discounts (Waterlander et al. 2013); time constraint
(Cohen & Babey 2012); taste (Koenigstorfer et al. 2014); habit (Boztug et al. 2015);
cognitive load and fatigue (Cohen & Babey 2012)
No clear evidence on the best label: Evaluative and reductive systems are related to
opposite cognitive processes (Sanjari et al. 2017)

Empirical data on Purchasing Decisions
ACTUAL PURCHASING BEHAVIOUR
(empirical data or large scale trials)
PROS:
• More realistic
environment
(external validity)
• Choice bears
consequences
CONS:
• It is difficult to
control for
confounding
factors

Impact on Purchasing Decisions
Empirical data from retailers to evaluate the impact of FOP labels on consumers'
behaviour in real shopping situations
Study on TLs in the UK (Sacks et al. 2009)
sales data indicated that TL-labelling had practically no effect on food purchases.
short period (1 month) and small number of products (18).
Loyalty cards.
Boztuğ et al. (2015) analysis of scanner data provided by a large UK retailer.
Focus on two food categories, using store-brand products with monochrome GDA
GDA does not affect product choice behaviour.
Instead, price and habit exhibit a greater impact on purchase behaviour and product
choice than the GDA label introduction.

Impact on Purchasing Decisions
Empirical data from facilities to evaluate the impact of FOP labels on consumer behaviour
in real shopping situations
TL in sport facility (Olstad et al. 2015).
Positive impact of labels
One week before vs. one week after
No negative effect on revenues
Hospital cafeteria (Sonnenberg et al. 2013; Thorndike et al. 2014)
Large hospital cafeteria with a mean of 6511 transactions daily.
After a 3-month baseline period, cafeteria items were labelled green; yellow; or red
and rearranged to make healthy items more accessible.
Respondents who noticed labels (33%) were more likely to purchase healthier items.
A traffic-light and choice architecture cafeteria intervention resulted in sustained
healthier choices over 2 years.

Impact on Purchasing Decisions
Empirical data mixed with survey data to evaluate the impact of FOP labels on
consumers' behaviour in real shopping situations
Vyth et al. (2010) on Choices logo
validated questionnaire about motivation for food choice
Nine supermarkets in The Netherlands (404 respondents)
62% reported familiarity with the logo
Food choice motive ‘hedonism’ was negatively associated with purchasing products
with the logo

Remarks/ideas for future research on consumers behaviour
1. More studies in a more realistic environment with incentives (lab experiments, field interventions,
real sales data)
2. More cross-country comparisons.
3. More research with the support and data by the industry (retailers, producers)
Caveat:
• Poorly done empirical analysis may be misleading
• Causality is extremely hard to identify
IDEAS for future research on consumer behaviour

Impact on the supply side
Studies on food manufacturers’ responses to FOP labels are rather scant. There is still no
systematic and comprehensive assessment of the effects of FOP labels on food reformulation and
supply strategic behaviour.
There is some evidence that FOP labels influence food composition (Netherlands, Canada,
Australia, New Zealand), though based on self-reported data
However, better nutrition composition not always correlated with FOP label frequency (Van
Camp et al. 2012)
Potential reasons:
Reformulation occurs only for nutrients highlighted by FOP labels (Carter et al. 2013)
Low incentives within same labelling grade (Van Camp et al. 2010)
FoP labelling as marketing strategy for producers and retailers (Newman et al. 2014)
More likely to be present on private label products (Van Camp et al. 2012)

Product reformulation, how to measure it

Product reformulation, what happened in US ahead of July 2018

Product reformulation, before and after

Brick-and-mortar and online choices

What empirical information we could collect
Brick-and-mortar shopping provide purchase data, and may allow estimating the macro
impact of an intervention (e.g., the introduction of a new FoP system)
Online shopping, instead:
Also allows the estimation of the impact at a micro scale
Allows linking any impact to specific socio-demographic characteristics
Allows linking any impact to previous actions (e.g., did the online shopper click on
the label, filter or sort products by label)
Etc.

Key brands already committed to "nudge for good"

Should we not join forces?
All in all, we saw that experimental online data provide precious information on
consumers' perceptions, understanding and purchase intentions. However there are both
gaps and inconclusive results.
We also saw that some concerns are cast on the external validity of such results
We therefore make a call for researchers and the private sector to join forces to look for
conclusive empirical results (regarding the effects on the demand and the supply side):
The previous slides offer some relatively simple ideas for future research

Thank you
Stefan Storcksdieck genannt Bonsmann, Jan Wollgast, Ginevra Marandola, and Emanuele Ciriolo JRC.F.1 Health in Society & JRC.I.2 Foresight, Behavioural Insights and Design for Policy