John Roberts State Budget Director State Association of Accountants, Auditors and Business...
28
John Roberts State Budget Director State Association of Accountants, Auditors and Business Administrators April 21, 2015 Michigan Growing Stronger
-
Upload
arline-richard -
Category
Documents
-
view
213 -
download
0
Transcript of John Roberts State Budget Director State Association of Accountants, Auditors and Business...

John RobertsState Budget Director
State Association of Accountants, Auditors and Business AdministratorsApril 21, 2015
Michigan Growing Stronger

Michigan Economy Coming Back Strong• Nearly 400,000 new private sector jobs since December 2010• Unemployment lowest since 2002; lowest unemployed since 2001• Home sales and values on the rise
2

Creating More and Better Jobs
3
Change in Michigan Wage and Salary Employment from Previous Year (thousands of jobs)
Note: U.S. Bureau of Labor Statistics. 2014-2017 estimates are 1/16/15 Consensus Forecast. 1/20/15.
Avg.
Consensus Forecast
-112.7-76.8 -71.0
-16.9 -9.3
-63.2 -58.7-105.7
-291.6
-7.2
88.5 81.5 71.228.0
54.0 54.0 51.0
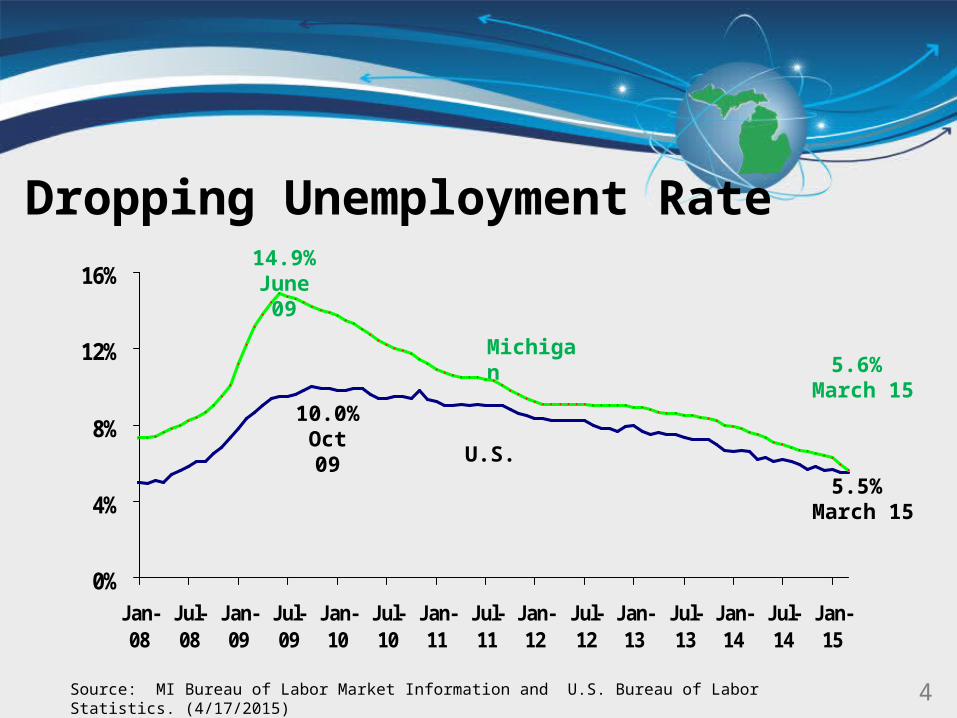
Dropping Unemployment Rate
4
0%
4%
8%
12%
16%
Jan-08
Jul-08
Jan-09
Jul-09
Jan-10
Jul-10
Jan-11
Jul-11
Jan-12
Jul-12
Jan-13
Jul-13
Jan-14
Jul-14
Jan-15
5.5% March 15
5.6% March 15
Source: MI Bureau of Labor Market Information and U.S. Bureau of Labor Statistics. (4/17/2015)
14.9%June 09
10.0%Oct 09
Michigan
U.S.

5
Rising Personal Incomes
Michigan Personal Income Year-Over-Year % Change
Note: U.S. Bureau of Economic Analysis. 2014-2017 estimates are 1/16/15 Consensus Forecast. 1/20/15. Consensus Forecast
1.1% 0.6%
2.8%3.4%
2.6% 2.6% 2.6%1.6%
-4.4%
2.3%
5.9%
3.9%
1.4%
4.2% 4.3% 4.4% 4.3%

6
• Huge awards made in last decade; impact thru 2032• Clear lack of transparency on benefits and timing• Replaced with transparent program in 2011• Action steps:
o Better visibilityo Understanding long-term impact
Legacy Tax Credits

FY11 FY12 FY13 FY14 FY15 FY16----- 25.1% 50.9% 57.4% 98.1% 80.8%
($171.0) ($476.6) (-$173.3) (-$251.8) (-$350.9)
-8.0%
-6.0%
-4.0%
-2.0%
0.0%
2.0%
4.0%
6.0%
8.0%
10.0%
6.7%($591.7)
4.4%($407.6)
8.5%($813.6)
-4.3%(-$384.8)
-3.1%(-$297.8)
-4.8%(-$465.2)
3.8%($431.1)
2.5%($274.2)
1.1%($122.0) 0.7%
($82.7) 0.3%($41.1)
0.3%($30.7)
General FundSchool Aid Fund
GF & SAF Revenue Estimate Error Rates($ in millions)
Negative = Actual < Estimate When Budget Enacted (FY15 & FY16: Jan ‘15 Est. < May ‘14 Est.)Positive = Actual > Estimate When Budget Enacted (FY15 & FY16: Jan ‘15 Est. > May ‘14 Est.)
% of Error Due to MBT
7
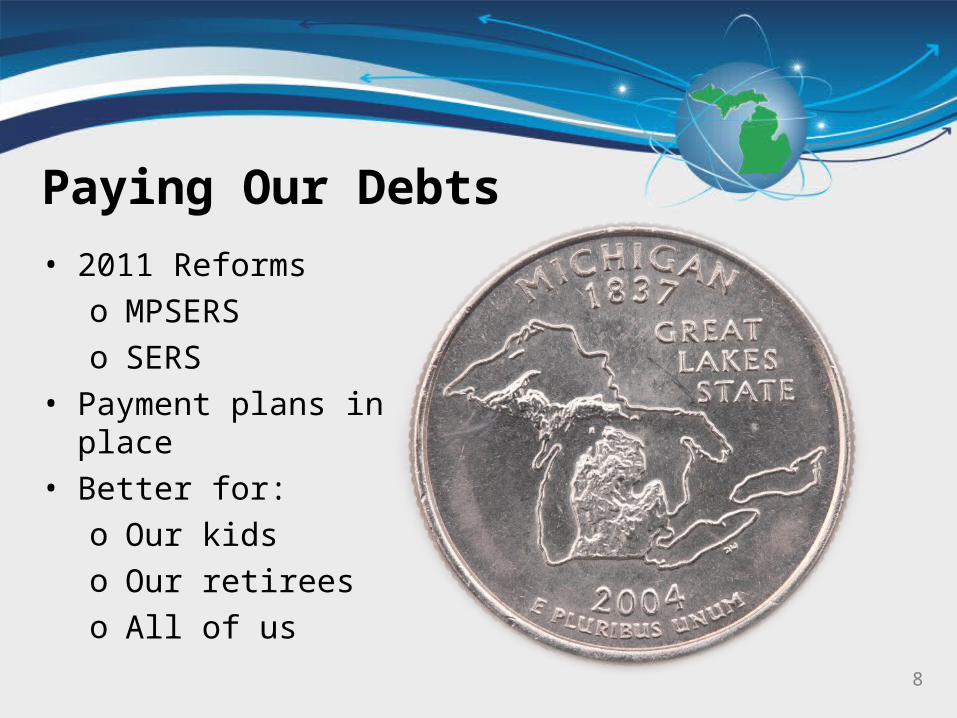
Paying Our Debts• 2011 Reforms
o MPSERSo SERS
• Payment plans in place• Better for:
o Our kidso Our retireeso All of us
8

Long-term Debt – Pre and Post Reform
Pre-Reform: Unsustainable path with long-term unfunded liabilities of $45B and growing
Post-Reform: Sustainable path by reducing liability by $15.6B and capping the growth
Pre-Reform: Unsustainable path with long-term unfunded liabilities of $14.7B
Post-Reform: Sustainable path by reducing liability by $5.7B and increased employee contributions
School Employees Retirement(MPSERS)
State Employees Retirement(SERS)
Total: Long Term Debt Reduced by more than $20B
9

• Savings from reforms equals $644M or $475 per K-12 student in FY 16
• FY 16 funding recommendation is $815M or $600 per K-12 student
• These two actions translate into $1.46B or $1,075 per K-12 student in MPSERS districts in FY 16
Reforms Result in Savings
10

11
Paying for Our Legacy Costs – Schools

12
Paying for Our Legacy Costs – Corrections

Saving for a Rainy Day
13
20002001
20022003
20042005
20062007
20082009
20102011
20122013
2014
2015 Projec
ted
2016 Projec
ted$0
$200,000,000
$400,000,000
$600,000,000
$800,000,000
$1,000,000,000
$1,200,000,000
$1,400,000,000$1,264,400,000
$994,200,000
$145,200,000
$0$81,300,000
$2,000,000$2,000,000$2,100,000$2,200,000$2,200,000$2,200,000$2,200,000
$365,100,000
$505,600,000
$386,200,000$498,200,000
$610,800,000
The Budget Stabilization Fund (BSF) Peaked at $1.3 Billion in FY 2000, but Had to be Rebuilt.
FY16 Deposit of $95M One-time and $17.5 Million Ongoing.
Fiscal Year

14
FY16 Budget Recommendations
15
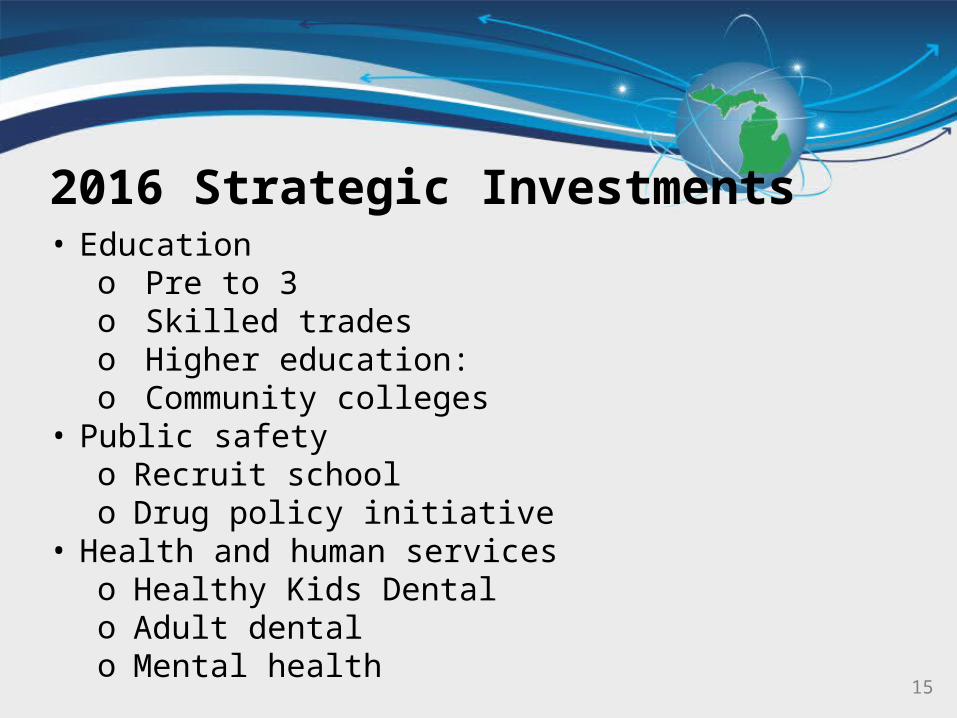
2016 Strategic Investments• Education
o Pre to 3o Skilled tradeso Higher education:o Community colleges
• Public safetyo Recruit schoolo Drug policy initiative
• Health and human serviceso Healthy Kids Dentalo Adult dentalo Mental health

Continuing Education as a Priority
16
$10.7B+ $1.2B $11.9B
* Does not include federal funding, adult education funding or preschool funding
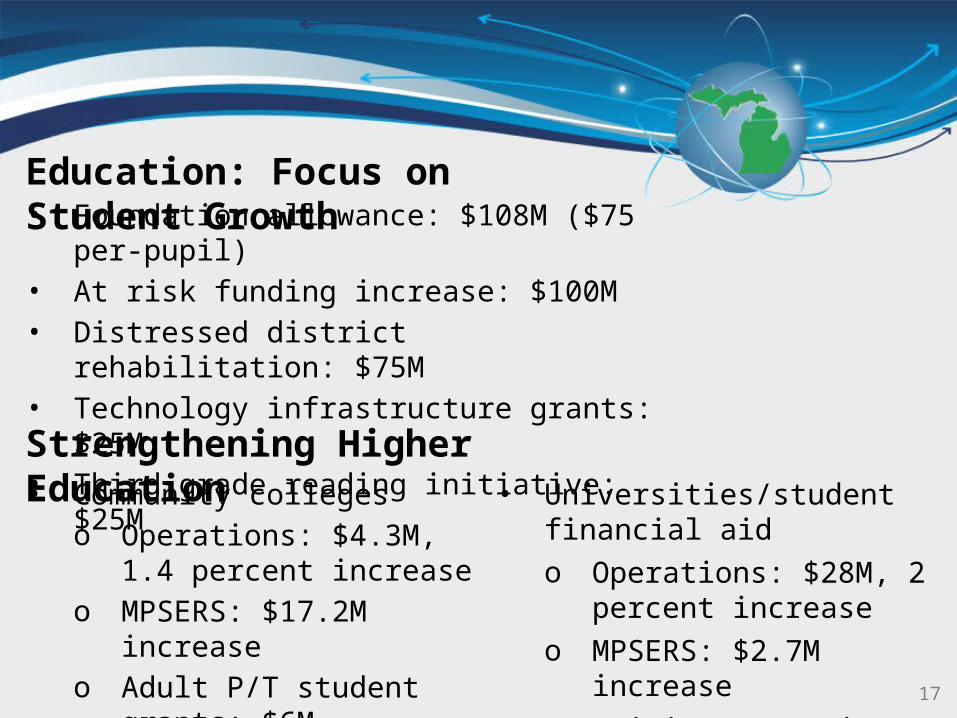
Education: Focus on Student Growth• Foundation allowance: $108M ($75 per-pupil)• At risk funding increase: $100M• Distressed district rehabilitation: $75M• Technology infrastructure grants: $25M• Third grade reading initiative: $25M
17
Strengthening Higher Education• Community colleges
o Operations: $4.3M, 1.4 percent increase
o MPSERS: $17.2M increaseo Adult P/T student grants: $6M
• Universities/student financial aido Operations: $28M, 2 percent
increaseo MPSERS: $2.7M increaseo Tuition restraint at 2.8 percent

Prioritizing Skilled Trades• FY16 Investments: $35.6M, including:
o Career and Technical Education Early/Middle College programs: $17.8M
o Skilled Trades: $10M increase; $20M totalo Student outreach, career planning and dual enrollment
enhancements: $4.3M• Existing related programs: $47.6M
Total investment: $83M
18

Prioritizing Public Safety
19
• $7.7M to train 75 MSP troopers• $1M to train 10 motor carrier officers• $3.4M to resolve sexual assault cases
o $1.7M to process DNAo $1.7M for prosecution
• $500,000 to help prevent sexual assaults on campuses
• $1.5M related to drug policy initiative

20
Other Topics of Interest …

Comprehensive Annual Financial Report• For the last two years, Michigan has issued its CAFR
faster than any state in the nation— FY13: 82 days— FY14: 90 days
• Michigan expects to issue in 90 days or less for FY15• The FY15 book closing is currently in the planning stage,
with particular emphasis on implementing GASB 68 (Accounting and Financial Reporting for Pensions) and various process and reporting improvements
21

SIGMA Update• Project SIGMA continues to move forward at an
aggressive pace• Phase 1 system testing is almost complete and we
will soon be moving into user acceptance testing• Phase 2 design is on track for completion in the
upcoming months• Phase 2 technical designs and planning for the
associated agency work is also underway
22

23
Transportation – the Problem• Michigan investment in roads per capita: $154
— Annual repair cost average: $539
• Ohio invests $214 per capita; Wisconsin spends $302 per capita; Pennsylvania invests $530 per capita
• 28 percent of Michigan’s bridges are in need of repair, improvement or replacement
• 48 percent of major roads in Michigan’s largest cities are in poor or mediocre condition
• Roadway conditions are a significant factor in approximately 1/3 of traffic fatalities
24
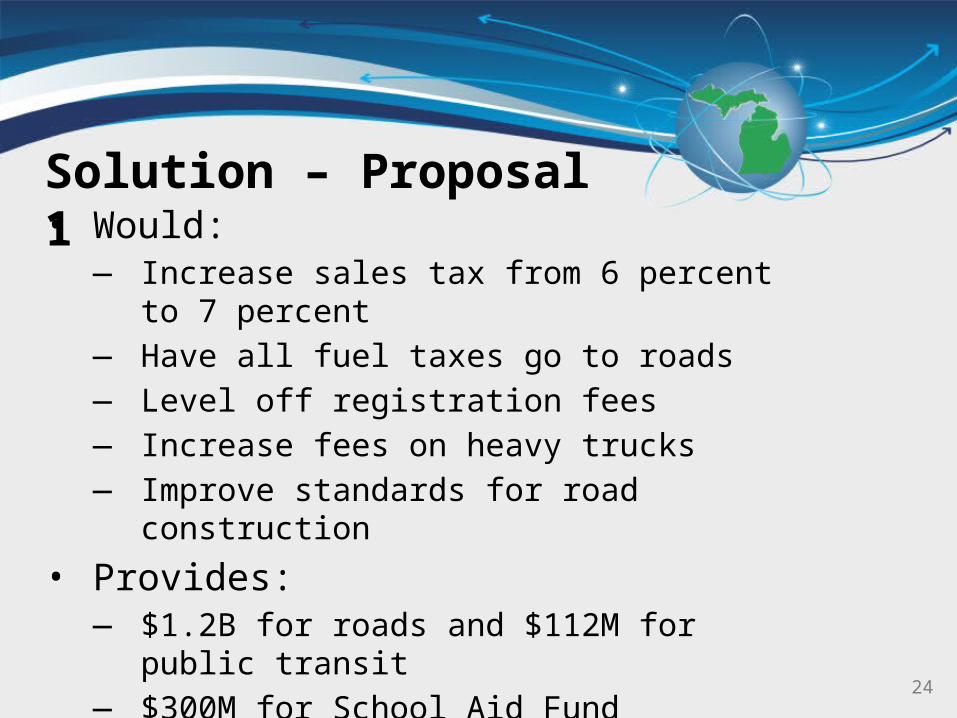
Solution – Proposal 1• Would:
— Increase sales tax from 6 percent to 7 percent— Have all fuel taxes go to roads— Level off registration fees— Increase fees on heavy trucks— Improve standards for road construction
• Provides:— $1.2B for roads and $112M for public transit— $300M for School Aid Fund — $100M for local government

25
Risks• Venture Michigan Fund• Tax credits
– Job retention/growth• Transportation• King vs. Burwell Obamacare
challenge/Healthy Michigan• Demographics

26
Detroit• Tough decisions made• Four-year balanced budget – first time in the city’s history• New investment opportunities• Detroit’s future is looking brighter

Accelerating the Comeback
27
• Ongoingo Transportation: Comprehensive funding solutiono Healthy Kids Dental o Education K-12: School retirement system Universities/Community Colleges/Skilled Tradeso Public safety o Local government funding
• One-timeo Grow reserves
Ballot proposal Expanding to three remaining counties
Funding retirement obligations Increased
investment
Added funding for new counties
Growing to more than $600M
Running another recruit school

Questions?
Thank you.
28