John Laxdal Toronto, ON - tac-atc.ca · traffic on mine haul roads in ... Unsurfaced Road...
20
Bulk-haul Traffic Highway Maintenance and Rehabilitation Impact Study John Laxdal Regional Manager, Southwest British Columbia Amec Foster Wheeler Environment & Infrastructure Paper prepared for presentation at the Sustainability and Climate Change Considerations in Pavements Session of the 2016 Conference of the Transportation Association of Canada Toronto, ON Thanks to Department of Economic Development, Yukon Government for commissioning this study. Thanks to Prolog Canada Inc. and Vector Research for their assistance.
Transcript of John Laxdal Toronto, ON - tac-atc.ca · traffic on mine haul roads in ... Unsurfaced Road...

Bulk-haul Traffic Highway Maintenance and Rehabilitation Impact Study
John Laxdal Regional Manager, Southwest British Columbia
Amec Foster Wheeler Environment & Infrastructure
Paper prepared for presentation at the Sustainability and Climate Change Considerations in Pavements Session
of the 2016 Conference of the Transportation Association of Canada
Toronto, ON
Thanks to Department of Economic Development, Yukon Government for commissioning this study. Thanks to Prolog Canada Inc. and Vector Research for their assistance.

1
Abstract Yukon Government maintains a 4,800 km highway network. Bulk haul for mining impacts highway maintenance and rehabilitation (M&R) budget demand. A proportion of the network traverses permafrost which amplifies the climate change impact on M&R costs with respect to the sustainability of the Yukon highway network. The purpose of this study was to develop a methodology for the estimation of the cost impact of industrial bulk hauling on the Yukon highway network. The relatively low volume of industrial traffic on mine haul roads in Yukon allows for a degree of data control that may not be available to researchers in other regions of Canada.

2
1.0 INTRODUCTION This paper presents the results of a Bulk-haul Traffic Highway Maintenance and Rehabilitation (M&R) Impact Study which focuses on the Yukon, Canada highway network. The Yukon Government maintains a highway network totalling approximately 4,800 centreline kilometres of which 3,700 km are primary highway. This network inventory includes some asphalt concrete surfaced roads, some surfaced with Bituminous Surface Treatment (BST), and some surfaced with gravel. A proportion of this network traverses permafrost which amplifies the climate change impact on M&R costs with respect to the sustainability of the Yukon highway network. According to the Transportation Association of Canadai, one of the key objectives regarding sustainability in transportation systems is the provision of safe access for individuals and societies in a manner that is consistent with human and ecosystem health, and with equity within and between generations. Yukon has a small population and a large area. Highway construction and maintenance costs are disproportionately large when compared to other jurisdictions on a per capita basis. Bulk haul on public highways causes an increase in maintenance and rehabilitation funding demand. Because of the small population, bulk haul on the highway network can have a substantial impact on M&R funding demand and therefore the economic sustainability of the highway network. Accounting for the impact of bulk haul on public highway M&R will allow for better informed policy decisions that can manage these effects on future budgetary requirements. The purpose of this study was to develop a methodology for estimating the cost impact of industrial bulk hauling on the Yukon highway network. This includes estimating the proportion of the maintenance and capital construction cost components attributable to the bulk haul traffic. The relatively low volume of industrial traffic on mine haul roads in Yukon allows for a degree of data control that may not be available to researchers in other regions of Canada. The bulk-haul cost per kilometre was calculated based on the calculated capital costs and maintenance costs, the Equivalent Single Axle Load (ESAL) proportion for bulk-haul versus regular traffic, and the tonnes hauled. The bulk haul cost in terms of maintenance and rehabilitation is a function of: year to year variation in costs; weather and climate change; Load Equivalency Factor; surface type (asphalt concrete, BST, or gravel); pavement structure thickness; subsurface conditions (soil, groundwater and permafrost); and timing of preventative measures and rehabilitation. Because there are so many factors that enter into the calculation of the bulk-haul cost on any given route, a simplified approach was prepared to allow estimation of the future M&R cost to expect from potential future bulk haul traffic. Note that costs presented in the report are in 2013 dollars. 2.0 METHODOLOGY The methodology for the assessment included: Obtain pavement associated data from the Government of Yukon Department of Highways
and Public Works: o weigh scale records
o pavement structural designs
o pavement condition and management data
o pavement construction and maintenance cost data

3
Analyze traffic data to determine Load Equivalency Factor (LEF) and Equivalent Single Axle Loads (ESALs) for regular trucks and bulk-haul truck traffic
Assess pavement performance and rehabilitation requirements without and with the bulk-haul traffic in accordance with: o American Association of State Highway and Transportation Officials (AASHTO) Guide for
Design of Pavement Structures, 1993ii for Asphalt Concrete Pavement (ACP) highway sections
o Minnesota Seal Coat Handbook, 2006 and the Shell Methodiii for Bituminous Surface Treatment (BST) sections. The Minnesota Seal Coat Handbook is based on work done in Canada by Norman McLeodiv.
o United States Department of the Army Technical Manual (TM 5-626) Unsurfaced Road Maintenance Management 1995v for gravel surface road segments, and the Shell Method.
Develop baseline maintenance cost and net cost model per tonne-kilometre. 3.0 HIGHWAY NETWORK 3.1 Road Surface Classification The Government of Yukon maintains a total of approximately 3,700 centreline-kilometres of primary highway. The roads are classified in three categories based on surface type:
1. Asphalt Concrete Pavement – 350 km – 9% 2. Bituminous Surface Treatment – 1878 km – 51% 3. Gravel Surface – 1469 km – 40%
Figure 1 presents a map of the Yukon highway network:

4
Figure 1: Yukon Primary Highway Network 3.2 Subgrade Support and Permafrost The life of the pavement is directly related to the subgrade support, or the strength of the soil underlying the roadway embankment. Stronger, and more free draining subgrade soil types (well graded gravel for instance) contribute to good pavement performance and long life, while weaker, poorly draining compressible soil types (clay and silt) and organic soils such as peat contribute to shorter pavement life. The Yukon roadways are built on widely varying soil types. In the Yukon there are areas of permafrost, discontinuous permafrost, and seasonal freezing. All of these conditions affect pavement performance. The permafrost areas can have layers of surficial soil that are subject to seasonal thaw. The soil depth that is subject to seasonal thaw is called the active layer. A map of permafrost areas in Yukon is presented as Figure 2.

5
Figure 2: Yukon Permafrost Distribution
Reference: Yukon Permafrost Network – Permafrost Classified Model
With spring thaw there can be a dramatic reduction in the strength of the road embankment and subgrade soil. This strength reduction is dominated by saturation of the materials from meltwater and thaw of porewater, and also possible lenses and/or layers of ice that have built up in the materials over the winter. The strength reduction is more pronounced in frost susceptible soils, such as fine grained silts and clays. The Yukon Department of Highways and Public Works addresses this spring loss of roadway strength with a Spring Weight Restrictions program in order to avoid significant damage to the roadways. With climate change it is likely that there will be a degradation of permafrost, reduction in the size of permafrost areas, and an increase in freeze thaw cycles in non-permafrost areas and in the active layer of permafrost areas. These subgrade, spring thaw, and permafrost issues are all important to pavement design, construction and maintenance in the Yukon. Where possible these aspects have been considered in the study. However, the study scope did not allow detailed study of these aspects through field investigation and analysis.
Permafrost Legend: Sporadic Discontinuous (10% - 50%) Extensive Discontinuous (50% - 90%) Continuous (90% - 10%) Subsea Permafrost

6
3.3 Asphalt Concrete Pavement (ACP) ACP is a structural pavement which is built over a prepared subgrade. Layers of granular base and subbase are placed over the subgrade prior to placement of asphalt. ACP pavements make up approximately nine percent of the Yukon primary highway network. A typical Yukon ACP pavement structurevi is presented in the following table:
Table 1: Typical ACP Pavement Structure Thickness
Pavement Course Layer Thickness (mm)
Asphalt Concrete: 80 Granular Base: 150
Granular Subbase: 300 Based on the 2012 Yukon Pavement Management System Update, the expected life to major rehabilitation (indicated as Level 3 Intervention) of an ACP pavement would be 21 years for “All Other YG Paved Roads”. For Haines Road the expected life is higher; 24 years. It was designed and is maintained to a different standard than the balance of the Yukon network because of joint Alaska and Yukon funding. The Pavement Management System report says that earlier, less costly intervention like a simple overlay at ten years will result in lower overall highway maintenance and rehabilitation costs. The Yukon Government also provided more recent information on the longevity of the ACP pavements in Yukon. Based on data since 2002, the average years to overlay is 31.7. 3.4 Bituminous Surface Treatment (BST) BST surfacing was first used in the Yukon in the late 1970’s. Since that time BST has become the predominant highway surfacing technology in the Yukon and covers approximately 1,900 centreline-kilometres of the road network. The BST system provides a hard surfaced road and provides a seal from surface water infiltration for a much lower cost than ACP and is proven to withstand the Yukon traffic and environmental conditions. As documented by MacLeodvii, BST pavements are categorized based on their structural strength:
Class 1. BST applied directly to unimproved subgrades. These are short-lived structures where a BST is the most economical form of dust control. Class 2. BST applied on top of 75-150 mm of crushed gravel. These are light duty pavements that provide an improved level of service over Class 1 BST. Class 3. Stage Construction: Initially full depths of base and subbase are placed with a BST surface instead of asphalt concrete. Service volumes (AADT) range between 300 and 700 vehicles per day. When traffic volumes warrant and budgets permit, the BST is replaced with asphalt concrete.
Typical structural and non-structural BST pavement structures are shown in the following tables:
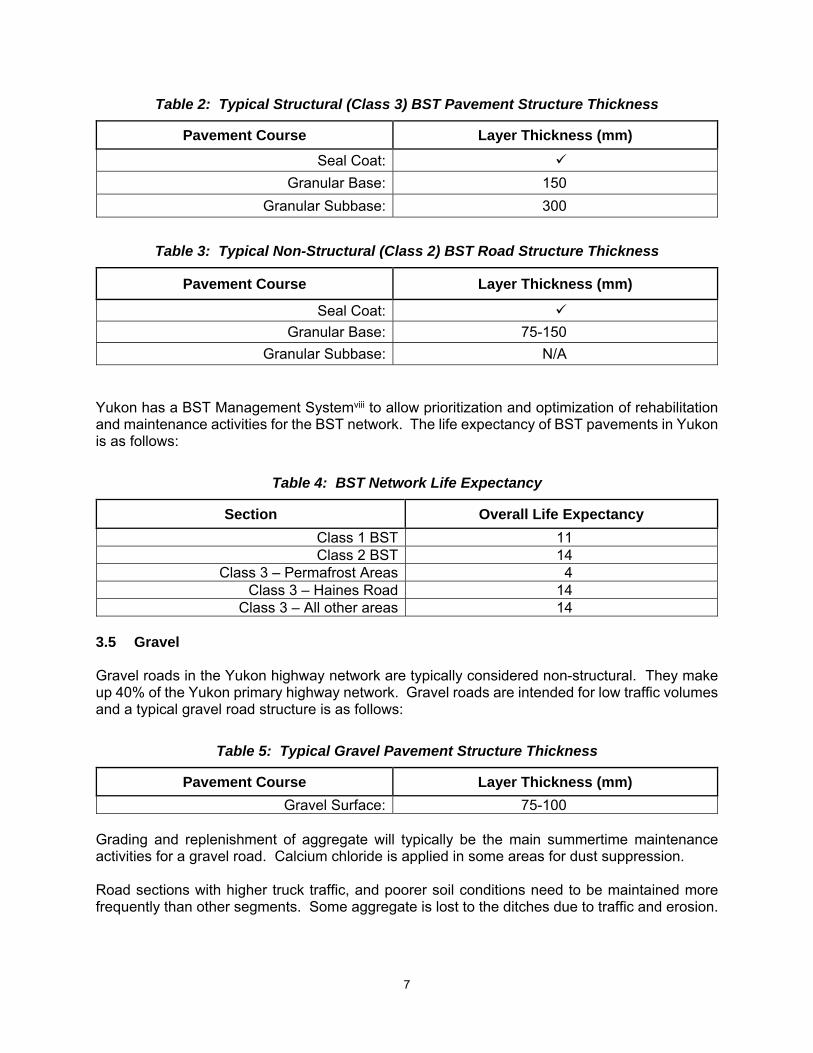
7
Table 2: Typical Structural (Class 3) BST Pavement Structure Thickness
Pavement Course Layer Thickness (mm)
Seal Coat:
Granular Base: 150
Granular Subbase: 300
Table 3: Typical Non-Structural (Class 2) BST Road Structure Thickness
Pavement Course Layer Thickness (mm)
Seal Coat:
Granular Base: 75-150
Granular Subbase: N/A Yukon has a BST Management Systemviii to allow prioritization and optimization of rehabilitation and maintenance activities for the BST network. The life expectancy of BST pavements in Yukon is as follows:
Table 4: BST Network Life Expectancy
Section Overall Life Expectancy
Class 1 BST 11 Class 2 BST 14
Class 3 – Permafrost Areas 4 Class 3 – Haines Road 14
Class 3 – All other areas 14 3.5 Gravel Gravel roads in the Yukon highway network are typically considered non-structural. They make up 40% of the Yukon primary highway network. Gravel roads are intended for low traffic volumes and a typical gravel road structure is as follows:
Table 5: Typical Gravel Pavement Structure Thickness
Pavement Course Layer Thickness (mm)
Gravel Surface: 75-100 Grading and replenishment of aggregate will typically be the main summertime maintenance activities for a gravel road. Calcium chloride is applied in some areas for dust suppression. Road sections with higher truck traffic, and poorer soil conditions need to be maintained more frequently than other segments. Some aggregate is lost to the ditches due to traffic and erosion.

8
4.0 STUDY ROUTES For the purpose of this bulk-haul study several highway sections were selected for analysis based on traffic movement from the major producing mines. Overall, three mines in production in 2014 were identified. Metal mines transport their concentrated ore (concentrate) via the Yukon highway network. The routes which were affected by the bulk-haul of mine concentrate were: Bellekeno Mine: Silver Trail (Hwy 11) - Klondike Highway (Hwy 2) - Skagway Port Minto Mine: Klondike Highway (Hwy 2) - Skagway Port Wolverine Mine: Campbell Highway (Hwy 4) - Alaska Highway (Hwy 1) - BC Highway 37 -
Port of Stewart, BC. According to its publicly available production statistics1, the Bellekeno Mine produced 18,685 tonnes of concentrate in 2012. The statistics do not indicate whether the production figure represents dry or moist weight for the concentrate. Bellekeno Mine began commercial production in early 2011. The Minto Mine produced 49,159 dry metric tonnes (DMT) of concentrate in the most recent reported year, 2011ix. In past years it had produced up to 59,863 DMT (2009). It is understood that the concentrate moisture content averages eight percent, so as much as 64,700 tonnes per year moist weight of concentrate has been produced. The moist weight of production in 2011 would be 53,092 tonnes based on eight percent moisture content. Minto Mine production started in October 2007. Wolverine Mine transported 76,886 DMT of concentrate in 2012x. The moisture content wasn’t stated in the report. This mine began operating in 2011. Commercial production began in March 2012. Full production began in the first part of 2013. The following table summarizes these mine production statistics: The interpreted bulk haul traffic for each mine is as follows:
Table 6: Interpreted Bulk Haul Traffic
Mine Interpreted Bulk Haul Loads per Year
Bellekeno 374 Minto 1,062
Wolverine 1,538
Total: 2,973 5.0 TRUCK TRAFFIC RELATED HIGHWAY PAVEMENT DETERIORATION
Pavement deterioration occurs due to environmental and vehicle load related factors. Environmental factors include freeze/thaw cycles, frost heave, wet/dry cycles, oxidation of asphalt cement, and ultraviolet radiation. 1 http://www.alexcoresource.com/s/bellekeno.asp?ReportID=517548

9
The load related deterioration is mainly due to truck traffic. In terms of vehicle characteristics, the impact of any particular truck on pavement deterioration is related to the number of axles, axle spacing/grouping, and axle or axle group loading. The load related damage to the pavement is exponentially proportional to axle loading, typically considered to vary with the axle load to the fourth power. For example, one loaded 26,000 kg GVW dump truck would cause approximately 500 times the damage to a pavement as a passenger vehicle at 1,800 kg. Passenger vehicles are commonly omitted from the analysis since they account for such a low proportion of pavement deterioration. Damage due to environmental factors is considered to be the same regardless of bulk haul so the cost analysis focuses on load related deterioration.
In determination of pavement loading, truck traffic is commonly normalized to determine the Equivalent 80 kN Single Axle Loads or ESALs. This takes into consideration the number of axles, axle spacing, axle configuration and axle loading. From the Transportation Association of Canada (TAC) Pavement Design and Management Guide, 1997xi, ESALs are:
A concept which equates the damage to a pavement structure caused by the passage of a non-standard axle load to a standard 80 kN axle load, in terms of calculated or measured stress, strain or deflection at some point in the pavement structure, or in terms of equal conditions of distress or loss of serviceability.
In order to take into account the axle configuration and loading for a particular vehicle, the concept of Load Equivalency Factor (LEF) is used. In accordance with the 1997 TAC Guide LEF is:
A ratio of relative pavement damage to determine the number of Equivalent Single Axle Loads (ESALs) a particular loading on an axle assembly (vehicle) represents.
For a single axle, the Load Equivalency Factor for one axle can be calculated using the following formula:

10
In North America it is common to use 80 kN as the standard axle load. Calculation of the LEF for any particular vehicle can be carried out using methodology put forth in AASHTO 1993. The following table presents ESALs/vehicle or LEFs for some typical truck configurations for example:
Table 7: Typical Equivalent Single Axle Loads
FHWA Class
Configuration Fully Loaded Weight (kg)
Fully Loaded ESALs/Vehicle (LEF)
6 3 Axle Dump Truck 26,000 2.9 8 2 Axle Tractor + 1 Axle Trailer 25,500 4.6 8 2 Axle Tractor + 2 Axle Trailer 34,600 4.9
12 6 Axle Multi-Trailer (B Train) 53,700 8.8 The vehicle loading on the pavement results in temporary or transient stresses and strains within the pavement. Over the long term, these stresses and strains cause fatigue which leads to distresses like potholes and cracking, and ultimately to failure of the pavement. The higher the ESALs/year, the higher the maintenance costs and the sooner the pavement will need to be rehabilitated. Thicker, more robust pavements are used to provide longer pavement life where high volumes of heavy truck traffic is expected. Other factors are involved in the overall speed of pavement deterioration. For instance, when road surfaces are rough the pavement will deteriorate quicker because of the impact loading. The lateral wander of the vehicles also enters into the rate of wear surface deterioration. On the gravel highways with low traffic the trucks will tend to move around from side to side (wander) more than on the BST and asphalt routes where there are lane markings. The wandering will result in slower pavement deterioration when compared to channelized traffic. 5.1 Traffic Data The Yukon Traffic Count Summary, 2011 report from HPW was analyzed to determine Average Daily Traffic (ADT) and growth rate for selected Yukon routes. The following table shows the traffic count stations which were used to determine the ADT for the selected study route sections.
11
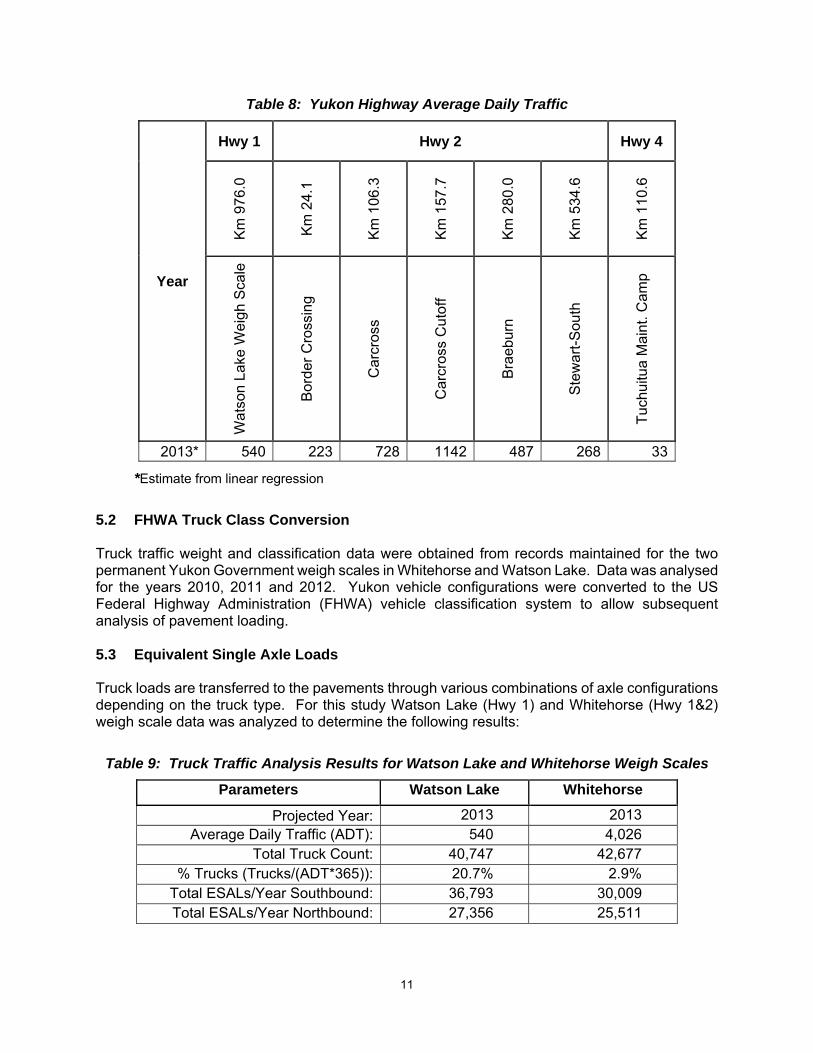
Table 8: Yukon Highway Average Daily Traffic
Year
Hwy 1 Hwy 2 Hwy 4
Km
976
.0
Km
24.
1
Km
106
.3
Km
157
.7
Km
280
.0
Km
534
.6
Km
110
.6
Wat
son
Lake
Wei
gh S
cale
Bor
der
Cro
ssin
g
Car
cros
s
Car
cros
s C
utof
f
Bra
ebur
n
Ste
war
t-S
outh
Tuc
huitu
a M
aint
. Cam
p
2013* 540 223 728 1142 487 268 33
*Estimate from linear regression
5.2 FHWA Truck Class Conversion Truck traffic weight and classification data were obtained from records maintained for the two permanent Yukon Government weigh scales in Whitehorse and Watson Lake. Data was analysed for the years 2010, 2011 and 2012. Yukon vehicle configurations were converted to the US Federal Highway Administration (FHWA) vehicle classification system to allow subsequent analysis of pavement loading. 5.3 Equivalent Single Axle Loads Truck loads are transferred to the pavements through various combinations of axle configurations depending on the truck type. For this study Watson Lake (Hwy 1) and Whitehorse (Hwy 1&2) weigh scale data was analyzed to determine the following results:
Table 9: Truck Traffic Analysis Results for Watson Lake and Whitehorse Weigh Scales
Parameters Watson Lake Whitehorse
Projected Year: 2013 2013 Average Daily Traffic (ADT): 540 4,026
Total Truck Count: 40,747 42,677 % Trucks (Trucks/(ADT*365)): 20.7% 2.9%
Total ESALs/Year Southbound: 36,793 30,009 Total ESALs/Year Northbound: 27,356 25,511
12
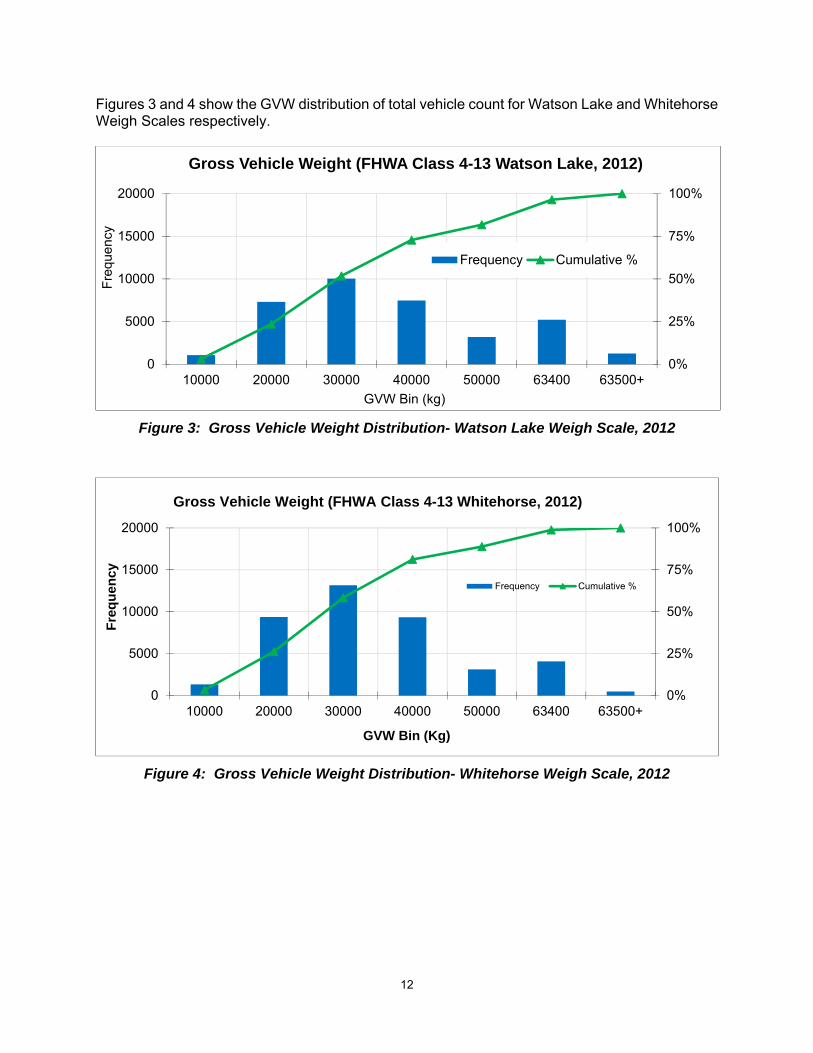
Figures 3 and 4 show the GVW distribution of total vehicle count for Watson Lake and Whitehorse Weigh Scales respectively.
Figure 3: Gross Vehicle Weight Distribution- Watson Lake Weigh Scale, 2012
Figure 4: Gross Vehicle Weight Distribution- Whitehorse Weigh Scale, 2012
0%
25%
50%
75%
100%
0
5000
10000
15000
20000
10000 20000 30000 40000 50000 63400 63500+
Fre
quen
cy
GVW Bin (kg)
Gross Vehicle Weight (FHWA Class 4-13 Watson Lake, 2012)
Frequency Cumulative %
0%
25%
50%
75%
100%
0
5000
10000
15000
20000
10000 20000 30000 40000 50000 63400 63500+
Fre
qu
ency
GVW Bin (Kg)
Gross Vehicle Weight (FHWA Class 4-13 Whitehorse, 2012)
Frequency Cumulative %

13
Figures 5 and 6 show the LEF distribution of total vehicle count for Watson and Whitehorse Weigh Scale respectively.
Figure 5: LEF Distribution - Watson Lake Weigh Scale, 2012
Figure 6: LEF Distribution - Whitehorse Weigh Scale, 2012
The weigh scale data includes origin and destination information for each truck that reports to the station. Based on travel direction the truck configuration and weight data was further analysed to determine the proportion of ESALs due to bulk haul in each direction on Highway 1, Highway 2 and Highway 4. The analysis determined that the Wolverine Mine haul contributes approximately 26% to the ESALs for south/west bound truck traffic on Highway 1. The North 60º bulk haul in the opposite direction did not contribute a significant portion of the ESALs at this location.
0%
25%
50%
75%
100%
0
5000
10000
15000
20000
25000
1 2 3 4 5 6 7 8 9 10 10+
Fre
qu
ency
LEF Bin
Load Equivalency Factor LEF (FHWA Class 4-13 Watson Lake, 2012)
Frequency Cumulative %
0%
25%
50%
75%
100%
0
5000
10000
15000
20000
25000
1 2 3 4 5 6 7 8 9 10 10+
Fre
qu
ency
LEF Bin
Load Equivalency Factor LEF (FHWA Class 4-13 Whitehorse, 2012)
Frequency Cumulative %

14
For Highway 2 the mining haul generated from Bellekeno and Minto mines makes up approximately 43 to 81% of the southbound ESALs with a distance weighted average of 57%. Northbound, the North 60º haul makes up approximately 47% of the total ESALs in this direction. For Highway 4 the Wolverine Mine haul traffic made up approximately 90% of the southbound ESALs. This indicates that although the mine haul vehicles do not represent a very high proportion of the vehicles and even trucks on these routes, they do contribute significantly to the number of ESALs on the routes. Therefore the bulk haul contributes significantly to the demand for maintenance and rehabilitation. 6.0 COST MODELING Construction and maintenance data was analysed to determine maintenance and capital construction costs for the selected haul routes. Costs such as beaver dam removal were filtered out since the expenditure is not relevant to load induced damage. Durable construction like asphalt overlay and BST placement were considered to be capital costs. 6.1 Capital Cost The capital cost of ACP and BST surfacing is pertinent since bulk truck traffic contributes to consumption of the life of the pavement. 6.1.1 Asphalt Concrete Pavement Asphalt overlay cost data from Yukon Highways and Public Works is presented in the following figure:
Figure 7: Asphalt Overlay Cost Data
$0
$50,000
$100,000
$150,000
$200,000
$250,000
$300,000
$350,000
$400,000
$450,000
2000 2002 2004 2006 2008 2010 2012 2014
Cost
Year
ACP Overlay Cost ($/km)
ACP Overlay Cost ($/km)
Linear (ACP Overlay Cost ($/km))

15
Based on linear regression of construction cost trends, the 2013 normalized cost is estimated at $400,000 per kilometre. The Pavement Management System data says that the average pavement service life to overlay is 32 years. Therefore, in any given year, on average, 1/32 or 3.1% of the length of an ACP surfaced highway would need to be rehabilitated with an overlay. Therefore, for any given kilometre of ACP road in one year, a capital construction allowance of 3.1% of $400,000 or $12,400 would be appropriate given the above assumptions. 6.1.2 Bituminous Surface Treatment The Yukon BST inventory is dominated by Class 3 BST on non-permafrost subgrade. The Yukon BST Management System – 2012 report indicates that the average life of the Class 3 BST is 14 years. For the purpose of this study the life will be assumed to be Class 3 BST on non-permafrost subgrade; 14 years. The BST Report provides an estimated 2013 BST replacement cost of $62,000/kilometre. Therefore, the average annual replacement cost per kilometre for BST is $62,000/14 years ≈ $4,400 per BST network kilometre. 6.1.3 Gravel Surface Gravel surfacing is used for low volume roads. This type of road requires regular wear surface maintenance consisting of grading and occasional replenishment of aggregate. The aggregate requires replenishment because: Some is thrown or shoved into the ditches by vehicle traffic Some is punched down into the subgrade Erosion Degradation Additional depth needed to build up a stronger embankment where the subgrade is weak. Because they are relatively frequent, the grading and aggregate replenishment activities for gravel roads can all be considered maintenance rather than capital works. 6.2 Maintenance Cost Maintenance costs have been obtained from the HPW Maintenance of Primary and Secondary Roads (MAPS) database. The database tracks costs for each highway maintenance camp in Yukon. Of the 23 camps operated by HPW, six were selected for analysis of maintenance costs based on their presence on a bulk haul route and their surface type. Since the surface type is: dominated by BST for the Highway 1 Watson Lake Camp; BST for the Fraser, Carcross, and Carmacks Camps on Highway 2; and dominated by gravel surface at the Highway 4 Tuchitua Camp, the data from these camps is considered to best represent their respective surface types. It is understood that there has been little if any maintenance to the ACP pavement sections. An exception is that a few kilometres of Highway 2 in the area covered by the Fraser Camp has an ACP surface and some of this was overlaid in 2013.

16
Klondike Maintenance Camp – Hwy 5 - Yukon
The following table summarizes the routes and camps that were studied:
Table 10: Highway Maintenance Camps Studied
CAMP ID Surface Type (km) BST Gravel ACP
Highway 1 - Camp Whitehorse 99.5 141.8 152.4Highway 1 - Watson Lake 84.6 - 10.7
Highway 2 - Fraser 54.4 - 1.9Highway 2 - Carcross 145.1 113.1 -
Highway 2 - Carmacks 137.0 - 29.3Highway 4 - Tuchitua 5.1 172.1 -
The following table presents the results of the analysis of the maintenance cost per year:
Table 11: Highway Maintenance Costs
Year ACP BST Gravel
Hwy 1-
Whitehorse Camp
Hwy 1-Watson Lake
Camp
Hwy 2-Fraser Camp
Hwy 2- Carcross
Camp
Hwy 2- Carmacks
Camp
Hwy 4-Tuchitua
Camp
Cost/km Cost/km Cost/km Cost/km Cost/km Cost/km
2007 $0 $2,494 $1,216 $897 $1,763 $2,503
2008 $0 $1,220 $2,521 $1,397 $2,407 $2,458
2009 $0 $1,663 $5,239 $1,821 $2,219 $1,767
2010 $0 $3,748 $1,987 $1,991 $2,135 $3,367
2011 $0 $2,982 $1,488 $1,859 $2,226 $1,527
2013* $0 $3,823 $2,494 $2,600 $2,412 $1,908
* 2013 values projected based on 2007 to 2011 data.

17
6.3 Bulk-haul Cost per Kilometre The bulk-haul cost per kilometre was then estimated based on the above calculated capital costs and maintenance costs, the ESAL proportion for bulk-haul versus regular traffic and the tonnes hauled.
Table 12: Bulk-haul Cost per Kilometre
Highway Annual Cost (2013 $) Bulk Haul ESALs /
Total ESALs (%)
Total Bulk Haul
Tonnes
Bulk Haul $/(t-km)
Capital Cost/km
Maintenance Cost/km
Total Cost/km
Highway 1 - Whitehorse - ACP $12,400 - $12,400 25 102,714 $0.03Highway 1 - Watson Lk - BST $4,400 $3,823 $8,223 26 92,004 $0.02
Highway 2 - Fraser - BST $4,400 $2,494 $6,894 57 102,714 $0.04Highway 2 - Carcross - BST $4,400 $2,600 $7,000 57 102,714 $0.04
Highway 2 - Carmacks - BST $4,400 $2,412 $6,812 57 102,714 $0.04Highway 4 - Tuchitua- Gravel $0 $1,908 $1,908 90 90,372 $0.02
Average: $0.03
This analysis indicates 2013 highway maintenance and capital costs attributable to the bulk-haul to range from $0.02 to $0.04 per tonne-kilometre based on surface type, with an average of $0.03/tonne kilometre. This cost is based on the full GVW. 7.0 BULK-HAUL COST From the above analysis it can be seen that the bulk haul cost in terms of maintenance and rehabilitation is a function of: Year to year variation in construction and maintenance costs which can be impacted by
general inflation, contract volume, competitive environment for outsourced work, labour, materials, fuel and equipment prices
Weather – for instance, rehabilitation and maintenance costs will be higher in a wet year versus a dry year
Bulk-haul ESALs/vehicle or LEF Surface type: asphalt concrete; BST; or gravel Pavement structure thickness – thinner pavements will deteriorate more quickly Subsurface conditions – soil, groundwater and permafrost Timing of preventative measures and rehabilitation – as the HPW Pavement Management
and BST Management reports indicate, timely preventative measures and rehabilitation can reduce the overall cost to maintain the network while providing an equivalent level of service.
Because there are so many factors that enter into the estimation of the bulk-haul cost on any given route, it is suggested that a simplified approach be taken when estimating the impact of bulk hauls on highway maintenance and rehabilitation costs. Options include:

18
a) A single blended cost per tonne-km that would be updated from time to time to account for changes in rehabilitation and maintenance costs applicable to all routes. For 2013 this was estimated at $0.03/tonne-kilometre.
b) A cost for haul on the specific surface type: ACP, BST or gravel also updated from time to time. This could be a blended rate based on the proportion of different pavement types encountered on the route based on the estimated values
The costs should be updated annually based on construction and maintenance cost inflation. 8.0 CONCLUSIONS The bulk-haul costs can be estimated based on either of the two options identified. In both cases this would be applied to the full GVW. The impact of future mine bulk-hauls on highway rehabilitation and maintenance budgets for Yukon can be projected using the identified cost per tonne kilometre. This cost should be updated regularly using actual construction and maintenance cost records. Climate change will likely impact maintenance and rehabilitation cost trends. Thaw of permafrost, deepening of the active zone, and introduction of more freeze thaw cycles may significantly impact the degradation of roadway condition and result in higher maintenance and rehabilitation costs. In this context, the proportion of maintenance and rehabilitation costs that arises from bulk-haul activities on Yukon highways would be expected to rise with a warming climate.

19
References
i Transportation Association of Canada Briefing, Strategies for Sustainable Transportation Planning, May 2007. ii American Association of State Highway and Transportation Officials (AASHTO) Guide for Design of Pavement Structures, 1993. iii Claessen, A.I.M., J.M. Edwards, P. Sommer, and P. Uge, Asphalt Pavement Design - The Shell Method, Proceedings, Fourth International Conference on the Structural Design of Asphalt Pavements, University of Michigan, Vol. 1, 1977. iv McLeod, N.W., A General Method of Design for Seal Coats and Surface Treatments, Proceedings of the Association of Asphalt Paving Technologists, Volume 38. St. Paul, MN, 1969. v United States Department of the Army Technical Manual TM 5-626, Unsurfaced Road Maintenance Management, 1995. vi Yukon Infrastructure, Yukon Spring Weight Restrictions, Rev 2002/02. vii D.R., MacLeod, Integration of Pavement Management into the Strategic Plan for the Reconstruction of the Alaska (Alcan) Highway, 6th International Conference on Managing Pavements (2004). viii Yukon BST Management System – 2012 Report, Yukon Highways and Public Works, January 2013. ix Minto Explorations Ltd., Minto Phase VI Preliminary Feasibility Study Technical Report, January 1, 2012. x Yukon Zinc Corporation, Wolverine Mine, Quartz Mining License QML-0006, 2012 Annual Report, March 31, 2013. xi Transportation Association of Canada Pavement Design and Management Guide, 1997.