JNCC Contract: C12-0230-0595. Report of the 6th UK...
42
JNCC Contract: C12-0230-0595. Report of the 6th UK Biodiversity Indicators Forum Summary report of the key discussion points and recommendations of the 6 th UK Biodiversity Indicator Forum A report prepared for the UK Biodiversity Indicators Steering Group by: Megan Tierney, Nadine Bowles-Newark, Lucy Wilson & Kerstin Brauneder The UNEP World Conservation Monitoring Centre 1
Transcript of JNCC Contract: C12-0230-0595. Report of the 6th UK...
JNCC Contract: C12-0230-0595. Report of the 6th UK Biodiversity Indicators Forum
Summary report of the key discussion points and recommendations of the 6th UK Biodiversity Indicator Forum
A report prepared for the UK Biodiversity Indicators Steering Group by:Megan Tierney, Nadine Bowles-Newark, Lucy Wilson & Kerstin Brauneder
The UNEP World Conservation Monitoring Centre
1

JNCC Contract: C12-0230-0595. Report of the 6th UK Biodiversity Indicators Forum
Contents1 Background and Forum Objectives.....................................................................................................4
2 Forum Format.....................................................................................................................................5
3 Key Discussion Points and Recommendations from Working Groups................................................6
3.1 Habitat Connectivity Indicator.....................................................................................................6
3.1.1 Key Discussion Points and Comments..................................................................................7
3.1.2 Summary and Recommendations........................................................................................8
3.2 Climate Change Adaptation Indicator..........................................................................................8
3.2.1 Key Discussion Points and Comments..................................................................................9
3.2.2 Summary and Recommendations......................................................................................10
3.3 Threatened Species Indicator....................................................................................................11
3.3.1 Key Discussion Points, Comments and Recommendations................................................12
3.4 Plant Genetic Resources Indicator.............................................................................................14
3.4.1 Key Discussion Points.........................................................................................................14
3.4.2 Summary and Recommendations......................................................................................17
3.5 Ecosystem Services Indicator.....................................................................................................17
3.5.1 Key Discussion Points.........................................................................................................18
3.5.2 Summary and Recommendations......................................................................................19
3.6 Global Impacts Indicator............................................................................................................22
3.6.1 Key Discussion Points and Comments................................................................................22
3.6.2 Summary and Recommendations......................................................................................24
3.7 National Reporting.....................................................................................................................24
3.7.1 Key Discussion Points, Comments and Recommendations................................................25
4 Annexes............................................................................................................................................27
4.1 Participant List...........................................................................................................................27
4.2 Forum Agenda...........................................................................................................................29
2
JNCC Contract: C12-0230-0595. Report of the 6th UK Biodiversity Indicators Forum
Abbreviations/Acronyms
BISG Biodiversity Indicator Steering Group
CBD Convention on Biological Diversity
CEH Centre for Ecology and Hydrology
CWR Crop wild relatives
EBSCCA England Biodiversity Strategy for Climate Change Adaptation
JNCC Joint Nature Conservation Committee
MENE Monitor of Engagement with the Natural Environment
NFI National Forest Inventory
NGO Non-governmental organisation
SWOT Strength, weakness, opportunities, threats
RSPB Royal Society for the Protection of Birds
UNEP-WCMC United Nations Environment Programme – World Conservation Monitoring Centre
WCS Wider countryside species
3
JNCC Contract: C12-0230-0595. Report of the 6th UK Biodiversity Indicators Forum
1 Background and Forum ObjectivesThe new Strategic Plan for biodiversity 2011 to 20201 includes 20 headline targets for 20202, and Parties to the Convention on Biological Diversity (CBD) are urged to develop national and regional targets using the Strategic Plan as a flexible framework. Indicators are required to track progress towards these targets.
In response to this significant change to the policy framework, a review of the UK biodiversity indicators was undertaken to ensure that they remain relevant and based on the most robust and reliable data. Based on the outcomes of the review, the UK Biodiversity Indicator Steering Group (BISG) proposed an interim set of 24 indicators for reporting against global and European frameworks. These were first published in May 2012 on the Joint Nature Conservation Committee (JNCC) website3, and will be updated in May 2013.
A number of the proposed indicators need refinement and/or development. The UNEP World Conservation Monitoring Centre (UNEP-WCMC) is currently developing options for six thematic areas under a Defra led contract (contract number: WC1031). These thematic areas are: Awareness of Biodiversity Conservation, Status of Species and Habitats Supporting Ecosystem Services, Habitat Connectivity, Plant Genetic Resources, Climate Change Adaptation, and Integrating Biodiversity into Business Activities. Separately, JNCC is developing indicator options for the following areas: Threatened Species, and the UK’s Global Impact. JNCC is also reviewing how national indicators can be used to assess and report progress on international commitments.
For each indicator topic an options paper will be written for consideration by the BISG, after which a codified methodology will be written for the implementation of each selected option.The first options and/or discussion papers on Habitat connectivity, Plant Genetic Resources, Climate Change Adaptation, Ecosystem Services, Threatened Species and Global Impacts have been prepared.
In order to ensure validity and scientific robustness of the options, it was decided that the sixth meeting of the UK Biodiversity Indicators Forum (hereafter referred to as the Forum) should be used as vehicle to provide quality assurance and peer review of these papers before decisions on which options to take forward are taken by the BISG in early 2013.The specific objectives of the Forum were to:
Explore options for addressing gaps in the current UK biodiversity indicator set. Seek feedback from the scientific and data recording communities on relevance and robustness
of different options to inform final decisions about which options to take forward.
1 http://www.cbd.int/sp/2 http://www.cbd.int/sp/targets/3 http://jncc.defra.gov.uk/biyp
4
JNCC Contract: C12-0230-0595. Report of the 6th UK Biodiversity Indicators Forum
Provide feedback on how indicators (and other information) could be used to assess progress with international commitments in the UK’s 5th CBD National Report.
This report serves as a summary of the key discussion points and recommendations that arose at the Forum meeting.
2 Forum FormatExperts experienced in the range of topics addressed by each of the options/discussion papers, as well as in indicator development and use, were invited to participate in the Forum. Experts included national policy makers, scientists, academics and representatives from NGOs. A full participant list is presented in Annex 1.
The Forum was convened over two days as an interactive workshop, with seven individual working groups (Table 1). The Forum agenda is provided in Annex 2.
Table 1. Forum working groups.Day 1 (5 December 2012) Day 2 (6 December 2012)
Habitat connectivity Climate change adaptation Threatened species Presentation and reporting of indicators4
Plant genetic resources Ecosystem services Global impacts Presentation and reporting of indicators1
The options/discussion papers, plus other relevant material, were provided as background documents to participants for review prior to the meeting. All working group sessions commenced with a presentation to introduce the thematic area and highlight the specific objectives of the working group. The nominated Chair then led the working group through a series of pre-identified questions, exercises or open dialogue, with all pertinent points being recorded. Each group presented a summary of the key discussion points and recommendations during plenary, with further questions and comments invited from all Forum participants.
4 It was felt it would be beneficial to seek comments and suggestions from all Forum participants on this topic, and so working group sessions were conducted on both days of the Forum.
5

JNCC Contract: C12-0230-0595. Report of the 6th UK Biodiversity Indicators Forum
3 Key Discussion Points and Recommendations from Working GroupsEach sub-section below provides a brief introduction to the rationale and/or challenges faced in developing options for each of the indicators. Following this, the questions presented to each working group for consideration are listed, together with a summary of the key points and/or recommendations that arose during discussions.
3.1 Habitat Connectivity IndicatorPaper Author: Richard Smithers (Ricardo-AEA)Working Group Chair: James Williams (JNCC)Working Group Members: see Annex 1.The options paper prepared for the habitat connectivity indicator presents three options relevant to the UK’s obligation to report on Aichi Targets 55 and 116 of the CBD Strategic Plan for Biodiversity 2011-2020. The three options, plus the specific questions that were discussed by Habitat Connectivity working group are presented in Table 2.
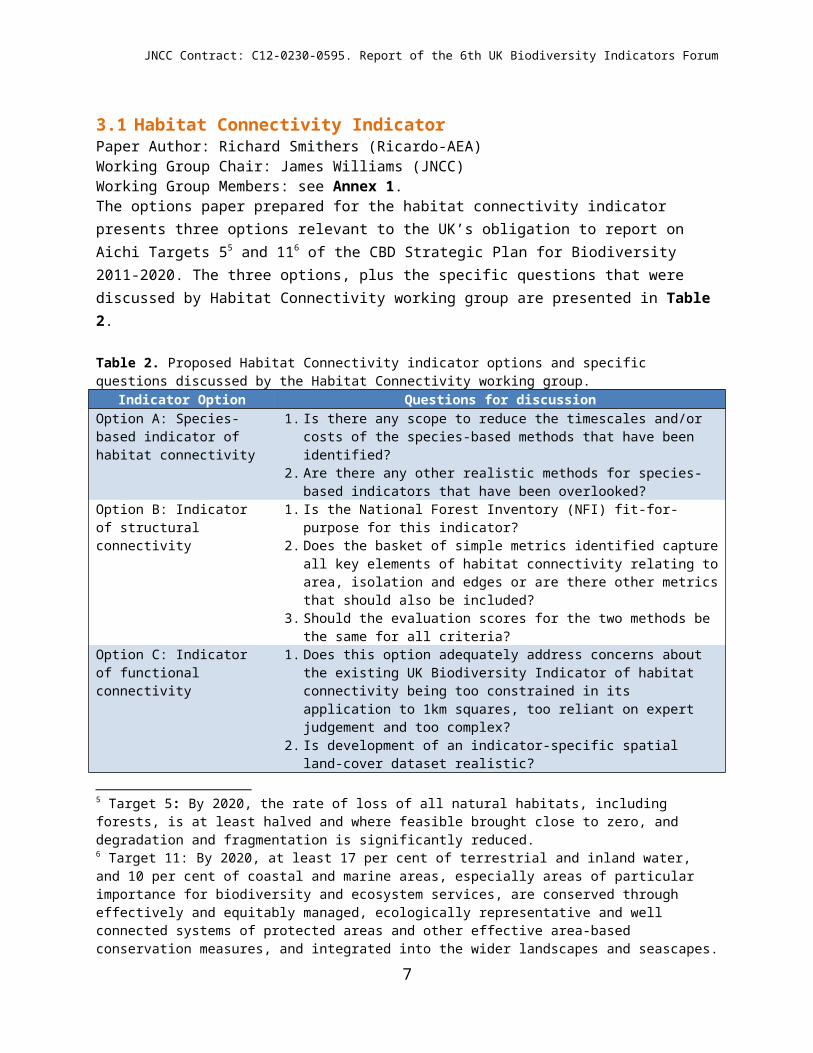
Table 2. Proposed Habitat Connectivity indicator options and specific questions discussed by the Habitat Connectivity working group.
Indicator Option Questions for discussionOption A: Species-based indicator of habitat connectivity
1. Is there any scope to reduce the timescales and/or costs of the species-based methods that have been identified?
2. Are there any other realistic methods for species-based indicators that have been overlooked?
Option B: Indicator of structural connectivity
1. Is the National Forest Inventory (NFI) fit-for-purpose for this indicator?2. Does the basket of simple metrics identified capture all key elements of
habitat connectivity relating to area, isolation and edges or are there other metrics that should also be included?
3. Should the evaluation scores for the two methods be the same for all criteria?
Option C: Indicator of functional connectivity
1. Does this option adequately address concerns about the existing UK Biodiversity Indicator of habitat connectivity being too constrained in its application to 1km squares, too reliant on expert judgement and too complex?
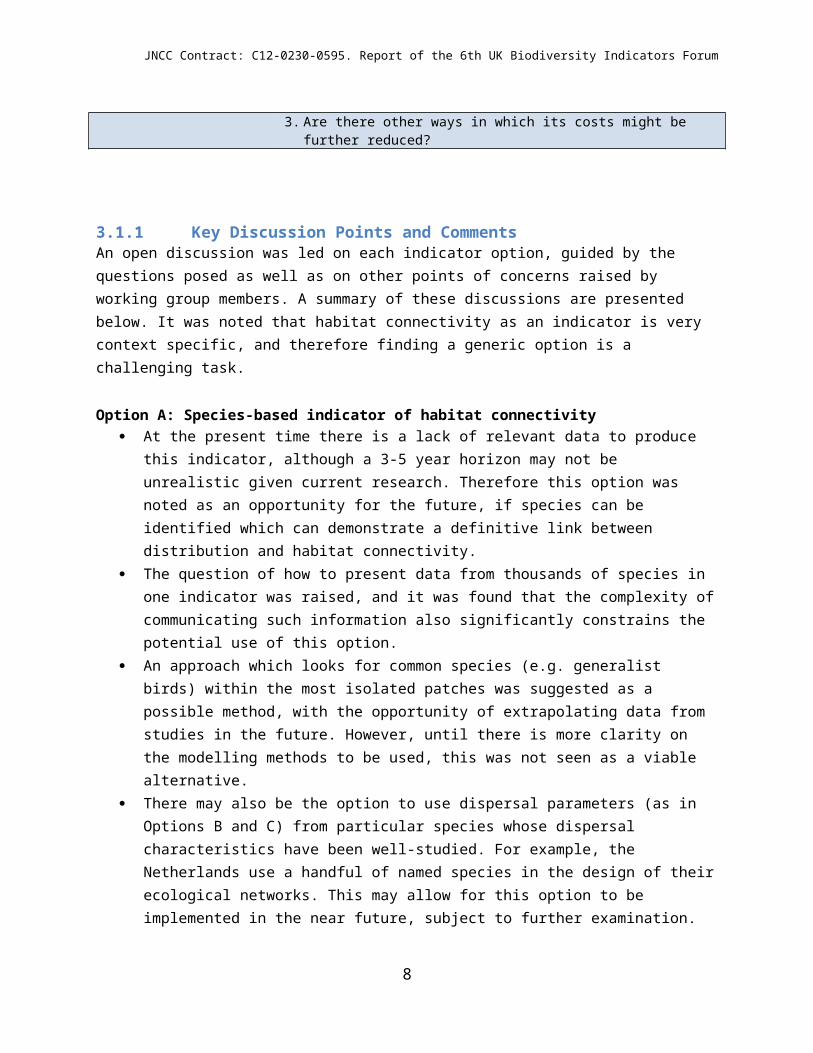
2. Is development of an indicator-specific spatial land-cover dataset realistic? 3. Are there other ways in which its costs might be further reduced?
5 Target 5: By 2020, the rate of loss of all natural habitats, including forests, is at least halved and where feasible brought close to zero, and degradation and fragmentation is significantly reduced.6 Target 11: By 2020, at least 17 per cent of terrestrial and inland water, and 10 per cent of coastal and marine areas, especially areas of particular importance for biodiversity and ecosystem services, are conserved through effectively and equitably managed, ecologically representative and well connected systems of protected areas and other effective area-based conservation measures, and integrated into the wider landscapes and seascapes.
6
JNCC Contract: C12-0230-0595. Report of the 6th UK Biodiversity Indicators Forum
3.1.1 Key Discussion Points and CommentsAn open discussion was led on each indicator option, guided by the questions posed as well as on other points of concerns raised by working group members. A summary of these discussions are presented below. It was noted that habitat connectivity as an indicator is very context specific, and therefore finding a generic option is a challenging task.
Option A: Species-based indicator of habitat connectivity At the present time there is a lack of relevant data to produce this indicator, although a 3-5 year
horizon may not be unrealistic given current research. Therefore this option was noted as an opportunity for the future, if species can be identified which can demonstrate a definitive link between distribution and habitat connectivity.
The question of how to present data from thousands of species in one indicator was raised, and it was found that the complexity of communicating such information also significantly constrains the potential use of this option.
An approach which looks for common species (e.g. generalist birds) within the most isolated patches was suggested as a possible method, with the opportunity of extrapolating data from studies in the future. However, until there is more clarity on the modelling methods to be used, this was not seen as a viable alternative.
There may also be the option to use dispersal parameters (as in Options B and C) from particular species whose dispersal characteristics have been well-studied. For example, the Netherlands use a handful of named species in the design of their ecological networks. This may allow for this option to be implemented in the near future, subject to further examination.
Option B: Indicator of structural connectivity Option B was deemed to be superficially attractive as a basic indicator of how land use changes
on an annual basis. However there was some concern raised that it only covers a single habitat, and if this became
the sole measure of habitat connectivity. Other disadvantages include that it does not take into account associated habitat quality or the intervening matrix.
So while it could be considered as an interim ‘quick-fix’ solution, it was felt that consideration would need to be given to how the indicator could be taken forward into the future and/or that supplementary indicators would need to be developed.
It was agreed that when considering the use of this indicator area and core area should be focussed on, rather than patch number.
It was recommended that simple metrics be used. One significant advantage is that the data required for this indicator (percentage of forest
sustainably managed and data from the National Forest Inventory) are available and updated annually.
7
JNCC Contract: C12-0230-0595. Report of the 6th UK Biodiversity Indicators Forum
Option C: Indicator of functional connectivity An indicator of functional connectivity was identified as best practice and was noted as
addressing concerns about the existing habitat connectivity indicator’s application to 1km squares, reliance on expert judgement and complexity.
However this option is data-hungry and there is a need to resolve the issue of getting a useable data set on a more frequent time scale. The implementation of the indicator may be expensive, but broader use of this data through other applications (e.g. a policy framework which requires good land use data) would provide better value for money overall.
If a data set for this option existed, other existing biodiversity indicators could also be reviewed and improved. For example this work could potentially link to corresponding work underway by Prof. Ian Bateman (University of East Anglia) on land use as well as current ongoing work at Scottish Natural Heritage.
An ‘off the shelf’ classification of habitat type, which may contain some errors, would be cheaper than a customised classification. As long as the method is repeatable, signals of land cover change over time would still be detected which would fulfil the basic function of the indicator. One option for obtaining this type of data is that from the European satellite which will supply annual data at little or no cost – however this will not be operation until after 2014.
Despite some clarification on the term ‘Mean Connectivity Value’ being required, the overall view was that this indicator is well developed and justified.
3.1.2 Summary and RecommendationsThe general consensus of the working group was that:
Option C is the most suitable choice to take forward at this stage Option B was considered to be more of a short-term solution; and Option A requires further research to determine future possibilities.
The cost implications of combining all three options, together with the potential problems in keeping the data recent, meant this was not seen as a viable alternative.
3.2 Climate Change Adaptation IndicatorPaper Author: Richard Smithers (Ricardo-AEA)Working Group Chair: Mark Stevenson (Defra)Working Group Members: see Annex 1.
Initial work on identifying options for developing indicators for climate change adaptation that could be used to monitor progress towards Aichi Target 107 (in addition to others) raised a number of challenges. These were synthesised in a discussion paper and presented to the working group on climate change
7 Target 10: By 2015, the multiple anthropogenic pressures on coral reefs, and other vulnerable ecosystems impacted by climate change or ocean acidification are minimized, so as to maintain their integrity and functioning.
8
JNCC Contract: C12-0230-0595. Report of the 6th UK Biodiversity Indicators Forum
adaptation at the Forum for review, and suggestions invited on how to take the proposed indicator options forward. The specific questions used to guide the working group discussions included:
1. What are we trying to indicate?8
2. Are there further sources of suitable data that have not been considered that would address those issues in relation to “preparedness for climate change adaptation” that were identified by the workshop?
3. Would it be appropriate to present the basket of existing and proposed UK Biodiversity Indicators that already address England Biodiversity Strategy Climate Change Adaptation (EBSCCA) principles as one option for monitoring progress against Aichi Target 10, and if so, how should this be presented?
4. Which of the gaps in the UK biodiversity indicator set, highlighted by revisiting the EBSCCA Principles, should be considered for development of potential indicator options?
5. Are there other options? If so what data could support them?
The five options proposed included developing an indicator of:
A. Wildfire incidenceB. Gains and losses in coastal habitatsC. Water availability for biodiversityD. The use of a Carbon-based indicator to reflect and integrate adaptation and mitigation measuresE. The use of an indicator reflecting buffer zones around high quality habitats.
3.2.1 Key Discussion Points and CommentsWorking group members were asked to provide answers/opinions/suggestions to each of the proposed questions on post-it notes. These were then collated and discussed amongst the group. Key points are summarised below.
What are we trying to indicate? To achieve some clarity on this question, Aichi Target 10 was deconstructed by the working
group. It was concluded that the main objective of Target 10 is to maintain integrity and functioning of vulnerable habitats, plus minimising anthropogenic pressures on these habitats. It was felt that most of this information is available in the existing indicator set and that a process-indicator might be more informative and immediate than an outcome-indicator. Policies need to be developed and implemented proactively in relation to climate change adaptation and confounding variables and lags in response times may challenge the development of meaningful outcome-indicators.
8 Note, during preliminary discussions amongst the working group, it was felt that this question should be added to the list of pre-conceived questions to help clarify the objective of the indicator with regards to whether it should reflect outcomes or processes.
9
JNCC Contract: C12-0230-0595. Report of the 6th UK Biodiversity Indicators Forum
In regards to policy interventions, it was felt that most interventions are not specific to climate change adaptation – i.e. the focus of the intervention is on other elements, e.g. improving connectivity between habitats. However there are some, such as managed realignment and risk management (e.g. for wildfires or protected site condition). If additional adaptation indicators are to be developed, it was felt these should focus on specific actions to maintain ‘integrity and function’.
Further sources of additional data.Additional sources of data identified that might be suitable for a climate change adaptation indicator included:
Protected Area management plans Landscape scale schemes As biodiversity will respond to changes in land-use that may be a result of climate change, data
on change in cropping patterns or types of crops grown could be useful Area/rate of re(creation) of key habitats – e.g. hedgerows, ponds, such as that collected by
Natural England.
Is it possible to draw on existing or proposed indicators that address the EBSCCA principles?The five EBSCCA principles include:
Take practical action now Maintain resilience and increase ecological resilience Accommodate change Integrate action across all sectors Develop knowledge and plan strategically
It was proposed that a narrative on climate change adaptation could be derived from the existing indicators, although until there is a better understanding of the knowledge base in regards to ‘preparedness’ it will difficult to attribute climate change to any observed trends.
It was also noted that information could also be drawn from national adaptation plans.What are the options? Where are the gaps?A summary of the working groups’ evaluation generated during discussion on the five indicators that had been proposed as potential indicators of climate change adaptation are presented in Table 3.
3.2.2 Summary and RecommendationsThe working group favoured an approach by narrative based on existing indicators coupled with information about adaptation actions, supplemented with one of the favoured options outlined above.
10

JNCC Contract: C12-0230-0595. Report of the 6th UK Biodiversity Indicators Forum
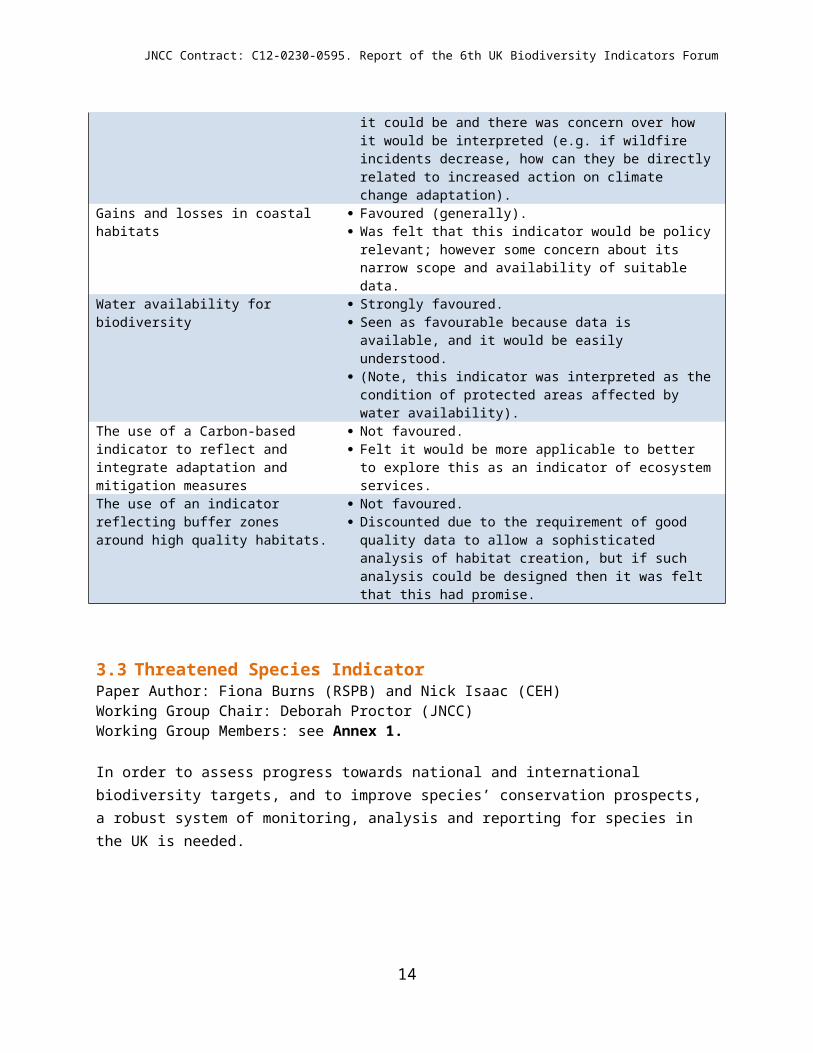
Table 3. Evaluation of proposed climate change adaptation indicators.Indicator EvaluationWildfire incidence Not favoured.
Although it was felt this indicator could be linked to policy intervention, there was disagreement amongst the group on how useful it could be and there was concern over how it would be interpreted (e.g. if wildfire incidents decrease, how can they be directly related to increased action on climate change adaptation).
Gains and losses in coastal habitats Favoured (generally). Was felt that this indicator would be policy relevant; however
some concern about its narrow scope and availability of suitable data.
Water availability for biodiversity Strongly favoured. Seen as favourable because data is available, and it would be
easily understood. (Note, this indicator was interpreted as the condition of protected
areas affected by water availability).The use of a Carbon-based indicator to reflect and integrate adaptation and mitigation measures
Not favoured. Felt it would be more applicable to better to explore this as an
indicator of ecosystem services.The use of an indicator reflecting buffer zones around high quality habitats.
Not favoured. Discounted due to the requirement of good quality data to allow
a sophisticated analysis of habitat creation, but if such analysis could be designed then it was felt that this had promise.
3.3 Threatened Species IndicatorPaper Author: Fiona Burns (RSPB) and Nick Isaac (CEH)Working Group Chair: Deborah Proctor (JNCC)Working Group Members: see Annex 1.
In order to assess progress towards national and international biodiversity targets, and to improve species’ conservation prospects, a robust system of monitoring, analysis and reporting for species in the UK is needed.
The aim of this indicator(s) is to measure the changing status of threatened species in the UK and its constituent countries for reporting progress against Aichi Target 129.
9 Target 12: By 2020 the extinction of known threatened species has been prevented and their conservation status, particularly of those most in decline, has been improved and sustained.
11
JNCC Contract: C12-0230-0595. Report of the 6th UK Biodiversity Indicators Forum
The Species Indicator Initiative, which has input from both statutory and non-statutory organisations10, has been tasked with developing options for this indicator. To date the Initiative has created a species list from all four UK country biodiversity lists, investigated what type of quantitative species data is available, how trends may be combined and how the indicator(s) may be disaggregated. They have proposed that a ‘tiered’ approach, based on data availability, is taken to assess the changing status of threatened species – i.e. Tier 1 – robust, quantitative abundance data (available for many species); Tier 2 – distribution data (available for >1,000 species from about 10 groups); Tier 3 – semi-qualitative data from assessments of a limited number of species in a variety of forms.
To assist in taking the work of the Initiative forward, the following questions were presented to the species working group for discussion:
1) Should a threatened species indicator(s) combine quantitative and qualitative data? And if so how could that be done?
2) Should the existing wider countryside species indicators (birds, butterflies, bats, plants) be retained or incorporated within the new indicator? Why?
3) How can species data be represented in a clear, transparent, scientifically credible, and statistically robust manner?
3.3.1 Key Discussion Points, Comments and Recommendations An open discussion was led by the chair, guided by the questions above. Key points arising from these discussions are summarized below.
It was noted that: it was difficult to see the level of change in species with the previously used UK Biodiversity Action Plan indicator; that it is known that there are more threatened species than previously; and that Tier 1 abundance data is skewed towards birds, bats and butterflies. Together with making suggestions on how to bring data together to create a meaningful, robust indicator, working group members were asked to keep these points in mind during discussions.
Should a threatened species indicator(s) combine quantitative and qualitative data? And if so how can this be done?
It was the general consensus of the working group that quantitative and qualitative data not be combined in a single metric (but see further point below).
In order to get better taxonomic coverage it was suggested that three types of data be used:
10 Statutory organisations involved: Defra, Welsh Government, JNCC, Natural England, Countryside Council for Wales, Scottish Natural Heritage, Northern Ireland Environment Agency. Non-Governmental Organisations involved: Amphibian & Reptile Conservation, Association of British Fungus Groups, Bat Conservation Trust, Biological Records Centre, British Bryological Society, British Dragonfly Society, British Lichen Society, Botanical Society of the British Isles, British Trust for Ornithology, Buglife, Bumblebee Conservation Trust, Butterfly Conservation, The Conchological Society of Great Britain and Ireland, Hymettus Ltd, Mammal Society, National Biodiversity Network, People's Trust for Endangered Species, Plantlife, Pond Conservation, Rothamsted Research, The Wildlife Trusts. Other groups may be added to this list. The initiative is jointly chaired by RSPB and JNCC.
12

JNCC Contract: C12-0230-0595. Report of the 6th UK Biodiversity Indicators Forum
o Abundance (Birds, Bats and Butterflies) ‘Tier 1’; o Range (insects and plants with a better spread of information) ‘Tier 2’; and o Status (always rare species with more sophisticated methods of analysis used) ‘Tier 3’.
This would require the use of three different metrics, leading to better storytelling to communicate the message of the indicator.
There was confidence shown in this ‘cascade’ model of moving from the Abundance tier, feeding through to the Range tier, with the Status tier being the broadest and most representative.
Another view was also expressed, and which might be worthy of consideration, is that both quantitative and qualitative data could be used to generate indices, which could be easily collated into a single ‘species indicator’. The distinction to make here, would be between the data and indices that are generated from them.
Should the existing wider countryside species (WCS) indicators (birds, butterflies, bats, plants) be retained or incorporated within the new indicator? Why?
Questions of the definition of a WCS were raised with a suggestion that the current WCS requires a ‘tightening up’ of criteria in order to redefine which species are so classified, as this is what will inform the indicator.
The working group agreed that widespread species, which can be associated with an attribute (e.g. habitat, or north/south), are required.
It was also agreed that there is a need to use a consistent approach to data presentation, for example, using a combination of data across taxonomic groups.
The working group was keen to highlight that this would not mean just ‘trashing’ the current indicators, but using a series of steps to replace them over time.
A key point raised during the discussions was that species information should be offered to other indicator working groups in the development of a WCS indicator.
How can species data be represented in a clear, transparent, scientifically credible, and statistically robust manner?
It was suggested that there needs to be a cascade of information within the tiers and the underlying data to aid transparency.
Previously used indicators were seen as poor in terms of representation and therefore lengthy discussions may be required to address this.
Preliminary ideas surrounding the use of supporting information displayed in layers to aid interpretation and to show the data trail were deliberated, with the possibility of applying red list data in a series of stacked charts suggested. However further work to gather the relevant information is required.
13
JNCC Contract: C12-0230-0595. Report of the 6th UK Biodiversity Indicators Forum
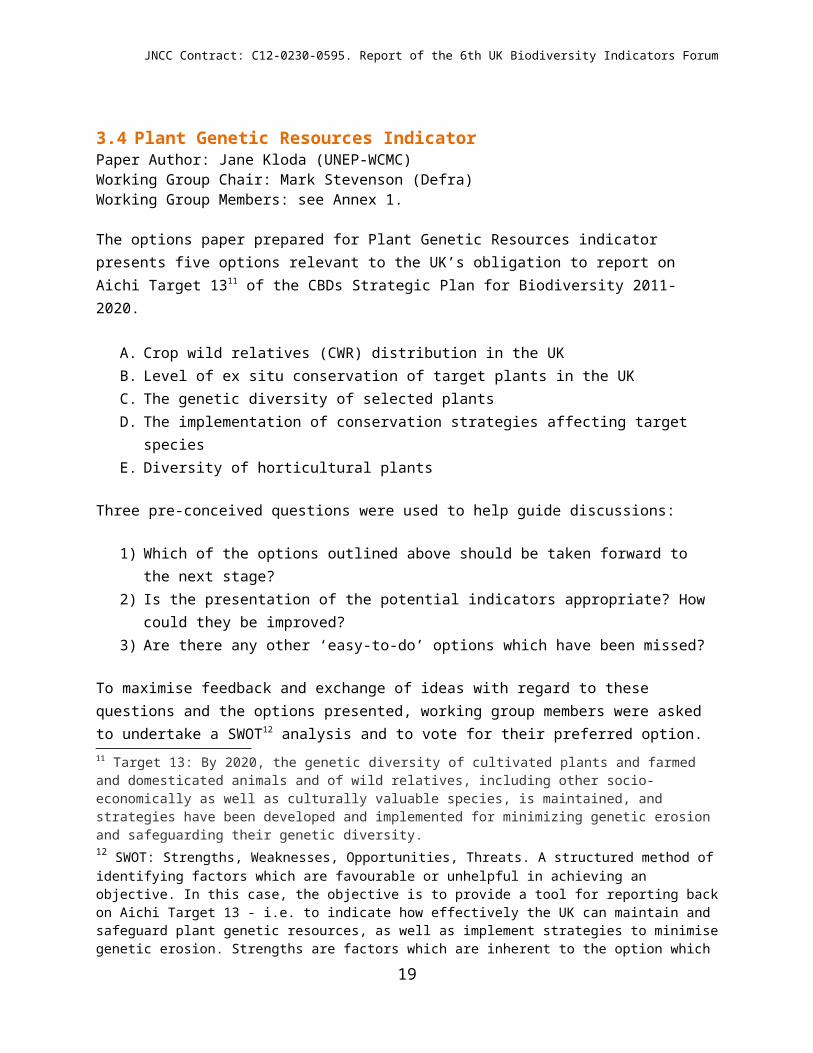
3.4 Plant Genetic Resources Indicator Paper Author: Jane Kloda (UNEP-WCMC)Working Group Chair: Mark Stevenson (Defra)Working Group Members: see Annex 1.
The options paper prepared for Plant Genetic Resources indicator presents five options relevant to the UK’s obligation to report on Aichi Target 1311 of the CBDs Strategic Plan for Biodiversity 2011-2020.
A. Crop wild relatives (CWR) distribution in the UKB. Level of ex situ conservation of target plants in the UKC. The genetic diversity of selected plantsD. The implementation of conservation strategies affecting target speciesE. Diversity of horticultural plants
Three pre-conceived questions were used to help guide discussions:
1) Which of the options outlined above should be taken forward to the next stage?2) Is the presentation of the potential indicators appropriate? How could they be improved?3) Are there any other ‘easy-to-do’ options which have been missed?
To maximise feedback and exchange of ideas with regard to these questions and the options presented, working group members were asked to undertake a SWOT12 analysis and to vote for their preferred option.
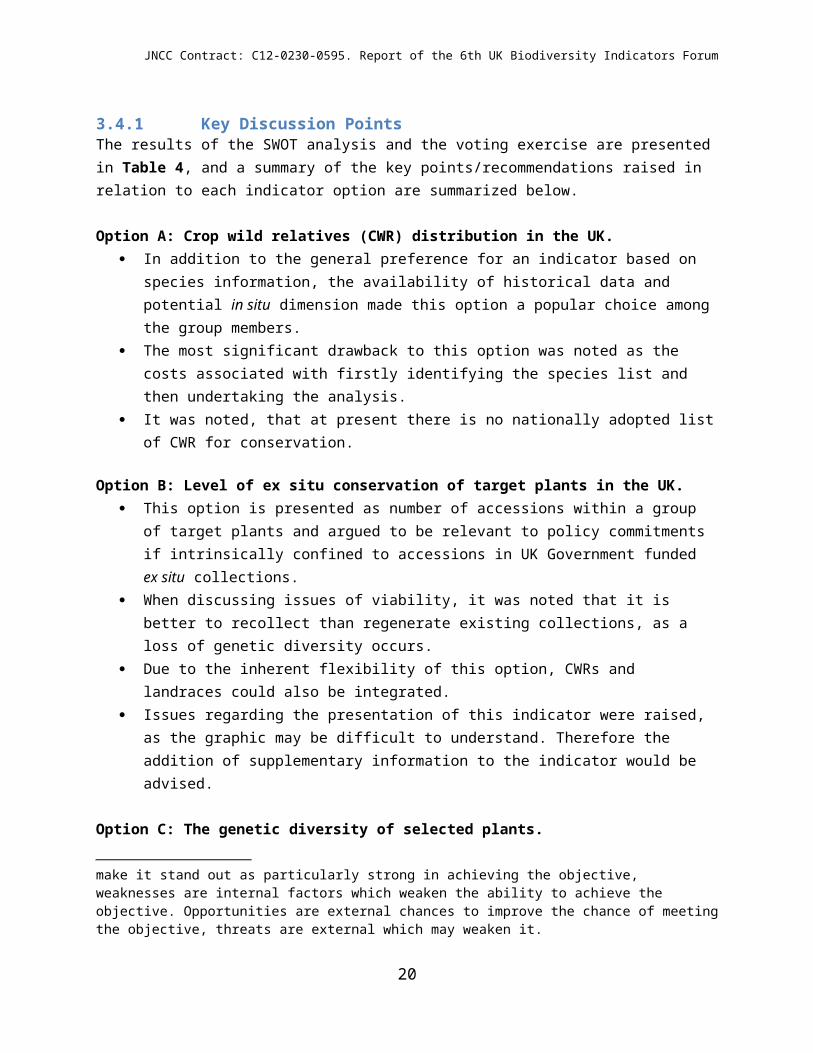
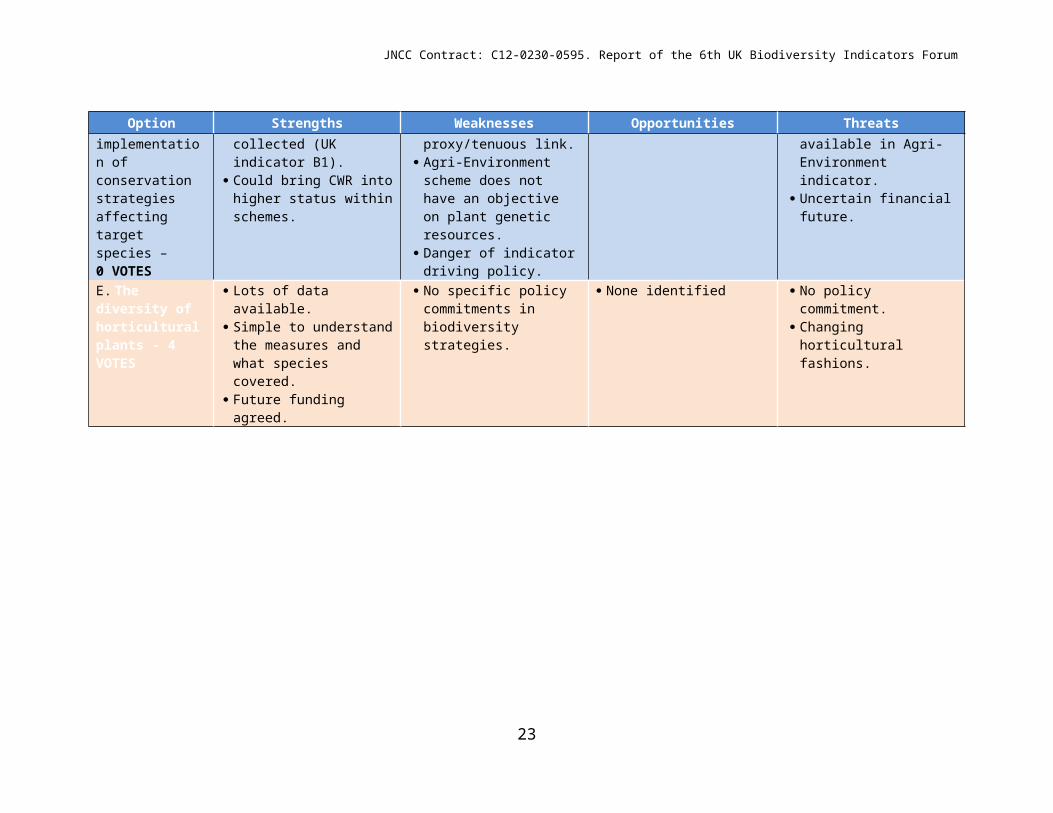
3.4.1 Key Discussion PointsThe results of the SWOT analysis and the voting exercise are presented in Table 4, and a summary of the key points/recommendations raised in relation to each indicator option are summarized below.
Option A: Crop wild relatives (CWR) distribution in the UK. In addition to the general preference for an indicator based on species information, the
availability of historical data and potential in situ dimension made this option a popular choice among the group members.
11 Target 13: By 2020, the genetic diversity of cultivated plants and farmed and domesticated animals and of wild relatives, including other socio-economically as well as culturally valuable species, is maintained, and strategies have been developed and implemented for minimizing genetic erosion and safeguarding their genetic diversity.12 SWOT: Strengths, Weaknesses, Opportunities, Threats. A structured method of identifying factors which are favourable or unhelpful in achieving an objective. In this case, the objective is to provide a tool for reporting back on Aichi Target 13 - i.e. to indicate how effectively the UK can maintain and safeguard plant genetic resources, as well as implement strategies to minimise genetic erosion. Strengths are factors which are inherent to the option which make it stand out as particularly strong in achieving the objective, weaknesses are internal factors which weaken the ability to achieve the objective. Opportunities are external chances to improve the chance of meeting the objective, threats are external which may weaken it.
14

JNCC Contract: C12-0230-0595. Report of the 6th UK Biodiversity Indicators Forum
The most significant drawback to this option was noted as the costs associated with firstly identifying the species list and then undertaking the analysis.
It was noted, that at present there is no nationally adopted list of CWR for conservation.
Option B: Level of ex situ conservation of target plants in the UK. This option is presented as number of accessions within a group of target plants and argued to
be relevant to policy commitments if intrinsically confined to accessions in UK Government funded ex situ collections.
When discussing issues of viability, it was noted that it is better to recollect than regenerate existing collections, as a loss of genetic diversity occurs.
Due to the inherent flexibility of this option, CWRs and landraces could also be integrated. Issues regarding the presentation of this indicator were raised, as the graphic may be difficult to
understand. Therefore the addition of supplementary information to the indicator would be advised.
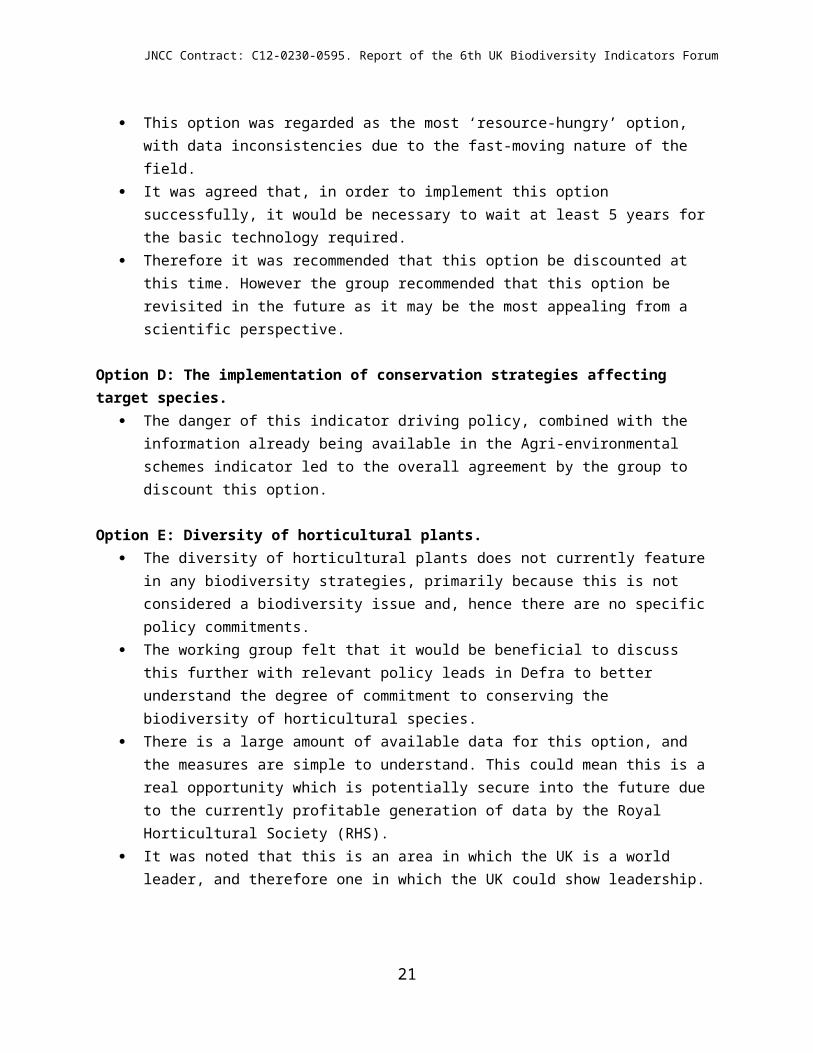
Option C: The genetic diversity of selected plants. This option was regarded as the most ‘resource-hungry’ option, with data inconsistencies due to
the fast-moving nature of the field. It was agreed that, in order to implement this option successfully, it would be necessary to wait
at least 5 years for the basic technology required. Therefore it was recommended that this option be discounted at this time. However the group
recommended that this option be revisited in the future as it may be the most appealing from a scientific perspective.
Option D: The implementation of conservation strategies affecting target species. The danger of this indicator driving policy, combined with the information already being
available in the Agri-environmental schemes indicator led to the overall agreement by the group to discount this option.
Option E: Diversity of horticultural plants. The diversity of horticultural plants does not currently feature in any biodiversity strategies,
primarily because this is not considered a biodiversity issue and, hence there are no specific policy commitments.
The working group felt that it would be beneficial to discuss this further with relevant policy leads in Defra to better understand the degree of commitment to conserving the biodiversity of horticultural species.
There is a large amount of available data for this option, and the measures are simple to understand. This could mean this is a real opportunity which is potentially secure into the future due to the currently profitable generation of data by the Royal Horticultural Society (RHS).
It was noted that this is an area in which the UK is a world leader, and therefore one in which the UK could show leadership.
15
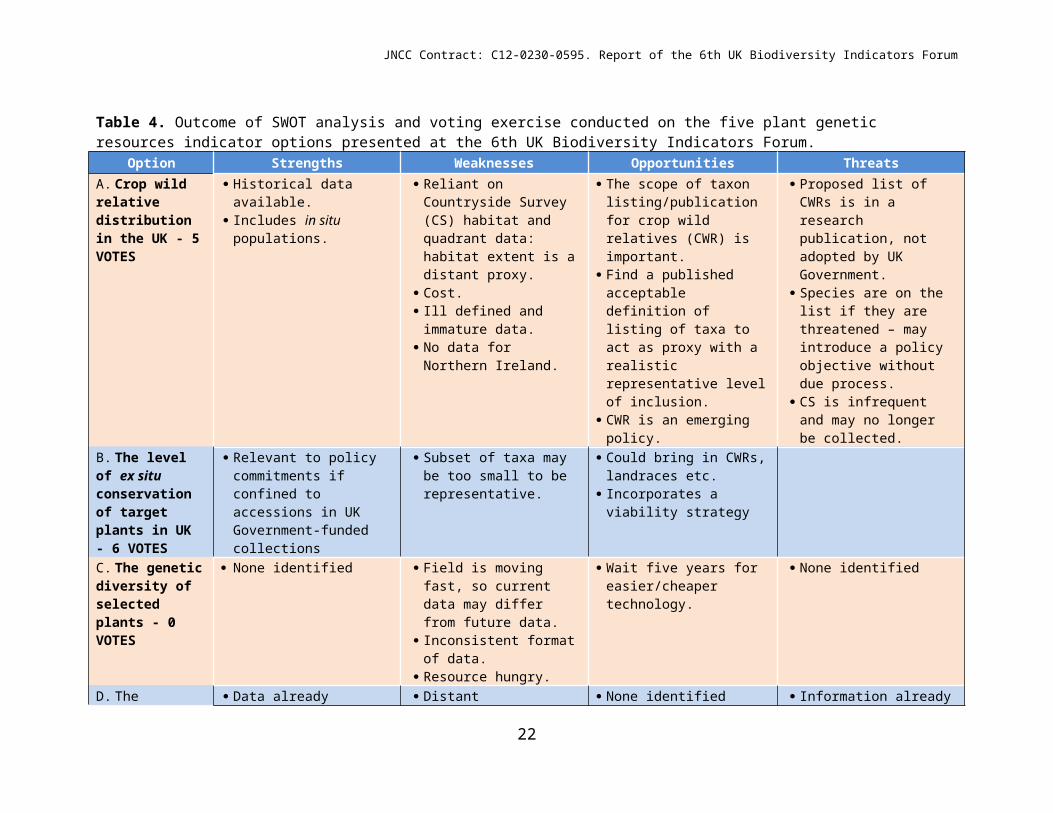
JNCC Contract: C12-0230-0595. Report of the 6th UK Biodiversity Indicators Forum
Table 4. Outcome of SWOT analysis and voting exercise conducted on the five plant genetic resources indicator options presented at the 6th UK Biodiversity Indicators Forum.
Option Strengths Weaknesses Opportunities ThreatsA. Crop wild relative distribution in the UK - 5 VOTES
Historical data available. Includes in situ populations.
Reliant on Countryside Survey (CS) habitat and quadrant data: habitat extent is a distant proxy.
Cost. Ill defined and immature
data. No data for Northern
Ireland.
The scope of taxon listing/publication for crop wild relatives (CWR) is important.
Find a published acceptable definition of listing of taxa to act as proxy with a realistic representative level of inclusion.
CWR is an emerging policy.
Proposed list of CWRs is in a research publication, not adopted by UK Government.
Species are on the list if they are threatened – may introduce a policy objective without due process.
CS is infrequent and may no longer be collected.
B. The level of ex situ conservation of target plants in UK - 6 VOTES
Relevant to policy commitments if confined to accessions in UK Government-funded collections
Subset of taxa may be too small to be representative.
Could bring in CWRs, landraces etc.
Incorporates a viability strategy
C. The genetic diversity of selected plants - 0 VOTES
None identified Field is moving fast, so current data may differ from future data.
Inconsistent format of data. Resource hungry.
Wait five years for easier/cheaper technology.
None identified
D. The implementation of conservation strategies affecting target species – 0 VOTES
Data already collected (UK indicator B1).
Could bring CWR into higher status within schemes.
Distant proxy/tenuous link. Agri-Environment scheme
does not have an objective on plant genetic resources.
Danger of indicator driving policy.
None identified Information already available in Agri-Environment indicator.
Uncertain financial future.
E. The diversity of horticultural plants - 4 VOTES
Lots of data available. Simple to understand the
measures and what species covered.
Future funding agreed.
No specific policy commitments in biodiversity strategies.
None identified No policy commitment. Changing horticultural
fashions.
16
JNCC Contract: C12-0230-0595. Report of the 6th UK Biodiversity Indicators Forum
3.4.2 Summary and RecommendationsKey recommendations regarding each option can be summarized by the following:
Option A was considered to be the most effective way of monitoring the genetic diversity of in situ crop wild relatives, covering a wide geographical scale and having an already well-established time series.
Option B was considered to be a good indicator for ex situ conservation, covering a wide range of plant types and uses.
Option C was considered to be the most direct measure of genetic diversity, however it was considered the technology required to make this a feasible low-cost solution was not yet ready, though emerging technologies may make this an option for the near future.
Option D was considered to be an indirect measure of conservation strategies which might affect plant genetic resources and was already covered by the UK indicator on Agri-Environment schemes.
Option E was considered to be the most effective measure of genetic diversity of horticultural plants, was simple to understand, data were already available and future funding has been agreed for the key data source.
Overall, indicators A, B and E were recommended as the strongest indicators of the status of UK plant genetic resources, although further examination of potential weaknesses and data sources needs to be undertaken. It is also advised that progress towards the technology required to implement option C be tracked in order to revisit this option in the future.
3.5 Ecosystem Services IndicatorPaper Author: Megan Tierney (UNEP-WCMC)Working Group Chair: Diana Mortimer (JNCC)Working Group Members: see Annex 1.
There is a need to identify options for developing indicators of the status of ecosystems that provide essential services so that the UK (and devolved administrations) can meet national and international commitments to monitoring progress towards biodiversity targets – in particular, Aichi Target 1413 of the Strategic Plan for Biodiversity 2011-2020.
Initial work on identifying options for developing indicators of the status of ecosystems that provide essential services and which could be used to monitor progress towards Aichi Target 14 (in addition to others) raised a number of challenges. These were synthesized in a discussion paper and presented to the working group on ecosystem services at the Forum for review and suggestions on how to move forward in terms of developing relevant indicator options.
13 Target 14: By 2020, ecosystems that provide essential services, including services related to water, and contribute to health, livelihoods and well-being, are restored and safeguarded, taking into account the needs of women, indigenous and local communities, and the poor and vulnerable.
17

JNCC Contract: C12-0230-0595. Report of the 6th UK Biodiversity Indicators Forum
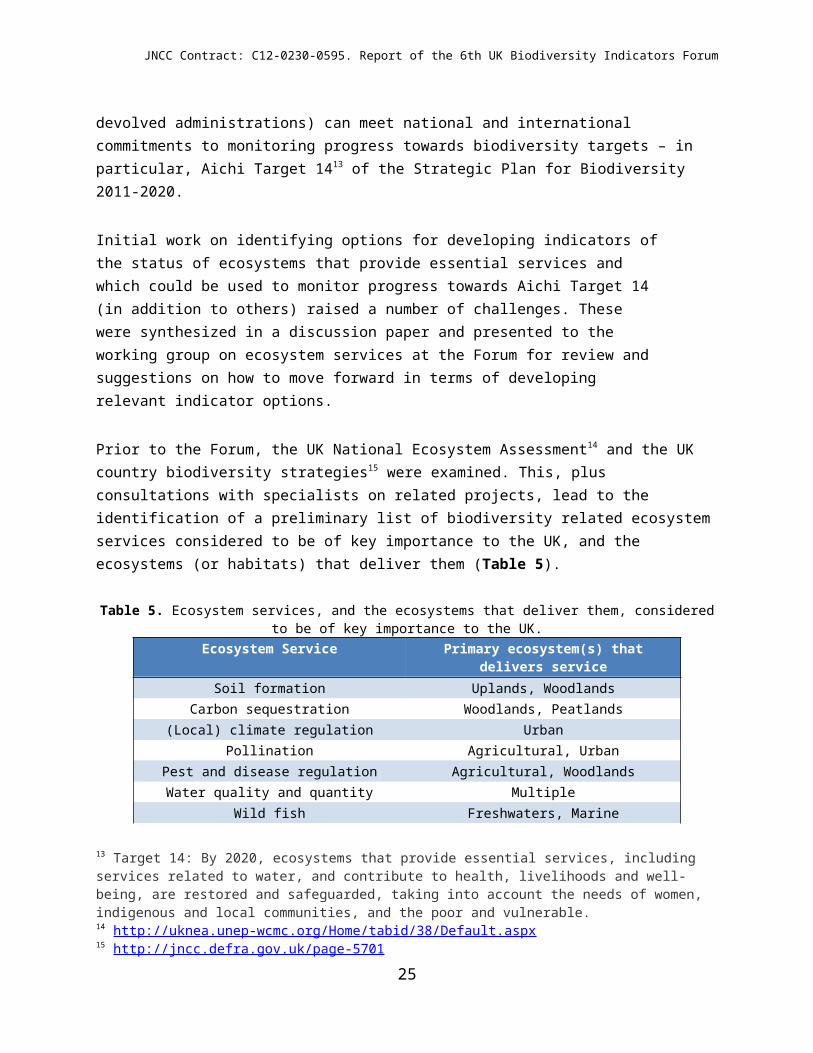
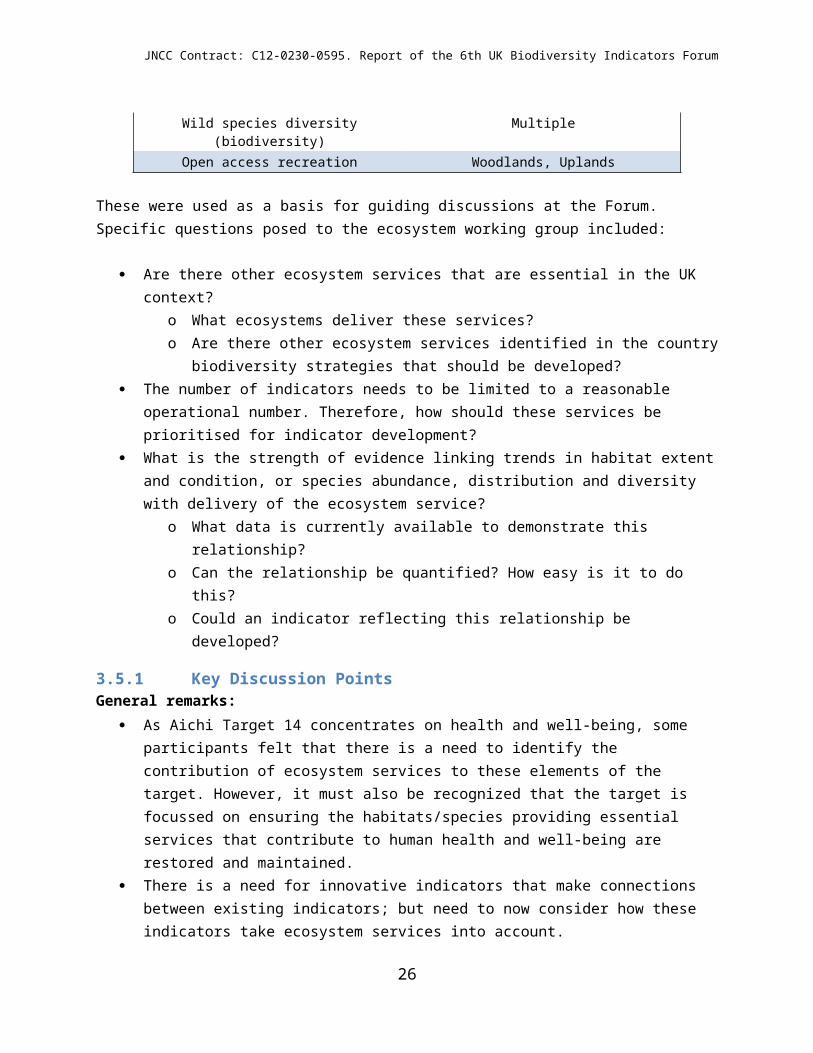
Prior to the Forum, the UK National Ecosystem Assessment14 and the UK country biodiversity strategies15 were examined. This, plus consultations with specialists on related projects, lead to the identification of a preliminary list of biodiversity related ecosystem services considered to be of key importance to the UK, and the ecosystems (or habitats) that deliver them (Table 5).
Table 5. Ecosystem services, and the ecosystems that deliver them, considered to be of key importance to the UK.Ecosystem Service Primary ecosystem(s) that delivers service
Soil formation Uplands, WoodlandsCarbon sequestration Woodlands, Peatlands
(Local) climate regulation UrbanPollination Agricultural, Urban
Pest and disease regulation Agricultural, WoodlandsWater quality and quantity Multiple
Wild fish Freshwaters, MarineWild species diversity (biodiversity) Multiple
Open access recreation Woodlands, Uplands
These were used as a basis for guiding discussions at the Forum. Specific questions posed to the ecosystem working group included:
Are there other ecosystem services that are essential in the UK context? o What ecosystems deliver these services?o Are there other ecosystem services identified in the country biodiversity strategies that
should be developed? The number of indicators needs to be limited to a reasonable operational number. Therefore,
how should these services be prioritised for indicator development? What is the strength of evidence linking trends in habitat extent and condition, or species
abundance, distribution and diversity with delivery of the ecosystem service?o What data is currently available to demonstrate this relationship?o Can the relationship be quantified? How easy is it to do this?o Could an indicator reflecting this relationship be developed?
3.5.1 Key Discussion Points General remarks:
As Aichi Target 14 concentrates on health and well-being, some participants felt that there is a need to identify the contribution of ecosystem services to these elements of the target. However, it must also be recognized that the target is focussed on ensuring the habitats/species providing essential services that contribute to human health and well-being are restored and maintained.
14 http://uknea.unep-wcmc.org/Home/tabid/38/Default.aspx15 http://jncc.defra.gov.uk/page-5701
18
JNCC Contract: C12-0230-0595. Report of the 6th UK Biodiversity Indicators Forum
There is a need for innovative indicators that make connections between existing indicators; but need to now consider how these indicators take ecosystem services into account.
Likely that there will be a need to adapt the indicator over time as our understanding of ecosystem services improves, or as new issues come to light.
Are there are other ecosystem services that are essential in the UK context? There was general acceptance that the ecosystem services listed in Table 5 included the highest
priority essential services for the UK. However, it was felt that the following caveat needed to be added: there are many other
important ecosystem services that don’t currently have indicators; it may be necessary to review these in the future.
It should be also be noted that ‘provisioning’ ecosystem services were not considered; this is not because they are not seen as important, but because it is felt these are adequately monitored by other indicators (biodiversity and other).
Prioritisation of services for indicator development As it will be important to limit the number of indicators to a reasonable operational number,
working group members were asked to prioritise the list of services in Table 5. This was achieved through a voting exercise, followed by discussion. When voting, working group members were asked to keep in mind whether data would be available to develop an indicator for this service.
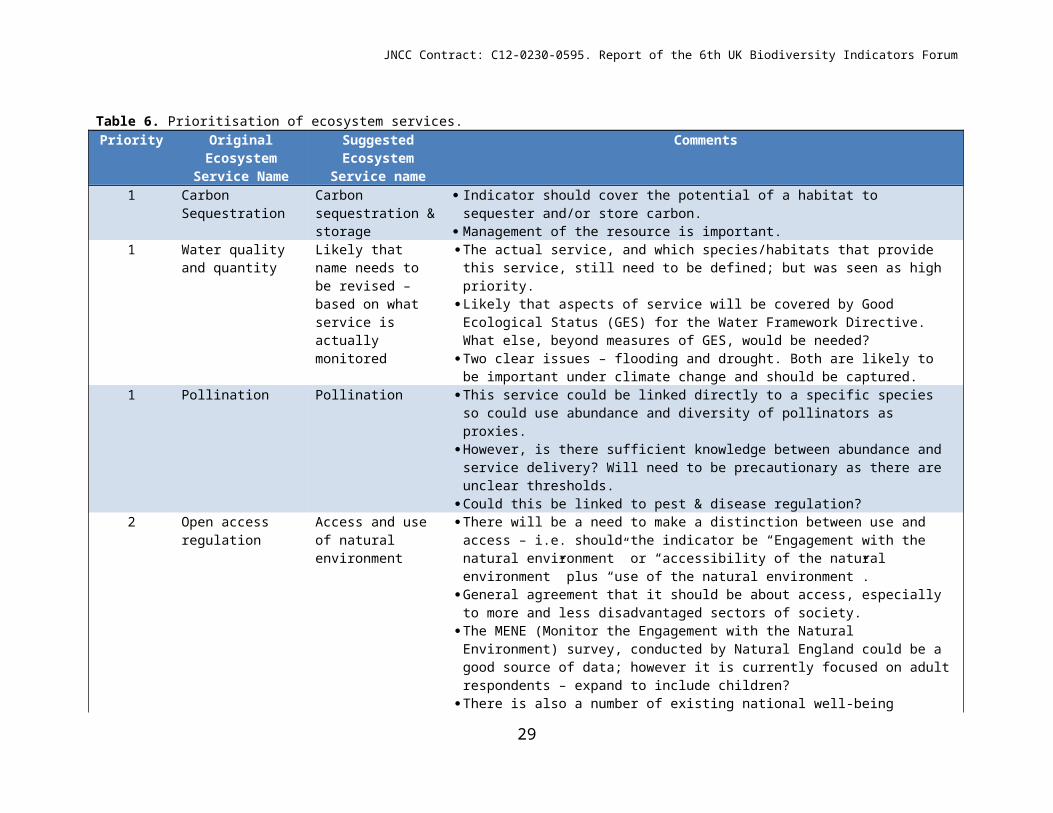
Table 6 shows how the services were prioritised. Discussions following the prioritisation exercise covered: what an indicator for this service would include; whether the name of the service needed to be revised; and justification for the votes cast. The main points raised in discussion around these issues are also presented in Table 6.
Note, the working group felt it was premature at this stage to try and identify the primary ecosystems (habitats) that provide these services – this will be dependent on the focus of the indicator and available data.
3.5.2 Summary and RecommendationsIn order to take this work forward it is proposed that a second workshop be held to refine the indicator options, including identification of potential data sources and how metrics might be best portrayed, based on the outcomes and recommendations from the Forum ecosystem services working group.
19
JNCC Contract: C12-0230-0595. Report of the 6th UK Biodiversity Indicators Forum
Table 6. Prioritisation of ecosystem services.Priority Original Ecosystem
Service NameSuggested Ecosystem
Service nameComments
1 Carbon Sequestration Carbon sequestration & storage
Indicator should cover the potential of a habitat to sequester and/or store carbon. Management of the resource is important.
1 Water quality and quantity
Likely that name needs to be revised – based on what service is actually monitored
The actual service, and which species/habitats that provide this service, still need to be defined; but was seen as high priority.
Likely that aspects of service will be covered by Good Ecological Status (GES) for the Water Framework Directive. What else, beyond measures of GES, would be needed?
Two clear issues – flooding and drought. Both are likely to be important under climate change and should be captured.
1 Pollination Pollination This service could be linked directly to a specific species so could use abundance and diversity of pollinators as proxies.
However, is there sufficient knowledge between abundance and service delivery? Will need to be precautionary as there are unclear thresholds.
Could this be linked to pest & disease regulation?2 Open access
regulationAccess and use of natural environment
There will be a need to make a distinction between use and access – i.e. should the indicator be “Engagement with the natural environment” or “accessibility of the natural environment” plus “use of the natural environment”.
General agreement that it should be about access, especially to more and less disadvantaged sectors of society.
The MENE (Monitor the Engagement with the Natural Environment) survey, conducted by Natural England could be a good source of data; however it is currently focused on adult respondents – expand to include children?
There is also a number of existing national well-being indicators that could be used.3 Soil formation Soil formation, sealing
& erosion Indicator would need to consider formation, erosion, compaction and sealing. It may be that the indicator should consider soil stability In terms of soil sustainability – there are a number of existing negative indicators of soil
health/sustainability that could be considered– e.g. erosion, acidity, nutrient enrichment Measuring whether soil is in good condition or not will be dependent on what it is
expected to support – i.e. maintenance of desired purpose; e.g. acidic soils are considered good in some cases; poor in others.
There was some debate over whether it is possible to measure soil stocks.
20
JNCC Contract: C12-0230-0595. Report of the 6th UK Biodiversity Indicators Forum
Priority Original Ecosystem Service Name
Suggested Ecosystem Service name
Comments
4 (Local) Climate Change
Urban Space Ideally, indicator should focus on local climate, air quality and human health; possibly urban space indicator, where structural variety in urban green space can be linked to health benefits, air quality, particulate removal, shading, temperature regulation.
Data on trees in the urban environment (and their role in climate regulation) could be used.
Green space network mapping data could also be used, as well as data on green roofs.
- Pest & disease regulation
Pest & disease regulation
Did not receive any votes – not because this is not seen as important, but the general consensus was that the causal link to biodiversity would be difficult to make and measure.
- Wild fish Wild fish Did not receive any votes – not because this is not seen as important, but the general consensus was that this is likely to be covered elsewhere.
Also questions over whether you would measure extraction (a value of the Ecosystem Services) or the population (Ecosystem Services potential). The question would remain as to whether one would be measuring wild fish as a provisioning or cultural service. There were also questions about why wild fish were singled out – if other species were included, it may move up the priority list.
- Wild species diversity Wild species diversity Did not receive any votes – not because this is not seen as important, but the general consensus was that this is likely to be covered elsewhere.
21
JNCC Contract: C12-0230-0595. Report of the 6th UK Biodiversity Indicators Forum
3.6 Global Impacts IndicatorPaper Author: Chris West (York University)Working Group Chair: Ana Delgado (Defra)Working Group Members: see Annex 1.
The UK is becoming increasingly reliant on imported goods and services to satisfy consumer demand. This growing demand, combined with recent and continued liberalisation of global trade, has resulted in a complex network of supply chains that cause pressure on biodiversity and ecosystems (beyond the UK’s borders). It has therefore been proposed that there is a need to produce a methodology for linking imports to geographically-defined impacts on biodiversity in order to provide an indicator for the impact of consumption on overseas biodiversity.
The discussion paper prepared for the Global Impacts working group detailed the methodology that has been explored for developing a global impacts biodiversity indicator. Three exercises were undertaken by the working group:
1. Open discussion on the assumptions and limitations of proposed model.2. Open discussion on utility of model as a biodiversity indicator3. Voting exercise to identify which of the Aichi Targets this indicator would be most relevant to.
3.6.1 Key Discussion Points and CommentsThe main points raised in discussion following the three exercises are summarised below.
Limitations and AssumptionsThree main points in regards to the assumptions and limitations of the model were discussed:
i) Quality/Robustness (model assumptions): o Model assumptions were found to be inevitable, due to the current data available, but
there is a clear objective to make the best possible assumptions to maintain transparency (i.e. methodology should not be a black box).
o The point was made that, where no direct measurement is possible, it is better to have a good proxy than no indicator at all.
o The methodology is transferable, and so datasets can be refined over the long term to improve confidence.
o As the database is currently updated every four years, such refinements are possible, and could be enhanced with evolving technological capacity.
ii) Reliability (time lags):o It is a function of the model that it will show what the effect of UK policies were four
years previously.o The lag might not include major shifts in the trends of commodities, a change in market
drivers or the effects of a recession.
22
JNCC Contract: C12-0230-0595. Report of the 6th UK Biodiversity Indicators Forum
o There may be a means of compensating for this whereby annual updates can be made and the model recalibrated once the data has been published (latest data is for 2007).
o Model is dependent on the reliability other data sets – will therefore have to work closely with data providers.
iii) Communication (single or aggregate indicators):o From a product perspective, the use of single or aggregate indicators principally
depends on user requirements and on what scale the indicator will be used (e.g. country level, regional level etc).
o It will be possible to highlight high level patterns of impacts on biodiversity by location and sector, and subsequently use further analysis to assist policy making.
o Aggregate indicators can hide variation or conflicting issues – therefore if an aggregate indicator is used, consideration will need to be given to how different measures are weighted; however if a multiple measure is considered more appropriate, this should be investigated – i.e. the global indicator does not have to be a single measure.
o The trade-off between making the indicator useful to policy and aggregating too many elements to make it meaningful will need to be considered.
o More work is needed to determine what a cumulative indicator would look like – maintaining transparency is important, and when reporting, it will be important to not only use headline figures but also show what the underlying trends are.
Utility of model as a biodiversity indicator This is the first model to link financial flow to product data, and then link this to impacts on
biodiversity It may also be possible to use different indicator sets for different audiences/sectors If a global indicator of the UK using one or several headline indicators, keeping sectors separate,
is developed, case studies could be used look at impacts on biodiversity at a finer scale. Additional work is required to determine what suite of biodiversity impact indicators would be
suitable/available for each sector.
Relevance of indicator to Aichi Targets The Aichi Targets that received the most votes; asides from target 4, in regards to which ones a
global impacts indicator would be most relevant to Target 216 and Target 517.
16 Target 2: By 2020, at the latest, biodiversity values have been integrated into national and local development and poverty reduction strategies and planning processes and are being incorporated into national accounting, as appropriate, and reporting systems.17 Target 5: By 2020, the rate of loss of all natural habitats, including forests, is at least halved and where feasible brought close to zero, and degradation and fragmentation is significantly reduced.
23
JNCC Contract: C12-0230-0595. Report of the 6th UK Biodiversity Indicators Forum
3.6.2 Summary and Recommendations Further work is needed to determine what a cumulative indicator would look like Further work is also required to identify a suite of biodiversity impact indicators for each sector
which can inform an overall indicator backed up by case study examples. It would be useful to investigate what are the key products of concern to the UK, and analyse
some of this data to assess what the biggest impacts on biodiversity are, and what the rate of change is.
Note-worthy future applications of this model may include employing it as a basis for scenario work towards future policy proofing.
3.7 National ReportingCBD 5th National Reports are due to be submitted by the end of March 2014, and will include a section on progress towards the 2020 Aichi Targets and contributions to the relevant 2015 Targets of the Millennium Development Goals. There will be a need to analyse progress towards each Aichi Target, and for each Strategic Goal (A-E). To that end, the UK Biodiversity Indicators are anticipated to form a major part of the UK’s 5th CBD National Report.
Measuring progress may take the form of aggregating information from the evaluation of progress towards the targets; will likely need to integrate messages from different indictors; and may also need to draw on other data sources and information.
Given the anticipated lead-in time required to prepare the 5th National Report, it was considered imperative that consideration be given now as to how best the indicators might be presented and used to assess progress against these international commitments.
Two methods were put forward as suggestions for how indicators could be reported (see presentations on JNCC website). Through a series of brainstorming exercises, SWOT analyses and open dialogue, all Forum participants were asked to consider the two proposed methods and in particular consider the following:
1. Are there other suggestions of how to assess progress against each target?2. Could the data be displayed better in another way?3. How should we identify the gaps within targets that we are not able to assess?4. Should we identify a ‘value’ of how much of the target we are able to assess, and how much of a
gap is left?5. Should equal weight be given to each measure, or should equal weight be given to each
indicator?6. Should equal weight be given to the primary indicators?7. Which method is most appropriate for assessing the goal?
24
JNCC Contract: C12-0230-0595. Report of the 6th UK Biodiversity Indicators Forum
3.7.1 Key Discussion Points, Comments and Recommendations There was a clear push for simplicity when reporting on the targets, and a cautionary assertion
to purely allow the facts to ‘speak for themselves’ without over-analysis or interpretation. The suggestion that a ‘dashboard’ approach, rather than complex graphics, could be used to
identify relevant indicators to target appeared to have traction amongst the Forum participants. These could then be ranked by relevance to target and presented as individual graphs with assessment and high level summary statements included.
The main criticisms to methods 1 and 2 were: o These methods do not allow differentiated reporting on targets and trends; and o These methods are implicitly based on an equal weighting assumption of positive and
negative trends. Therefore the participants favoured a narrative-based and qualitative approach to assess the
progress of indicators with respect to targets. Participants also emphasized the need for transparency in the weighting of indicators, as well as
some level of peer-review in the assessment process. It was suggested that a reverse approach could be taken by mapping the discrepancies between
the available data, and ideal indicators that would perfectly meet reporting on Aichi targets. This would highlight where additional evidence was needed.
It was recommended to involve an expert panel to assess the progress to target, identify the strength of the evidence, list the assumptions and uncertainties, and identify additional sources of data that have been used in the assessment.
25
JNCC Contract: C12-0230-0595. Report of the 6th UK Biodiversity Indicators Forum
4 Annexes
4.1 Participant List
Name Organisation Working Group Email AddressDavid Allen Countryside Council
for WalesHabitat Connectivity [email protected]
Phil Baarda Scottish Natural Heritage
Habitat Connectivity [email protected]
Jenny Hogson University of York Habitat Connectivity [email protected] McCall Countryside Council
for WalesHabitat Connectivity [email protected]
Vicky Morgan JNCC Habitat Connectivity [email protected] Tierney UNEP-WCMC Habitat Connectivity [email protected] Kevin Watts Forest Research Habitat Connectivity [email protected] Williams JNCC Habitat Connectivity (Chair) [email protected] Berry Oxford University Climate Change Adaptation [email protected] Mark Broadmeadow Forestry Commission Climate Change Adaptation [email protected]
v.ukSue Marrs Scottish Natural
HeritageClimate Change Adaptation [email protected]
James Pearce-Higgins Centre for Ecology and Hydrology
Climate Change Adaptation [email protected]
Richard Smithers Ricardo-AEA Climate Change Adaptation [email protected] Mark Stevenson Defra Climate Change Adaptation
(Chair)[email protected]
Jonathan Storkey Rothamsted Research
Climate Change Adaptation [email protected]
Olly Watts RSPB Climate Change Adaptation [email protected] Winton Defra Climate Change Adaptation [email protected] Brereton Butterfly
ConservationSpecies tbrereton@butterfly-
conservation.org Fiona Burns RSPB Species [email protected] Conde ETC/BD Species [email protected] Mark Eaton RSPB Species [email protected] Isaac CEH Species [email protected] Noble BTO Species [email protected] Deborah Proctor JNCC Species (Chair) [email protected] Vickery JNCC Species [email protected] Ambrose John Innes Centre Plant Genetic Resources [email protected] Dickie KEW Plant Genetic Resources [email protected] Durham JNCC Plant Genetic Resources [email protected] Kloda UNEP-WCMC Plant Genetic Resources [email protected] Mercy Morris Plant Heritage Plant Genetic Resources [email protected]
26

JNCC Contract: C12-0230-0595. Report of the 6th UK Biodiversity Indicators Forum
Name Organisation Working Group Email AddressMark Stevenson Defra Plant Genetic Resources
(Chair)[email protected]
Dafydd Crabtree Wales Environment Research Hub
Ecosystem Services [email protected]
Sophie Conde ETC/BD Ecosystem services [email protected] James Davidson SEPA Ecosystem Services [email protected] Eastwood Hutton Institute Ecosystem Services [email protected] Gibson Defra Ecosystem Services [email protected] Maltby University of
LiverpoolEcosystem Services [email protected]
Sue Marrs Scottish Natural Heritage
Ecosystem Services [email protected]
Davy McCracken Scottish Agricultural College
Ecosystem Services [email protected]
Alistair McVittie TEEB Ecosystem Services [email protected] Measures Natural England Ecosystem Services [email protected]
.ukDiana Mortimer JNCC Ecosystem Services (Chair) [email protected]
Megan Tierney UNEP-WCMC Ecosystem Services [email protected] Ana Delgado Defra Global Impact (Chair) [email protected] Stephen Grady JNCC Global Impact [email protected]
Cecile Smith Scottish Natural Heritage
Global Impact [email protected]
Chris West University of York Global Impact [email protected] Williams JNCC Global Impact [email protected] Williams JNCC Facilitator [email protected] Stevenson Defra Facilitator [email protected] Brauneder UNEP-WCMC Rapporteur [email protected]
wcmc.orgNadine Bowles-Newark UNEP-WCMC Rapporteur Nadine.Bowles-Newark@unep-
wcmc.orgLucy Wilson UNEP-WCMC Rapporteur [email protected]
27
JNCC Contract: C12-0230-0595. Report of the 6th UK Biodiversity Indicators Forum
4.2 Forum Agenda
Day 1: 5 DecemberTime Session Format10:00 Welcome, Scene Setting, Objectives Plenary11:00 Tea/Coffee11:15 3 working groups in parallel (each to start with a short presentation to set
the scene, and with questions to address in discussion)Break-out
Habitat connectivity indicators
Climate change indicators
Species indicators
13:00 Lunch14:00 Report back (20 minutes for each workshop; 5 minutes feedback & 15
minutes plenary discussion)Plenary
15:00 Presentation on using the indicators in the CBD 5th National Report Plenary15:20 Discussion in 2 parallel working groups
Tea/Coffee to be taken as and when required during sessionBreak-out
16:20 Report back (5 minutes from each breakout, and then general discussion) Plenary16:45 Wrap up and next steps Plenary17:00 Close
Day 2: 6 DecemberTime Session Format10:00 Welcome, Scene Setting, Objectives Plenary11:00 Tea/Coffee11:15 3 working groups in parallel (each to start with a short presentation to set the
scene, and with questions to address in discussion)Break-out
Plant genetic resources
Ecosystem services
Global impacts
13:00 Lunch14:00 Report back (20 minutes for each workshop; 5 minutes feedback & 15 minutes
plenary discussion)Plenary
15:00 Presentation on using the indicators in the CBD 5th National Report Plenary15:20 Discussion in 2 parallel working groups
Tea/Coffee to be taken as and when required during break-out session
Break-out
16:20 Report back (5 minutes from each breakout, and then general discussion) Plenary16:45 Wrap up and next steps Plenary
28
JNCC Contract: C12-0230-0595. Report of the 6th UK Biodiversity Indicators Forum
17:00 Close
29