JLL Columbus Industrial Outlook: Q1 2017
8
JLL Research Columbus | Q1 2017 Industrial Outlook An in-depth look at the Columbus industrial market. Analysis includes leasing, sales, construction and employment.
-
Upload
andrew-batson -
Category
Real Estate
-
view
20 -
download
1
Transcript of JLL Columbus Industrial Outlook: Q1 2017
JLL Research
Columbus | Q1 2017
Industrial Outlook
An in-depth look at the Columbus industrial market. Analysis includes leasing, sales, construction and employment.

© 2017 Jones Lang LaSalle IP, Inc. All rights reserved. All information contained herein is from sources deemed reliable; however, no representation or warranty is made to the accuracy thereof.
Q1 2017
Insight
Columbus Industrial Outlook
The Columbus industrial market is experiencing a slow start to 2017 following a record breaking year as expected investment activity lingers. Just over 225,000 square feet was absorbed in Q1 2017, most of which can be attributed to a 717,000 square foot lease by Treehouse Foods at the close of 2016. Millions of square feet is proposed throughout the region, including within emerging submarkets of Etna, New Albany, and West Jefferson. Developers are ramping up the size of their proposed buildings to fulfill a market gap; existing inventory for large users is minimal throughout the market thus spurring plans for buildings between 750,000 and 1,000,000 square feet. Similar developments are also proposed in close proximity to Rickenbacker due to the Southeast’s existing availability of modern space. There are four recently completed, speculative buildings with availability ranging from 225,000 to 567,000 square feet. While these spaces may not satisfy the larger users, full occupancy is expected by the end of 2017.
The region is also experiencing sustained investment from manufacturers. Over 800,000 square feet of BTS space delivered in 2016 and similar activity is expected in 2017. Recent announcements include expansions from two automotive suppliers, in addition to a future 200,000 square foot lease for a credit card production company in the Southwest submarket.
OutlookWith overall vacancy at a staggering 5.4 percent, as well as a moderate construction pipeline of speculative space, the market will either experience a steadied or slightly rising vacancy rate as more space comes online. However, the overall effect on the market will be marginal despite slowed leasing velocity in the first quarter. Developers have taken note of strong market fundamentals and active tenants with both build-to-suit and speculative plans for new bulk warehouses that have shown to outperform older inventory, which will continue to attract users and push rents throughout the market.
Fundamentals Forecast
YTD net absorption 225,457 s.f. ▲QTD net absorption 225,457 s.f. ▲Under construction 2,597,527 s.f. ▲Total vacancy 5.4% ▶Average asking rent (NNN) $3.75 p.s.f. ▲Tenant improvements Falling ▼
0
5,000,000
10,000,000
2013 2014 2015 2016 YTD
2017
Supply and demand (s.f.) Net absorptionDeliveries
Proposed construction in line to meet user demand
9.5%
6.9% 6.4%5.3% 5.4%
2013 2014 2015 2016 YTD 2017
Total vacancy
$3.20
$3.40
$3.60
$3.80
2013 2014 2015 2016 YTD 2017
Average asking rents ($/s.f.)
• Recently completed speculative space remains available in the Southeast
• Submarkets throughout the region are seeing millions of square feet in proposed development
• Manufacturers are betting high on Central Ohio as investment and expansion continue
© 2017 Jones Lang LaSalle IP, Inc. All rights reserved. All information contained herein is from sources deemed reliable; however, no representation or warranty is made to the accuracy thereof.
Q1 2017
Statistics
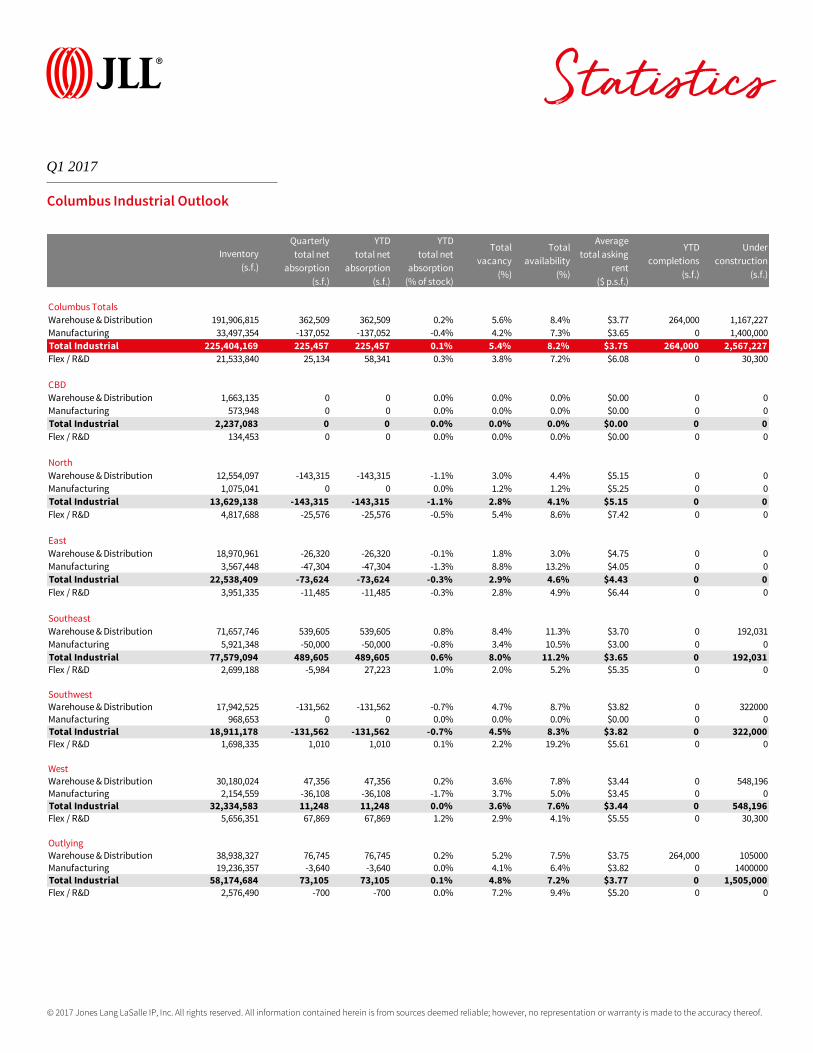
Columbus Industrial Outlook
Inventory
(s.f.)
Quarterly
total net
absorption
(s.f.)
YTD
total net
absorption
(s.f.)
YTD
total net
absorption
(% of stock)
Total
vacancy
(%)
Total
availability
(%)
Average
total asking
rent
($ p.s.f.)
YTD
completions
(s.f.)
Under
construction
(s.f.)
Columbus Totals
Warehouse & Distribution 191,906,815 362,509 362,509 0.2% 5.6% 8.4% $3.77 264,000 1,167,227
Manufacturing 33,497,354 -137,052 -137,052 -0.4% 4.2% 7.3% $3.65 0 1,400,000
Total Industrial 225,404,169 225,457 225,457 0.1% 5.4% 8.2% $3.75 264,000 2,567,227
Flex / R&D 21,533,840 25,134 58,341 0.3% 3.8% 7.2% $6.08 0 30,300
CBD
Warehouse & Distribution 1,663,135 0 0 0.0% 0.0% 0.0% $0.00 0 0
Manufacturing 573,948 0 0 0.0% 0.0% 0.0% $0.00 0 0
Total Industrial 2,237,083 0 0 0.0% 0.0% 0.0% $0.00 0 0
Flex / R&D 134,453 0 0 0.0% 0.0% 0.0% $0.00 0 0
North
Warehouse & Distribution 12,554,097 -143,315 -143,315 -1.1% 3.0% 4.4% $5.15 0 0
Manufacturing 1,075,041 0 0 0.0% 1.2% 1.2% $5.25 0 0
Total Industrial 13,629,138 -143,315 -143,315 -1.1% 2.8% 4.1% $5.15 0 0
Flex / R&D 4,817,688 -25,576 -25,576 -0.5% 5.4% 8.6% $7.42 0 0
East
Warehouse & Distribution 18,970,961 -26,320 -26,320 -0.1% 1.8% 3.0% $4.75 0 0
Manufacturing 3,567,448 -47,304 -47,304 -1.3% 8.8% 13.2% $4.05 0 0
Total Industrial 22,538,409 -73,624 -73,624 -0.3% 2.9% 4.6% $4.43 0 0
Flex / R&D 3,951,335 -11,485 -11,485 -0.3% 2.8% 4.9% $6.44 0 0
Southeast
Warehouse & Distribution 71,657,746 539,605 539,605 0.8% 8.4% 11.3% $3.70 0 192,031
Manufacturing 5,921,348 -50,000 -50,000 -0.8% 3.4% 10.5% $3.00 0 0
Total Industrial 77,579,094 489,605 489,605 0.6% 8.0% 11.2% $3.65 0 192,031Flex / R&D 2,699,188 -5,984 27,223 1.0% 2.0% 5.2% $5.35 0 0
SouthwestWarehouse & Distribution 17,942,525 -131,562 -131,562 -0.7% 4.7% 8.7% $3.82 0 322000Manufacturing 968,653 0 0 0.0% 0.0% 0.0% $0.00 0 0Total Industrial 18,911,178 -131,562 -131,562 -0.7% 4.5% 8.3% $3.82 0 322,000Flex / R&D 1,698,335 1,010 1,010 0.1% 2.2% 19.2% $5.61 0 0
WestWarehouse & Distribution 30,180,024 47,356 47,356 0.2% 3.6% 7.8% $3.44 0 548,196Manufacturing 2,154,559 -36,108 -36,108 -1.7% 3.7% 5.0% $3.45 0 0Total Industrial 32,334,583 11,248 11,248 0.0% 3.6% 7.6% $3.44 0 548,196Flex / R&D 5,656,351 67,869 67,869 1.2% 2.9% 4.1% $5.55 0 30,300
OutlyingWarehouse & Distribution 38,938,327 76,745 76,745 0.2% 5.2% 7.5% $3.75 264,000 105000Manufacturing 19,236,357 -3,640 -3,640 0.0% 4.1% 6.4% $3.82 0 1400000Total Industrial 58,174,684 73,105 73,105 0.1% 4.8% 7.2% $3.77 0 1,505,000Flex / R&D 2,576,490 -700 -700 0.0% 7.2% 9.4% $5.20 0 0
© 2017 Jones Lang LaSalle IP, Inc. All rights reserved. All information contained herein is from sources deemed reliable; however, no representation or warranty is made to the accuracy thereof.
Q1 2017
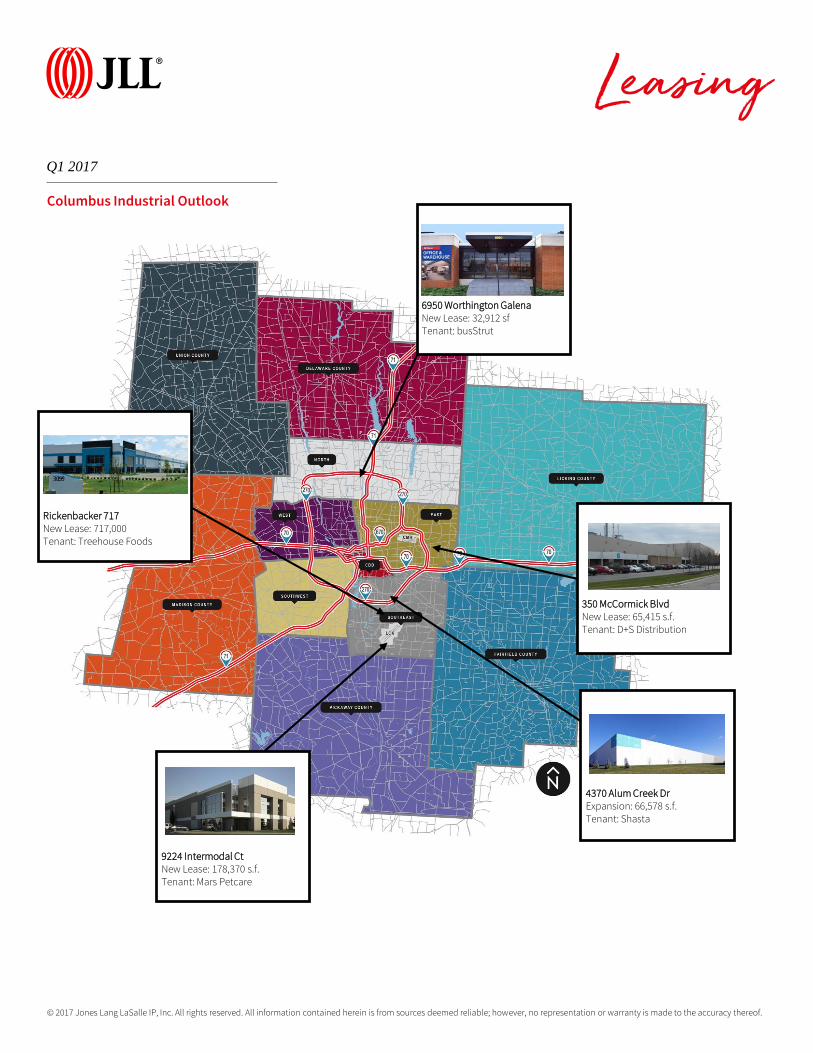
Leasing
Columbus Industrial Outlook
350 McCormick BlvdNew Lease: 65,415 s.f.Tenant: D+S Distribution
6950 Worthington GalenaNew Lease: 32,912 sfTenant: busStrut
4370 Alum Creek DrExpansion: 66,578 s.f.Tenant: Shasta
Rickenbacker 717New Lease: 717,000Tenant: Treehouse Foods
9224 Intermodal CtNew Lease: 178,370 s.f.Tenant: Mars Petcare
© 2017 Jones Lang LaSalle IP, Inc. All rights reserved. All information contained herein is from sources deemed reliable; however, no representation or warranty is made to the accuracy thereof.
Q1 2017
Sales
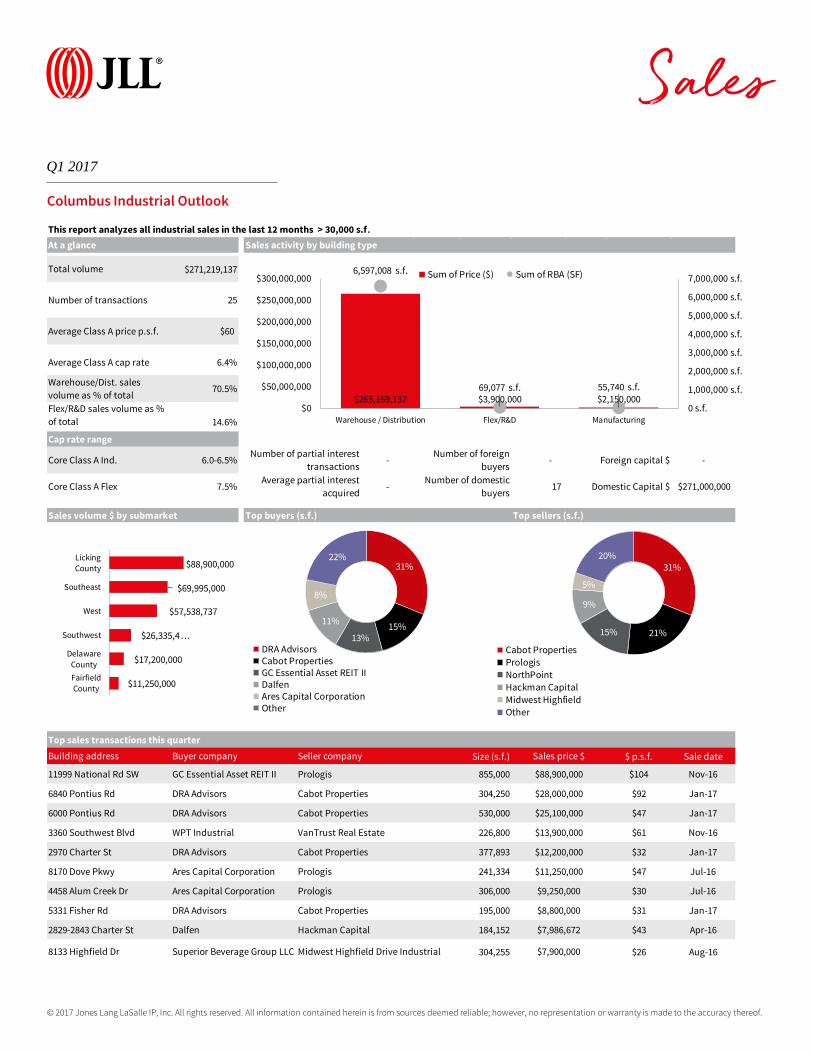
Columbus Industrial Outlook
This report analyzes all industrial sales in the last 12 months > 30,000 s.f.
$271,219,137
25
$60
6.4%
70.5%
14.6%
6.0-6.5% - - -
7.5% - 17 $271,000,000
Top sales transactions this quarter
Size (s.f.) $ p.s.f. Sale date
855,000 $104 Nov-16
304,250 $92 Jan-17
530,000 $47 Jan-17
226,800 $61 Nov-16
377,893 $32 Jan-17
241,334 $47 Jul-16
306,000 $30 Jul-16
195,000 $31 Jan-17
184,152 $43 Apr-16
304,255 $26 Aug-16
Sales activity by building type
Transactions details
Number of partial interest
transactions
Top sellers (s.f.)Top buyers (s.f.)
Number of domestic
buyers
Foreign capital $
Average partial interest
acquired
Number of foreign
buyers
Domestic Capital $
Average Class A price p.s.f.
At a glance
Total volume
Number of transactions
Average Class A cap rate
Sales volume $ by submarket
Warehouse/Dist. sales
volume as % of total
Flex/R&D sales volume as %
of total
Cap rate range
Core Class A Ind.
Core Class A Flex
11999 National Rd SW GC Essential Asset REIT II Prologis $88,900,000
Building address Buyer company Seller company Sales price $
3360 Southwest Blvd WPT Industrial
2970 Charter St DRA Advisors
6840 Pontius Rd DRA Advisors
6000 Pontius Rd DRA Advisors
Prologis $11,250,000
4458 Alum Creek Dr Ares Capital Corporation Prologis $9,250,000
8170 Dove Pkwy Ares Capital Corporation
8133 Highfield Dr Superior Beverage Group LLC Midwest Highfield Drive Industrial $7,900,000
5331 Fisher Rd DRA Advisors Cabot Properties $8,800,000
2829-2843 Charter St Dalfen Hackman Capital $7,986,672
Cabot Properties
Cabot Properties
VanTrust Real Estate
Cabot Properties
$28,000,000
$25,100,000
$13,900,000
$12,200,000
$265,169,137 $3,900,000 $2,150,000
6,597,008 s.f.
69,077 s.f. 55,740 s.f.
0 s.f.
1,000,000 s.f.
2,000,000 s.f.
3,000,000 s.f.
4,000,000 s.f.
5,000,000 s.f.
6,000,000 s.f.
7,000,000 s.f.
$0
$50,000,000
$100,000,000
$150,000,000
$200,000,000
$250,000,000
$300,000,000
Warehouse / Distribution Flex/R&D Manufacturing
Sum of Price ($) Sum of RBA (SF)
31%
15%13%
11%
8%
22%
DRA AdvisorsCabot PropertiesGC Essential Asset REIT IIDalfenAres Capital CorporationOther
31%
21%15%
9%
5%
20%
Cabot Properties
Prologis
NorthPoint
Hackman Capital
Midwest Highfield
Other
$88,900,000
$69,995,000
$57,538,737
$26,335,4…
$17,200,000
$11,250,000
Licking
County
Southeast
West
Southwest
Delaware
County
Fairfield
County

© 2017 Jones Lang LaSalle IP, Inc. All rights reserved. All information contained herein is from sources deemed reliable; however, no representation or warranty is made to the accuracy thereof.
Q1 2017
Construction
Columbus Industrial Outlook
This report analyzes all industrial developments under construction & new deliveries in the last 12 months > 30,000 s.f.
Total leased at delivery (%) 66.1%
Total speculative at delivery (s.f.) 1,998,117
Total BTS at delivery (s.f.) 2,798,153
Total Owner-User at delivery (s.f.) 167,000
Total # of properties delivered 13
Asking rental rate (low - high) $3.50 - $4.25
Top projects delivered
Building RBA (s.f.) Delivery dateLeased at
delivery (%)
8820 Smith's Mill Rd 264,000 Q1 2017 77%
Amazon Fulfillment Center 1,000,000 Q3 2016 100%
11801 National Rd 855,000 Q3 2016 100%
Rogue Fitness 600,000 Q4 2016 100%
3219 Rohr Rd 567,000 Q2 2016 0%
Total pre-leased (%) 85.3%
Total speculative under construction (s.f.) 604,331
Total BTS under construction (s.f.) 1,993,196
Total Owner-user under construction (s.f.) -
Total # of properties UC 8
Asking rental rate (low - high) $3.95 - $3.95
Top 5 projects currently under construction
Building RBA (s.f.)Delivery
date
Pre-leased
(%)
Sofidel Plant 1,400,000 Q1 2018 100%
UPS Expansion 348,196 Q4 2017 100%
Southpark Place 322,000 Q2 2017 0%
845 Kaderly Dr 200,000 Q2 2017 100%
RGLP Gateway 2950 192,031 Q3 2017 100%
Southeast VanTrust Speculative
Submarket
Under construction
2,597,527Under construction (s.f.)
Under construction in-depth
Upcoming deliveries by year (s.f., excludes YTD completions)
New deliveries
Completions in-depth
4,963,270Total delivered (s.f.)
Historical deliveries (s.f.)
Construction typeOwnerSubmarket
East
Licking County
Southeast
Licking County
Strait Real Estate LLC
Griffin Capital REIT II
Duke Realty
Pizzuti
BTS
BTS
BTS
Speculative
Southeast
West
Southwest
West
Pickaway County
Speculative
BTS
Owner Construction type
Speculative
Duke Realty
Jim Pattison
Developments
Becknell Industrial
Cleve Corp
Pewamo Ltd
BTS
BTS
0
1,000,000
2,000,000
3,000,000
4,000,000
5,000,000
6,000,000
2011 2012 2013 2014 2015 2016 YTD 2017
0
200,000
400,000
600,000
800,000
1,000,000
1,200,000
1,400,000
1,600,000
2017 2018
BTS Speculative
© 2017 Jones Lang LaSalle IP, Inc. All rights reserved. All information contained herein is from sources deemed reliable; however, no representation or warranty is made to the accuracy thereof.
Q1 2017
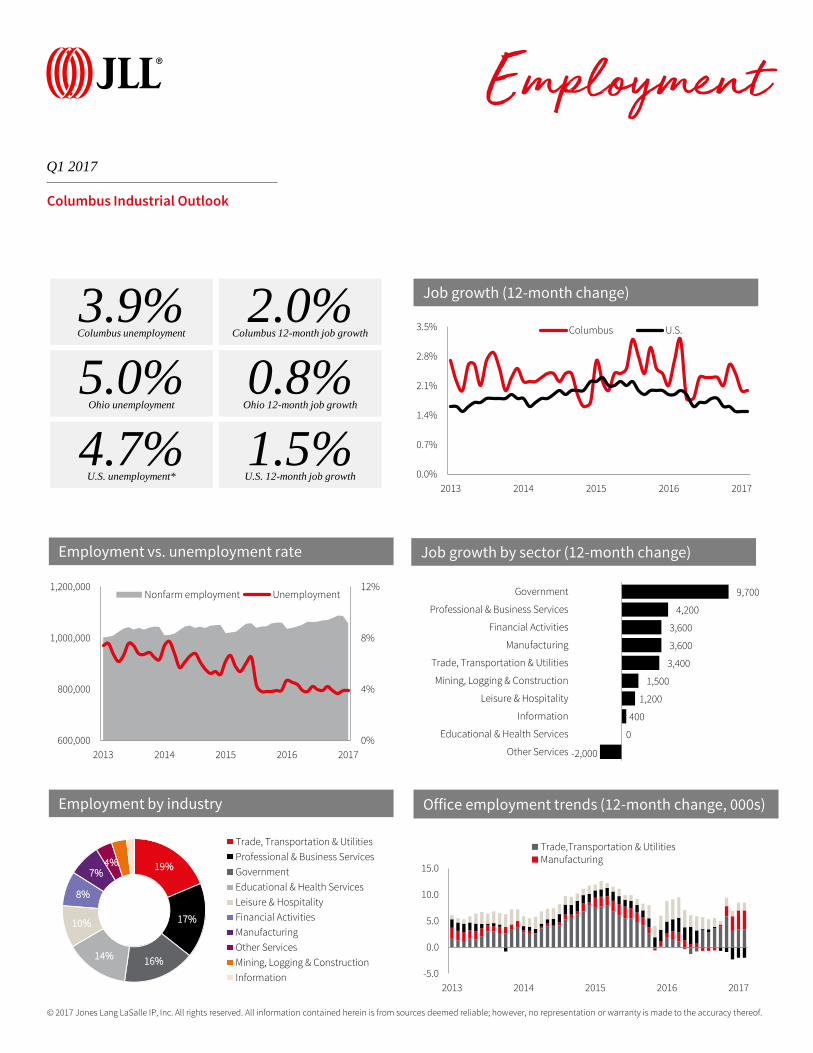
Employment
Columbus Industrial Outlook
Job growth by sector (12-month change)
4.7%U.S. unemployment*
1.5%U.S. 12-month job growth
3.9%Columbus unemployment
2.0%Columbus 12-month job growth
5.0%Ohio unemployment
0.8%Ohio 12-month job growth
-5.0
0.0
5.0
10.0
15.0
2013 2014 2015 2016 2017
Trade,Transportation & UtilitiesManufacturing
0.0%
0.7%
1.4%
2.1%
2.8%
3.5%
2013 2014 2015 2016 2017
Columbus U.S.
-2,000
0
400
1,200
1,500
3,400
3,600
3,600
4,200
9,700
-4,300 -2,300 -300 1,700 3,700 5,700 7,700 9,700 11,700
Other Services
Educational & Health Services
Information
Leisure & Hospitality
Mining, Logging & Construction
Trade, Transportation & Utilities
Manufacturing
Financial Activities
Professional & Business Services
Government
19%
17%
16%14%
10%
8%
7%4%
Trade, Transportation & Utilities
Professional & Business Services
Government
Educational & Health Services
Leisure & Hospitality
Financial Activities
Manufacturing
Other Services
Mining, Logging & Construction
Information
0%
4%
8%
12%
600,000
800,000
1,000,000
1,200,000
2013 2014 2015 2016 2017
Nonfarm employment Unemployment
Job growth (12-month change)
Job growth by sector (12-month change)Employment vs. unemployment rate
Employment by industry Office employment trends (12-month change, 000s)

© 2017 Jones Lang LaSalle IP, Inc.
All rights reserved. All information contained herein is from sources deemed reliable; however, no representation or warranty is made to the accuracy thereof.
Andrew BatsonVice President, Director of Research+1 216 937 [email protected]
Sam StoufferResearch Analyst+1 614 460 [email protected]
About JLL
JLL (NYSE: JLL) is a leading professional services firm that specializes in real estate and investment management. AFortune 500 company, JLL helps real estate owners, occupiers and investors achieve their business ambitions. In 2016, JLL had revenue of $6.8 billion and fee revenue of $5.8 billion and, on behalf of clients, managed 4.4 billion square feet, or 409 million square meters, and completed sales acquisitions and finance transactions of approximately $136 billion. At year-end 2016, JLL had nearly 300 corporate offices, operations in over 80 countries and a global workforce of more than 77,000. As of December 31, 2016, LaSalle Investment Management has $60.1 billion of real estate under asset management. JLL is the brand name, and a registered trademark, of Jones Lang LaSalle Incorporated. For further information, visit www.jll.com.
About JLL Research
JLL’s research team delivers intelligence, analysis and insight through market-leading reports and services that illuminate today’s commercial real estate dynamics and identify tomorrow’s challenges and opportunities. Our more than 400 global research professionals track and analyze economic and property trends and forecast future conditions in over 60 countries, producing unrivalled local and global perspectives. Our research and expertise, fueled by real-time information and innovative thinking around the world, creates a competitive advantage for our clients and drives successful strategies and optimal real estate decisions.