Jiménez-Ortega, Vanesa; Fernández-Mateos, María...
28
Jiménez-Ortega, Vanesa; Fernández-Mateos, María P.; Cano Barquilla, Pilar; Cardinali, Daniel P.; Esquifino, Ana I. Continuous vs. discontinuous drinking of an ethanol liquid diet in peripubertal rats : effect on 24-hour variation of lymph node and splenic mitogenic responses and lymphocyte subset populations Preprint del documento publicado en Alcohol, 2011, 45, 183-192 Este documento está disponible en la Biblioteca Digital de la Universidad Católica Argentina, repositorio institucional desarrollado por la Biblioteca Central “San Benito Abad”. Su objetivo es difundir y preservar la producción intelectual de la institución. La Biblioteca posee la autorización del autor para su divulgación en línea. Cómo citar el documento: Jiménez-Ortega, V, Fernández-Mateos, MP, Cano Barquilla, P, Cardinali, DP, Esquifino, AI. Continuous vs. discontinuous drinking of an ethanol liquid diet in peripubertal rats: effect on 24-hour variation of lymph node and splenic mitogenic responses and lymphocyte subset populations. Alcohol. 2011; 45:183-192. Disponible en: http://bibliotecadigital.uca.edu.ar/repositorio/investigacion/continuous-discontinuous-drinking-ethanol- liquid.pdf (Se recomienda indicar fecha de consulta al final de la cita. Ej: [Fecha de consulta: 19 de agosto de 2010]).
Transcript of Jiménez-Ortega, Vanesa; Fernández-Mateos, María...

Jiménez-Ortega, Vanesa; Fernández-Mateos, María P.; CanoBarquilla, Pilar; Cardinali, Daniel P.; Esquifino, Ana I.
Continuous vs. discontinuous drinking of anethanol liquid diet in peripubertal rats : effect on24-hour variation of lymph node and splenicmitogenic responses and lymphocyte subsetpopulations
Preprint del documento publicado en Alcohol, 2011, 45, 183-192
Este documento está disponible en la Biblioteca Digital de la Universidad Católica Argentina, repositorio institucional desarrollado por la Biblioteca Central “San Benito Abad”. Su objetivo es difundir y preservar la producción intelectual de la institución.La Biblioteca posee la autorización del autor para su divulgación en línea.
Cómo citar el documento:
Jiménez-Ortega, V, Fernández-Mateos, MP, Cano Barquilla, P, Cardinali, DP, Esquifino, AI. Continuous vs. discontinuous drinking of an ethanol liquid diet in peripubertal rats: effect on 24-hour variation of lymph node and splenic mitogenic responses and lymphocyte subset populations. Alcohol. 2011; 45:183-192. Disponible en: http://bibliotecadigital.uca.edu.ar/repositorio/investigacion/continuous-discontinuous-drinking-ethanol-liquid.pdf
(Se recomienda indicar fecha de consulta al final de la cita. Ej: [Fecha de consulta: 19 de agosto de 2010]).

1
Publicado en: Alcohol 45:183‐192; 2011
Continuous vs. discontinuous drinking of an ethanol liquid diet in peripubertal rats:
Effect on 24‐hour variation of lymph node and splenic mitogenic responses and
lymphocyte subset populations.
Vanesa Jiménez‐Ortega1, María P. Fernández‐Mateos1,2, Pilar Cano Barquilla1, Daniel P.
Cardinali3 and Ana I. Esquifino1
1 Department of Biochemistry and Molecular Biology III, Faculty of Medicine, Universidad
Complutense, Madrid 28040, Spain. 2Department of Cellular Biology, Faculty of Medicine, Universidad Complutense, Madrid
28040, Spain 3Department of Teaching & Research, Faculty of Medical Sciences, Pontificia Universidad
Católica Argentina, 1107 Buenos Aires, Argentina.
Corresponding Author:
D.P. Cardinali MD PhD,
Director, Departamento de Docencia e Investigación,
Facultad de Ciencias Médicas,
Pontificia Universidad Católica Argentina,
Av. Alicia Moreau de Justo 1500, 4o piso
1107 Buenos Aires, Argentina.
Tel: +54 11 43490200 ext 2310
E‐mail: [email protected]; [email protected]

2
Abstract
Excessive alcohol consumption continues to be a major public health problem,
particularly in the adolescent and young adult populations. Generally, such a behavior
tends to be confined to the weekends, to attain frequently binge drinking. This study in
peripubertal male rats compares the effect of the discontinuous feeding of a liquid diet
containing a moderate amount of ethanol (6.2 % wt/vol) to that of continuous ethanol
administration or a control diet, taking as end points the 24‐h variations of plasma
prolactin levels and mitogenic responses and lymphocyte subset populations in
submaxillary lymph nodes and spleen. Animals received the ethanol liquid diet starting on
day 35 of life, the diet being similar to that given to controls except for that maltose was
isocalorically replaced by ethanol. Ethanol provided 36% of the total caloric content. Every
week, the discontinuous ethanol group received the ethanol diet for 3 days and the
control liquid diet for the remaining 4 days. After 4 weeks, rats were killed at 6 time
intervals, beginning at 0900 h. A significant decrease of splenic cells´response to
concanavalin A, and of lymph node and splenic cells’ response to lipopolysaccharide was
found in rats under the discontinuous ethanol regime, as compared to control or ethanol‐
chronic rats. Under discontinuous ethanol feeding mean values of lymph node and splenic
CD8+ and CD4+‐CD8+cells decreased, whereas those of lymph node and splenic T cells, and
splenic B cells, augmented. In rats chronically fed with ethanol, splenic mean levels of
CD8+ and CD4+‐CD8+cells augmented. Both modalities of ethanol administration disrupted
the 24 h variation in immune function seen in controls. Mean plasma prolactin levels

3
increased by 3.6 and 8.5 fold in rats chronically or discontinuously fed with alcohol,
respectively. The immune parameters examined in an additional group of rats fed regular
chow and water ad libitum did not differ significantly from control liquid diet. The results
support the view that the discontinuous drinking of a moderate amount of ethanol can be
more harmful for the immune system than a continuous ethanol intake, presumably by
inducing a greater stress as indicated by the augmented plasma prolactin levels observed.
Key Words: Binge drinking – Lymph nodes ‐ Spleen ‐ Mitogenic responses ‐ Lymphocyte
subsets ‐ Circadian rhythms – Prolactin ‐ Stress

4
Introduction
Excessive alcohol consumption continues to be a major public health problem in
adolescent and young adults (Stolle et al., 2009). High levels of ethanol consumption
followed by repeated episodes of withdrawal, as typifies by binge drinking, are common in
these age groups and appears to be a particularly harmful way to drink (Duka et al., 2004;
Stephens et al., 2005). Even in young social drinkers, with relatively low overall levels of
alcohol consumption, both cognitive deficits and mood changes are seen in those with a
history of discontinuous drinking (Townshend and Duka, 2005).
There is considerable evidence indicating that ethanol consumption alters immune
system function and leads to increased susceptibility to infections and neoplastic diseases
(Nath and Szabo, 2009; Lau et al., 2009; Nava‐Aguilera et al., 2009; Szabo and Mandrekar,
2009). As indicated by studies in peripubertal rats, chronic administration of ethanol also
resulted in significant changes of the circadian organization of the immune response
(Jiménez et al., 2005).
In view of the evidence that a significant proportion of the adolescent and young
adult populations tend to consume alcohol in a discontinuous pattern at weekends,
studies on the effects of alcohol exposure on the adolescent immune system using the
chronic alcohol feeding models would probably fail in giving information on the
consequence of ethanol drinking behavior. Moreover, none is known as to whether the
discontinuous consumption of ethanol affects the circadian organization of the immune
response. This prompted us to undertake the present study whose objective was to
5
compare the effect of the discontinuous feeding (3 days/week) of a liquid diet containing
a moderate amount of ethanol with that of a continuous ethanol administration or a
control diet, taking as end points the 24‐h variations of mitogenic responses and
lymphocyte subset populations in lymph nodes and spleen of peripubertal rats. Plasma
prolactin levels were also measured as an index of the stress produced by ethanol intake.
Materials and methods
Animals and experimental design
Five week‐old, peripubertal, male Wistar rats were kept under standard conditions
of controlled light (12:12 h light/dark schedule) and temperature (22 ± 2 C). Prior to
treatment, animals were randomly assigned to one of the following three treatment
groups (with an n of 48 animals per group, chosen based on a power analysis performed
using preliminary data): (a) control liquid diet; (b) discontinuous ethanol diet; (c) chronic
ethanol diet. An additional group of 48 rats fed with regular chow and water ad libitum
was also studied.
A liquid diet mode of ethanol administration was employed (Dodd and Shorey‐
Kutschke, 1987; Lieber and DeCarli, 1994). Animals received the liquid diet for 4 weeks,
starting on day 35 of life. The diet contained an aqueous suspension of pulverized casein,
l‐methionine, vitamin mixture, mineral mixture, sucrose, xanthum gum, choline bitartrate,
Celufil cellulose, corn oil and maltose. Percent composition of the diet was 35% fat, 18%
protein and 47% carbohydrates. The ethanol‐fed group received a similar diet except for
that maltose was replaced by 96% ethanol. Final ethanol concentration was 6.2% (wt./vol)

6
and ethanol replacement was isocaloric providing about 36% of the total caloric content
of the diet. To mask the ethanol taste, saccharin was added to the experimental ethanol
diet; animals under control liquid diet also received saccharin. For the discontinuous
ethanol group, the rats received the ethanol diet 3 days/week, the remaining 4 days
receiving the control liquid diet.
Rats were caged in groups of 4 animals/cage and had access to the liquid diet ad
libitum. An additional group of rats fed with regular chow and water ad libitum was also
studied. Control and experimental liquid diets were freshly made each day. Daily
consumption of liquid diet (mL/rat, average of 4 rats) was 36.9 ± 7.3 (control), 34.8 ± 7.3
(discontinuous ethanol); 30.0 ± 8.1 (chronic ethanol). Rats were under the liquid diet
without ethanol since 5 days before the study to allow the animals to become accustomed
to the new diet.
The care and use as well as all procedures involving animals were approved by the
Institutional Animal Care Committee, Faculty of Medicine, Complutense University,
Madrid. The study was in accordance with the guidelines of the Institutional Care and Use
Committee of the National Institute on Drug Abuse, National Institutes of Health and the
Guide for the Care and Use of Laboratory Animals (Institute of Laboratory Animal
Resources, 1996)
After 4 weeks of treatment groups of 8 rats were killed by decapitation at six
different time intervals, every 4 h, throughout a 24‐h cycle starting at 0900 h. At night
intervals animals were killed under red dim light. Trunk blood was collected and plasma
samples were obtained by centrifugation of blood at 1,500 g for 15 min and were stored

7
at ‐20 °C until further analysis. The submaxillary lymph nodes and spleen were removed
aseptically, weighed and placed in Petri disks containing balanced salt solution, the cells
being gently teased apart. After removing the clumps by centrifugation, the cells were
suspended in sterile supplemented medium (RPMI 1640), containing 10% heat‐
inactivated, fetal bovine serum, 20 mM L‐glutamine, 0.02 mM 2‐mercaptoethanol and
gentamicin (50 mg/ml), and were counted.
Mitogen assays
Mitogen assays were performed as described in detail elsewhere (Esquifino et al.,
1996). Thymidine [methyl‐3H] (specific activity 20 Ci/mmol) was purchased from NEN
Research Products, Boston, MA, USA. Lymph nodes or splenic cells were used at a final
number of cells/well (0.1 ml) of 5 x 10⁵. Control and experimental cultures were run in
triplicate. Mitogens were added to the cultures at final supramaximal concentrations of 5
μg/ml. The cultures were incubated in a humidified 37°C incubator in an atmosphere of
5% CO2. After 48 h incubation, 3H‐thymidine (0.2 μCi) was added to each well in a volume
of 0.02 ml. Cells were harvested 5 h later using an automated sample harvester, and the
filters were counted in a liquid scintillation spectrometer. The proliferation index was
estimated as the ratio between stimulation in the presence of mitogens/controls. Results
were expressed as proliferation index/number of cells.
Lymphocyte subsets
The relative size distributions of lymph cells in the lymph nodes and the spleen were
determined by FACS analysis, as previously described (Castrillon et al., 2000). For these
studies, we used the following monoclonal antibodies: Anti‐rat LCA (OX‐33) for B

8
lymphocytes (Serotec, Oxford, UK), Anti‐rat TCR alpha/beta (R7.3) for T lymphocytes
(Serotec, Oxford, UK), Anti‐rat CD4 (OX‐35) which recognize a rat T helper cell
differentiation antigen (Pharmingen, San Diego, CA, USA), and Anti‐rat CD8a (OX‐8) which
recognize the reactive antigen expressed on rat T cytotoxic/suppressor cells (Pharmingen,
San Diego, CA, USA). Lymphocytes isolated as indicated above, were washed in cold PBS
with 0.02% sodium azide and then incubated (3 x 10⁵ cells/tube) with appropriate primary
antibodies for 30 min at 4ºC. Following two washes, the cells were incubated with 1 ml of
PBS‐BSA 1%, during 5 min at 4ºC, washed three times, resuspended in 1%
paraformaldehyde in PBS. Fluorescence intensity was analyzed by fluorescence activated
cell sorting (FACStarplus; Beckton Dickinson, Mountain View, CA).
Prolactin assay
Plasma prolactin levels were measured by a homologous‐specific double antibody
radioimmunoassay (RIA), using materials kindly supplied by the NIDDK’s National
Hormone and Pituitary Program and by Dr. A.Parlow (Harbor UCLA Medical Center, 1000
West Carson Street, Torrance, CA, USA). The intra‐ and inter‐assay coefficients of variation
were 6 and 8%, respectively. Sensitivity of the RIA was 50 pg/mL using the NIDDK rat
prolactin standard.
Statistical analysis
Statistical analysis of results was performed by a factorial analysis of variance
(ANOVA). Generally, the analysis included assessment of the group effect (i.e. the
occurrence of differences in mean values between discontinuous ethanol, chronic ethanol
and control groups), of time‐of‐day effects (the occurrence of daily changes) and of the

9
interactions, from which inference about differences in timing and amplitude could be
obtained. One‐way ANOVA was then applied to show which time points were significantly
different within each experimental group to define the existence of peaks. Post‐hoc
Bonferroni´s multiple comparisons tests were employed. P values lower than 0.05 were
considered evidence for statistical significance.
Results
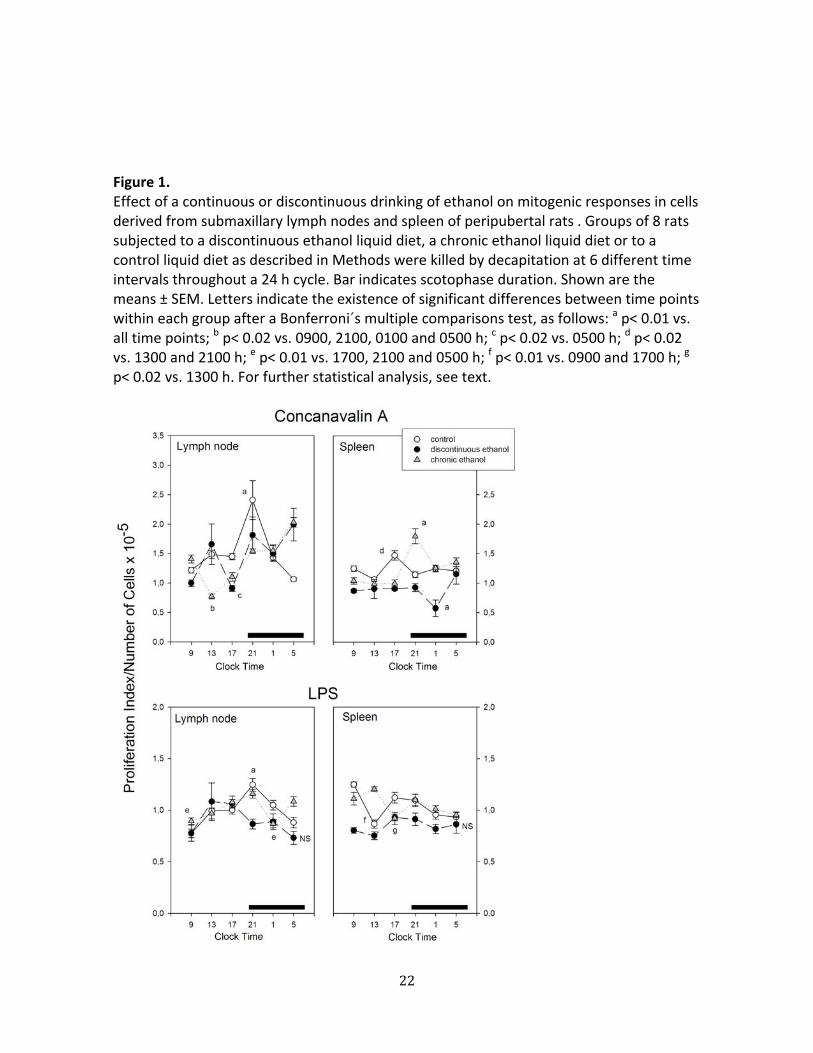
Figure 1 depicts the changes in mitogenic responses to Con A and LPS of cells
derived from lymph nodes and spleen of discontinuous ethanol‐ fed rats, chronic ethanol‐
fed rats and controls along the 24 h span. A factorial ANOVA indicated a significant
decrease in splenic cells´response to Con A, and in lymph node and splenic cells’ response
to LPS in the discontinuous ethanol group (p< 0.001, Bonferroni´s test). Significant
interactions “treatment x time of day” were found in a factorial ANOVA for every
parameter examined indicating that both modalities of ethanol administration disrupted
the 24 h changes observed in control rats (p< 0.001, Fig. 1).
Figure 2 shows the percentage of CD4+, CD8+ and CD4+‐CD8+cells, and the ratio
between CD4+ and CD8+ cells, in the three groups of animals examined. The discontinuous
ethanol administration brought about a significant decrease of lymph node and splenic
CD8+ and CD4+‐CD8+cells (p< 0.0001, Bonferroni´s test). Consequently, lymph node and
splenic CD4+/CD8+ ratios were higher in rats receiving ethanol in a discontinuous regime
(p< 0.001). After chronic ethanol administration, splenic mean levels of CD8+ and CD4+‐
CD8+cells augmented (p< 0.01 as compared to controls, Bonferroni´s test). Significant

10
interactions “treatment x time of day” were detected for all the parameters tested and in
both ethanol‐administered groups, except for lymph node and splenic CD4+ cells (p<
0.001, Fig. 2).
Figure 3 shows the changes in lymph node and splenic T and B cells along the 24 h
span. Analyzed by a factorial ANOVA, mean values of lymph node and splenic T cells, and
of splenic B cells in the discontinuous ethanol group, were significantly higher, and B/T
ratios significantly lower, than those of ethanol‐chronic and control rats (p< 0.001,
Bonferroni´s test). Significant interactions “treatment x time of day” were observed in the
factorial ANOVA for every parameter tested except for the lymph node T cell population,
i.e. both modalities of ethanol administration disrupted the 24 h changes observed in
control rats (p< 0.001, Fig. 3). As shown in Fig. 4, the total number of cells in lymph nodes
and spleen did not differ significantly among groups, nor as a function of time of day.
Plasma prolactin levels in the 3 groups of animals examined are depicted in Fig. 5.
Peak circulating levels occurred at the second part of scotophase in the 3 groups of
animals. Mean values of prolactin (ng/mL) were 2.21 ± 0.23, 7.97 ± 0.87 and 18.9 ± 1.65 in
control rats and rats chronically or discontinuously fed with ethanol, respectively,
differences among the 3 groups being significant (p< 0.001, factorial ANOVA). When
analyzed within individual groups, prolactin levels did not correlate with any of the
immune parameters over the time course studied.
An additional group of rats fed regular chow and water ad libitum was compared to
rats receiving the control liquid diet as far as the different immune parameters tested.

11
Neither the mitogenic responses (Fig. 6) nor lymphocyte subset populations (results not
shown) differed significantly between both groups.
Discussion
Foregoing results are compatible with the view that the discontinuous drinking of a
moderate amount of ethanol can be more harmful for the immune system than a
continuous administration of a similar amount of ethanol. Rats receiving a discontinuous
ethanol diet exhibited an impaired mitogenic response of splenic cells to Con A, and of
lymph node and splenic cells to LPS, as compared to chronic ethanol feeding or to control
rats. These findings coexisted with a decreased number of lymph node and splenic CD8+
and CD4+‐CD8+cells and augmented number of lymph node T cells and splenic T and B
cells, in the discontinuous ethanol group. Both modalities of ethanol administration
disrupted the 24 h changes in most immune parameters examined.
Clinical and experimental evidence demonstrate that acute, moderate and chronic,
excessive ethanol use result in various abnormalities in the functions of the immune
system [see for ref. (Szabo and Mandrekar, 2009)]. This effect is observed both on innate
as well as on adaptive immunity. Ethanol feeding of rodents is associated with suppression
of T‐cell proliferation and B‐cell antibody production to T‐cell‐dependent antigens,
decreased natural killer cell activity, and increased susceptibility to incidence of infection
(Goral et al., 2008). Other changes in the immune system include loss of lymphoid cells
from spleen, thymus, and mesenteric lymph nodes; impaired lymphocyte proliferation in
response to various stimuli and diminished leukocyte mobilization and phagocytosis

12
(Bailey et al., 1976; Grossman et al., 1988; Jerrells et al., 1990; Saad and Jerrells, 1991;
Jerrells et al., 1992; Hsiung et al., 1994; Kruger and Jerrells, 1994; Sibley et al., 1995; Livant
et al., 1997; Waltenbaugh et al., 1998; Faunce et al., 1998; Laso et al., 1999; Choudhry et
al., 2000; Boyadjieva et al., 2001; Starkenburg et al., 2001; Hosseini et al., 2001;
Messingham et al., 2002; Hebert and Pruett, 2003; Fedeli et al., 2003; Kapasi et al., 2003;
Dokur et al., 2004; Chen et al., 2006; Goral et al., 2008; Szabo and Mandrekar, 2009).
Most of these studies were performed at single time points in the 24 cycle (usually
in the morning). Therefore, the effect of ethanol on the circadian organization of the
immune response remaining largely undefined. This can be of particular importance in
view of the significant effect of chronic ethanol administration on various circadian
rhythms (sleep, motor activity and food intake) (Rosenwasser, 2001). In addition, circadian
rhythms modulate body´s response to ethanol (Chen et al., 2004; Arjona et al., 2004;
Arjona and Sarkar, 2005,2006; Spanagel et al., 2005a,b; Zghoul et al., 2007). We previously
reported that chronic ethanol feeding resembling that employed herein in the ethanol‐
chronic group brought about significant modifications in the 24 h pattern of several
immune parameters in the thymus and spleen of peripubertal rats (Jiménez et al., 2005).
In the present study both ways of ethanol administration brought about circadian
disruption of most immune parameters examined.
Binge drinking models were achieved in rodents by repeated alcohol administration
for 3 to 4 consecutive days using gastric gavage (Nagy, 2008). The amounts of ethanol
administered by this procedure are very high; in contrast, when complete liquid diets
containing adjusted nutritional components and ethanol with approximately 36% of

13
calories from ethanol are used (Lieber and DeCarli, 1994), the amounts of ethanol
administered are moderate and consequently the immunological sequels are more
subtile. Since a moderate discontinuous way of drinking is probably the most frequent
way of ethanol drinking in adolescent and young adults, we employed a liquid ethanol diet
to examine its effect on the 24‐h organization of the immune response. Our results
demonstrate that under a discontinuous ethanol regime the mitogenic response to Con A
or LPS is heavily impaired, concomitantly with an important decrease in lymph node and
splenic CD8+ and CD4+‐CD8+cell population. We previously reported that a chronic ethanol
feeding resembling that employed herein the mitogenic response of splenic cells to
mitogens remained unaffected, while mean values of splenic CD8+ and CD4+‐CD8+ number
augmented (Jiménez et al., 2005). The present data in the ethanol‐chronic group as far as
splenic immune parameters were essentially similar to those reported earlier.
Although no mechanistic conclusions can be derived from the present observational
study, some considerations on this aspect deserve comment. In the present experiments,
we employed the Lieber–DeCarli liquid diet in a discontinuous way to minimize the stress
caused by the intragastric administration of a high amount of ethanol in the binge drinking
models. However, the possibility that the periodic ethanol feeding and withdrawal could
be stressors was supported by the observation that mean plasma prolactin levels
increased by 3.6‐fold in rats chronically fed with alcohol and by 8.5‐fold in rats under
discontinuous ethanol administration. Indeed, prolactin secretion is increased by stress
(Neill, 1970; Gala, 1990; Franci et al., 1992), e.g, ether stress in male rats (Deis et al.,
1989). A role for the stress response has been proposed in cell loss and changes in

14
immune cell functions in ethanol‐fed rodents (Jerrells et al., 1990). Since adrenalectomy in
rats partially abolishes the effects of ethanol on thymic and splenic atrophy and
suppression of lymphocyte proliferation of T‐cell mitogens, corticosteroids have been
implicated in this phenomenon (Padgett et al., 2000).
During the diurnal cycle plasma corticosterone starts to increase at approximately
light/dark transition and attains maximal levels during the first part of scotophase (Haus,
2007; Claustrat et al., 2008). In the case of prolactin an increase during the scotophase has
also been described in several studies (Haus, 2007; Claustrat et al., 2008), including the
present one. In spite of the apparently similar sensitivity of the two endocrine systems to
stress, no consistent correlations were found between the activation of hypothalamic‐
pituitary‐adrenal axis and prolactin secretory responses (Courvoisier et al., 1996; Márquez
et al., 2002). This lack of consistent correlations suggests that stress‐related factors
underlying activation of the two endocrine systems are different. Further studies are
needed to determine whether the changes reported herein in the extent of prolactin
release are associated with different levels of adrenal stimulation.
Acknowledgements
This work was supported by grants from Ministerio de Interior, Plan Nacional sobre
Drogas, Spain (PR201/02‐11474), Programa de Creación y Consolidación de Grupos de
Investigación, Universidad Complutense de Madrid (GR58/08), and Agencia Nacional de
Promoción Científica y Tecnológica, Argentina (PICT 2007‐01045). DPC is a Research

15
Career Awardee from the Argentine Research Council and Emeritus Professor, University
of Buenos Aires.

16
References
Arjona, A., Boyadjieva, N., and Sarkar, D.K. (2004). Circadian rhythms of granzyme B, perforin, IFN‐
gamma, and NK cell cytolytic activity in the spleen: effects of chronic ethanol. J. Immunol. 172,
2811‐2817.
Arjona, A. and Sarkar, D.K. (2005). Circadian oscillations of clock genes, cytolytic factors, and
cytokines in rat NK cells. J. Immunol. 174, 7618‐7624.
Arjona, A. and Sarkar, D.K. (2006). Evidence supporting a circadian control of natural killer cell
function. Brain Behav. Immun. 20, 469‐476.
Bailey, R.J., Krasner, N., Eddleston, A.L., Williams, R., Tee, D.E., Doniach, D., Kennedy, L.A., and
Batchelor, J.R. (1976). Histocompatibility antigens, autoantibodies, and immunoglobulins in
alcoholic liver disease. Br. Med. J. 2, 727‐729.
Boyadjieva, N., Dokur, M., Advis, J.P., Meadows, G.G., and Sarkar, D.K. (2001). Chronic ethanol
inhibits NK cell cytolytic activity: role of opioid peptide beta‐endorphin. J. Immunol. 167, 5645‐
5652.
Castrillon, P., Esquifino, A.I., Varas, A., Zapata, A., Cutrera, R.A., and Cardinali, D.P. (2000). Effect of
melatonin treatment on 24‐hour variations in responses to mitogens and lymphocyte subset
populations in rat submaxillary lymph nodes. J. Neuroendocrinol. 12, 758‐765.
Chen, C.P., Boyadjieva, N.I., Advis, J.P., and Sarkar, D.K. (2006). Ethanol suppression of the
hypothalamic proopiomelanocortin level and the splenic NK cell cytolytic activity is associated with
a reduction in the expression of proinflammatory cytokines but not anti‐inflammatory cytokines in
neuroendocrine and immune cells. Alcohol Clin. Exp. Res. 30, 1925‐1932.
Chen, C.P., Kuhn, P., Advis, J.P., and Sarkar, D.K. (2004). Chronic ethanol consumption impairs the
circadian rhythm of pro‐opiomelanocortin and period genes mRNA expression in the
hypothalamus of the male rat. J. Neurochem. 88, 1547‐1554.

17
Choudhry, M.A., Messingham, K.A., Namak, S., Colantoni, A., Fontanilla, C.V., Duffner, L.A., Sayeed,
M.M., and Kovacs, E.J. (2000). Ethanol exacerbates T cell dysfunction after thermal injury. Alcohol
21, 239‐243.
Claustrat, B., Valatx, J.L., Harthe, C., and Brun, J. (2008). Effect of constant light on prolactin and
corticosterone rhythms evaluated using a noninvasive urine sampling protocol in the rat. Horm.
Metab Res. 40, 393‐403
Courvoisier, H., Moisan, M.P., Sarrieau, A., Hendley, E.D., and Mormede, P. (1996). Behavioral and
neuroendocrine reactivity to stress in the WKHA/WKY inbred rat strains: a multifactorial and
genetic analysis. Brain Res 743, 77‐85.
Deis, R.P., Leguizamon, E., and Jahn, G.A. (1989). Feedback regulation by progesterone of stress‐
induced prolactin release in rats. J. Endocrinol. 120, 37‐43.
Dodd, H. and Shorey‐Kutschke, R.L. (1987). Ethanol lowers heart carnitine in the methionine and
choline deficient rat. Alcohol 4, 395‐399.
Dokur, M., Boyadjieva, N.I., Advis, J.P., and Sarkar, D.K. (2004). Modulation of hypothalamic beta‐
endorphin‐regulated expression of natural killer cell cytolytic activity regulatory factors by ethanol
in male Fischer‐344 rats. Alcohol Clin. Exp. Res. 28, 1180‐1186.
Duka, T., Gentry, J., Malcolm, R., Ripley, T.L., Borlikova, G., Stephens, D.N., Veatch, L.M., Becker,
H.C., and Crews, F.T. (2004). Consequences of multiple withdrawals from alcohol. Alcohol Clin. Exp.
Res. 28, 233‐246.
Esquifino, A.I., Selgas, L., Arce, A., Della Maggiore, V., and Cardinali, D.P. (1996). Twenty four hour
rhythms in immune responses in rat submaxillary lymph nodes and spleen. Effect of cyclosporine.
Brain Behav. Immun. 10, 92‐102.
Faunce, D.E., Gregory, M.S., and Kovacs, E.J. (1998). Acute ethanol exposure prior to thermal injury
results in decreased T‐cell responses mediated in part by increased production of IL‐6. Shock 10,
135‐140.
Fedeli, D., Fedeli, A., Luciani, F., Massi, M., Falcioni, G., and Polidori, C. (2003). Lymphocyte DNA
alteration by sub‐chronic ethanol intake in alcohol‐preferring rats. Clin Chim. Acta 337, 43‐48.
18
Franci, C.R., Anselmo‐Franci, J.A., and McCann, S.M. (1992). The role of endogenous atrial
natriuretic peptide in resting and stress‐induced release of corticotropin, prolactin, growth
hormone, and thyroid‐stimulating hormone. Proc. Natl. Acad. Sci. USA 89, 11391‐11395.
Gala, R.R. (1990). The physiology and mechanisms of the stress‐induced changes in prolactin
secretion in the rat. Life Sci. 46, 1407‐1420.
Goral, F., Karavitis, J., and Kovacs, E.J. (2008). Exposure‐dependent effects of ethanol on the innate
immune system. Alcohol 42, 237‐247.
Grossman, C.J., Mendenhall, C.L., and Roselle, G.A. (1988). Alcohol and immune regulation. I. In
vivo effects of ethanol on concanavalin A sensitive thymic lymphocyte function. Int. J.
Immunopharmacol. 10, 187‐195.
Haus, E. (2007). Chronobiology in the endocrine system. Adv Drug Deliv. Rev 59, 985‐1014.
Hebert, P. and Pruett, S.B. (2003). Ethanol decreases natural killer cell activation but only
minimally affects anatomical distribution after administration of polyinosinic:polycytidylic acid:
role in resistance to B16F10 melanoma. Alcohol Clin. Exp. Res. 27, 1622‐1631.
Hosseini, S., Sepulveda, T., Lee, H., and Watson, R.R. (2001). Alcoholism and immune function. In
Psychoneuroimmunology, D.Ader, D.L.Felten, and N.Cohen, eds. (San Diego: Academic Press), pp.
687‐700.
Hsiung, L., Wang, J., and Waltenbaugh, C. (1994). Flow cytometric analysis of lymphocyte subsets
of mice maintained on an ethanol‐containing liquid diet. Alcohol Clin. Exp. Res. 18, 12‐20.
Institute of Laboratory Animal Resources, C.o.L.S.N.R.C. (1996). Guide for the Care and Use of
Laboratory Animals. (Washington, D.C.: National Academy Press).
Jerrells, T.R., Saad, A.J., and Domiati‐Saad, R. (1992). Effects of ethanol on parameters of cellular
immunity and host defense mechanisms to infectious agents. Alcohol 9, 459‐463.
Jerrells, T.R., Smith, W., and Eckardt, M.J. (1990). Murine model of ethanol‐induced
immunosuppression. Alcohol Clin Exp. Res 14, 546‐550.
19
Jiménez, V., Cardinali, D.P., Alvarez, M.P., Fernández, M.P., Boggio, V., and Esquifino, A.I. (2005).
Effect of chronic ethanol feeding on 24‐hour rhythms of mitogenic responses and lymphocyte
subset populations in thymus and spleen of peripubertal male rats. Neuroimmunomodulation 12,
357‐365.
Kapasi, A.A., Patel, G., Goenka, A., Nahar, N., Modi, N., Bhaskaran, M., Reddy, K., Franki, N., Patel,
J., and Singhal, P.C. (2003). Ethanol promotes T cell apoptosis through the mitochondrial pathway.
Immunology 108, 313‐320.
Kruger, T.E. and Jerrells, T.R. (1994). Effects of ethanol consumption and withdrawal on B cell
subpopulations in murine bone marrow. Clin Exp. Immunol. 96, 521‐527.
Laso, F.J., Iglesias‐Osma, C., Ciudad, J., Lopez, A., Pastor, I., and Orfao, A. (1999). Chronic
alcoholism is associated with an imbalanced production of Th‐1/Th‐2 cytokines by peripheral
blood T cells. Alcohol Clin Exp. Res 23, 1306‐1311.
Lau, A., von, D., V, Sander, M., MacGuill, M., Lanzke, N., and Spies, C. (2009). Alcohol use disorder
and perioperative immune dysfunction. Anesth. Analg. 108, 916‐920.
Lieber, C.S. and DeCarli, L.M. (1994). Animal models of chronic ethanol toxicity. Methods Enzymol.
233, 585‐594.
Livant, E.J., Welles, E.G., and Ewald, S.J. (1997). Chronic ethanol exposure alters leukocyte subsets
in repopulating spleens, but does not alter negative selection in thymuses of sublethally irradiated
mice. Alcohol Clin Exp. Res 21, 1520‐1529.
Márquez, C., Belda, X., and Armario, A. (2002). Post‐stress recovery of pituitary‐adrenal hormones
and glucose, but not the response during exposure to the stressor, is a marker of stress intensity in
highly stressful situations. Brain Res 926, 181‐185.
Messingham, K.A., Faunce, D.E., and Kovacs, E.J. (2002). Alcohol, injury, and cellular immunity.
Alcohol 28, 137‐149.
Nagy, L.E. (2008). Alcohol: Methods and Protocols. (New Jersey: Humana Press).

20
Nath, B. and Szabo, G. (2009). Alcohol‐induced modulation of signaling pathways in liver
parenchymal and nonparenchymal cells: implications for immunity. Semin. Liver Dis. 29, 166‐177.
Nava‐Aguilera, E., Andersson, N., Harris, E., Mitchell, S., Hamel, C., Shea, B., Lopez‐Vidal, Y.,
Villegas‐Arrizon, A., and Morales‐Perez, A. (2009). Risk factors associated with recent transmission
of tuberculosis: systematic review and meta‐analysis. Int. J Tuberc. Lung Dis. 13, 17‐26.
Neill, J.D. (1970). Effect of "stress" on serum prolactin and luteinizing hormone levels during the
estrous cycle of the rat. Endocrinology 87, 1192‐1197.
Padgett, E.L., Sibley, D.A., and Jerrells, T.R. (2000). Effect of adrenalectomy on ethanol‐associated
changes in lymphocyte cell numbers and subpopulations in thymus, spleen, and gut‐associated
lymphoid tissues. Int. J Immunopharmacol. 22, 285‐298.
Rosenwasser, A.M. (2001). Alcohol, antidepressants, and circadian rhythms. Human and animal
models. Alcohol Res Health 25, 126‐135.
Saad, A.J. and Jerrells, T.R. (1991). Flow cytometric and immunohistochemical evaluation of
ethanol‐induced changes in splenic and thymic lymphoid cell populations. Alcohol Clin Exp. Res 15,
796‐803.
Sibley, D.A., Fuseler, J., Slukvin, I., and Jerrells, T.R. (1995). Ethanol‐induced depletion of
lymphocytes from the mesenteric lymph nodes of C57B1/6 mice is associated with RNA but not
DNA degradation. Alcohol Clin Exp. Res 19, 324‐331.
Spanagel, R., Pendyala, G., Abarca, C., Zghoul, T., Sanchis‐Segura, C., Magnone, M.C., Lascorz, J.,
Depner, M., Holzberg, D., Soyka, M., Schreiber, S., Matsuda, F., Lathrop, M., Schumann, G., and
Albrecht, U. (2005a). The clock gene Per2 influences the glutamatergic system and modulates
alcohol consumption. Nat. Med 11, 35‐42.
Spanagel, R., Rosenwasser, A.M., Schumann, G., and Sarkar, D.K. (2005b). Alcohol consumption
and the body's biological clock. Alcohol Clin Exp. Res 29, 1550‐1557.
Starkenburg, S., Munroe, M.E., and Waltenbaugh, C. (2001). Early alteration in leukocyte
populations and Th1/Th2 function in ethanol‐consuming mice. Alcohol Clin Exp. Res 25, 1221‐
1230.
21
Stephens, D.N., Ripley, T.L., Borlikova, G., Schubert, M., Albrecht, D., Hogarth, L., and Duka, T.
(2005). Repeated ethanol exposure and withdrawal impairs human fear conditioning and
depresses long‐term potentiation in rat amygdala and hippocampus. Biol Psychiatry 58, 392‐400.
Stolle, M., Sack, P.M., and Thomasius, R. (2009). Binge drinking in childhood and adolescence:
epidemiology, consequences, and interventions. Dtsch. Arztebl. Int. 106, 323‐328.
Szabo, G. and Mandrekar, P. (2009). A recent perspective on alcohol, immunity, and host defense.
Alcohol Clin Exp. Res 33, 220‐232.
Townshend, J.M. and Duka, T. (2005). Binge drinking, cognitive performance and mood in a
population of young social drinkers. Alcohol Clin Exp. Res 29, 317‐325.
Waltenbaugh, C., Vasquez, K., and Peterson, J.D. (1998). Alcohol consumption alters antigen‐
specific Th1 responses: mechanisms of deficit and repair. Alcohol Clin Exp. Res 22, 220S‐223S.
Zghoul, T., Abarca, C., Sanchis‐Segura, C., Albrecht, U., Schumann, G., and Spanagel, R. (2007).
Ethanol self‐administration and reinstatement of ethanol‐seeking behavior in Per1(Brdm1) mutant
mice. Psychopharmacology (Berl) 190, 13‐19.
22
Figure 1. Effect of a continuous or discontinuous drinking of ethanol on mitogenic responses in cells derived from submaxillary lymph nodes and spleen of peripubertal rats . Groups of 8 rats subjected to a discontinuous ethanol liquid diet, a chronic ethanol liquid diet or to a control liquid diet as described in Methods were killed by decapitation at 6 different time intervals throughout a 24 h cycle. Bar indicates scotophase duration. Shown are the means ± SEM. Letters indicate the existence of significant differences between time points within each group after a Bonferroni´s multiple comparisons test, as follows: a p< 0.01 vs. all time points; b p< 0.02 vs. 0900, 2100, 0100 and 0500 h; c p< 0.02 vs. 0500 h; d p< 0.02 vs. 1300 and 2100 h; e p< 0.01 vs. 1700, 2100 and 0500 h; f p< 0.01 vs. 0900 and 1700 h; g p< 0.02 vs. 1300 h. For further statistical analysis, see text.

23
Figure 2. Effect of a continuous or discontinuous drinking of ethanol on 24‐h changes of CD4+, CD8+ and CD4+‐CD8+cells, and CD4+/CD8+ ratio, in submaxillary lymph nodes and spleen of peripubertal rats. For experimental details see legend to Fig. 1. Shown are the means ± SEM. Letters indicate the existence of significant differences between time points within each group after a Bonferroni´s multiple comparisons test, as follows: a p< 0.01 vs. 0100, 1300 and 2100 h; b p< 0.03 vs. 1300, 2100, 0100 and 0500 h; c p< 0.02 vs. 2100 h; d p< 0.01 vs. all time points; e p< 0.01 vs. 0900, 1300, 1700 and 0500 h; f p< 0.01 vs. 0900, 1300 and 1700 h; g p< 0.01 vs. 1300, 2100, 0100 and 0500 h; h p< 0.01 vs. 2100, 0100 and 0500 h; i p< 0.02 vs. 0100 and 1300 h; j p< 0.001, 0900 and 2100 h. For further statistical analysis, see text.

24
Figure 3. Effect of a continuous or discontinuous drinking of ethanol on 24‐h changes of T and B lymphocytes, and T/B ratio, in submaxillary lymph nodes and spleen of peripubertal rats. For experimental details see legend to Fig. 1. Shown are the means ± SEM. Letters indicate the existence of significant differences between time points within each group after a Bonferroni´s multiple comparisons test, as follows: a p< 0.02 vs. 1300 h; b p< 0.01 vs. 1700 and 0100 h; c p< 0.02 vs. 0900, 0100 and 0500 h; d p< 0.01 vs. all time points; e p< 0.01 vs. 0900, 1300, 1700 and 0500 h; f p< 0.01 vs. 1300, 2100 and 0100 h; g p< 0.01 vs. 0900, 1700, 2100 and 0500 h. For further statistical analysis, see text.

25
Figure 4. Effect of a continuous or discontinuous drinking of ethanol on 24‐h changes of total number of viable cells recovered from submaxillary lymph nodes and spleen of peripubertal rats. For experimental details see legend to Fig. 1. Shown are the means ± SEM. In a factorial ANOVA there were no significant differences among groups, nor as a function of time of day.

26
Figure 5. Effect of a continuous or discontinuous drinking of ethanol on plasma prolactin levels in peripubertal rats . For experimental details see legend to Fig. 1. Shown are the means ± SEM. Letters indicate the existence of significant differences between time points within each group after a Bonferroni´s multiple comparisons test, as follows: a p< 0.01 vs. 0900, 1300 and 1700 h; b p< 0.01 vs. 0900, 2100 and 0500 h; c p< 0.01 vs. 0900, 1700 and 0100 h: d p< 0.05 vs. 0900 h.

27
Figure 6. Mitogenic responses in cells derived from submaxillary lymph nodes and spleen of peripubertal rats receiving regular rat chow and water ad libitum as compared to control liquid diet animals. Groups of 8 rats fed with regular rat chow and water were killed by decapitation at 6 different time intervals throughout a 24 h cycle. Control liquid diet data are from Fig. 1. Bar indicates scotophase duration. Shown are the means ± SEM. Letters indicate the existence of significant differences between time points within each group after a Bonferroni´s multiple comparisons test, as follows: a p< 0.01 vs. all time points; b p< 0.02 vs. 0900 and 0500 h; c p< 0.01 vs. 0900 and 1700 h; d p< 0.02 vs. 0900 and 2100 h. Differences between groups were not significant when analyzed as main factors in a factorial ANOVA.