
Jim Innes and Malcolm North USDA-PSW Sierra Nevada Research Center Davis, California
15
Effect of silvicultural Effect of silvicultural and prescribed fire and prescribed fire treatments on coarse treatments on coarse woody debris dynamics in woody debris dynamics in a sierran old growth a sierran old growth mixed-conifer forest. mixed-conifer forest. Jim Innes and Malcolm North USDA-PSW Sierra Nevada Research Center Davis, California
-
Upload
gisela-hinton -
Category
Documents
-
view
16 -
download
0
description
Effect of silvicultural and prescribed fire treatments on coarse woody debris dynamics in a sierran old growth mixed-conifer forest. Jim Innes and Malcolm North USDA-PSW Sierra Nevada Research Center Davis, California. Coarse Woody Debris (CWD) in the Sierra Nevada. - PowerPoint PPT Presentation
Transcript of Jim Innes and Malcolm North USDA-PSW Sierra Nevada Research Center Davis, California

Effect of silvicultural and Effect of silvicultural and prescribed fire treatments on prescribed fire treatments on
coarse woody debris dynamics in coarse woody debris dynamics in a sierran old growth mixed-conifer a sierran old growth mixed-conifer
forest.forest.
Jim Innes and Malcolm NorthUSDA-PSW Sierra Nevada Research
Center Davis, California

Coarse Woody Debris (CWD) in the Sierra Nevada
• Important habitat for small to mid-sized mammals particularly during snow cover.
• Long duration fire fuels.• Knowledge gap concerning
management/restoration guidelines for CWD in Sierra Nevada.– Guidelines are based on fire
suppressed forest structures (for example, The CASPO Report).
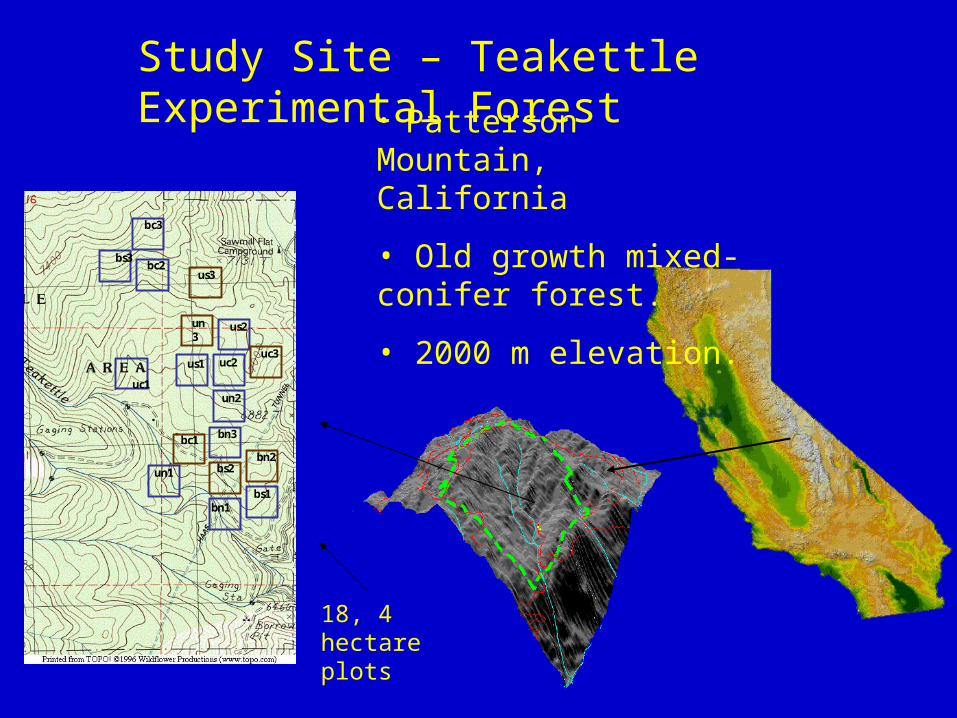
Study Site – Teakettle Experimental Forest
bn1
un1
uc1
uc2
bs2
bs3
bn3
us1
bc3
bc2
bn2
bs1
bc1
un2
us2
us3
un3
uc3
bn1
un1
uc1
uc2
bs2
bs3
bn3
us1
bc3
bc2
bn2
bs1
bc1
un2
us2
us3
un3
uc3
18, 4 hectare plots
• Patterson Mountain, California
• Old growth mixed- conifer forest.
• 2000 m elevation.

Methods• Full Factorial Experiment with 3 replicates:
– Prescribed fire and 2 levels of cutting:• Shelterwood (Low thinning) > 25 cm leaving 22 trees per hectare.
• California spotted owl cut (CASPO) harvest from 25 cm to 76 cm.
• Here we are using a plot from each treatment and 3 controls.
• Mapped all logs > 30 cm small-end-diameter within each 4 ha plot.
• Decay classes 1 – 4. • Analysis: t-test and Ripley’s K function, alpha = .05

HypothesesThin no burn treatment:
– Increase the per hectare plot density, volume and mass of CWD.
– Decrease mean piece large-end-diameter and volume.
Burning in combination with thinning:
– Decrease per hectare plot density, volume and mass of CWD.
– Decrease mean piece-volume and mean piece large-end-diameter.
Burning alone.
– Increase mean piece-volume and mean piece large-end-diameter.
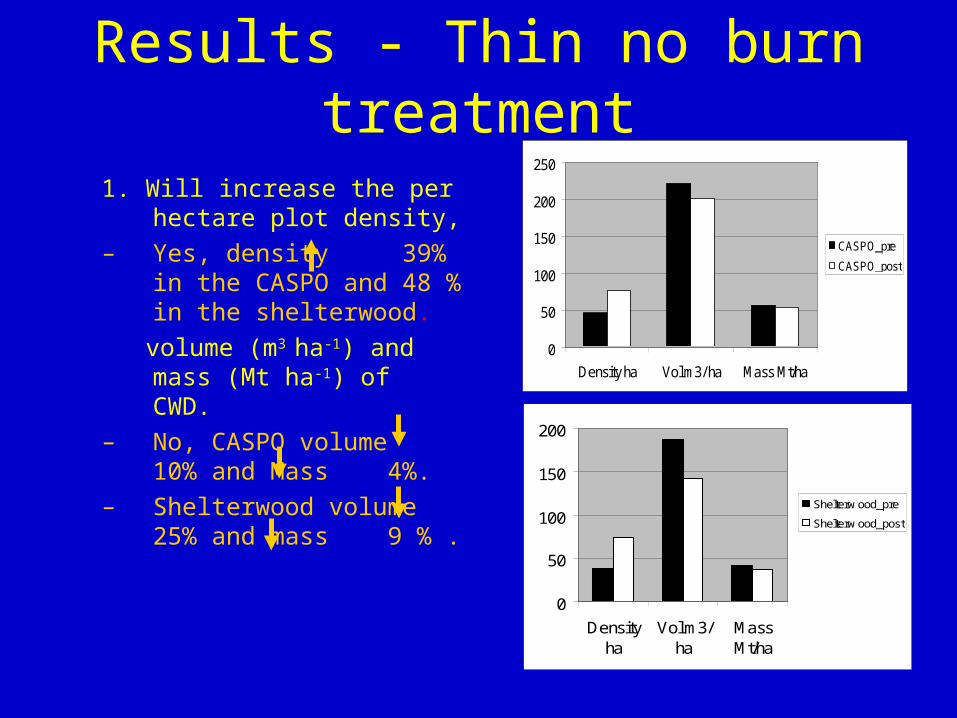
Results - Thin no burn treatment
1. Will increase the per hectare plot density,
– Yes, density 39% in the CASPO and 48 % in the shelterwood.
volume (m3 ha-1) and mass (Mt ha-1) of CWD.
– No, CASPO volume 10% and Mass 4%.
– Shelterwood volume 25% and mass 9 % .
0
50
100
150
200
Densityha
Vol m3/ha
MassMt/ha
Shelterwood_pre
Shelterwood_post
0
50
100
150
200
250
Density ha Vol m3/ ha Mass Mt/ha
CASPO_pre
CASPO_post

Results - Thin no burn treatment
2. Thinning alone will decrease mean piece large-end-diameter (cm) and volume (m3) .
– CASPO mean piece large-end-diameter 21% (16 cm, (p=0.0001).
– Mean piece volume 44% (2.1 m3, p=0.004).
– Shelterwood mean piece large-end-diameter 19% (13.4 cm, p=0.0001).
– Mean piece volume 60% (2.9 m3, p=0.0001).
0102030405060708090
Mean large-end-diameter cm
CASPO_pre
CASPO_post
Shelterwood_pre
Shelterwood_post
0123456
Mean piece vol m3
CASPO_pre
CASPO_post
Shelterwood_pre
Shelterwood_post

Results - Thin and burn treatment1. Decrease in per hectare plot
density, volume (m3 ha-1) and mass (Mt ha-1).
– CASPO Density 38%, volume 70% and mass 69%.
– Shelterwood by 26%, volume 39% and mass 19%.
0
50
100
150
200
250
Densityha
Vol m3/ha
MassMt/ha
CASPO_burn_pre
CASPO_burn_post
020406080
100120140160180
Densityha
Vol m3/ha
MassMt/ha
Shelterwood_burn_pre
Shelterwood_burn_post

Results - Thin and burn treatment
0102030405060708090
100
Mean large-end-diameter cm
CASPO_burn_pre
CASPO_burn_post
Shelterwood_burn_pre
Shelterwood_burn_post
2. Decrease mean piece-volume (m3) and mean piece large-end-diameter (cm).
•CASPO 60% mean piece-volume (2.2 m3, P=.0001).• 29% mean piece large-end-diameter (22.4 cm, p=.0001).
•Shelterwood 56% mean piece-volume (3.2 m3, P=.007). • 24% Mean piece large-end-diameter (20.5 cm, p=.0001).
0
1
2
3
4
5
6
7
Mean piece vol m3
CASPO_burn_pre
CASPO_burn_post
Shelterwood_burn_pre
Shelterwood_burn_post

Results – Burn only treatment
• Increase mean piece volume (m3) and mean piece large-end-diameter (cm).– Mean piece volume by
50% (2.5 m3, p=0.003) and mean piece large-end-diameter 12% (8 cm, p=.03).
0
1
2
3
4
5
6
mean piece Vol m3
Burn only pre
Burn only post
01020
30405060
7080
Large-end-diameter cm
Burn only pre
Burn only post
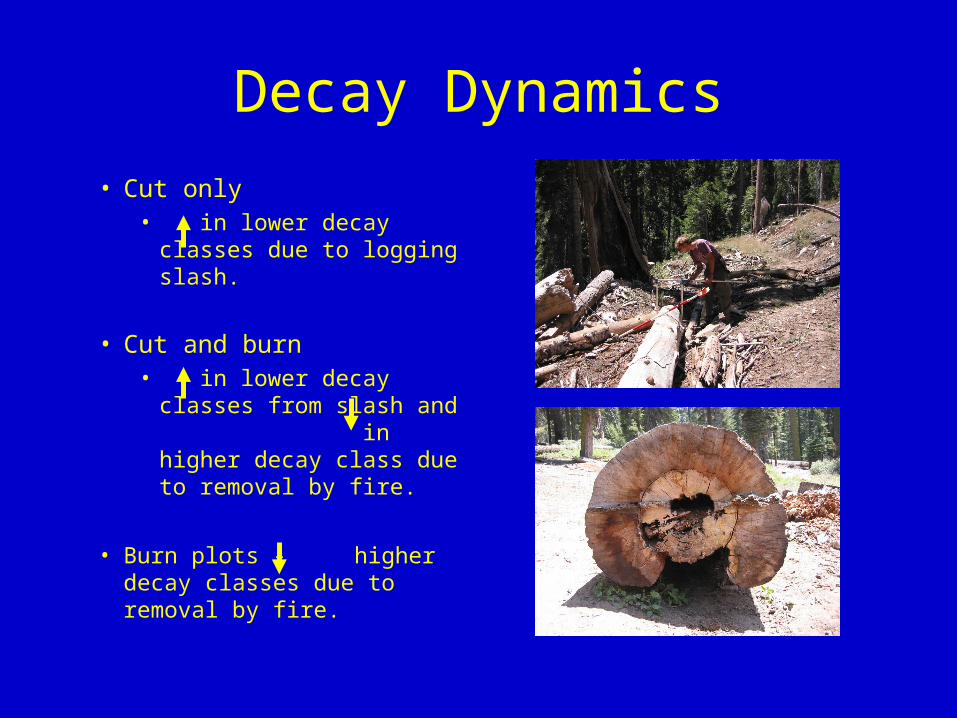
Decay Dynamics
• Cut only• in lower decay classes
due to logging slash.
• Cut and burn• in lower decay classes
from slash and in higher decay class due to removal by fire.
• Burn plots - higher decay
classes due to removal by fire.
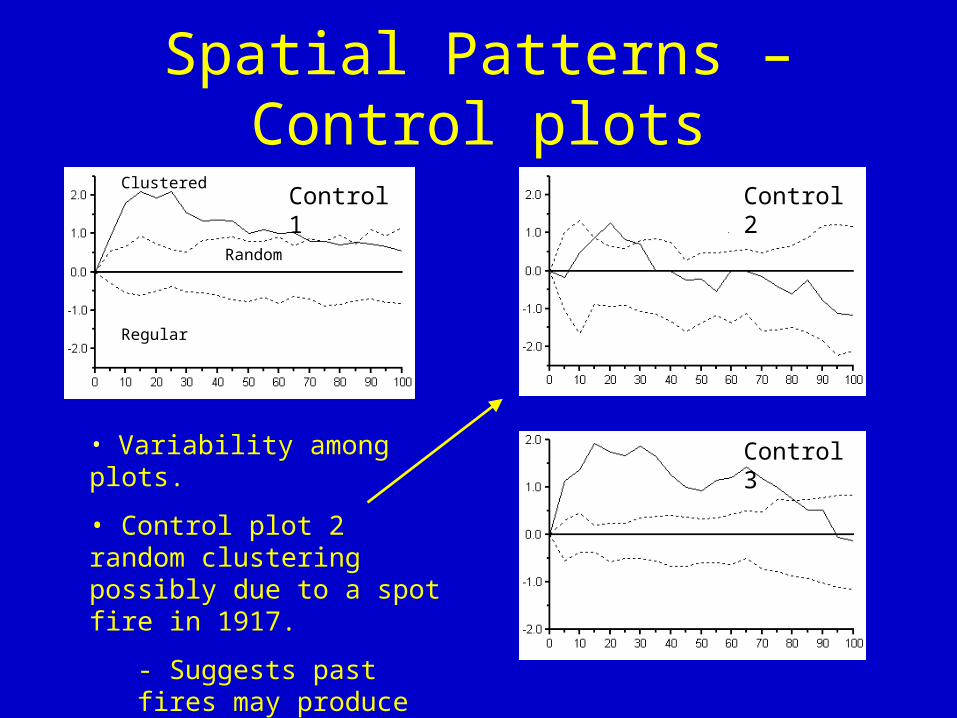
Spatial Patterns – Control plots
• Variability among plots.
• Control plot 2 random clustering possibly due to a spot fire in 1917.
- Suggests past fires may produce long lasting legacy patterns.
Control 1
Control 3
Control 2Clustered
Random
Regular

Spatial Patterns – Treated plots Shelterwood
Unburned shelterwood
Burn only pretreatment Burn only post-treatment
Pretreatment
Burned shelterwoodPretreatment
CASPO
Pretreatment Unburned CASPO
Burned CASPOPretreatment
Clustered
Random
Regular
• No trend in spatial patterns with treatments.• or in significance of clustering with treatment.

Summary• Cut and cut and burn treatments –
1. Change in quality of CWD from fewer larger pieces to a greater number of smaller pieces.
2. Average diameter 16 cm in cut only.3. Average diameter 21 cm in cut and burn plots.4. Shift in decay to the lower decay classes.
• Burn only – 1. Less of a diameter reduction relative to the cut, cut and burn plots
(8 cm) due to no inputs of smaller diameter logs.
• Variation in topography, aspect and past fire history likely plays a large role in CWD dynamics.
• Spatial patterns do not show a trend with cutting and or burning treatments and fall within pretreatment spatial variability.

Recommendations for Managers
• Contact– Jim Innes – [email protected]
– http://teakettle.ucdavis.edu
• Cutting and cutting and burning alter the structure of CWD more so than fire alone.
• Reductions in log diameters may impact habitat availability for some species. Leaving some larger logs may mitigate diameter decreases after cutting and burning.
• Spatial patterns do not appear to be altered by the treatments beyond the pretreatment range of variability at the studied scale.