JEC Well-to-Wheels study version 5: a look into the carbon ...
21
Introduction The JEC consortium is a long-standing collaboration between the European Commission’s Joint Research Centre (JRC), EUCAR (European Council for Automotive R&D) and Concawe. The overall objective of this collaboration is to: l evaluate the energy and greenhouse gas (GHG) emissions associated with powertrains and fuel quality, and the interaction between them; l conduct coordinated research on the evaluation of the relative performance of future powertrains and fuels; and l support the sustainability of European fuel- and vehicle-related industries, and to provide the European Union (EU) with scientific facts for policy support. The consortium periodically updates their joint evaluation of well-to-wheels (WTW) energy use and (GHG) emissions, for a wide range of potential future powertrains and fuels options, within the European context. The JEC WTW reports and methodology have become a scientific basis for the European energy and transport research landscape. The objectives of the WTW study are to: l establish, in a transparent and objective manner, a consensual well-to-wheels energy demand and GHG emissions assessment of the substitution of a wide range of automotive fuels and powertrains in 2030 and beyond in Europe; l consider the viability of each fuel pathway and estimate the associated macro-economic costs; and l have the outcome accepted as a reference by all relevant stakeholders. The WTW modelling of vehicles consists of three main parts (see Figure 1 on page 27): 1. A well-to-tank (WTT) analysis [1] which accounts for the energy and GHG emissions associated with the supply of energy carriers. 2. A tank-to-wheels (TTW) analysis [2,3] which accounts for the energy conversion and the associated GHG emissions while the vehicle is in use. 3. A well-to-wheels (WTW) report [4] which integrates the whole process of fuel production and consumption. The integration of WTT and WTW data is led by Concawe/JRC, while the TTW modelling is conducted by EUCAR. The methodologies and findings are presented in the three main reports (each complemented by a series of appendices), representing the WTT, TTW and the WTW integration of the vehicle/fuel combinations. More information regarding the consortium and previous publications can be downloaded from: https://ec.europa.eu/jrc/en/jec 26 Concawe Review Volume 29 • Number 2 • February 2021 JEC Well-to-Wheels study version 5: a look into the carbon intensity of different fuel/powertrain combinations in 2030 Version 5 of the JEC evaluation of well-to-wheels energy use and greenhouse gas emissions for a range of potential future fuel and powertrain options has now been completed. Full details are available online via the JEC consortium website at https://ec.europa.eu/jrc/en/jec. This article provides an overview of the JEC study.
Transcript of JEC Well-to-Wheels study version 5: a look into the carbon ...

Introduction The JEC consortium is a long-standing collaboration between the European Commission’s Joint Research Centre (JRC), EUCAR (European Council for Automotive R&D) and Concawe. The overall objective of this collaboration is to:
l evaluate the energy and greenhouse gas (GHG) emissions associated with powertrains and fuel quality, and the interaction between them;
l conduct coordinated research on the evaluation of the relative performance of future powertrains and fuels; and
l support the sustainability of European fuel- and vehicle-related industries, and to provide the European Union (EU) with scientific facts for policy support.
The consortium periodically updates their joint evaluation of well-to-wheels (WTW) energy use and (GHG) emissions, for a wide range of potential future powertrains and fuels options, within the European context. The JEC WTW reports and methodology have become a scientific basis for the European energy and transport research landscape. The objectives of the WTW study are to:
l establish, in a transparent and objective manner, a consensual well-to-wheels energy demand and GHG emissions assessment of the substitution of a wide range of automotive fuels and powertrains in 2030 and beyond in Europe;
l consider the viability of each fuel pathway and estimate the associated macro-economic costs; and l have the outcome accepted as a reference by all relevant stakeholders. The WTW modelling of vehicles consists of three main parts (see Figure 1 on page 27):
1. A well-to-tank (WTT) analysis[1] which accounts for the energy and GHG emissions associated with the supply of energy carriers.
2. A tank-to-wheels (TTW) analysis[2,3] which accounts for the energy conversion and the associated GHG emissions while the vehicle is in use.
3. A well-to-wheels (WTW) report[4] which integrates the whole process of fuel production and consumption.
The integration of WTT and WTW data is led by Concawe/JRC, while the TTW modelling is conducted by EUCAR. The methodologies and findings are presented in the three main reports (each complemented by a series of appendices), representing the WTT, TTW and the WTW integration of the vehicle/fuel combinations. More information regarding the consortium and previous publications can be downloaded from: https://ec.europa.eu/jrc/en/jec
26 Concawe Review Volume 29 • Number 2 • February 2021
JEC Well-to-Wheels study version 5: a look into the carbon intensity of different fuel/powertrain combinations in 2030
Version 5 of the JEC evaluation of well-to-wheels energy use and greenhouse gas emissions for a range of potential future fuel and powertrain options has now been completed. Full details are available online via the JEC consortium website at https://ec.europa.eu/jrc/en/jec. This article provides an overview of the JEC study.

Well-to-tank (WTT) Pathways Scope
The WTT study aims to provide a detailed evaluation of the expended energy—and associated CO2 emissions—related to the whole supply chain for fuel production. The main objective of the study report is to assist the readers and guide stakeholders in answering questions about: l possible alternative pathways to produce a certain fuel, and which of these pathways offer the best
performance in terms of energy use and GHG emissions; and l initial prospects on alternative uses for a given resource, looking at how it can best be utilised to
produce the final fuel, in terms of both the energy requirement and GHG emissions. The JEC WTT v5 study assesses the incremental emissions (marginal approach) associated with the production of a unit of alternative fuel, with respect to the current status of production (Section 2.3 in the WTT report). This marginal approach has been chosen as it is instrumental in:
l guiding judgements on the potential benefits of substituting conventional fuels/vehicles with a specific alternative; and
l helping to understand where the additional energy resources would come from for future fuels.
27Concawe Review Volume 29 • Number 2 • February 2021
JEC Well-to-Wheels study version 5: a look into the carbon intensity of different
fuel/powertrain combinations in 2030
Note: The WTW analysis differs from a life-cycle analysis (LCA) as it does not consider the energy and emissions involved in building facilities and vehicles, or the end-of-life aspects.
Figure 1: System boundary of the JEC WTW analysis (energy expended and CO2eq)
@ ��
���A
@� ��
������������������ �
����������������� �
���������B����C��� �
��������� B����C��� �
2� ������ ���
6������������� �D�/E�7
2� �������� ����� ���
@ ���������A6@��7
���A����@� ��6��@7
�����������������
���������������������������������
��������������������A �
����������������������
���������������� ������A �
�����������������������������
F����������

The WTT study encompasses different fuel categories, such as fossil-derived fuels, biofuels from vegetable oil, and various gaseous fuel productions, etc. The WTT report comprises 9 Excel workbook models, structured per energy carrier categories, namely oil, natural gas, biogas, ethanol, biodiesel, hydro-treated vegetable oils (HVO), synthetic fuels, hydrogen, electricity and heat. Within each fuel category, a wide number of potential pathways have been analysed, for example: ethanol produced from wheat, sugar beet, barley, etc.; and biodiesel obtained from different vegetable oils such as rapeseed, soy, sunflower, palm, etc. The fuel matrix illustrated in Figure 2 illustrates the different possible feedstock-to-fuel pathway combinations.
28 Concawe Review Volume 29 • Number 2 • February 2021
JEC Well-to-Wheels study version 5: a look into the carbon intensity of different fuel/powertrain combinations in 2030
Figure 2: Well-to-wheels resource-to-fuels pathways (Version 5)
����� �� �
) ����
�����3�� ��
&��������
#������F�1
3���%�������������:%���;&�����4������������
3�� ��,
#��������D����?����B������E�:� ��;D��������%#��������3�������#�� %��# ��������� ����= ����� �����D �%����)
������% �:� ���;D����8������� ��2� %��� ���� ������������ ������%����������#�%��������
?� ����
1��
��
�(�
����
:*�
"-<
����
�;
1��
��
�4"
�B�
��
���
����
��
���
#���
�����
���
��
�:�
��
����
����
���
����
��;
=��
��?
-:*
�"-
���
>���
���
;
#���
�����
���
��
�
#���
�����
���
��
#���
�����
���
��:
���
���
����
���
����
�;
=�
4
7�
4
4���
�
���
���
�2?4
B42?4
4=+�
����
8��
����
�
�
���
4B�
�44
AI
7
�&
1
�?1
#&1
F&1
F�1
A��
� ��
�:�
���
����
�(�<
���;
4��
����
���
A��
�
2� �
H" H"
H
H+
H
H"
H
H+H
H
H"�
H
H+
H
H
H
H* H*
H!H�
H
H
H*
H-
H-
H*
H*
H*
H
H"
H*
H*
H-
H-
H*
H*
H
HH"
HH H
H"H"
H
H
H"
H
H�
HH
HHHH
HHHH
H H" HHH
HH
HH H
H
H
H+
HH+
HHH
HH
HH
HH
HHH
H
H
H
HH H
HHH
HH
Notes: 1 With/without CCS 2 Biogas 3 Associated with natural gas
production 4 EU and US sources 5 Heavy fuel oil 6 Heating oil/diesel 7 Bio-SNG or bio-LNG 8 Forestry residue 9 Black liquor pathway included 10 Via isobutylene and ethanol
from sugar beet via the process described by Global Bioenergies

In the WTW v5 report, the energy expended and the GHG results are summarised as interactive pivot charts (in addition to the traditional summary charts used previously in version 4) for all the pathways in each workbook/fuel category, to improve readability for users. Major updates versus WTT v4
The updated WTT report now includes the following:
l 252 energy carrier pathways in total (including heat and power in Appendix 4). Energy consumption and GHG emissions data for almost all of the pathways included in version 4 have been updated based on recent literature reviews or new available data sources (e.g. for conventional fuels, the energy and GHG data for crude oil extraction and refining have been updated according to the recent data). The energy use and GHG emissions of all the biofuel pathways have changed significantly compared to version 4, because the latest version implements the basic assumptions outlined in the Renewable Energy Directive (RED II), or forestry residue collection, short rotation forestry, wood chips storage (seasoning), biomass transport, and transport and distribution data for the final fuels. Among many other changes, these are the most significant/apparent compared to version 4.
l 78 new pathways (in addition to those in v4) have been added to better represent the current state-of-the-art technologies in the fuel sector. Some of the new pathways represent additional features in the existing fuel production facilities (e.g. carbon capture and storage (CCS) in gasoline production, high-octane petrol, etc.), while others represent novel feedstock and innovative production technologies (e.g. sugar beet-based ETBE, synthetic fuels from waste and farmed wood, biogas to hydrogen, etc.). Also included is a new section on power-to-fuels. Additionally, the report investigates the possibilities for using high-octane gasoline for higher energy efficiency in conventional petrol vehicles. Therefore, three types of high research octane number (RON) gasoline (RON 100, RON 102/E5eq and RON102/E10eq) pathways have been included.
l 54 synthetic fuel pathways are now available in version 5, of which 35 are new. Among the synthetic fuels, two new subcategories have been added: pyrolysis fuels and oxy-methylene dimethyl ether (OME). In addition, the production of synthetic methane, methanol and dimethyl ether (DME) from renewable electricity is now also included. Furthermore, ethanol-based ED95 fuel pathways for diesel-like engines (modelled as a mixture of ethanol, lubricants, i-butanol, polyethylene glycol, etc.) is another interesting addition to version 5. Considering that some production pathways are technologically and commercially more mature than others, the technology readiness level (TRL) and market/commercial readiness level (CRL) have been introduced to complement the analysis and to support the readership in making their potential evaluations. The TRL ranges from 1–9, indicating a spectrum from research, development, demonstration and deployment, while the CRL ranges from 1–6, indicating the status of the various pathways from pilot scale to competitive commercial scale in the market.
l Another important update addresses the different blends of biofuels and the market mix (and availability) of different pathways in each biofuel category. A detailed description, based on different sources, of the current scenario and the predictions for the 2030 market mix of ethanol, biodiesel and HVO are also included.
29Concawe Review Volume 29 • Number 2 • February 2021
JEC Well-to-Wheels study version 5: a look into the carbon intensity of different
fuel/powertrain combinations in 2030
It is demonstrated throughout the JEC WTT v5 report that the variability among more than 250 different pathways modelled is significant in terms of the WTT energy expended and the GHG emissions when compared with conventional fuels. Factors such as the conversion pathways chosen and the feedstock/resource used have a strong impact on the final results. A specific comparison section has been introduced, which summarises the detailed results by way of:
a) a fuel comparison, which aims to show the WTT energy expended and the level of GHG emissions per type of fuel (e.g. fossil, CNG, DME, etc.), including the range (min/max) and a representative pathway for each of the conversion routes modelled; and
b) a resource-to-fuels comparison, which enables a comparison of the impacts of using different feedstock/resource options to produce a specific fuel.
The most ‘representative’ pathways have been selected, mainly on the basis of techno-economical evaluations in line with RED II criteria. These representative pathways are used for the JEC WTW integration (more details on the selection criteria are presented in Section 5 of the JEC WTT v5 report, Comparative analysis, and also in Appendix 1). Figure 3 on page 31 of this article shows an example of one of the comparisons made among the JEC WTT v5 values (energy expended and GHG emissions) for the selected fuel production pathways presented in the report. Analysing the results allows the following general conclusions to be drawn:
l In terms of WTT energy required for fuel supply, among fossil-based fuels, the representative pathways for LPG, LNG and CNG are more energy efficient than conventional crude oil-based pathways.
l Among the representative pathways with high energy input, the most energy-intensive WTT pathways result from the use of electricity (when the EU mix is considered), liquefied bio-methane (LBM) and synthetic OME.
l A number of pathways offer the possibility of achieving negative WTT emissions, e.g. LBM/CBM (liquefied bio-methane/compressed bio-methane) as well as electricity and hydrogen when produced from biogas due to the avoided CH4 and N2O emissions,1 and the production of synthetic diesel from biomass when coupled with CCS processes (a portion of CO2 absorbed from the crops is not released but permanently stored in underground geologic formations — see Section 3.5 of the JEC WTT v5 report). It is important to point out that, for biomethane, negative emissions are the result of a reduction in GHG emissions compared to a reference use (e.g. avoided CH4 emissions). In the case of bio-CCS, if CO2 is permanently sequestered, that pathway is actually increasing the carbon-sink and is actively removing carbon from the atmosphere. (Both pathways actively mitigate climate change, but one is reducing emissions, the other is increasing a sink.)
l It is worth noting that the wide variability observed in some pathways, such as for HVO, compressed/ liquefied biomethane (CBM/LBM), H2 and electricity, is heavily dependent on the conversion route/ feedstock chosen, which has a significant impact on the final expended energy and GHG emissions.
30 Concawe Review Volume 29 • Number 2 • February 2021
JEC Well-to-Wheels study version 5: a look into the carbon intensity of different fuel/powertrain combinations in 2030
1 It should be noted that the negative GHG emissions for biomethane from manure can only be taken into account as long as there are farms where the storage of untreated manure is in use.

31Concawe Review Volume 29 • Number 2 • February 2021
JEC Well-to-Wheels study version 5: a look into the carbon intensity of different
fuel/powertrain combinations in 2030
Figure 3: Comparison of WTT values (energy expended and GHG emissions) for some of the selected fuel production pathways
�"��
D221
A1
��
����
��
:��
7*�
<B�
0 ��
� �
�;
�
�-�
���
�*�
"��
�"��
�"*�
�@*0!!
*.+
*�
��
-�
"��
"*�
*)*�
*�0
�@�0
�.+
@@+/ �
1��G� ������
@�-H �
-E�
��0-��"
-�������� �������
0��0 �
�I0
0)*0
*I0
��0
0������
1/���.��/��
/�($
���
�� � �
@@�0
1��G�������
@@*0!
1��GI0
@@�+/
1��G�+/
*)/.
/�./�+�./
0��/ �
1��G�+/
@@1�!
1��G�� � �
@�/� �
/������
)�2�
.���� � �
/+/*"�
/� ������+��J��!#:
0��- �
-!
�"��
���
"��
��
2 �
�1
A1
6D
22K
� �
����
� �
:��
7*�
<B�
0;
+��J�!': $::
�G�
4���
���
����
���
:�0B
�0
���
��;
!G�
,G�
�G�
�G�
)G�
*G�
"G�
�@*0!!
*.+
-G�
*)*�
*�0
�@�0
�.+
@@+/ �
1��G� ������
@�-H �
-E�
��0-��"
-�������� �������
0��0 �
�I0
0)*0
*I0
��0
0������
1/���.��/��
/�($
���
�� � �
@@�0
1��G�������
@@*0!
1��GI0
@@�+/
1��G�+/
*)/.
/�./�+�./
0��/ �
1��G�+/
@@1�!
1��G�� � �
@�/� �
/������
)�2�
.���� � �
/+/*"�
/� ������
0��- �
-!
)��� J�6+�����+��7
@������� �61 � � �����K������@�@���� �������7
)��� J�6+�����+��7
@������� �61 � � �����K������@�@���� �������7
@���L���������������
6�7��@�������� �D�0-0� ��������
6�7��@�������� �D� � ���� � �� �
Notes: 1. For each fuel, the bar represents the minimum and maximum values from the pathways modelled in the JEC WTT v5 study.
Within the range, the thick line represents the pathway selected as representative of the specific fuel (the codes used in the JEC WTT v5 report are included on the Figure for reference).
2. The figures included in the WTT v5 report reflect the net energy requirement and related emissions required for the production of 1 MJ of fuel (see Section 2.9.4 of the report). In the case of bio-based feedstocks, the bio-credits will have been taken into consideration in the WTW calculations (where the impact of the combustion of the fuel in a specific engine is assessed).
3. Due to the consequential nature of the LCA approach applied, and in accordance with the goal and scope of the JEC WTT v5 report, the values shall not be used in an attributional LCA context.
4. The report includes representative pathways/routes, but additional technologies (not included in v5) are already in development. Therefore, the comparison of various WTT routes has been conducted among the modelled JEC pathways which differ depending on the types of fuels and the routes to produce them. For example, whereas an extensive range of primary energy sources for some fuels/energy carriers (e.g. electricity, hydrogen) have been considered, for others, only some initial examples of potential sources/pathways have been chosen for illustrative purposes (e.g. DME). This issue should be factored in when comparing the range of variation for different fuels.
5. In the case of electricity, negative GHG emissions occur for electricity produced from biogas derived from liquid manure due to credits for avoided CH4 and N2O emissions from avoided storage of untreated liquid manure.

l Additionally, it is important to highlight that general conclusions about the most favourable routes, both in terms of GHG emissions and energy consumption minimisation, can be derived only when the whole WTW analysis is taken into account, as the powertrain efficiency has a strong impact on the results (expressed in terms of g CO2eq/km, including the efficiency of the different powertrains). As an initial approximation, total GHG emissions, including from combustion, are included in the fuel-specific chart in the JEC WTT v5 report.
l Within each of the following categories, the following observations can be made when the WTT energy and GHG emissions are compared: • Fossil: a number of ‘representative’ fossil-based pathways such as CNG/LNG or high-octane
gasoline can offer lower GHG emission routes than conventional gasoline and diesel, while lower energy intensities are reached mainly by the gaseous fossil fuels. One reason for the slightly lower GHG emissions for high-octane gasoline is the admixture of bio-components.
• Crop-derived fuels: the newly added bio-ETBE route involving ethanol and isobutene from sugar beet shows interestingly low GHG emissions when compared to ethanol from sources other than sugar beet (wheat except WTET4a/b, barley, and corn) or HVO/biodiesel routes, albeit with higher energy consumption. Compared to the associated ethanol pathway, the GHG emissions for the ETBE route are higher.
• Wood: selected pathways for synthetic diesel, DME and hydrogen are the ones with the potentially lowest WTT GHG emissions.2 Negative emissions can be achieved in pathways implementing CCS.
• Biogas: biogas from manure used as a feedstock for hydrogen production shows promisingly lower WTT emissions than CBM or LBM pathways, but with significantly higher energy requirements. Significant negative emissions can be derived from routes involving biogas from manure due to the avoided CH4 emissions. This is the reason why biogas-to-hydrogen routes involving biogas from manure show lower WTT GHG emissions than the CBM and LBM pathways, although the energy requirement is higher. It is important to note that this substitution approach is valid under the current assumption that the methane would be released to the atmosphere if not used as fuel. Alternative technologies could also reduce the fugitive methane emissions and, thus, for comparison with such a case, the current pathway calculations would have to be adjusted accordingly.
• Electricity and H2: it is worth noting that electricity and hydrogen should primarily be considered as energy carriers, with environmental performances determined by the primary source used for their production. More precisely, the GHG emissions savings achieved through the use of electrical energy in the transport sector are determined by the pathway used for producing the power. At least for the transitional phase towards road electrification when power for vehicles is taken from the grid, this can lead either to an increase or a reduction in emissions compared to the baseline, depending on the electricity source used for that purpose (which is out of the scope of the JEC study). If the system reacts to this increased demand by increasing the production from fossil sources (e.g. coal), the effect might be an increase in overall GHG emissions. On the other hand, a
32 Concawe Review Volume 29 • Number 2 • February 2021
JEC Well-to-Wheels study version 5: a look into the carbon intensity of different fuel/powertrain combinations in 2030
2 Impacts on forest C-stocks and sinks are not included in this analysis.
substantial uptake of electrical energy for the road sector may act as a driver for increasing the share of renewable energies in the EU mix. These issues are country specific and time specific (as production is a non-steady process by definition) and, as mentioned, considerations such as these are not included in the JEC WTW v5 study. For this reason, the improvements in countries’ electricity mixes can only be used as a proxy for deriving a back-of-the-envelope evaluation.
• E-fuels: as e-fuels production is based on renewable electricity, the above-mentioned considerations can be extended to these cases. As detailed in Section 3.9 of the WTW v5 report, this route is an example of carbon capture and utilisation (CCU) in a highly energy- and capital-intensive process with high CO2 abatement potential versus their equivalent fossil-based fuels.
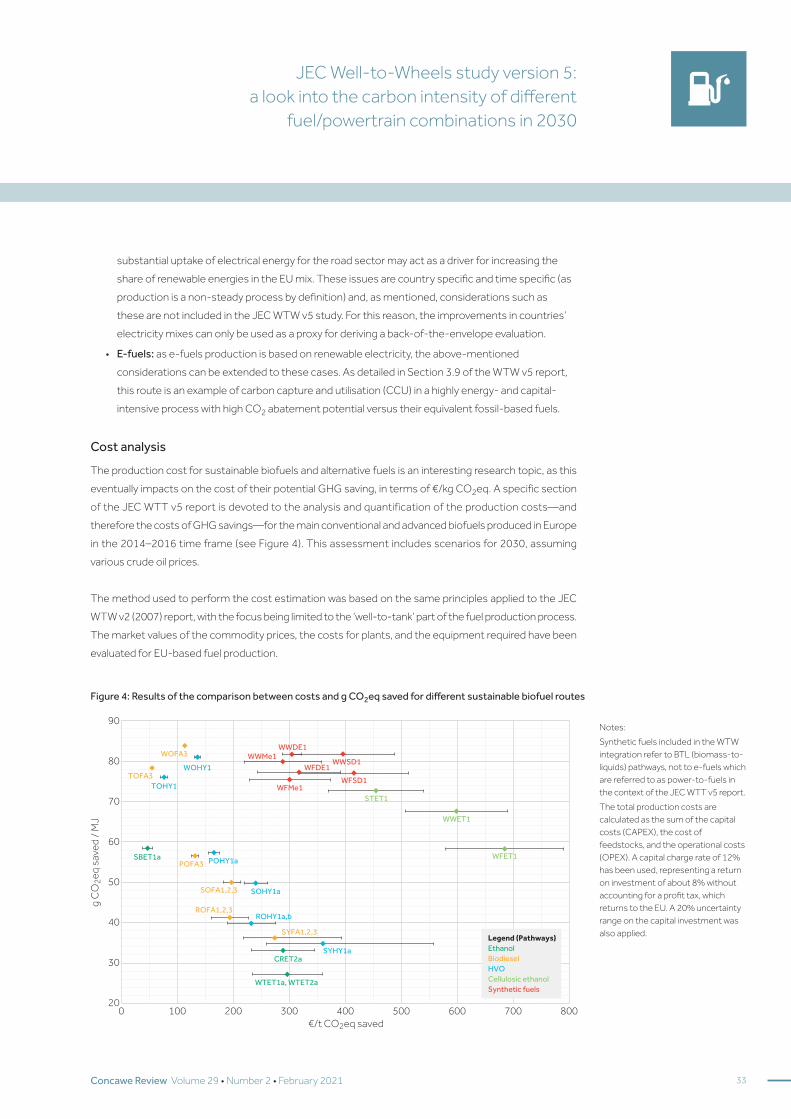
Cost analysis The production cost for sustainable biofuels and alternative fuels is an interesting research topic, as this eventually impacts on the cost of their potential GHG saving, in terms of €/kg CO2eq. A specific section of the JEC WTT v5 report is devoted to the analysis and quantification of the production costs—and therefore the costs of GHG savings—for the main conventional and advanced biofuels produced in Europe in the 2014–2016 time frame (see Figure 4). This assessment includes scenarios for 2030, assuming various crude oil prices. The method used to perform the cost estimation was based on the same principles applied to the JEC WTW v2 (2007) report, with the focus being limited to the ‘well-to-tank’ part of the fuel production process. The market values of the commodity prices, the costs for plants, and the equipment required have been evaluated for EU-based fuel production.
33Concawe Review Volume 29 • Number 2 • February 2021
JEC Well-to-Wheels study version 5: a look into the carbon intensity of different
fuel/powertrain combinations in 2030
Notes: Synthetic fuels included in the WTW integration refer to BTL (biomass-to-liquids) pathways, not to e-fuels which are referred to as power-to-fuels in the context of the JEC WTT v5 report. The total production costs are calculated as the sum of the capital costs (CAPEX), the cost of feedstocks, and the operational costs (OPEX). A capital charge rate of 12% has been used, representing a return on investment of about 8% without accounting for a profit tax, which returns to the EU. A 20% uncertainty range on the capital investment was also applied.
Figure 4: Results of the comparison between costs and g CO2eq saved for different sustainable biofuel routes
*�
��
7*�
<��
8��
B�0
)�
��
!�
-�
+�
��
,�
JB��7*�<��8��� "�� *�� ,�� ��� ��� !�� -�� )��
@�2�"
@�-H
��-H ��2�"
@@+ @@�/
@2+
@2�/ @@1�
@21�
1�/�
@@/�
@2/� ��-H ���2�"1./� �
1�2� 5!5" 1�-H �
)�2� 5!5")�-H �5�
1H2� 5!5"
1H-H ��)/�!�
@�/� �5�@�/�!�
��������������� /������.���� � �-E�� �������� ������1���� ����� ��
Tank-to-wheels (TTW) The tank-to-wheels (TTW) analysis is one of the pillars of the well-to-wheels study, and aims to model the impacts of different fuels and energy carriers when used in current and future state-of-the-art automotive powertrains. The TTW v5 study covers two different time frames, evaluating both current technologies (NEDC testing cycle) and future technological developments from 2025+ (WLTP testing cycle) to give an outlook on technology sector trends. Version 5 goes beyond the initial scope of the previous version, which focused only on passenger cars, by extending the analysis to include heavy-duty vehicles. The main results presented in the TTW-related reports, covering both passenger and heavy-duty vehicles, are presented below.
Passenger cars For the passenger cars calculations, a common vehicle platform representing the most widespread European segment of passenger vehicles (C-segment compact 5-seater European sedan) was used. Conventional powertrains utilise internal combustion engine (ICE) technologies including direct injection spark ignition (DISI) (e.g. Otto cycle engine), and direct injection compression ignition (DICI) (e.g. as used in a diesel engine). The electrification of conventional powertrains is covered in terms of a 48-volt mild hybrid electric vehicle (MHEV), a hybrid electric vehicle (HEV), a plug-In hybrid electric vehicle (PHEV) and a range extender electric vehicle (REEV). The 48-volt MHEV, which is only considered for 2025+, in principle shows the same functionality as the HEV, but represents a simpler approach compared to the dedicated HEV technology. Additionally, pure electric powertrains such as battery electric vehicles (BEVs) and fuel cell electric vehicles (FCEVs) are also investigated. Figure 5 on page 35 presents a matrix of fuel-powertrain combinations investigated in the TTW (v5) study; some of the variants were modelled in powertrain simulation in detail, while some others were derived from them based on their fuel properties. All variants are considered for both 2015 and 2025+ except for MHEV and REEV DICI which are considered for 2025+ only. BEVs in 2025+ are defined in two different driving range variants. All results are summarized in Figure 6 on page 36, in terms of emissions of CO2eq and energy consumption for 2015 (NEDC) and 2025+ (WLTP) variants.
34 Concawe Review Volume 29 • Number 2 • February 2021
JEC Well-to-Wheels study version 5: a look into the carbon intensity of different fuel/powertrain combinations in 2030

35Concawe Review Volume 29 • Number 2 • February 2021
JEC Well-to-Wheels study version 5: a look into the carbon intensity of different
fuel/powertrain combinations in 2030
Figure 5: Automotive fuels and powertrain combinations for passenger cars
!: $��K ��������������� !:!$L��K ���������������
/F��)��$J�!: $��� ���������
������
/F��)��$J�!:!$L��� ���������
������
1�� ���:4�;
1�� ���4"����>������
1�� �������37&:8��G";
1�� �������37&:I��G*;
=����:?�;
=����?-���>������
F�1
�&1
4"��
���4:?"��;
=�4
�2�����L
AI7L
4���������
A��� ���:�1A*;
1�� ���:4�;
1�� ���4"����>������
1�� �������37&:8��G";
1�� �������37&:I��G*;
=����:?�;
=����?-���>������
F�1
�&1
4"��
���4:?"��;
=�4
�2�����L
AI7L
4���������
A��� ���:�1A*;
�818
�8�8
-�����
��818
-�����
��8�8
�-/E
$:��818
)//E
::�18
�-/E
$:��8�8
./E $
:
2�/E
�-/E
$:�2�
)//E
::�2�
�818
�818�+
-/E
�8�8
�8�8�+
-/E
-�����
��818
-�����
��8�8
�-/E
::��818
)//E
!::�18
�-/E
::��8�8
)//E
!::��8�8
./E!:
:
./E#:
:
2�/E
�-/E
::�2�
)//E
!::�2�
Notes: All conventional variants (DISI and DICI) are equipped with a 55-litre standard size fuel tank for 2015. This is reduced to a 35-litre fuel tank for 2025+ to ensure a comparable driving range for the more efficient future powertrains. All HEV, PHEV and REEV (gasoline only) variants are equipped with a 55-litre standard size fuel tank for 2015. For 2025+, to ensure a comparable driving range for the more efficient future powertrains, this is reduced to a 35-litre fuel tank for MHEV and HEV, and further reduced to a 28-litre fuel tank for PHEV and a 21-litre fuel tank for REEV. Hydrogen fuel tank systems represent compressed gaseous hydrogen (CGH2) technology. In both 2015 and 2025+, the fuel tank capacity is assumed to be 4 kg, which gives a driving distance well above the 500 km minimum criterion. All FC variants are simulated based on a generic tank system of 90 kg. Battery capacities are 30, 50 and 90 kWh for HEV, PHEV and BEV respectively. The complete vehicle specifications can be found in Section 3.2.1 of the JEC TTW v5 report. BEV range: 150 km (2015); 2 variants, 200 km and 400 km (2025+). PHEV EV range: 50 km (2015); 100 km (2025+). REEV EV range: 100 km (2015); 200 km (2025+).
BEV: Battery electric vehicle
CNG: Compressed natural gas
DISI: Direct injection spark ignition
DICI: Direct injection compression ignition
DME: Dimethyl ether
FAME: Biodiesel (B100)
FCEV: Fuel cell electric vehicle
FT-Diesel: Paraffinic diesel (EN15940)
HEV: Hybrid electric vehicle
HVO: Hydro-treated vegetable oil
LPG: Liquefied petroleum gas
MHEV: Mild hybrid electric vehicle (48 V)
PHEV: Plug-in hybrid electric vehicle
REEV: Range extender electric vehicle
* EN15940 synthetic diesel standard to allow optimised engines.

It is worth noting the following with regard to the passenger cars analysis:
l Due to improvements in future powertrain technologies, as well as improvements in fuel quality, ICE powered vehicles will continue to deliver TTW GHG emissions reductions and energy savings compared to the 2015 baseline. Future diesel-type engines will maintain their energy efficiency benefits.
l Hybridisation (mild (48 volt) and full hybrids) will deliver additional reductions in both domains (gasoline and diesel).
l Additional reductions in GHG emissions and energy consumption can be achieved with deeper electrification, i.e. with PHEV and REEV, as well as with FCEV and BEV powertrains. However, the main differentiator between PHEV and REEV is battery size rather than ICE integration.
36 Concawe Review Volume 29 • Number 2 • February 2021
JEC Well-to-Wheels study version 5: a look into the carbon intensity of different fuel/powertrain combinations in 2030
Figure 6: Summary of TTW simulation results for 2015 (NEDC) and 2025+ (WLTP) variants
*�
22D
�7
*�<
��8�
���
��
����
�:�
�7
*�<B
>�;
"��
!�
)�
"��
��
22D������� ������� �:�0B"��>�;M�������� ������������������� *� �� !� )� "�� "*� "�� "!� ")� *��
�
"*�
�������
�� !"�������
�������#
�$�����
�$�����
�$�����#
%�$&$
�� !"�������#
'"(���� !"�������#
5�4� ��8�������*�"�
5�4� ��8�������*�*�K
A4I8�������*�"�
A4I8�������*�*�K
�A4I8�������*�*�K
�A4I8�������*�"�
�A4I8�������*�*�K
344I8�������*�"�
344I8�������*�*�K
�����8�������*�"�
�����8�������*�*�K
?4I8�������*�"�
?4I8�������*�*�K
���� ��������������8�/� ������� �
1��A����������8�/� ������� �

Heavy-duty vehicles (HDVs) For the freight sector, two main HDV configurations have been analysed:
l Rigid truck with 18 tonnes gross vehicle mass rating (GVMR), designed for regional delivery missions (‘group 4 vehicle’ ).3
l Tractor-semitrailer combination with 40 tonnes GVMR, designed for use in long haul missions (‘group 5 vehicle’ ).3
All vehicle concepts considered have been analysed for the model years 2016 and 2025, whereby 2016 models represent the state-of-the-art on the European market. Vehicle specifications for 2025+ are based on a technology assessment of future improvements. For xEV concepts, it is not possible to identify typical vehicle configurations as these systems are new technologies that are currently under development for HDVs. As a consequence, xEV vehicle specifications and related results as elaborated in the study are theoretical examples only for these new technologies. The HDV configurations analysed are either a conventional ICE or an electrified propulsion system (xEV). ICE configurations incorporate several technologies including direct injection compression ignition (CI), port injection positive ignition (PI), and LNG high pressure direct injection compression ignition (HPDI). For CI engines the fuels considered were diesel B0, B7 and B100 (FAME) as well as DME, ED95, OME and paraffinic diesel. For PI engines, CNG and LNG fuels were analysed. The electrified propulsion systems include hybrid electric vehicles (HEVs), battery electric vehicles (BEVs), catenary electric vehicles (CEVs), and hydrogen fuel cell electric vehicles (FCEVs). Figure 7 shows a summary of the simulated fuel and powertrain combinations.
37Concawe Review Volume 29 • Number 2 • February 2021
JEC Well-to-Wheels study version 5: a look into the carbon intensity of different
fuel/powertrain combinations in 2030
3 Labelling of vehicles by ‘group’ refers to the method applied in the European Regulation for CO2 certification of heavy-duty vehicles [5]
Figure 7: Investigated fuel and powertrain configurations and simulated vehicle groups
Note: Configurations highlighted in blue were simulated for both group 4 and group 5 vehicle categories; the green configuration was simulated for a group 4 vehicle only, and the red configuration for a group 5 vehicle only.
=����?�
=����?-���>������
=�4
4=+�
4���������
���4:?"��;
���� ���������
A��&1
A��� ���
F&1:4/���;
7�4
5�4�5 5�4�5 5�4�5KA4I
5�4�5KA4I
?4I ���4I �4I��K ������
2� �
#5�$
#5�$
#5�$
#5�$
#5�$
#5�$
#5�$
#5�$
#5�$
#5�$
#5�$
#5�$ #5�$
#5�$
#
$
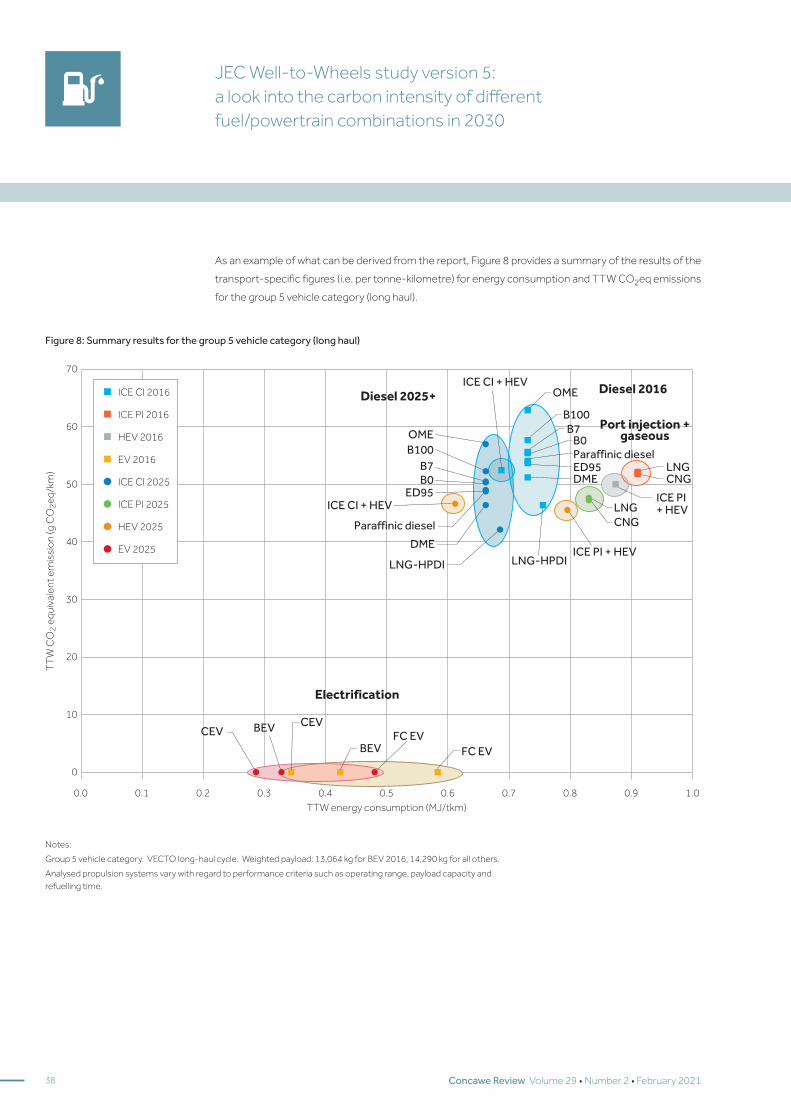
As an example of what can be derived from the report, Figure 8 provides a summary of the results of the transport-specific figures (i.e. per tonne-kilometre) for energy consumption and TTW CO2eq emissions for the group 5 vehicle category (long haul).
38 Concawe Review Volume 29 • Number 2 • February 2021
JEC Well-to-Wheels study version 5: a look into the carbon intensity of different fuel/powertrain combinations in 2030
Figure 8: Summary results for the group 5 vehicle category (long haul)
"�
22D
�7
*�<
��8�
���
��
����
�:�
�7
*�<B
>�;
��
,�
��
-�
*�
22D������� ������� �:�0B�>�;�G� �G" �G* �G, �G� �G� �G! �G- �G) �G+ "G�
�
!�
5�4�5*�"!
5�4�5*�"!
A4I*�"!
4I*�"!
5�4�5*�*�
5�4�5*�*�
A4I*�*�
4I*�*�
8�/��8�L�-/E�"���(�����# �"���(����)
*!��"�+�,�"*��#����*-�
(�,�!".",��"*�
�+/
. ::.&.:������������ � �
*I0�I0
8�/��8L�-/E*I0
�I0
8�/��8�L�-/E
8�/��8�L�-/E
������������ � �
�+/
*I0�-��8 *I0�-��8
/�($.:.&
. ::�+/
�/E ./E
./E
�/E2��/E
2��/E
/�($�+/
Notes: Group 5 vehicle category. VECTO long-haul cycle. Weighted payload: 13,064 kg for BEV 2016; 14,290 kg for all others. Analysed propulsion systems vary with regard to performance criteria such as operating range, payload capacity and refuelling time.

Analysing the results of the JEC TTW v5 study enables the following observations to be made:
TTW energy consumption
l Vehicles with single-fuel positive ignition (PI) natural gas (NG) engines have 20–25% higher energy consumption compared to vehicles using conventional diesel technology.
l The energy consumption of dual-fuelled (LNG-diesel) HPDI vehicles is very close to that of conventional diesel technology.
l Of the different configurations of electric components analysed in this study, HEVs have a 5% energetic advantage in long-haul applications and a 5–10% energetic advantage in regional delivery missions compared to their ICE-only counterparts. Higher energy saving potentials can therefore be expected by hybridisation for urban delivery missions.
l For the analysed xEV concepts, CEVs4 (‘electric road’) were found to have the lowest TTW energy consumption (around -50% to -60% compared to conventional diesel technology) followed by BEVs (around -40% to -55% compared to conventional diesel technology). FCEVs were calculated to have 20–35% lower TTW energy consumption compared to a conventional diesel vehicle. Compared to BEV and CEV technology, the energy consumption of FCEVs also includes the energy losses in the fuel cell.
TTW CO2 equivalent emissions
l The use of alternative fuels in diesel CI engines can change the TTW CO2-equivalent emissions, compared to using market blend B7 diesel, from -8% (dimethyl ether, DME) to +13% (oxymethylene ether, OME) due to differences in the lower heating value (LHV)-specific carbon content of the fuel.
l Vehicles driven by PI engines using CNG or LNG have 5–10% lower TTW CO2-equivalent emissions than conventional diesel engine technology. This mainly results from the fact that the energetic disadvantage is overcompensated by the lower energy-specific carbon content of NG (ca. -23% compared to B7).
l The TTW CO2-equivalent emissions of dual-fuelled (LNG-diesel) HPDI vehicles are 15–20% lower than conventional diesel technology due to the high proportion of NG.
l For BEV, CEV and FCEV propulsion systems, the TTW CO2-equivalent emissions are zero per definition.
It should be noted that, although the TTW v5 study provides a representative overview of the passenger and HDV vehicle sectors, the powertrains investigated in each case represent theoretical vehicle configurations only, and are not specific to any existing commercial vehicle or brand.
39Concawe Review Volume 29 • Number 2 • February 2021
JEC Well-to-Wheels study version 5: a look into the carbon intensity of different
fuel/powertrain combinations in 2030
4 Note that ~10% of additional losses in the overhead infrastructure would need to be considered (as a proxy), but these are currently not included in the JEC TTW v5 report.

WTW integration Methodology and criteria The WTW methodology integrates a selection of the fuels and vehicles from the WTT and TTW studies. These combinations enable calculations to be made in terms of MJ or g CO2eq per kilometre distance travelled. Due to the major revisions incorporated in the JEC v5 reports, both for the WTT analysis (more than 250 resource-to-fuel pathways modelled) and the TTW analysis (more than 60 powertrain combinations), the number of potential routes to be combined in the WTW analysis has increased considerably since version 4 of the report (i.e. there are now more than 1,500 possible combinations). This has led to the need for an appropriate way to present the results. Therefore, a number of WTT pathways have been selected to show the variability of the conversion routes, due to the different feedstocks and processes modelled, to enable a comparative analysis of the alternatives to be made. In order to select the relevant WTW combinations, a series of criteria have been applied to filter the WTT pathways. A thorough analysis of the compliancy with RED II criteria has been used as one of the main guidelines. Some additional novel technologies, with lower TRL or CRL, have also been considered for the integration, to show their potential for reducing GHG emissions if deployed effectively in Europe. The selected WTT pathways have been combined with the relevant powertrain options to obtain the WTW results. For illustrative purposes, Figure 9 on page 41 guides the reader through the link between the WTT calculations (production routes) and the integration with the TTW values. Using a selected example, the figure details the rationale behind the calculations included in the individual WTT spreadsheets and in the WTW integration file.
40 Concawe Review Volume 29 • Number 2 • February 2021
JEC Well-to-Wheels study version 5: a look into the carbon intensity of different fuel/powertrain combinations in 2030

Results When the JEC WTT and TTW v5 results are combined, factors such as the conversion pathways chosen and the feedstock/resource used, together with the specific powertrain technology in the 2015/2025+ time frames, have a strong impact on the final results, which are expressed both in terms of energy expended (MJ/MJfuel) and GHG emissions (g CO2eq/km). This new version of the study presents the outcome of the WTW integration in two different ways, as described on the following pages.
41Concawe Review Volume 29 • Number 2 • February 2021
JEC Well-to-Wheels study version 5: a look into the carbon intensity of different
fuel/powertrain combinations in 2030
Note: As detailed in Section 2.9.4 of the JEC WTT v5 report, the WTT figures reflect the net energy requirement and related emissions required for the production of 1 MJ of fuel (WTT1-4 in Figure 9). In the case of bio-based feedstocks, the bio-credits will be taken into consideration in the WTW calculations (where the impact of the combustion of the fuel in a specific engine is assessed).
2/)�8*81/)
@�������������6����! 9�+M�� �7@�@���� ��������6����! 9�A�7
���K� %�������
@��� �#J!(>:�����! 9�+M�� �
@���K��������� ��������@�@J!(>:�;�& >#�N��#!>#�����! 9�+M
.��� �����!����� �
6.����� ���7O
2� ��@��� �6����! 9�+M7
���@�@���� �������
2� ��@���� �6����! 9�A�7�6OO7
��@�� �6����! 9�A�7�6OO7����������J
&">"�+M�� �� ::�A�PQ� !#�����!�A�
@�@6����� � K��� ���!7
6����! 9�A�7
#>#
>'
">' �!>#
>#
�� ���������������� � ���� � ��� �
>�2 ����A6K��� �K������� ����5������ �R������7>
I�� J�8�>������������� ������ ��K� �������� �
!>���������6K�������Q�$::�A�7
">�+�����������6 ���������������7
#>�������������
�& >#
�#!>#
>#
���
� �������������!�A�
�&">$�6OO7
!#>"
$:>'L N����������
6��! 9� ��������� ���� ���������� ����� ����� ���� ��7
2����6��! 9� ��������� ���� ���������� ����� ����� ���� ��7.��� ��
��!
(*) CO2 released back to the atmosphere when 1 MJ of the fuel is totally combusted. Equivalent to the amount of CO2 initially captured by the tree during the photosynthesis process (net zero effect).
(**) WTT fraction related to the amount of fuel consumed in a specific powertrain: WTTnet to WTW = -42.4 (g CO2eq/MJ) x 173.3 MJfuel/100 km <> -73.5 g CO2eq/km
Figure 9: Simplified chart showing the steps towards the well-to-wheels CO2-equivalent calculations (the example used is a wood-based pathway (ethanol—WWET1b) + gasoline DISI technology, 2015)

1���� ����� � ���8�8���!: $�� � �J� "$�����! 9�A�
� �
:��
���
4/��
��;�
��
����
��(
�2F
���
���
4/
DD#=*
�2�
����
�
�%
�
����
���
%���
��
#:�
��>
�;
#���
����
�
�%
�
����
���
8��
A2F
:���
>�
;
���
���
����
���
����
� �
�%
�
%��
��
D
�:%
����
;�
����
����
8�
��
��>
�<�
�
#���
����
�
���
��%
���
���
����
���8�
�#7
4���
���
����
���(
�7
* �
� �
���
�
�,�� �*�� �"�� � "�� *�� ,�� ���
��7*�<B>�
D2D D22 22D
34#=*�
?F#="�
DD�="
DD#="��
.7#="
I/��
1���� ����� � ���8�8�-�����!: $�� � �J� :'�����! 9�A�
� �
:��
���
4/��
��;�
��
����
��(
�2F
���
���
4/
DD#=*
�2�
����
�
�%
�
����
���
%���
��
#:�
��>
�;
#���
����
�
�%
�
����
���
8��
A2F
:���
>�
;
���
���
����
���
����
� �
�%
�
%��
��
D
�:%
����
;�
����
����
8�
��
��>
�<�
�
#���
����
�
���
��%
���
���
����
���8�
�#7
4���
���
����
���(
�7
* �
� �
���
�
�,�� �*�� �"�� � "�� *�� ,�� ���
��7*�<B>�
D2D D22 22D
34#=*�
?F#="�
DD�="
DD#="��
.7#="
I/��
1���� ����� � ���8�8���!:!$L�� � �J� ! �����! 9�A�
� �
:��
���
4/��
��;�
��
����
��(
�2F
���
���
4/
DD#=*
�2�
����
�
�%
�
����
���
%���
��
#:�
��>
�;
#���
����
�
�%
�
����
���
8��
A2F
:���
>�
;
���
���
����
���
����
� �
�%
�
%��
��
D
�:%
����
;�
����
����
8�
��
��>
�<�
�
#���
����
�
���
��%
���
���
����
���8�
�#7
4���
���
����
���(
�7
* �
� �
���
�
�,�� �*�� �"�� � "�� *�� ,�� ���
��7*�<B>�
D2D D22 22D
34#=*�
?F#="�
DD�="
DD#="��
.7#="
@*��
1���� ����� � ���8�8�+-/E���!:!$L�� � �J� :"�����! 9�A�
� �
:��
���
4/��
��;�
��
����
��(
�2F
���
���
4/
DD#=*
�2�
����
�
�%
�
����
���
%���
��
#:�
��>
�;
#���
����
�
�%
�
����
���
8��
A2F
:���
>�
;
���
���
����
���
����
� �
�%
�
%��
��
D
�:%
����
;�
����
����
8�
��
��>
�<�
�
#���
����
�
���
��%
���
���
����
���8�
�#7
4���
���
����
���(
�7
* �
� �
���
�
�,�� �*�� �"�� � "�� *�� ,�� ���
��7*�<B>�
D2D D22 22D
34#=*�
?F#="�
DD�="
DD#="��
.7#="
@*��
1���� ����� � ���8�8�-�����!:!$L�� � �J� : �����! 9�A�
� �
:��
���
4/��
��;�
��
����
��(
�2F
���
���
4/
DD#=*
�2�
����
�
�%
�
����
���
%���
��
#:�
��>
�;
#���
����
�
�%
�
����
���
8��
A2F
:���
>�
;
���
���
����
���
����
� �
�%
�
%��
��
D
�:%
����
;�
����
����
8�
��
��>
�<�
�
#���
����
�
���
��%
���
���
����
���8�
�#7
4���
���
����
���(
�7
* �
� �
���
�
�,�� �*�� �"�� � "�� *�� ,��
��7*�<B>�
D2D D22 22D
34#=*�
?F#="�
DD�="
DD#="��
.7#="
@*��
a) Detailed results
This section of the WTW report presents detailed results for each type of fuel/powertrain combination, expanding on the WTW GHG emissions and energy expended results, obtained by decoupling the contribution of both WTT and TTW elements (showing the variability for the selected WTT pathways and time horizons). The details are grouped as follows: l ICEs — liquid fuels l ICEs — gaseous fuels l xEVs l FCEVs As an example, the BEV-related charts for passenger cars are shown in Figure 10 for both the 2015 and 2025+ time frames and for the different types of fuel/powertrain configurations explored.
42 Concawe Review Volume 29 • Number 2 • February 2021
JEC Well-to-Wheels study version 5: a look into the carbon intensity of different fuel/powertrain combinations in 2030
Figure 10: Synthetic diesel — GHG emissions (g CO2eq/km)
Being a synthetic mix of molecules optimised to result in very similar properties to regular fossil-derived product, synthetic diesel offers the advantage of being a drop-in fuel, easily usable in standard infrastructures, and powertrains.
GHG performances of synthetic diesel production and use are mainly determined by the primary source of energy used for its production (WTT). When produced from coal, synthetic diesel does not offer any advantages (even doubling the associated GHG emissions), if compared with regular fossil diesel.
Benefits can be achieved through the FT conversion process, using residual feedstocks such as waste wood, black liquor and pyrolysis oil derived from wood waste, or via power-to-liquid using renewable electricity. In these cases, the potential saving offered by using synthetic diesel can be remarkable. As interesting pathways, the e-fuel route combined with DICI vehicles (RESD2a) approach zero WTW emissions when renewable electricity is used while negative WTW emissions could be obtained in the case of wood residue coupled with CCS (BECCS schemes). These latter pathways were not commercially available at the time of publication.
Regarding the e-fuel route, as CO2 is considered to be a waste in the JEC WTT v5 study, there is no difference between the direct air capture (DAC) or flue gases pathways.
Sour
ce: S
ectio
n 3.2
of t
he JE
C W
TW v5
repo
rt[2
]

�*��
1A
1�
���
�� �
�:�
�7
*�<B
>�;
"��
*��
,��
���
�
�"��
�818
��0
0������
�818
��0-��"
-�������� �������
�8�8
���
�� � �
�818
*)*�
*�0
�8�8
@@1�!
1���� � �
�8�8
)�2�
.���� � �
�8�8
@�-H �
-E�
�818
@�/� �
/������
�8�8
@@��
�������������
�818
0��0 �
�I0
�818
�@�0
�.+
�818
@@�0!
1��GI0
�818
0)+.
+�./�/�./
�8�8
@@�+/
�+/
./E!::
/+/*"���
./E
18��-/E
/+/*"���
�818����-/E�)//E
�8��-/E
/+/*"���
�8�8����-/E�)//E
2�/E
0��- �
2�/E�)//E�2�
����������������8�����%��
5�4:=5#5B=5�5;K ��������� ��
5�4:=5#5B=5�5;K�� B %��7*��� ��
�4I:����������;
��4I:A*;
b) Comparative analysis
To help readers understand the variability in the WTW results due to the feedstock/fuel production route chosen and the powertrain technology for the time frames explored in the study (2015 and 2025+) with different test cycles, two type of comparative charts are presented in the report:
1. Fuel comparison charts: these charts show the variability due to the use of different type of fuels (and for each fuel, the representative selected pathway and the range as defined in Appendix 1 of the main JEC WTW v5 report) for the main selected powertrain technologies.
2. Powertrain comparison charts: in these charts, the impact of modifications in the main powertrain technologies through, for example, different levels of hybridisation or battery sizes, are explored for each type of fuel and its representative feedstock/conversion pathway.
Examples of the comparative GHG emissions-related charts for passenger cars in the 2025+ time frame are presented below in Figure 11 (fuel comparison), and in Figure 12 (powertrain comparison) on page 44.
The following conclusions can be drawn from the above fuel comparison:
l Regardless of the time frame considered (2015 or 2025+), almost all of the alternative fuels analysed offer better WTW performance than conventional oil-based gasoline/diesel when used in ICEs (DISI/DICI). Some exceptions are present, such as the gasification of coal to produce synthetic diesel.
l Electricity and hydrogen have the potential to offer low-CO2 intensive alternatives comparable with the representative pathways for bio-liquid and bio-gaseous fuels as selected for the analysis. The use of renewable electricity for xEVs (HEVs excluded) and FCEVs offer one the lowest WTW energy-intensive combinations similar to the use of biomethane and synthetic diesel (e-fuels) in DICI.
43Concawe Review Volume 29 • Number 2 • February 2021
JEC Well-to-Wheels study version 5: a look into the carbon intensity of different
fuel/powertrain combinations in 2030
Sour
ce: S
ectio
n 3.1
of t
he JE
C W
TW v5
repo
rt[2
]
Figure 11: WTW fuel comparison (2025+ WLTP) — GHG emissions
l Interestingly, PHEV technology (when powered with the EU mix and conventional gasoline/diesel fuel) shows a similar CO2-intensive route to the use of an FCHEV in 2015 (with hydrogen produced through the conventional natural gas reforming route), but this changes towards 2025+ in favour of the BEV/PHEV/REEV alternatives (if no low-CO2 intensive hydrogen is used).
l It is worth noting that: (1) this comparison includes the effect of the change in the test cycle from 2015 (NEDC) to 2025+ (WLTP), partially offsetting the potential WTW benefit (i.e. emissions reduction); (2) the fuel component considers the state-of-the-art technology of fuels already or close to being commercialised at scale in the market; and (3) availability issues are not included in the scope of the JEC WTW v5 study.
44 Concawe Review Volume 29 • Number 2 • February 2021
JEC Well-to-Wheels study version 5: a look into the carbon intensity of different fuel/powertrain combinations in 2030
Note: as mentioned, the charts above include selected pathways modelled for the JEC WTW v5 integration (they do not represent all possible WTW fuel and powertrain combinations; the criteria for pathway selection is explained in Section 2.5.2 of the JEC WTW v5 report). Additional promising low-CO2 intensive pathways that are not yet available at the commercial scale (TRL <6), have not been included in this WTW comparison, but the detailed data are available in the JEC WTT v5 report to enable readers to conduct their own in-depth assessments.
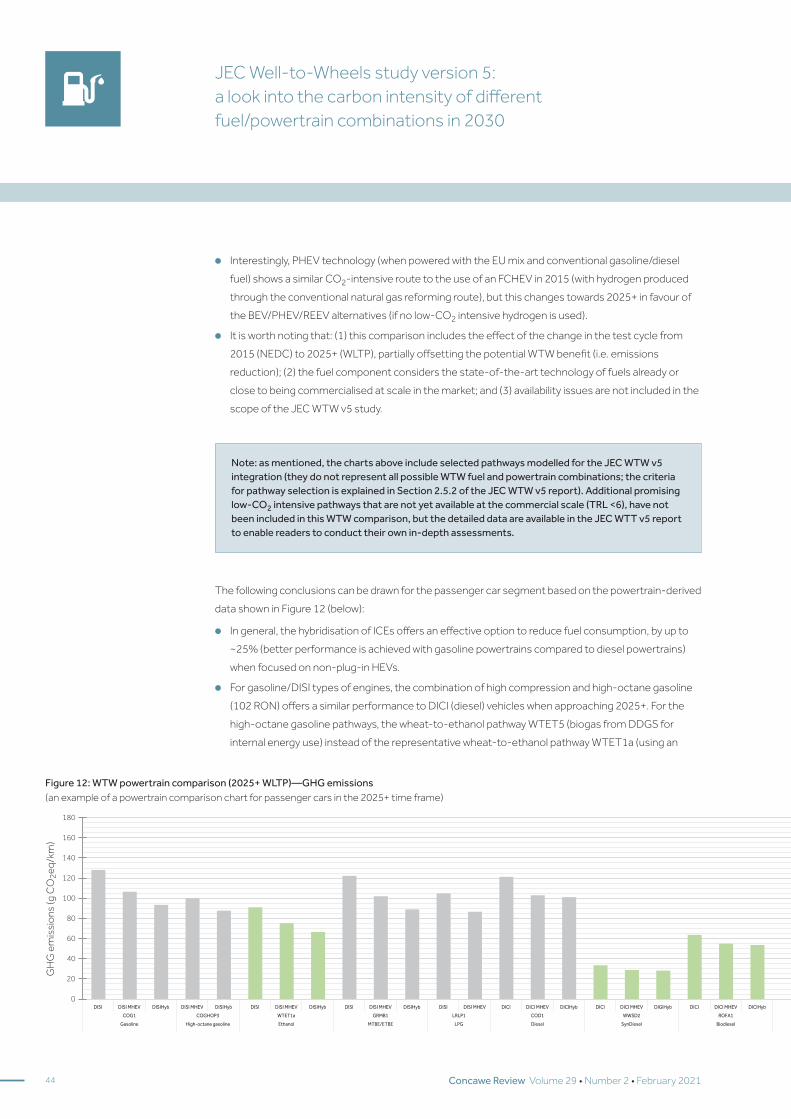
The following conclusions can be drawn for the passenger car segment based on the powertrain-derived data shown in Figure 12 (below):
l In general, the hybridisation of ICEs offers an effective option to reduce fuel consumption, by up to ~25% (better performance is achieved with gasoline powertrains compared to diesel powertrains) when focused on non-plug-in HEVs.
l For gasoline/DISI types of engines, the combination of high compression and high-octane gasoline (102 RON) offers a similar performance to DICI (diesel) vehicles when approaching 2025+. For the high-octane gasoline pathways, the wheat-to-ethanol pathway WTET5 (biogas from DDGS for internal energy use) instead of the representative wheat-to-ethanol pathway WTET1a (using an
Figure 12: WTW powertrain comparison (2025+ WLTP)—GHG emissions (an example of a powertrain comparison chart for passenger cars in the 2025+ time frame)
�
1A
1�
���
�� �
�:�
�7
*�<B
>�;
"*�
"��
"!�
")�
*�
�818 �818�+-/E
��0
0������
�818-�� �818�+-/E �818-�� �818 �818�+-/E
@�/� �
/������
�818-�� �818 �818�+-/E �8�8 �8�8�+-/E
���
�� � �
�8�8-�� �8�8 �8�8�+-/E
@@1�!
1���� � �
�808-�� �8�8 �8�8�+-/E
)�2�
.���� � �
"��
)�
!�
��
��0-��"
-�������� ��������
*)*�
*�0
�8�8-���818 �818�+-/E
0)+.
+�./�/�./
�818-��
NG-fired boiler) has been used. The difference in the WTW GHG balance for the high-octane gasoline pathway COGHOP3 (variant with the highest ethanol share) amounts to about 2% versus the conventional gasoline pathway. With regard to the contribution from alternative fuels, the ethanol, MTBE and especially the bio-ETBE routes show interesting WTW GHG emissions reductions (up to 2/3 in the case of bio-ETBE).
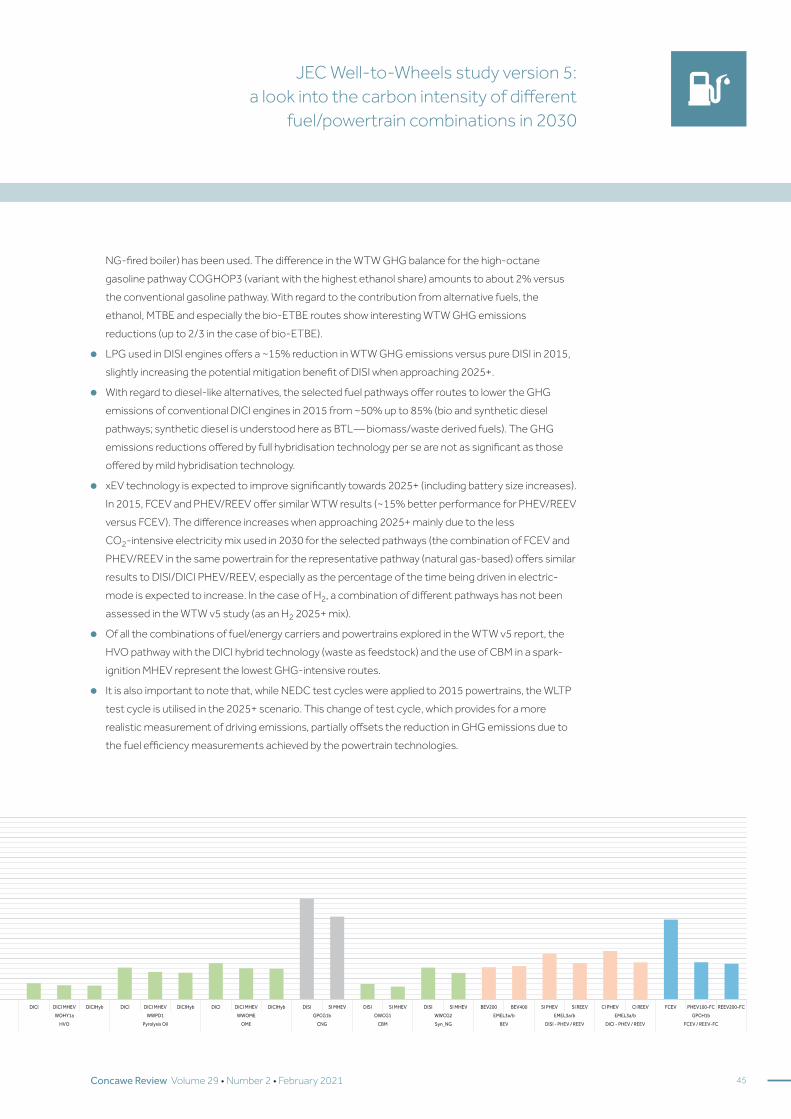
l LPG used in DISI engines offers a ~15% reduction in WTW GHG emissions versus pure DISI in 2015, slightly increasing the potential mitigation benefit of DISI when approaching 2025+.
l With regard to diesel-like alternatives, the selected fuel pathways offer routes to lower the GHG emissions of conventional DICI engines in 2015 from ~50% up to 85% (bio and synthetic diesel pathways; synthetic diesel is understood here as BTL— biomass/waste derived fuels). The GHG emissions reductions offered by full hybridisation technology per se are not as significant as those offered by mild hybridisation technology.
l xEV technology is expected to improve significantly towards 2025+ (including battery size increases). In 2015, FCEV and PHEV/REEV offer similar WTW results (~15% better performance for PHEV/REEV versus FCEV). The difference increases when approaching 2025+ mainly due to the less CO2-intensive electricity mix used in 2030 for the selected pathways (the combination of FCEV and PHEV/REEV in the same powertrain for the representative pathway (natural gas-based) offers similar results to DISI/DICI PHEV/REEV, especially as the percentage of the time being driven in electric-mode is expected to increase. In the case of H2, a combination of different pathways has not been assessed in the WTW v5 study (as an H2 2025+ mix).
l Of all the combinations of fuel/energy carriers and powertrains explored in the WTW v5 report, the HVO pathway with the DICI hybrid technology (waste as feedstock) and the use of CBM in a spark-ignition MHEV represent the lowest GHG-intensive routes.
l It is also important to note that, while NEDC test cycles were applied to 2015 powertrains, the WLTP test cycle is utilised in the 2025+ scenario. This change of test cycle, which provides for a more realistic measurement of driving emissions, partially offsets the reduction in GHG emissions due to the fuel efficiency measurements achieved by the powertrain technologies.
45Concawe Review Volume 29 • Number 2 • February 2021
JEC Well-to-Wheels study version 5: a look into the carbon intensity of different
fuel/powertrain combinations in 2030
�8�8 �8�8�+-/E
@�-H �
-E�
�8�8-�� �8�8 �8�8�+-/E
@@��
�������������
�8�8-�� �8�8 �8�8�+-/E
@@�+/
�+/
�8�8-�� �818 �818 18�+-/E �818 18�+-/E ./E!:: ./E#:: 18��-/E 18�)//E �8��-/E �8�)//E 2�/E �-/E ::�2�
0��- �
2�/E���)//E�2�
)//E!::�2�18�+-/E
0��0 �
�I0
�@�0
�.+
@@�0!
1��GI0
/+/*"���
./E
/+/*"���
�818����-/E���)//E
/+/*"���
�8�8����-/E���)//E

The full details, charts and conclusions for both passenger cars and heavy-duty segments are covered extensively in the JEC WTW v5 report. Concawe encourages readers to digest the information provided in the report, and to forward any suggestions or enquiries to the JEC emailbox: [email protected].
References
1. Prussi, M., Yugo, M., De Prada, L., Padella, M., Edwards, R. and Lonza, L. (2020). JEC Well-to-Tank report v5. EUR 30269 EN, Publications Office of the European Union, Luxembourg. ISBN 978-92-76-19926-7, doi:10.2760/959137, JRC119036. https://ec.europa.eu/jrc/en/publication/eur-scientific-and-technical-research-reports/jec-well-tank-report-v5
2. Huss, A. and Weingerl, P. (2020). JEC Tank-to-Wheels report v5: Passenger cars. Editors: Maas, H., Herudek, C., Wind, J., Hollweck, B., De Prada, L., Deix, S., Lahaussois, D., Faucon, R., Heurtaux, F., Perrier, B., Vidal, F., Gomes Marques, G., Prussi, M., Lonza, L., Yugo, M. and Hamje, H. EUR 30270 EN, Publications Office of the European Union, Luxembourg, 2020, ISBN 978-92-76-19927-4, doi:10.2760/557004, JRC117560. https://ec.europa.eu/jrc/en/publication/jec-tank-wheel-report-v5-passenger-cars
3. Röck, M., Martin, R. and Hausberger, S. (2020). JEC Tank-to-Wheels report v5: Heavy duty vehicles. Editors: Hanarp, P., Bersia, C., Colombano, M., Gräser, H., Gomes Marques, G., Mikaelsson, H., De Prada, L., Prussi, M., Lonza, L., Yugo, M. and Hamje, H. EUR 30271 EN, Publications Office of the European Union, Luxembourg. ISBN 978-92-76-19928-1, doi:10.2760/541016, JRC117564. https://ec.europa.eu/jrc/en/publication/jec-tank-wheels-report-v5-heavy-duty-vehicles
4. Prussi, M., Yugo, M., De Prada, L., Padella, M. and Edwards, R. (2020). JEC Well-to-Wheels report v5. EUR 30284 EN, Publications Office of the European Union, Luxembourg. ISBN 978-92-76-20109-0, doi:10.2760/100379, JRC121213. https://ec.europa.eu/jrc/en/publication/eur-scientific-and-technical-research-reports/jec-well-wheels-report-v5
5. European Union (2017). Commission Regulation (EU) 2017/2400 of 12 December 2017 implementing Regulation (EC) No 595/2009 of the European Parliament and of the Council as regards the determination of the CO2 emissions and fuel consumption of heavy-duty vehicles. https://eur-lex.europa.eu/eli/reg/2017/2400/oj
46 Concawe Review Volume 29 • Number 2 • February 2021
JEC Well-to-Wheels study version 5: a look into the carbon intensity of different fuel/powertrain combinations in 2030