

JBC Papers in Press. Published on October 22, 2004 as ... Durchschlag 1, Wolfgang Reiter , ......
32
1 Nuclear localization destabilizes the stress regulated transcription factor Msn2 Erich Durchschlag 1 , Wolfgang Reiter 1 , Gustav Ammerer and Christoph Schüller § Institute of Biochemistry and Molecular Cell Biology, Max F. Perutz Laboratories, University and BioCenter of Vienna A-1030 Vienna, Austria Running Title: Nuclear Msn2 degradation Key words: protein degradation, nuclear transport, protein kinase A, proteasome, stress 1) these authors have contributed equally § To whom correspondence and reprint requests should be addressed: Christoph Schüller Institute of Biochemistry and Molecular Cell Biology Max F. Perutz Laboratories University and BioCenter of Vienna Dr. Bohr-Gasse 9/5; A-1030, Vienna, Austria Phone: +43-1-4277-52815; FAX: +43-1-4277-9528 e-mail: [email protected] JBC Papers in Press. Published on October 22, 2004 as Manuscript M407264200 Copyright 2004 by The American Society for Biochemistry and Molecular Biology, Inc. by guest on July 11, 2018 http://www.jbc.org/ Downloaded from
Transcript of JBC Papers in Press. Published on October 22, 2004 as ... Durchschlag 1, Wolfgang Reiter , ......
1
Nuclear localization destabilizes the stress regulated transcription factor Msn2
Erich Durchschlag1, Wolfgang Reiter1, Gustav Ammerer and Christoph Schüller§
Institute of Biochemistry and Molecular Cell Biology, Max F. Perutz Laboratories, University
and BioCenter of Vienna A-1030 Vienna, Austria
Running Title: Nuclear Msn2 degradation
Key words: protein degradation, nuclear transport, protein kinase A, proteasome, stress
1) these authors have contributed equally
§To whom correspondence and reprint requests should be addressed:
Christoph Schüller Institute of Biochemistry and Molecular Cell Biology Max F. Perutz Laboratories University and BioCenter of Vienna Dr. Bohr-Gasse 9/5; A-1030, Vienna, Austria Phone: +43-1-4277-52815; FAX: +43-1-4277-9528 e-mail: [email protected]
JBC Papers in Press. Published on October 22, 2004 as Manuscript M407264200
Copyright 2004 by The American Society for Biochemistry and Molecular Biology, Inc.
by guest on July 11, 2018http://w
ww
.jbc.org/D
ownloaded from
2
Summary
The transcriptional program of yeast cells undergoes dramatic changes during the shift from
fermentative growth to respiratory growth. A large part of this response is mediated by the stress
responsive transcription factor Msn2. During glucose exhaustion, Msn2 is activated and concentrated
in the nucleus. Simultaneously, Msn2 protein levels also drop significantly under this condition. Here
we show that the decrease in Msn2 concentration is due to its increased degradation. Moreover, Msn2
levels are also reduced under chronic stress or low PKA activity, both conditions that cause a
predominant nuclear localization of Msn2. Similar effects were found in msn5 mutant cells that block
Msn2 nuclear export. To approximate the effect of low PKA activity on Msn2, we generated a mutant
form with alanine substitutions in PKA phosphorylation sites. High expression of this Msn2 mutant is
detrimental for growth, suggesting that the increased degradation of nuclear Msn2 might be necessary
to adapt cells to low PKA conditions after the diauxic shift, or to allow growth under chronic stress
conditions.
by guest on July 11, 2018http://w
ww
.jbc.org/D
ownloaded from
3
Introduction
In budding yeast, two redundant stress-inducible transcription factors, Msn2 and Msn4, play an
important role in the response to environmental cues (1). Both of these highly related Zn finger
transcription factors mediate the induction of stress protective genes whenever cells encounter a shift
towards sub-optimal growth conditions (2-4). Furthermore, Msn2 and Msn4 are activated during
diauxic shift, a transition from fermentative growth on glucose to respiratory growth, causing a
transient increase of stress inducible transcripts (5,6). Activation of Msn2 usually occurs through a
series of complex steps that increase its nuclear concentration and promoter recruitment. It is thought
that Msn4 is mechanistically regulated in similar ways. Exposure to stress conditions such as high
osmolarity, rapamycin treatment, heat stress, short chain organic acids, alcohols, and membrane
damage throttles Msn2 nuclear export and increases its binding to the stress response elements
(STRE) (7-10). However, in all these cases the nature of the signaling events leading to Msn2
activation is still largely obscure.
In contrast to our lack in understanding Msn2 activating signals, it is well established that
protein kinase A (PKA) activity plays an overriding role in the negative regulation of Msn2 function.
PKA activity imposes itself onto Msn2 nuclear import, nuclear export and possibly DNA binding (9).
Low PKA activity has been found to increase the expression level of Msn2 dependent genes, whereas
high PKA activity has been described to cause the opposite effect (11). Consequently, the question
emerged whether environmental stresses activate Msn2 function simply by antagonizing or modulating
PKA signalling. In fact, genetic interactions have been described between the TOR (target of
rapamycin) pathway and the Ras-PKA pathway, that are consistent with this assumption (12).
Moreover, TOR mediated nutrient signals have been shown to affect Msn2 function (13). Other studies
however rather support the conclusion that the Ras-PKA pathway does not mediate acute stress
responses (14). Of all tested stress treatments only glucose starvation appeared to induce changes in
the PKA dependent phosphorylation of serine 620 in the Msn2 NLS (14) whereas all other acute
stresses do not change a PKA dependent modification of this site. These findings might reflect
differences between short-term and long-term responses to environmental fluctuations. For example,
during the post diauxic shift, Msn2 is probably mainly activated due to an extended drop in protein
kinase A activity.
by guest on July 11, 2018http://w
ww
.jbc.org/D
ownloaded from
4
The distinct transcriptional response to acute stress exposure is usually transient, suggesting
that adaptive systems are in operation that help a cell to resume its support for growth and cell division
rather than invest into damage protection. Indeed, during stress relief, and during stress adaptation,
Msn2 is rapidly relocated from the nucleus to the cytoplasm. The situation is different, however, when
glucose is exhausted in a growing culture after the diauxic shift with constantly low PKA activity. Since
genetic evidence has shown that under low PKA activity Msn2 becomes detrimental for growth, the
question arises by which mechanism Msn2 is inactivated after the diauxic shift to avoid growth arrest.
Here we provide evidence that this adaptive effect might be achieved through different degradation
rates of nuclear versus cytoplasmic Msn2. Further analysis showed that Msn2 protein levels are
always reduced under conditions that cause prolonged nuclear localization of the protein. In
comparison to other transcription factors, for which degradation has been shown as a means of
regulation, the overall rates of Msn2 degradation are relatively slow in all cases. This observation
might suggest that protein degradation is unimportant for Msn2 regulation under short-term fluctuating
conditions. As shown through the use of a hyperactive allele of MSN2, however, nuclear degradation
of the factor might be important for avoiding prolonged growth arrest under sustained stress
conditions.
by guest on July 11, 2018http://w
ww
.jbc.org/D
ownloaded from
5
Experimental procedures
Yeast strains, media and growth conditions
All strains are derivatives of W303-1A (MAT a, ura3-1, leu2-3, his3-11, trp1-1, ade2-1, can1-1000).
W303msn2∆msn4∆msn5∆ was generated by isogenic crossing of W303msn2∆msn4∆ (9) with
W303msn5∆ (14). The correct genotype of the resulting strain was verified by PCR.
W303cdc35∆pde2∆ was generated by introducing the cdc35::kanMX disruption cassette, which was
recovered from the EUROSCARF collection, into W303pde2∆ (14). W303erg6∆ was a kind gift from K.
Kuchler (Vienna BioCenter).
Standard yeast culture methods were used as described by (9). Yeast cells were grown in
YPD or synthetic medium at 30°C to an OD600=1 and either used immediately, exposed to stress (7%
ETOH, 0.4M NaCl, or 37°C heat shock) or further grown through stationary phase. For cAMP
depletion cultures of W303cdc35∆pde2∆ were grown at 30°C in selective medium containing 3mM
cAMP to OD600=0,8, washed and re-suspended in cAMP-free medium and further incubated at 30°C.
For copper induction cells were grown at 30°C in selective media to logarithmic phase (OD600=0,8)
CuSO4 was added to a final concentration of 50µM for 30 minutes. CuSO4 was removed by two
washing steps and cells were resuspended in CuSO4-free medium and treated as indicated. To inhibit
proteasome activity W303erg6∆ cultures were diluted to OD600=0.2 and grown to OD600=1. MG132
(Sigma) was added to a final concentration of 50µM and 100µM.
Plasmids
All plasmids derive from plasmid pMsn2 (9). pYMSN2-myc was created by introducing a myc9-NotI
cassette (15) into NotI digested pYMSN2-GFP (9). Plasmids pCUP1MSN2 and pCUP1MSN2-GFP
were generated by introducing a SacII/ SalI 700bp PCR fragment of the CUP1 promoter generated
using oligos SacII-Cup1_fwd and SalI-Cup1_rev into SacII/SalI cut pYMSN2 and pYMSN2-GFP,
respectively. Plasmids pCUP1MSN2∆NES and pCUP1MSN2∆NES-GFP, both contain a mutant
version of Msn2 lacking amino acids 246 to 325, were obtained by replacing the ADH1 promoter
sequence of plasmid pADH1MSN2∆NES and pADH1MSN2∆NES-GFP, respectively, with the
SacII/SalI CUP1 promoter fragment. Plasmid pADH1MSN2∆NES-GFP was obtained by ligation of a
SalI/BamHI cut PCR fragment generated using oligos Msn2SalI and BamHI-∆NES-rev with
BamHI/NdeI cut PCR fragment (oligos BamHI-∆NES-fwd and EGFPseq-rev) into the SalI-NdeI cut
by guest on July 11, 2018http://w
ww
.jbc.org/D
ownloaded from
6
plasmid pAMG (9). Plasmid pADH1MSN2∆NES was obtained by removing the NotI fragment
containing the EGFP sequence from pADH1MSN2∆NES-GFP. Plasmids pCUP1-PKIMSN2 and
pCUP1-PKIMSN2-GFP were generated by replacing the MSN2 promoter from plasmids pYMSN2 and
pYMSN2-GFP with a SacII/SalI Fragment containing the CUP1 promoter fused to the PKI sequence.
Plasmids pCUP1MSN2A5 and pCUP1MSN2A5-GFP were generated by introducing a SalI cut PCR
fragment obtained with oligos Msn2SalI and Msn2x12SalI-rev and pYMSN2 as a template into SalI cut
pAMG8 (9), to obtain the full length ORF of MSN2A5. The internal XhoI fragment was then introduced
into XhoI cut pCUP1MSN2 and pCUP1MSN2-GFP to generate pCUP1MSN2A5 and pCUP1MSN2A5-
GFP.
Western blot- and northern blot analysis
Cells were harvested by centrifugation, re-suspended in buffer A (50mM HEPES pH=8, 0.4M
(NH4)2SO4, 1mM EDTA, 5% Glycerol) containing protease inhibitors (Boehringer, Complete EDTA
free) and broken with glass beads at 4°C for 20 minutes. Extracts were cleared by two 20 minutes
centrifugation steps at 4°C and boiled in 50% (v/v) 2xSDS sample buffer. 50µg of total protein for each
sample was loaded on a 7% SDS PAGE and separated. Proteins were transferred to nitrocellulose
membranes and immunodetection of proteins was carried out with ECLplus (Amersham) according to
the instructions of the supplier. Msn2 was detected with rabbit anti-Msn2 antiserum (kindly provided by
F.Estruch, Valencia), Kar2 with rabbit anti-Kar2 antiserum (a gift from A.Kal; University of Amsterdam)
and the Myc-epitope with monoclonal 9E10 antibody. Northern blot analysis was carried out as
described (16). CTT1 was detected with a probe derived from the EcoRI fragment from plasmid
pRB322-5109 (17) and for IPP1 we used a PCR fragment generated with the oligos IPP1-fwd and
IPP1-rev.
Catalase activity was determined in crude extracts prepared by breaking 20 OD600 equivalents
of cells in 100µl breaking buffer (50mM Tris pH 7, 10% glycerol) with glass beads at 4°C. 10µl crude
extract (protein concentration usually between 5 and 10mg/ml) was added to 3ml Catalase buffer
(50mM Na2HPO4 pH7, 0,1% Triton X-100, 200mM H2O2) mixed immediately and the disappearance of
H2O2 at 240nm was followed for up to 3 minutes. Catalase activity was calculated in µM H2O2 per
minute per mg total protein (ε = 43,75).
by guest on July 11, 2018http://w
ww
.jbc.org/D
ownloaded from
7
GFP-fluorescence microscopy
Fluorescence microscopy experiments were performed as described previously (Görner et al., 1998;
Görner et al., 2002). GFP was visualized in live cells without fixation. Nuclei were stained by addition
of 2µg/ml 4,6 diamidino-2-phenylindol (DAPI) dye to the cultures 10 minutes prior to microscopy. All
cells were viewed using a Zeiss Axioplan 2 fluorescence microscope. Images were captured with a
Quantix CCD camera using IP-Lab or Lightview software.
by guest on July 11, 2018http://w
ww
.jbc.org/D
ownloaded from
8
Results
Msn2 levels are diminished after the diauxic shift.
Under logarithmic growth conditions yeast cells maintain a balanced level of Msn2 protein that does
not change under acute stress conditions (9). Similarly, according to Chi et al. adaptation to heat
shock had no effect on Msn2 levels, leading to the proposal that an increase in the nuclear export rate
of Msn2 was the main stress adaptive feature (18). However, an analysis of Msn2 behaviour during
the diauxic shift made us re-evaluate the possibility of Msn2 regulation by protein degradation. A
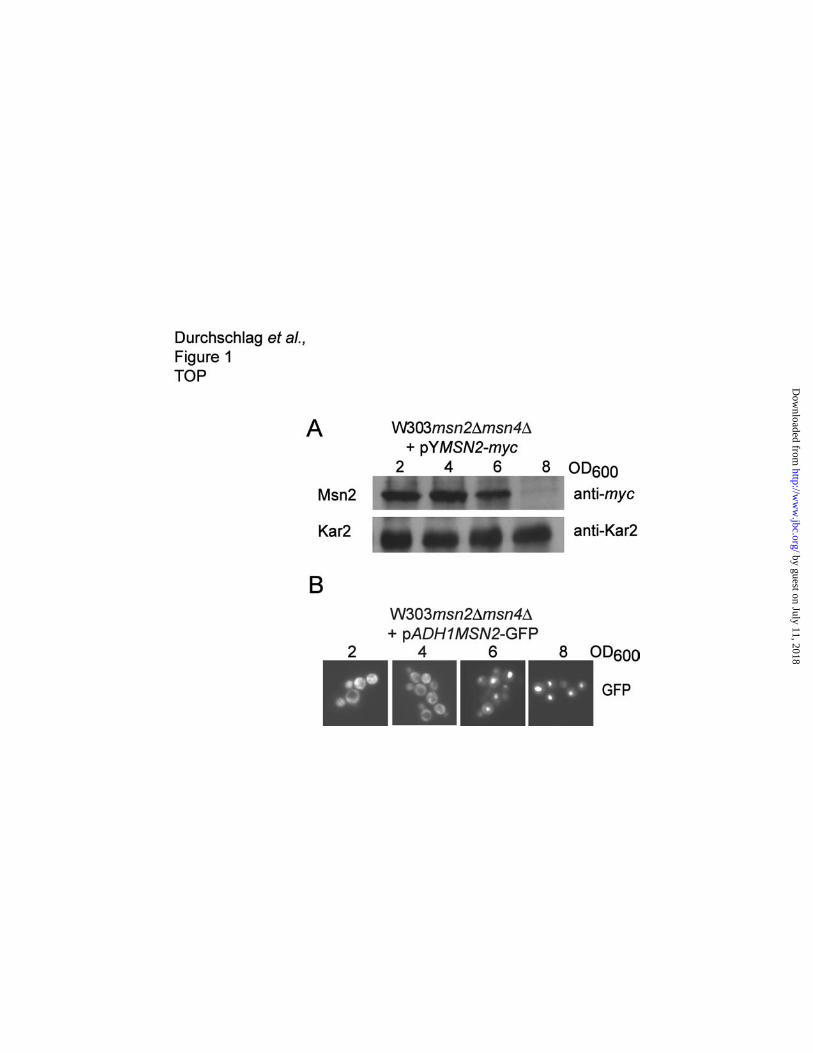
western blot analysis showed that an epitope tagged version of Msn2, which was expressed from a
centromeric plasmid under the control of the native promoter (pYMSN2-myc), revealed a dramatic
reduction of Msn2 protein levels at later growth stages between OD600 of 6 and 8 (Figure 1A).
Surprisingly this effect was not accompanied by a similar reduction in MSN2 transcript levels
(unpublished data). Moreover, similar results were obtained with native Msn2 (unpublished data) and
with Msn2 expressed from a heterologous promoter (unpublished data). Since Msn2 disappeared
within a short time in the early diauxic shift, it was most likely that Msn2 was degraded at higher rates
during this period of growth. The localization of Msn2 during the diauxic shift was followed by
fluorescence microscopy of a Msn2-GFP fusion driven by the ADH1 promoter. Msn2-GFP
accumulates in the nucleus when glucose is exhausted in the culture (Figure 1B). However, we
noticed reduction of the GFP signal at later growth stages, an impression conform with our western
blot analysis. This observation also suggested a connection between Msn2 localization and protein
stability.
Cells under chronic stress exhibit a reduction in Msn2 levels.
To address the question whether it is nuclear localization per se or stress and starvation signals, that
caused enhanced Msn2 degradation, we analyzed different conditions known to relocate Msn2 to the
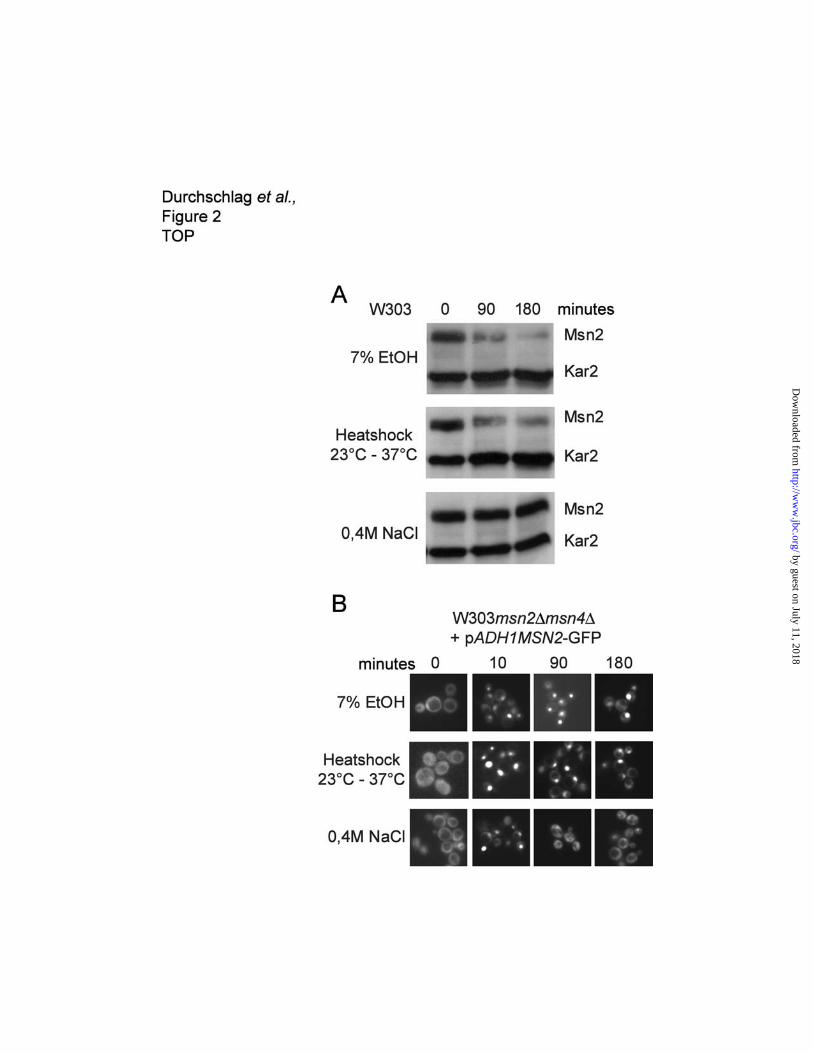
nucleus. Exponentially growing cells were exposed to prolonged treatments with ethanol, mild osmotic
stress and heat shock. Msn2 protein levels decreased noticeably during growth at high temperature,
and after the addition of stressful amounts of ethanol to the culture (Figure 2A). In contrast, osmotic
stress had no effect on Msn2 levels. Analysis of the localization pattern of Msn2-GFP during stress
treatments indicated that both chronic ethanol and chronic heat stress lead to the permanent nuclear
localization of Msn2-GFP. On the contrary, osmotic stress caused only transient nuclear localization of
by guest on July 11, 2018http://w
ww
.jbc.org/D
ownloaded from
9
Msn2-GFP, and Msn2-GFP began to reappear in the cytosol after one hour (Figure 2B). These
obsevations support the hypothesis that prolonged nuclear accumulation of Msn2-GFP leads to a
reduction of Msn2 protein levels.
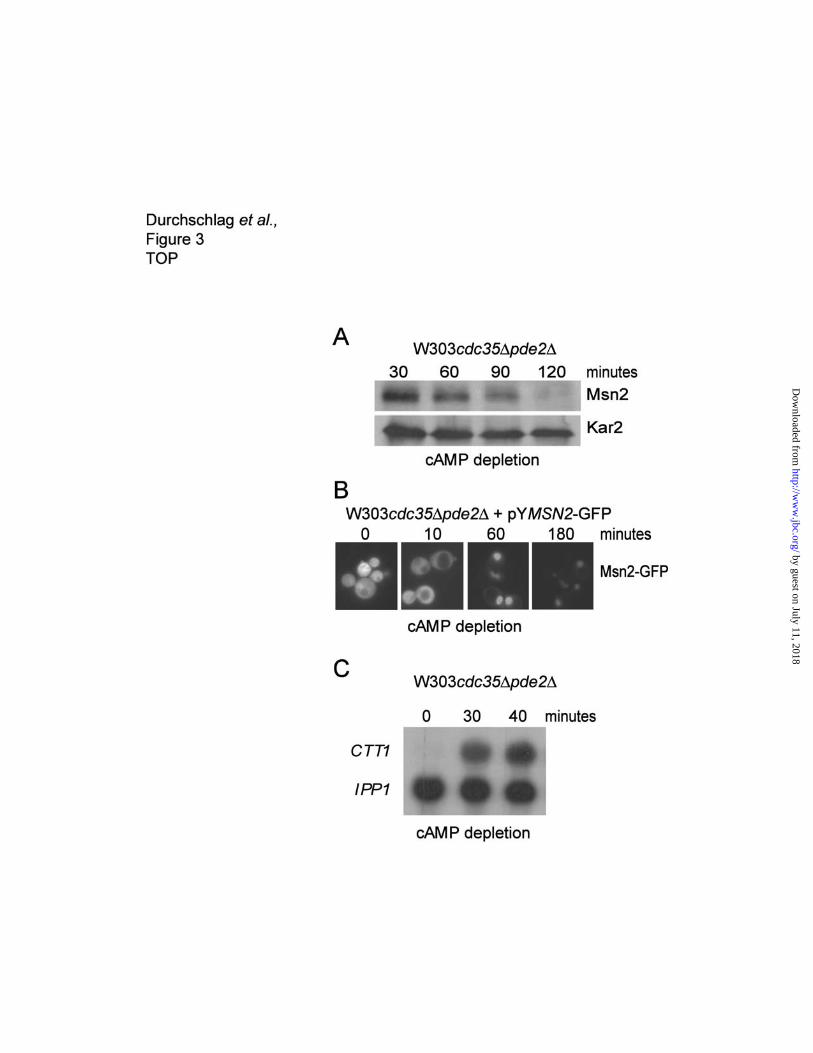
Reduction of protein kinase A causes a decrease in Msn2 protein levels.
Since PKA is a potent modulator of Msn2 localization and activity, we tested whether low PKA activity
has a similar effect as glucose depletion and stress on Msn2 stability (9,14). To manipulate PKA
activity we used a strain lacking both the adenylylcyclase gene (CDC35) and the high affinity
phosphodiesterase gene (PDE2), causing a prolonged stability of cAMP in the cells; a requirement for
manipulation of the intracellular cAMP pool. After cAMP removal, Msn2 protein levels dropped
significantly over a period of 2 hours (Figure 3A). To verify effective Msn2 activation under these
conditions, we analyzed nuclear localization of Msn2-GFP (Figure 3B) and transcriptional induction of
the Msn2-dependent CTT1 gene (Figure 3C) (16). The kinetics of the induction of the CTT1 gene and
the slow kinetics of nuclear concentration of Msn2 after cAMP removal, might be due to the pde2
deletion causing a delayed drop in intracellular cAMP levels (19). These data demonstrate that in
unstressed cells, and in the presence of glucose, reduced cAMP levels, presumably through a drop of
PKA acivity, are sufficient to cause a drop of Msn2 levels.
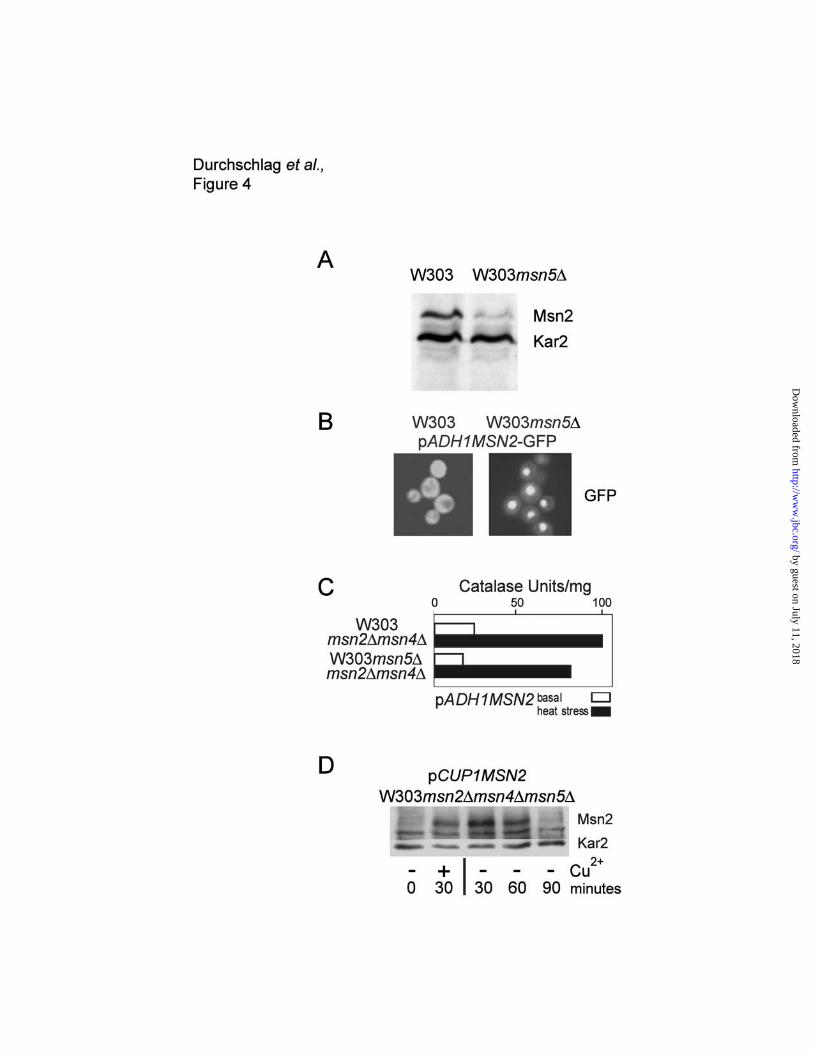
Nuclear accumulation destabilizes Msn2.
The common denominator of the conditions causing a drop in Msn2 protein levels is its nuclear
accumulation. Nuclear export of Msn2 is dependent on the nuclear export factor Msn5, which has
been implicated in a wide variety of signaling systems (20-23). To monitor the stability of Msn2 in the
nuclear compartment, we determined Msn2 protein levels in msn5∆ strains by western blotting. We
observed that msn5∆ strains exhibit an approximately 3-fold reduced steady state level of Msn2
protein (Figure 4A). As shown in Figure 4B, msn5∆ cells exhibit a permanently enhanced nuclear
signal from a Msn2-GFP fusion. Interestingly, despite the unusual, constitutive nuclear localization of
Msn2, environmental stress response (ESR) gene transcription is still under proper stress regulation
(Figure 4C), suggesting that an increase in nuclear localization of Msn2 alone is normally not sufficient
for the induction of its target genes. We used catalase activity as a readout system for CTT1
expression (24). Both the basal CTT1 expression as well as the temperature induced expression are
by guest on July 11, 2018http://w
ww
.jbc.org/D
ownloaded from
10
at comparable levels. The relatively normal basal CTT1 expression observed in the msn5∆, might be
explained by the reduction in Msn2 protein levels.
To exclude interference with the de novo synthesis of Msn2, the open reading frame of the
MSN2 gene was placed under the control of a conditional promoter. We chose the CUP1 promoter
because it is inducible by low (50µM) amounts of Cu2+ ions, which do not activate any genes known to
be under Msn2 control (our unpublished results). The CUP1 promoter controlled Msn2 construct was
introduced on a centromeric plasmid (pCUP1MSN2) in the strains W303msn2∆msn4∆ and
W303msn2∆msn4∆msn5∆. Msn2 synthesis was induced for 30 minutes followed by removing Cu2+
from the medium. We followed the Msn2 protein levels on western blots and found a loss of detectable
Msn2 protein within 90 minutes. In contrast, in the wildtype strain no such decrease was visible (Figure
4D and 5A) thus indicating that the reduced Msn2 levels in the msn5∆ mutant are most probably due
to enhanced turnover. To avoid the pleiotropic effects of the msn5∆ mutant, we also studied the
behaviour of Msn2 mutants that show increased nuclear accumulation. To permanently localize Msn2
in the nucleus, we used a mutant version of Msn2 that lacked a sequence required for efficient
cytoplasmic localization. This sequence most likely included a Msn5 dependent nuclear export signal
(amino acids 246 to 325) (14) and was therefore designated Msn2∆NES. Msn2∆NES was placed
under the control of the CUP1 promoter (pCUP1MSN2∆NES) and expressed in the strain
W303msn2∆msn4∆. As shown in Figure 5A, the levels of the mutant protein clearly declined more
rapidly than the wild-type product. Nothern blot analysis indicated that this effect is not due to
influences on mRNA stability. In both cases, MSN2 mRNA levels rise sharply after Cu2+ addition, only
to fall to their previous levels within minutes after removal of Cu2+. The decline in Msn2 protein levels
obviously occurs at a much slower rate (our unpublished results). Fluorescence microscopy with a
CUP1 regulated Msn2∆NES-GFP expression system confirms the predominant nuclear localization of
the mutant protein. Moreover, after its synthesis is triggered by presence of Cu2+, the signal is lost
more rapidly after removal of Cu2+ than its wild-type control (Figure 5B). We also considered the
possiblity that the internal deletion of Msn2∆NES might affect the stability of the mutant protein.
Therefore, we investigated the behavior of another Msn2 mutant form which is also constitutively
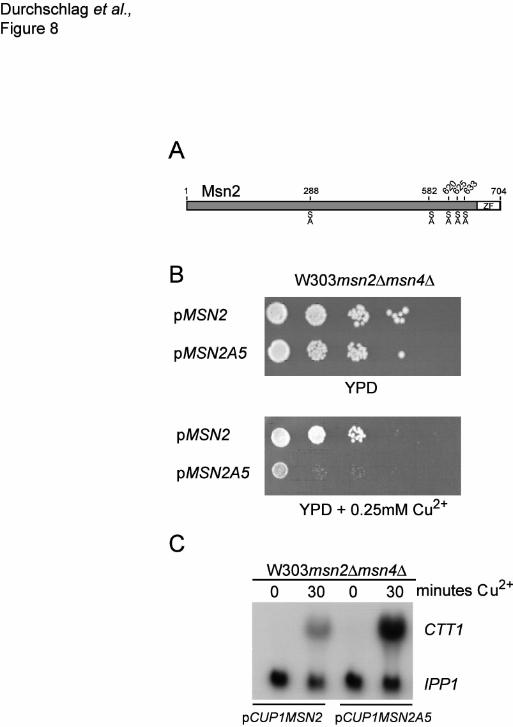
accumulated in the nucleus. This mutant carried simultaneous point mutations in five putative PKA
phosphorylation sites substituting serine 288, 582, 620, 625, and 633 to alanine (Msn2A5) (Figure 8A),
but still contained the sequence deleted in MSN2∆NES. Expression analysis of a CUP1-regulated
by guest on July 11, 2018http://w
ww
.jbc.org/D
ownloaded from
11
Msn2A5 mutant revealed that after CUP1 promoter shut-off, the drop in Msn2A5 protein level was
comparable to what we observed with the MSN2∆NES mutant (Figure 5A and 5C). Quantification of
the band intensities shows that the half life of nuclear Msn2 is between 60 and 90 minutes (Figure 5C).
It is important to note that this increase in degradation occurred even in the absence of stress. To
further investigate the possibility of an intrinsic instablility of the MSN2∆NES mutant we compared its
protein levels to nuclear Msn2. To achieve comparable conditions the stability of both proteins was
determined after CUP1 promoter shut-off under 7% ethanol stress (Figure 5A). Quantification indicates
a similar stability of both Msn2 and Msn2∆NES in the nucleus (Figure 5C) thus excluding a large
impact of the internal deletion on Msn2 stability. Taken together, these data therefore suggest that
nuclear localization of Msn2 could be causally linked with lower Msn2 protein stability.
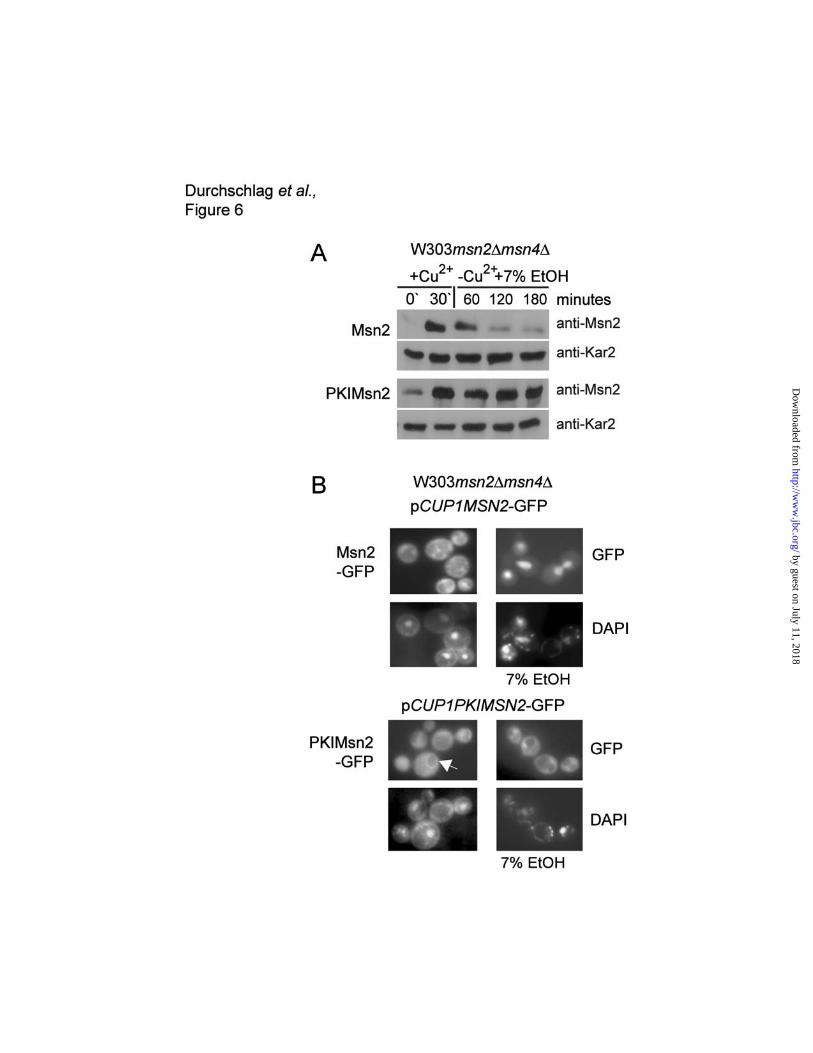
Subcellular localization but not stress is the major determinant for Msn2 stability.
If degradation of Msn2 is exclusively dependent on nuclear localisation, then Msn2 levels should be
stable in the cytosol even under stress or starvation conditions. To test this possibility we fused a short
nuclear export signal derived from the mammalian protein kinase A inhibitor (PKI) (25) to the N-
terminus of Msn2. This construct was expressed under the control of the CUP1 promoter
(pCUP1PKIMSN2). Synthesis of both, Msn2 and PKIMsn2, was induced for 30 minutes by addition of
copper in exponentially growing cultures. After removal of copper, cells were stressed with 7% ethanol
and Msn2 as well as PKIMsn2 levels were analyzed by western blots. While Msn2 levels dropped
significantly, PKIMsn2 protein levels remained constant over a period of three hours (Figure 6A). The
sub-cellular localization of both proteins under these conditions was verified using GFP fusions. As
shown in Figure 6B, Msn2-GFP accumulates in the nucleus in ethanol stressed cells, however, PKI-
Msn2-GFP remained in the cytosol with a slight accumulation at the outer nuclear rim. These data
supported the notion that it is not stress per se but the localization of the protein that determines the
stability of Msn2.
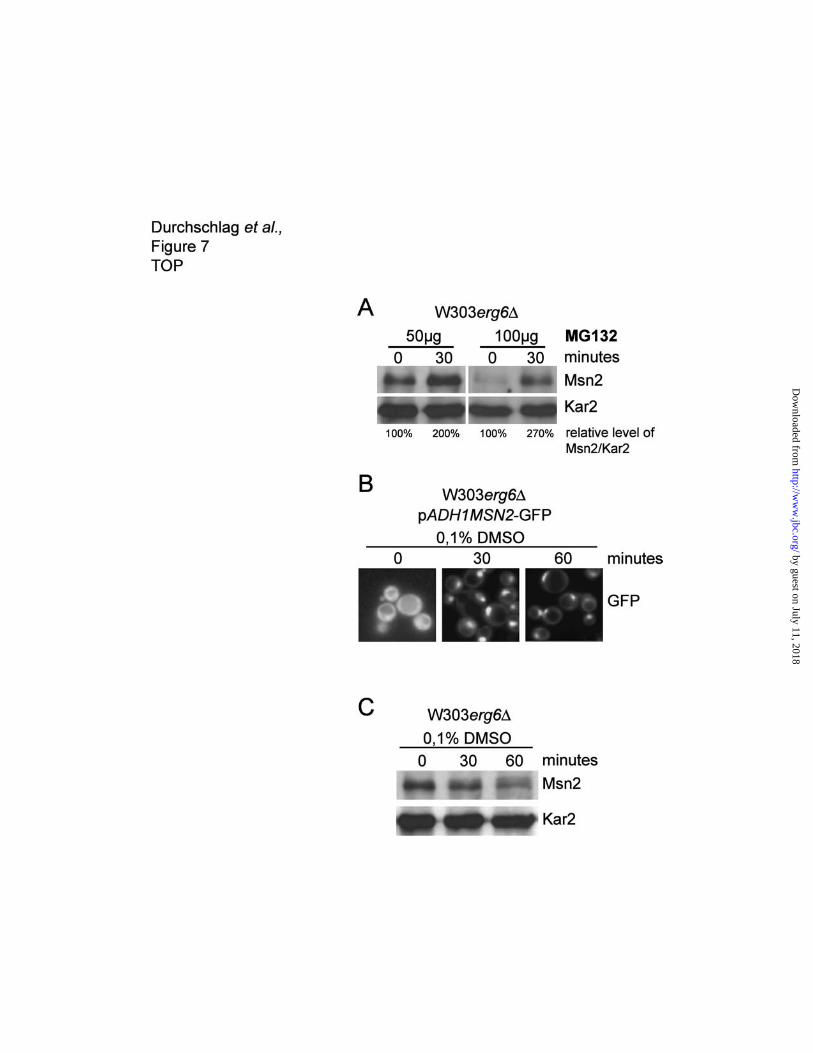
The proteasome inhibitor MG132 inhibits degradation of nuclear Msn2.
Most short lived proteins are degraded via the 26S proteasomal pathway. If Msn2 degradation in the
nucleus is mediated through this route, inhibition of the proteasome should lead to accumulation of
Msn2. To test this we used a strain lacking the ERG6 gene (W303erg6∆) a mutation facilitating the
uptake of the proteasome inhibitor MG132 (26). We used two concentrations of MG132 dissolved in
by guest on July 11, 2018http://w
ww
.jbc.org/D
ownloaded from
12
DMSO and found increased levels of Msn2 protein in a dose dependent manner (Figure 7A) relative to
the DMSO control. The DMSO concentration was adjusted to 0.1% in both treated cultures.
Quantification shows a two- to threefold increase of the Msn2 protein level within a relatively short time
(30 minutes) of incubation. To verify the intracellular localization of Msn2 under the used conditions we
determined the localization of a Msn2-GFP fusion protein. Exposure to 0.1% DMSO causes rapid
nuclear accumulation of Msn2-GFP (Figure 7B). Prolonged treatment with 0,1% DMSO results in
decreasing levels of Msn2 similar to other stress conditions (Figure 7C). Taken together, these data
suggest intranuclear degradation of Msn2 by the proteasome.
Constitutive activation of Msn2 is detrimental for growth.
To assess whether degradation of Msn2 has a physiologically relevant aspect, we studied the growth-
phenotype of the Msn2A5 mutation, a constitutively active version of Msn2. Forced expression of
Msn2A5 under control of the CUP1 promoter efficiently inhibited cell growth indicating that an excess
of Msn2A5 is detrimental to yeast growth (Figure 8B). Concomitantly, we found high levels of CTT1
expression, one of the major Msn2 target genes (Figure 8C). During the diauxic shift, wild-type Msn2
becomes dephosphorylated at its PKA phosphorylation sites followed by a noteable drop in its cellular
concentration (Görner, W. Reiter unpublished). Since Msn2A5 has lost five of its putative PKA
phosphorylation sites (Figure 8A), the mutant protein can be viewed as a dephosphorylated and
perhaps hyperactive form of Msn2. If maintained at high levels, due to an unusually active promoter,
the continuous expression of the full set of Msn2 controlled ESR genes might be detrimental for
growth and/or proliferation. Under normal condition the increased degradation rates of Msn2 could
prevent such a scenario.
by guest on July 11, 2018http://w
ww
.jbc.org/D
ownloaded from

13
Discussion
Elimination of transcription factors by regulated proteolysis has emerged as an important
regulatory principle (for review see (27,28)). In this work we addressed the question whether such a
mechanism could be relevant for Msn2 dependent gene expression during growth adjustments and
stress adaptive processes in yeast. Overall, our results confirmed previous notions on Msn2 stability,
namely that degradation is not an important feature for adaptation to acute short-term stress
conditions (9,14,18). However, we were also able to define growth situations in which differences in
the steady state level of Msn2 could best be explained by an enhanced degradation rate of this
protein. Low levels of Msn2 were usually associated with chronic stress or severe limitations in carbon
source. This observation raised two major questions: First, what is the cause and nature of the
increased degradation? Second, what is its physiological significance?
In yeast, Gcn4 provides perhaps one of the best-understood examples for transcription factor
modulation by degradation (29). Gcn4 is the main player in the regulation of amino acid and purine
biosynthesis genes increasing their expression whenever the translational system is depleted of
aminoacyl-tRNAs. In cells grown on rich medium, Gcn4 levels normally become quite low due to
increased protein degradation. Under these conditions Gcn4 is phosphorylated by the Pho85-Pcl5
cyclin-CDK, a modification allowing the E3 complex SCFcdc4 to recognize Gcn4 (30). Another, but
functionally quite similar, modification of Gcn4 is introduced by Srb10, a cyclin dependent protein
kinase of the mediator complex, suggesting a feedback mechanism for transcriptionally active Gcn4
(18). Most of the lessons learned by the Gcn4 system might, however, not be applicable to Msn2.
The most dramatic difference between the two factors is the relative stability of Msn2 under all
growth conditions when compared to Gcn4. Even under chronic stress Msn2 has a half-life that is
measured in hours rather than minutes as found for Gcn4. A second point relates to the cause of
degradation. Is it initiated by specific phosphorylation events similar to the situation found with Gcn4 or
is it rather the consequence of localization? Although Msn2 has been reported to become
ubiquitinated via SCFcdc4 complex in vitro just as Gcn4, we propose that the degradation is rather a
consequence of nuclear occupation rates than stress or starvation dependent modifications signals. In
the two best studied examples of SCFcdc4 mediated degradation pathways, namely Sic1 and Gcn4,
phosphorylation plays an essential part in raising the affinity between the E3 complex and its
substrates (31,32). So far, similar modifications have not been identified for Msn2. It is clear, however,
that PKA dependent modification sites should not be relevant. First of all, dephosphorylation rather
by guest on July 11, 2018http://w
ww
.jbc.org/D
ownloaded from
14
than phosphorylation at the PKA motifs results in high nuclear accumulation as well as a decrease in
Msn2 levels. Moreover, not all conditions that cause low levels of Msn2 lead to a prolonged decrease
in PKA dependent Msn2 phosphorylation. So, if there are targets in Msn2 that direct signal-induced
increases in ubiquitination and degradation, they are likely to differ from the PKA motifs. However,
such a conclusion would make it difficult to explain the effects observed under low PKA kinase activity.
Since prolonged nuclear accumulation currently remains the only common denominator of all the
conditions causing low Msn2 levels, we believe that nuclear location of Msn2 per se is the crucial
parameter. The fact that enforced nuclear export suppresses an increase in Msn2 degradation under
chronic stress clearly supports this contention. The same data also invalidate any model of stress or
starvation induced cytoplasmic degradation of Msn2, an interpretation that would be otherwise
consistent with the cytological observations of Msn2-GFP fusions.
The simple assumption of different, but constant, degradation rates between nuclear and
cytoplasmic Msn2 could in principle explain all the phenomena described here. One concern,
however, might be the reliability of Msn2 half-life values as they are derived from promoter shut-off
analysis followed by western blot assays. The half-life, as estimated by us, for nuclear Msn2 correlates
well with the half-life mentioned by Chi et al., who used metabolic labeling. One has to take into
account that the growth conditions necessary, and routinely used, for effective metabolic labeling
experiments constitute a poor growth environment. Therefore, the values for the Msn2 half-life of
about one hour in stressed or starved cells is likely to be correct. A similar value was obtained for cells
under optimal growth conditions but with enforced nuclear accumulation of Msn2. This contrasts with
our estimates in normal cells at optimal growth conditions, in which Msn2 half-life should approach
three hours. We are aware that values between the indicated levels are difficult to measure and that
subtle differences cannot be quantified and therefore interpreted with any confidence. Nevertheless,
we assume that the differences documented here are indeed noticeable. In this regard it should be
noted that (18) claimed to find no difference in Msn2 stability between msn5∆ and wild-type cells. We
assume that this is not due to technical reasons but that the differences might have been missed if
wild-type cells and mutant cells were compared at late growth stages (e.g. post- diauxic shift).
To what extent could different degradation rates of nuclear versus cytoplasmic Msn2 be useful
for a yeast cell? Acute stress situations, during otherwise optimal growth conditions, will normally
cause a transient growth arrest and elicit dramatic changes in the transcriptional program (2,33). Msn2
plays an important role in this response. Upon stress relief, it should be advantageous to resume
by guest on July 11, 2018http://w
ww
.jbc.org/D
ownloaded from

15
growth as quickly as possible. Indeed, the rapid return of stress specific transcripts to normal levels is
reflected in the dynamic localization pattern of Msn2 (9,16). Control of the nucleo-cytoplasmic shuttling
of Msn2 could therefore easily lead to the required rapid redistribution of Msn2 without impairing a
cell’s capacity for subsequent responses. The nuclear half-life of Msn2 would still exceed the time
frame of the response (as actually observed here during osmotic shock), and its contribution towards
adaptation would thus be negligible. Chronic stress might require a different strategy from acute stress
since cells will undergo long-term changes in their physiology. The diauxic shift, during which cells
switch from fermentative growth to respiratory growth, might serve as an example for such a chronic
condition. The drop in glucose concentration leads to lower PKA activity, which in turn activates Msn2
(14). If glucose is permanently depleted, Msn2 receives a constitutive signal for nuclear accumulation
and activation. Under these conditions, higher nuclear degradation rates should be sufficient to
prevent, over time, an inappropriate high activation of stress specific genes. Similar arguments could
be made for permanent stress situations. A relatively modest difference in degradation rates between
nuclear and cytoplasmic Msn2, may promote Msn2 inactivation under such chronic stress or starvation
conditions but might also preserve an ample supply of the factor when responding to rapidly changing
conditions.
There is previous evidence that active Msn2 could become detrimental for growth. First,
absence of PKA activity, which causes dephosphorylation and activation of Msn2, leads to growth
arrest, which is suppressed by the absence of Msn2 and Msn4 (34). Here we provide a second
example, as a largely unregulated form of Msn2 can be mimicked by serine to alanine replacements in
5 PKA consensus sites. This Msn2A5 mutant protein is constitutively localized in the nucleus. It
activates Msn2-dependent genes and is detrimental for growth when expressed at high levels. The
exact reason for the growth arrest caused by active Msn2 is currently not known but could be a
cumulative effect of the up-regulation of whole ESR cluster or the specific effects of a few regulatory
genes.
by guest on July 11, 2018http://w
ww
.jbc.org/D
ownloaded from

16
Acknowledgments
We thank F. Estruch for materials, the Ammerer Lab for support and particularly S.M.Salah for
discussions, P. Kovarik and F. Kragler for critically reading the manuscript. We especially thank
V.DeWever and C.Brocard for sharing unpublished results and discussion. This work was supported
by the FWF grant P12015 to the late H. Ruis.
by guest on July 11, 2018http://w
ww
.jbc.org/D
ownloaded from
17
References
1. Estruch, F. (2000) FEMS Microbiol Rev 24, 469-486
2. Gasch, A. P., Spellman, P. T., Kao, C. M., Carmel-Harel, O., Eisen, M. B., Storz, G., Botstein,
D., and Brown, P. O. (2000) Mol Biol Cell 11, 4241-4257
3. Causton, H. C., Ren, B., Koh, S. S., Harbison, C. T., Kanin, E., Jennings, E. G., Lee, T. I.,
True, H. L., Lander, E. S., and Young, R. A. (2001) Mol Biol Cell 12, 323-337
4. Schüller, C., Mamnun, Y. M., Mollapour, M., Krapf, G., Schuster, M., Bauer, B. E., Piper, P.
W., and Kuchler, K. (2004) Mol Biol Cell 15, 706-720
5. DeRisi, J. L., Iyer, V. R., and Brown, P. O. (1997) Science 278, 680-686
6. Cameroni, E., Hulo, N., Roosen, J., Winderickx, J., and De Virgilio, C. (2004) Cell Cycle 3
7. Kobayashi, N., and McEntee, K. (1993) Mol Cell Biol 13, 248-256
8. Marchler, G., Schüller, C., Adam, G., and Ruis, H. (1993) EMBO J 12, 1997-2003
9. Görner, W., Durchschlag, E., Martinez-Pastor, M. T., Estruch, F., Ammerer, G., Hamilton, B.,
Ruis, H., and Schüller, C. (1998) Genes Dev 12, 586-597
10. Moskvina, E., Imre, E. M., and Ruis, H. (1999) Mol Microbiol 32, 1263-1272
11. Jones, D. L., Petty, J., Hoyle, D. C., Hayes, A., Ragni, E., Popolo, L., Oliver, S. G., and
Stateva, L. I. (2003) Physiol Genomics 16, 107-118
12. Schmelzle, T., Beck, T., Martin, D. E., and Hall, M. N. (2004) Mol Cell Biol 24, 338-351
13. Beck, T., and Hall, M. N. (1999) Nature 402, 689-692
14. Görner, W., Durchschlag, E., Wolf, J., Brown, E. L., Ammerer, G., Ruis, H., and Schüller, C.
(2002) EMBO J 21, 135-144
15. Piatti, S., Bohm, T., Cocker, J. H., Diffley, J. F., and Nasmyth, K. (1996) Genes Dev 10, 1516-
1531
16. Martinez-Pastor, M. T., Marchler, G., Schüller, C., Marchler-Bauer, A., Ruis, H., and Estruch,
F. (1996) EMBO J 15, 2227-2235
17. Spevak, W., Fessl, F., Rytka, J., Traczyk, A., Skoneczny, M., and Ruis, H. (1983) Mol Cell Biol
3, 1545-1551
18. Chi, Y., Huddleston, M. J., Zhang, X., Young, R. A., Annan, R. S., Carr, S. A., and Deshaies,
R. J. (2001) Genes Dev 15, 1078-1092
19. Wilson, R. B., Renault, G., Jacquet, M., and Tatchell, K. (1993) FEBS Lett 325, 191-195
by guest on July 11, 2018http://w
ww
.jbc.org/D
ownloaded from
18
20. Hopper, A. K. (1999) Curr Biol 9, 803-806
21. Alepuz, P. M., Matheos, D., Cunningham, K. W., and Estruch, F. (1999) Genetics 153, 1219-
1231
22. Kaffman, A., Rank, N. M., O'Neill, E. M., Huang, L. S., and O'Shea, E. K. (1998) Nature 396,
482-486
23. Yoshida, K., and Blobel, G. (2001) J Cell Biol 152, 729-740
24. Belazzi, T., Wagner, A., Wieser, R., Schanz, M., Adam, G., Hartig, A., and Ruis, H. (1991)
EMBO J 10, 585-592
25. Wen, W., Harootunian, A. T., Adams, S. R., Feramisco, J., Tsien, R. Y., Meinkoth, J. L., and
Taylor, S. S. (1994) J Biol Chem 269, 32214-32220
26. Lee, D. H., and Goldberg, A. L. (1996) J Biol Chem 271, 27280-27284
27. Muratani, M., and Tansey, W. P. (2003) Nat Rev Mol Cell Biol 4, 192-201
28. Conaway, R. C., Brower, C. S., and Conaway, J. W. (2002) Science 296, 1254-1258
29. Hinnebusch, A. G., and Natarajan, K. (2002) Eukaryot Cell 1, 22-32
30. Shemer, R., Meimoun, A., Holtzman, T., and Kornitzer, D. (2002) Mol Cell Biol 22, 5395-5404
31. Feldman, R. M., Correll, C. C., Kaplan, K. B., and Deshaies, R. J. (1997) Cell 91, 221-230
32. Meimoun, A., Holtzman, T., Weissman, Z., McBride, H. J., Stillman, D. J., Fink, G. R., and
Kornitzer, D. (2000) Mol Biol Cell 11, 915-927
33. Gasch, A. P., and Werner-Washburne, M. (2002) Funct Integr Genomics 2, 181-192
34. Smith, A., Ward, M. P., and Garrett, S. (1998) EMBO J 17, 3556-3564
by guest on July 11, 2018http://w
ww
.jbc.org/D
ownloaded from
19
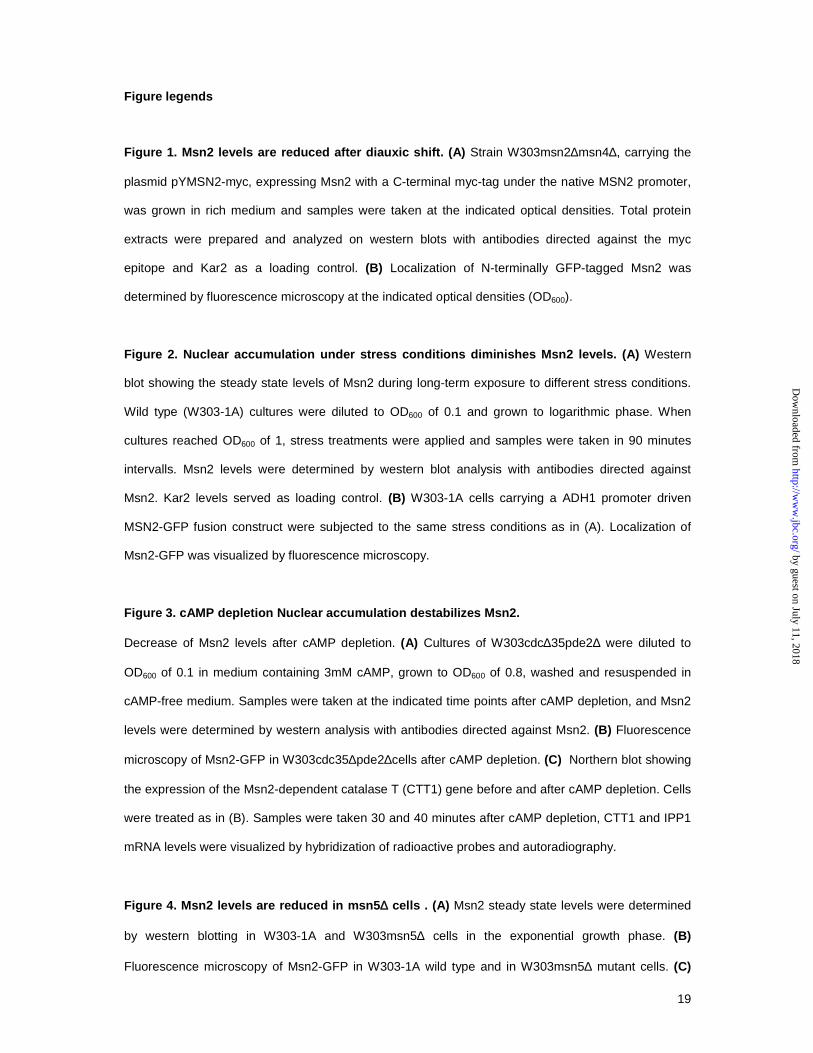
Figure legends
Figure 1. Msn2 levels are reduced after diauxic shift. (A) Strain W303msn2∆msn4∆, carrying the
plasmid pYMSN2-myc, expressing Msn2 with a C-terminal myc-tag under the native MSN2 promoter,
was grown in rich medium and samples were taken at the indicated optical densities. Total protein
extracts were prepared and analyzed on western blots with antibodies directed against the myc
epitope and Kar2 as a loading control. (B) Localization of N-terminally GFP-tagged Msn2 was
determined by fluorescence microscopy at the indicated optical densities (OD600).
Figure 2. Nuclear accumulation under stress conditions diminishes Msn2 levels. (A) Western
blot showing the steady state levels of Msn2 during long-term exposure to different stress conditions.
Wild type (W303-1A) cultures were diluted to OD600 of 0.1 and grown to logarithmic phase. When
cultures reached OD600 of 1, stress treatments were applied and samples were taken in 90 minutes
intervalls. Msn2 levels were determined by western blot analysis with antibodies directed against
Msn2. Kar2 levels served as loading control. (B) W303-1A cells carrying a ADH1 promoter driven
MSN2-GFP fusion construct were subjected to the same stress conditions as in (A). Localization of
Msn2-GFP was visualized by fluorescence microscopy.
Figure 3. cAMP depletion Nuclear accumulation destabilizes Msn2.
Decrease of Msn2 levels after cAMP depletion. (A) Cultures of W303cdc∆35pde2∆ were diluted to
OD600 of 0.1 in medium containing 3mM cAMP, grown to OD600 of 0.8, washed and resuspended in
cAMP-free medium. Samples were taken at the indicated time points after cAMP depletion, and Msn2
levels were determined by western analysis with antibodies directed against Msn2. (B) Fluorescence
microscopy of Msn2-GFP in W303cdc35∆pde2∆cells after cAMP depletion. (C) Northern blot showing
the expression of the Msn2-dependent catalase T (CTT1) gene before and after cAMP depletion. Cells
were treated as in (B). Samples were taken 30 and 40 minutes after cAMP depletion, CTT1 and IPP1
mRNA levels were visualized by hybridization of radioactive probes and autoradiography.
Figure 4. Msn2 levels are reduced in msn5∆ cells . (A) Msn2 steady state levels were determined
by western blotting in W303-1A and W303msn5∆ cells in the exponential growth phase. (B)
Fluorescence microscopy of Msn2-GFP in W303-1A wild type and in W303msn5∆ mutant cells. (C)
by guest on July 11, 2018http://w
ww
.jbc.org/D
ownloaded from
20
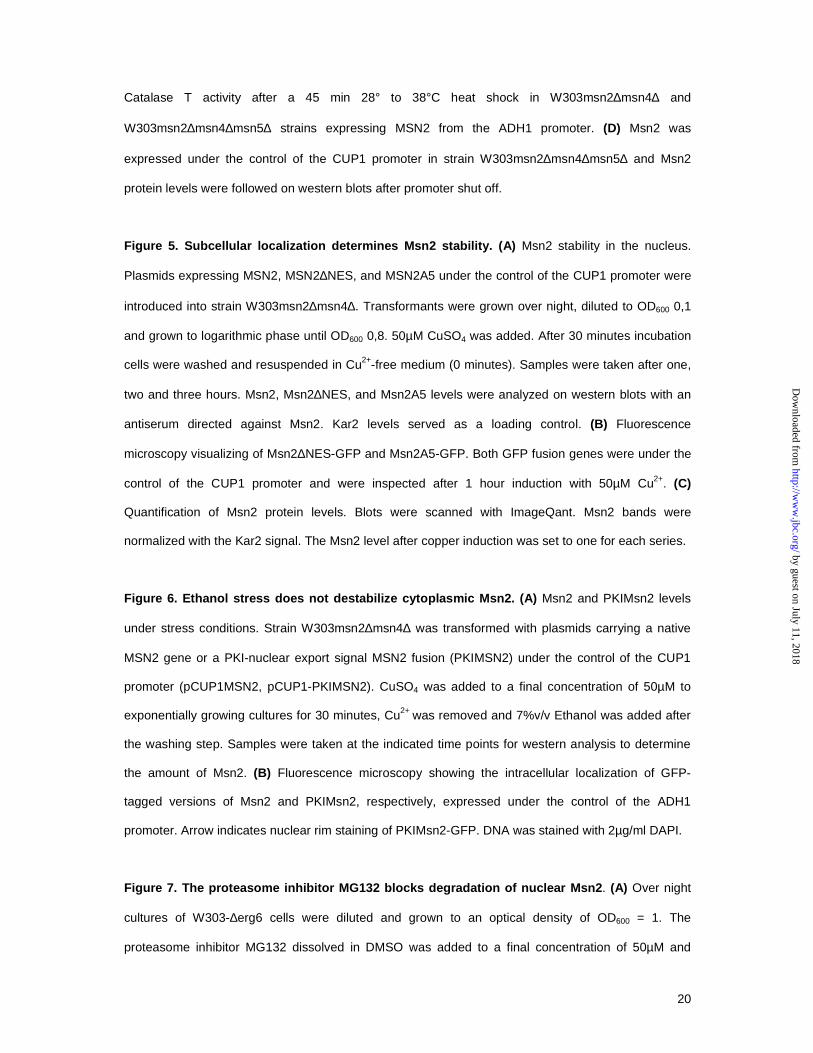
Catalase T activity after a 45 min 28° to 38°C heat shock in W303msn2∆msn4∆ and
W303msn2∆msn4∆msn5∆ strains expressing MSN2 from the ADH1 promoter. (D) Msn2 was
expressed under the control of the CUP1 promoter in strain W303msn2∆msn4∆msn5∆ and Msn2
protein levels were followed on western blots after promoter shut off.
Figure 5. Subcellular localization determines Msn2 stability. (A) Msn2 stability in the nucleus.
Plasmids expressing MSN2, MSN2∆NES, and MSN2A5 under the control of the CUP1 promoter were
introduced into strain W303msn2∆msn4∆. Transformants were grown over night, diluted to OD600 0,1
and grown to logarithmic phase until OD600 0,8. 50µM CuSO4 was added. After 30 minutes incubation
cells were washed and resuspended in Cu2+-free medium (0 minutes). Samples were taken after one,
two and three hours. Msn2, Msn2∆NES, and Msn2A5 levels were analyzed on western blots with an
antiserum directed against Msn2. Kar2 levels served as a loading control. (B) Fluorescence
microscopy visualizing of Msn2∆NES-GFP and Msn2A5-GFP. Both GFP fusion genes were under the
control of the CUP1 promoter and were inspected after 1 hour induction with 50µM Cu2+. (C)
Quantification of Msn2 protein levels. Blots were scanned with ImageQant. Msn2 bands were
normalized with the Kar2 signal. The Msn2 level after copper induction was set to one for each series.
Figure 6. Ethanol stress does not destabilize cytoplasmic Msn2. (A) Msn2 and PKIMsn2 levels
under stress conditions. Strain W303msn2∆msn4∆ was transformed with plasmids carrying a native
MSN2 gene or a PKI-nuclear export signal MSN2 fusion (PKIMSN2) under the control of the CUP1
promoter (pCUP1MSN2, pCUP1-PKIMSN2). CuSO4 was added to a final concentration of 50µM to
exponentially growing cultures for 30 minutes, Cu2+ was removed and 7%v/v Ethanol was added after
the washing step. Samples were taken at the indicated time points for western analysis to determine
the amount of Msn2. (B) Fluorescence microscopy showing the intracellular localization of GFP-
tagged versions of Msn2 and PKIMsn2, respectively, expressed under the control of the ADH1
promoter. Arrow indicates nuclear rim staining of PKIMsn2-GFP. DNA was stained with 2µg/ml DAPI.
Figure 7. The proteasome inhibitor MG132 blocks degradation of nuclear Msn2. (A) Over night
cultures of W303-∆erg6 cells were diluted and grown to an optical density of OD600 = 1. The
proteasome inhibitor MG132 dissolved in DMSO was added to a final concentration of 50µM and
by guest on July 11, 2018http://w
ww
.jbc.org/D
ownloaded from
21
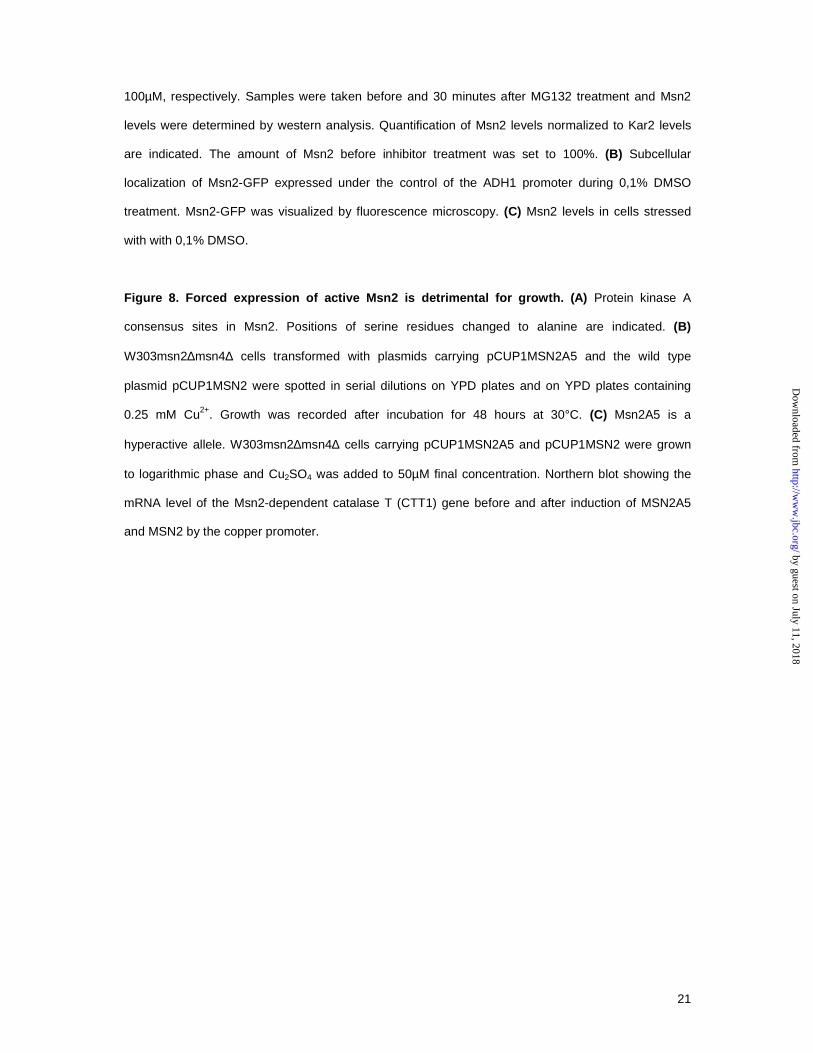
100µM, respectively. Samples were taken before and 30 minutes after MG132 treatment and Msn2
levels were determined by western analysis. Quantification of Msn2 levels normalized to Kar2 levels
are indicated. The amount of Msn2 before inhibitor treatment was set to 100%. (B) Subcellular
localization of Msn2-GFP expressed under the control of the ADH1 promoter during 0,1% DMSO
treatment. Msn2-GFP was visualized by fluorescence microscopy. (C) Msn2 levels in cells stressed
with with 0,1% DMSO.
Figure 8. Forced expression of active Msn2 is detrimental for growth. (A) Protein kinase A
consensus sites in Msn2. Positions of serine residues changed to alanine are indicated. (B)
W303msn2∆msn4∆ cells transformed with plasmids carrying pCUP1MSN2A5 and the wild type
plasmid pCUP1MSN2 were spotted in serial dilutions on YPD plates and on YPD plates containing
0.25 mM Cu2+. Growth was recorded after incubation for 48 hours at 30°C. (C) Msn2A5 is a
hyperactive allele. W303msn2∆msn4∆ cells carrying pCUP1MSN2A5 and pCUP1MSN2 were grown
to logarithmic phase and Cu2SO4 was added to 50µM final concentration. Northern blot showing the
mRNA level of the Msn2-dependent catalase T (CTT1) gene before and after induction of MSN2A5
and MSN2 by the copper promoter.
by guest on July 11, 2018http://w
ww
.jbc.org/D
ownloaded from
22
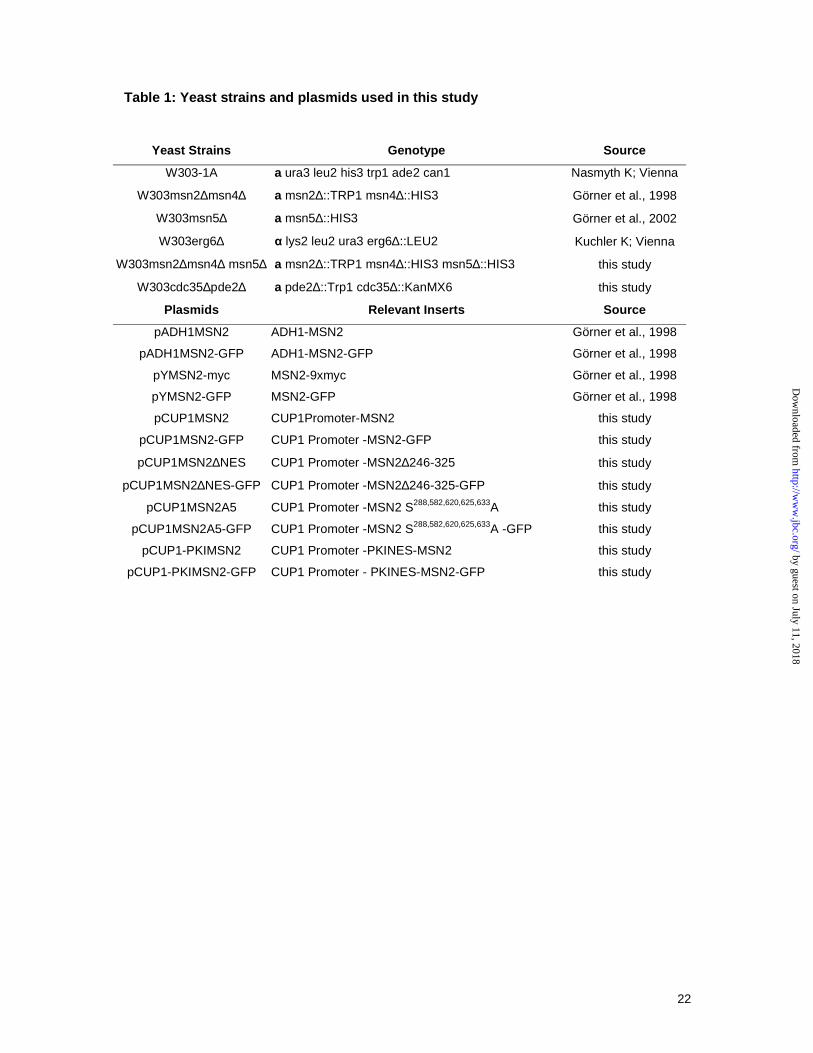
Table 1: Yeast strains and plasmids used in this study
Yeast Strains Genotype Source
W303-1A a ura3 leu2 his3 trp1 ade2 can1 Nasmyth K; Vienna
W303msn2∆msn4∆ a msn2∆::TRP1 msn4∆::HIS3 Görner et al., 1998
W303msn5∆ a msn5∆::HIS3 Görner et al., 2002
W303erg6∆ α lys2 leu2 ura3 erg6∆::LEU2 Kuchler K; Vienna
W303msn2∆msn4∆ msn5∆ a msn2∆::TRP1 msn4∆::HIS3 msn5∆::HIS3 this study
W303cdc35∆pde2∆ a pde2∆::Trp1 cdc35∆::KanMX6 this study
Plasmids Relevant Inserts Source
pADH1MSN2 ADH1-MSN2 Görner et al., 1998
pADH1MSN2-GFP ADH1-MSN2-GFP Görner et al., 1998
pYMSN2-myc MSN2-9xmyc Görner et al., 1998
pYMSN2-GFP MSN2-GFP Görner et al., 1998
pCUP1MSN2 CUP1Promoter-MSN2 this study
pCUP1MSN2-GFP CUP1 Promoter -MSN2-GFP this study
pCUP1MSN2∆NES CUP1 Promoter -MSN2∆246-325 this study
pCUP1MSN2∆NES-GFP CUP1 Promoter -MSN2∆246-325-GFP this study
pCUP1MSN2A5 CUP1 Promoter -MSN2 S288,582,620,625,633A this study
pCUP1MSN2A5-GFP CUP1 Promoter -MSN2 S288,582,620,625,633A -GFP this study
pCUP1-PKIMSN2 CUP1 Promoter -PKINES-MSN2 this study
pCUP1-PKIMSN2-GFP CUP1 Promoter - PKINES-MSN2-GFP this study
by guest on July 11, 2018http://w
ww
.jbc.org/D
ownloaded from
23
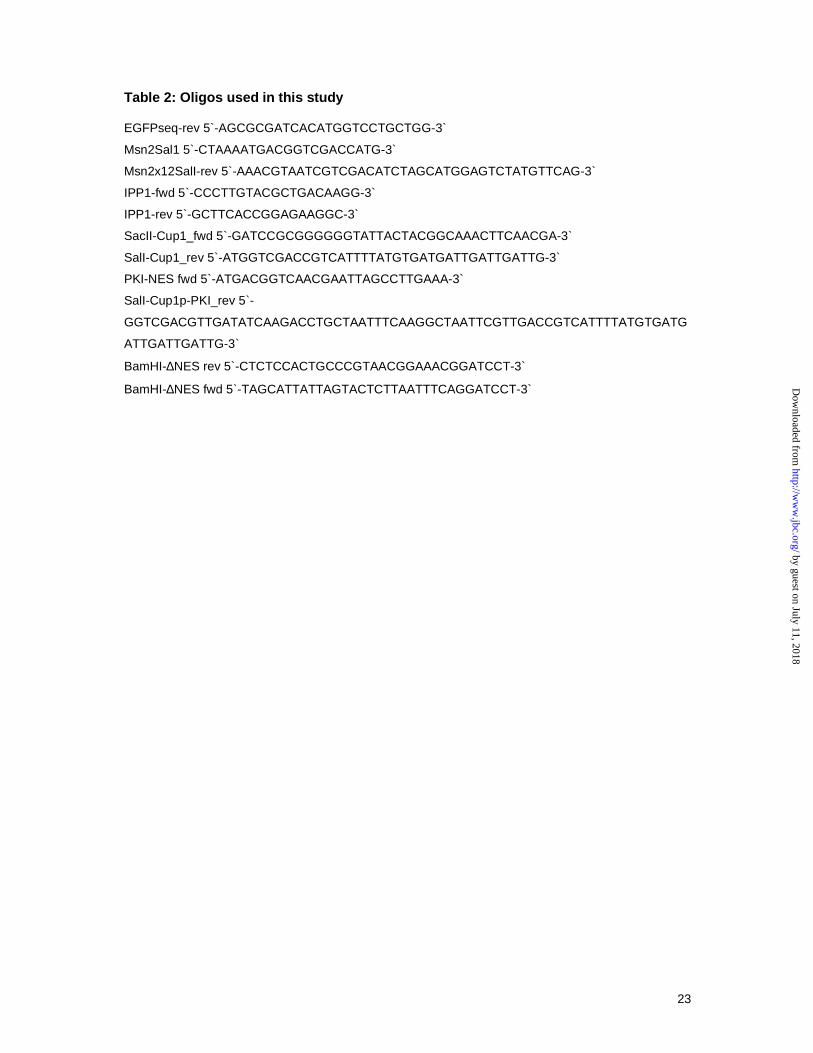
Table 2: Oligos used in this study
EGFPseq-rev 5`-AGCGCGATCACATGGTCCTGCTGG-3`
Msn2Sal1 5`-CTAAAATGACGGTCGACCATG-3`
Msn2x12SalI-rev 5`-AAACGTAATCGTCGACATCTAGCATGGAGTCTATGTTCAG-3`
IPP1-fwd 5`-CCCTTGTACGCTGACAAGG-3`
IPP1-rev 5`-GCTTCACCGGAGAAGGC-3`
SacII-Cup1_fwd 5`-GATCCGCGGGGGGTATTACTACGGCAAACTTCAACGA-3`
SalI-Cup1_rev 5`-ATGGTCGACCGTCATTTTATGTGATGATTGATTGATTG-3`
PKI-NES fwd 5`-ATGACGGTCAACGAATTAGCCTTGAAA-3`
SalI-Cup1p-PKI_rev 5`-
GGTCGACGTTGATATCAAGACCTGCTAATTTCAAGGCTAATTCGTTGACCGTCATTTTATGTGATG
ATTGATTGATTG-3`
BamHI-∆NES rev 5`-CTCTCCACTGCCCGTAACGGAAACGGATCCT-3`
BamHI-∆NES fwd 5`-TAGCATTATTAGTACTCTTAATTTCAGGATCCT-3`
by guest on July 11, 2018http://w
ww
.jbc.org/D
ownloaded from
Erich Durchschlag, Wolfgang Reiter, Gustav Ammerer and Christoph SchullerNuclear localization destabilizes the stress regulated transcription factor Msn2
published online October 22, 2004J. Biol. Chem.
10.1074/jbc.M407264200Access the most updated version of this article at doi:
Alerts:
When a correction for this article is posted•
When this article is cited•
to choose from all of JBC's e-mail alertsClick here
by guest on July 11, 2018http://w
ww
.jbc.org/D
ownloaded from