JBC Papers in Press. Published on May 29, 2012 as ... · PDF fileRegulation of insulin release...
27
1 Regulation of insulin release by leucine and its implication in diabetes Leucine stimulates insulin secretion via down-regulation of surface expression of adrenergic 2A receptor through the mTOR pathway and its implication in new-onset diabetes in renal transplantation Jun Yang 1 , Michael Dolinger 3 , Gabrielle Ritaccio 3 , Joseph Mazurkiewicz 1 , David Conti 4 , Xinjun Zhu 2, 3 *, and Yunfei Huang 1 * Center for Neuropharmacology and Neuroscience 1 , Center for Cardiovascular Science 2 , Division of Gastroenterology Department of Internal Medicine 3 , Department of Transplant Surgery 4 , Albany Medical College, NY, USA, 12208 Running title: Regulation of insulin release by leucine and its implication in diabetes * To whom correspondence should be addressed: Yunfei Huang, MD. PhD, Center for Neuropharmacology and Neuroscience, Albany Medical College, Albany, NY 12208, USA Phone: (518) 262-5873, Fax: (518) 262-5799, E-mail: [email protected]. Xinjun Zhu, MD, Division of Gastroenterology Department of Internal Medicine, Albany Medical College, Albany, NY 12208, USA, Phone: (518) 262-5276, Fax: (518) 262-6470, E-mail: [email protected]. Key Words: Leucine, mTOR, adrenergic receptor, rapamycin, diabetes, transplantation Background: Leucine can stimulate insulin release, but the mechanism has remained unclear. Results: Leucine regulates adrenergic alpha2 receptor trafficking. Rapamycin and clonidine together increase the risk of diabetes. Conclusion: mTOR activation by leucine elicits insulin release via adrenergic alpha2 receptors. Rapamycin and clonidine appear to synergistically facilitate new-onset diabetes. Significance: Our findings may have relevance in the clinical management of renal transplant patients. Summary The amino acid leucine is a potent secretagogue, capable of inducing insulin secretion. It also plays an important role in the regulation of mTOR activity, therefore providing impetus to investigate if a leucine-sensing mechanism in the mTOR pathway is involved in insulin secretion. We found that leucine-induced insulin secretion was inhibited by both the mTOR inhibitor rapamycin as well as the adrenergic 2 receptor agonist clonidine. We also demonstrated that leucine down-regulated the surface expression of adrenergic 2A receptor via activation of the mTOR pathway. Leucine’s stimulatory effect on insulin secretion was attenuated in diabetic Goto- Kakizaki rats that overexpress adrenergic 2A receptors, confirming leucine’s role in insulin secretion. Thus, our data demonstrate that leucine regulates insulin secretion by modulating adrenergic 2 receptors through the mTOR pathway. http://www.jbc.org/cgi/doi/10.1074/jbc.M112.344259 The latest version is at JBC Papers in Press. Published on May 29, 2012 as Manuscript M112.344259 Copyright 2012 by The American Society for Biochemistry and Molecular Biology, Inc. by guest on May 6, 2018 http://www.jbc.org/ Downloaded from
Transcript of JBC Papers in Press. Published on May 29, 2012 as ... · PDF fileRegulation of insulin release...

1
Regulation of insulin release by leucine and its implication in diabetes
Leucine stimulates insulin secretion via down-regulation of surface expression of adrenergic
2A receptor through the mTOR pathway and its implication in new-onset diabetes in renal
transplantation
Jun Yang1, Michael Dolinger
3, Gabrielle Ritaccio
3, Joseph Mazurkiewicz
1, David Conti
4, Xinjun
Zhu2, 3
*, and Yunfei Huang1*
Center for Neuropharmacology and Neuroscience1, Center for Cardiovascular Science
2, Division
of Gastroenterology Department of Internal Medicine3, Department of Transplant Surgery
4,
Albany Medical College, NY, USA, 12208
Running title: Regulation of insulin release by leucine and its implication in diabetes
*To whom correspondence should be addressed: Yunfei Huang, MD. PhD, Center for
Neuropharmacology and Neuroscience, Albany Medical College, Albany, NY 12208, USA
Phone: (518) 262-5873, Fax: (518) 262-5799, E-mail: [email protected]. Xinjun Zhu, MD,
Division of Gastroenterology Department of Internal Medicine, Albany Medical College,
Albany, NY 12208, USA, Phone: (518) 262-5276, Fax: (518) 262-6470, E-mail:
Key Words: Leucine, mTOR, adrenergic receptor, rapamycin, diabetes, transplantation
Background: Leucine can stimulate insulin
release, but the mechanism has remained
unclear.
Results: Leucine regulates adrenergic
alpha2 receptor trafficking. Rapamycin and
clonidine together increase the risk of
diabetes.
Conclusion: mTOR activation by leucine
elicits insulin release via adrenergic alpha2
receptors. Rapamycin and clonidine appear
to synergistically facilitate new-onset
diabetes.
Significance: Our findings may have
relevance in the clinical management of
renal transplant patients.
Summary
The amino acid leucine is a potent
secretagogue, capable of inducing insulin
secretion. It also plays an important role
in the regulation of mTOR activity,
therefore providing impetus to investigate
if a leucine-sensing mechanism in the
mTOR pathway is involved in insulin
secretion. We found that leucine-induced
insulin secretion was inhibited by both
the mTOR inhibitor rapamycin as well as
the adrenergic 2 receptor agonist
clonidine. We also demonstrated that
leucine down-regulated the surface
expression of adrenergic 2A receptor via
activation of the mTOR pathway.
Leucine’s stimulatory effect on insulin
secretion was attenuated in diabetic Goto-
Kakizaki rats that overexpress adrenergic
2A receptors, confirming leucine’s role
in insulin secretion. Thus, our data
demonstrate that leucine regulates insulin
secretion by modulating adrenergic 2
receptors through the mTOR pathway.
http://www.jbc.org/cgi/doi/10.1074/jbc.M112.344259The latest version is at JBC Papers in Press. Published on May 29, 2012 as Manuscript M112.344259
Copyright 2012 by The American Society for Biochemistry and Molecular Biology, Inc.
by guest on May 6, 2018
http://ww
w.jbc.org/
Dow
nloaded from

2
The role of the mTOR pathway in
metabolic homeostasis led us to a second
important finding in this study:
retrospective analysis of clinical data
showed that co-administration of
rapamycin and clonidine was associated
with an increased incidence of new-onset
diabetes in renal transplantation patients
over those receiving rapamycin alone.
We believe that inhibition of mTOR by
rapamycin along with activation of
adrenergic 2 receptors by clonidine
represents a double-hit to pancreatic
islets that synergistically disturbs glucose
homeostasis. This new insight may have
important implications for the clinical
management of renal transplant patients.
Introduction
Protein restriction can negatively influence
glucose homeostasis. Glucose tolerance was
found to be compromised in animals fed a
low-protein diet (1,2). Besides its possible
effect on glucose uptake by skeletal muscle
(2,3), a low-protein diet has been found to
directly impair pancreatic secretion of
insulin in response to glucose (1,4).
Conversely, ingestion of proteins or amino
acids together with carbohydrates leads to
strong insulin secretion in humans and
animal models (2,3,5). Leucine is one of the
most potent insulin secretogues among the
branched-chain amino acids that facilitate
glucose-induced insulin release from
pancreatic -cells (6). The mechanisms by
which leucine exerts its secretagogue effects
vary (7). Leucine can either serve as a fuel
source for ATP production or be converted
to -ketoisocaproate (KIC), a metabolic
intermediate which in turn inhibits KATP
channel activity, leading to membrane
depolarization and triggering insulin
secretion (8,9). Leucine also regulates
insulin release by acting on glutamate
dehydrogenase (6), a key enzyme that fuels
amino acids into the tricarboxylic acid cycle
(10). Additional routes of action include
triggering calcium oscillations in pancreatic
-cells (7,11) and regulating the expression
of some key genes that are critical for
insulin secretion in pancreatic islets (12).
The mammalian target of rapamycin
(mTOR) pathway has recently emerged as a
critical regulator of cellular metabolism in
response to growth factors and nutrients
(13,14). Leucine is a potent stimulator of
mTOR. Depletion of leucine results in
inactivation of mTOR signaling and
additional attenuation of growth factor
signaling (14). In pancreatic -cells, the
mTOR pathway mediates nutrient sensing
and regulates protein synthesis (15,16).
Recent studies demonstrated that inhibition
of mTOR by rapamycin impairs glucose-
induced insulin secretion in pancreatic -
cells (17,18), and the use of rapamycin has
been identified as a risk factor for new onset
of diabetes in organ transplant patients (19).
However, the downstream target of mTOR
on insulin secretion in pancreatic islets
remains enigmatic.
Pancreatic -cells are heavily innervated by
the sympathetic nervous system. Activation
of 2 adrenergic receptors (2ARs),
particularly the2A subunit, negatively
influences glucose-stimulated insulin
secretion (20,21). A recent study revealed
that overexpression of adrenergic 2A
receptor causes type 2 diabetes in a diabetic
mouse model (22). In view of the
implication of the mTOR pathway and
adrenergic 2A receptor in regulating
glucose homeostasis, we have undertaken a
study of these pathways in leucine-induced
acute insulin release in rats and evaluated
their roles in new-onset diabetes in renal
transplant patients.
Materials and Methods
by guest on May 6, 2018
http://ww
w.jbc.org/
Dow
nloaded from

3
Animals. Male rats, including strains of
Sprague–Dawley (SD), Kyoto Wistar and
Goto-Kakizaki (GK), were purchased from
Taconic (Taconic, NY). Rats weighing from
100-150 g were used for glucose tolerance
testing and for preparation of pancreatic
islets. Rats were housed in a room with ad
libitum access to food and water under a 12h
light/dark cycle (lights on 0700 to 1900).
All experiments were performed in
accordance with the National Institutes of
Health guidelines for the care and use of
laboratory animals and were approved by
the Institutional Animal Care and Use
Committee of Albany Medical College.
Amino acid cocktail feeding,
intraperitoneal glucose tolerance tests
(IPGTT) and serum insulin measurement.
The amino acid cocktail (in mg per 100 ml
solution) consists of alanine 390, arginine
490, aspartic acid 900, cysteine 230,
glutamic acid 2860, histidine 360, isoleucine
670, leucine 1210, lysine 1020, methionine
360, phenylalanine 670, proline 1650, serine
770, tryptophan 150, tyrosine 710, valine
800, glycine 270, and threonine 540, which
was derived from a normal rat diet AIN-
93M (TestDiet). Prior to glucose tolerance
testing, rats were habituated to the
experimental procedures by wrapping in a
disposable plastic restraint for 60 min and
orally gavaging with 3 ml distilled water
daily for 6 days. After overnight fasting,
rats were gavaged at 10.8 ml/kg body weight
with an amino acid cocktail lacking leucine.
Twenty min later, rats were given glucose
(1.5 g/kg) either with or without leucine
(131mg/kg) in 0.9% NaCl by intraperitoneal
injection. In some experiments, rats were
treated with rapamycin (Tecoland) at 3
mg/kg via i.p. 40 min before being fed the
amino acid cocktail. Blood samples were
collected via the tail vein before and 15, 30,
45 and 60 min after glucose challenge, and
blood glucose was measured using a
Truetrack glucometer (Nipro Diagnostics,
Inc,FL). To measure the insulin level, blood
samples were collected from the tail vein
before and 5, 15 and 30 min after glucose
challenge. The serum samples were isolated
by centrifugation and temporarily stored at -
80°C. The serum insulin levels were
determined by using an Ultra Sensitive
Mouse Insulin ELISA kit (Crystal Chem).
Pancreatic islet preparation and in vitro
insulin release assay Pancreatic islets
were isolated by collagenase digestion from
Sprague–Dawley (SD), Kyoto Wistar and
Goto-Kakizaki (GK) rats. Briefly, rats were
anesthetized by pentobarbital and the bile
duct was surgically exposed. Collagenase
solution (0.5 mg/ml) was freshly made by
dissolving collagenase XI (Sigma) in Hanks’
solution (Invitrogen) and then slowly
injected into the pancreas via the bile duct.
The pancreas was then removed and further
digested in collagenase solution by
incubation at 37 oC for an additional 15 min.
The digested pancreas was filtered through a
wet 70-μm cell strainer and washed in
Hanks’ balanced salts solution without
calcium chloride (Sigma). Individual islets
were handpicked under a stereomicroscope
and incubated in a 5% CO2 incubator at 37
°C in RPMI 1640 medium supplemented
with 2.05 mM L-glutamine, 10% fetal
bovine serum (FBS) and penicillin (100
U/ml)/ streptomycin (100 μg/ml). Purity of
the islet preparations was verified by
dithizone staining. The insulin release assay
was performed using static incubations.
Briefly, batches of 10 size-matched islets
were first incubated at 37 °C for 1 h in a
modified neural basal (NB) medium (23)
containing all nutrients except glucose and
leucine. Islets were then treated with
clonidine (1 M), yohimbine (10 M), or
rapamycin (0.2 M) for 20 min, followed by
adding leucine (0.8 mM) and glucose (16.7
mM). After 30 min of incubation, the
medium was sampled for insulin assay. An
aliquot of medium collected before the
by guest on May 6, 2018
http://ww
w.jbc.org/
Dow
nloaded from

4
addition of glucose served as a background
sample.
Plasmid construction A human
adrenergic alpha 2A receptor cDNA clone
was purchased from Open Biosystems. The
α2A AR-mCherry construct was generated by
subcloning a full-length alpha 2A receptor
coding region into pmCherry-N1vector
(Clontech) using the restriction enzymes
NheI and BamHI. A DNA fragment
encoding α2AAR was amplified by PCR
using the forward primer:
CTAGCTAGCCGCCACCATGTTCCGCC
AGGAGCAGCC and the reverse primer:
CGGGATCCTCACACGATCCGCTTCCT.
Plasmids DsRed-Rab5 WT, eGFP-arrestin3
and clathrin-Lca-ECFP were purchased from
Addgene. The Rab5-GFP plasmid was
generated by inserting a Rab5 DNA
fragment into the BglII and XhoI sites of
peGFP-C1.
Co-immunoprecipitation The effect of
leucine on complex formation between
α2AAR and arrestin3 (β-arrestin2) was
assessed by a co-immunoprecipitation
strategy modified from a previously
described method (24). Briefly, HEK 293T
cells were transiently transfected with
plasmids encoding eGFP- arrestin3 and
α2AAR-mCherry (Addgene) using
Lipofectamine 2000 (Invitrogen) and grown
at 37oC for 24-36 h. The cells were first
starved in leucine minus medium for 1 h and
then replenished with 0.8 mM leucine for 5
or 10 min. Cells were lysed in buffer
containing 20 mM HEPES, 0.5% Nonidet P-
40, 10% glycerol, 2 mM EDTA, and
protease inhibitors. The lysate preparations
were then subjected to immunoprecipitation
using anti-DsRed antibody (Clontech) at
1:200 dilution. This antibody specifically
recognizes mCherry, but not eGFP. eGFP-
tagged arrestin3 and α2AAR-mCherry were
detected by anti-β arrestin (Cell Signaling)
and anti- α2A AR (Novus Biologicals)
antibodies.
Laser scanning confocal microscopy and
total internal reflection fluorescence
microscopy (TIR-FM) image acquisition
Quantitative analysis of leucine-stimulated
α2A AR trafficking was done with live cells
imaged by confocal scanning microscopy.
HEK-293T cells were grown on sterilized
glass coverslips and transiently transfected
with α2A AR-mcherry and Rab5-EGFP
plasmids. Prior to living imaging, cells
were starved in leucine-minus NB medium
for at least 1 h. In some experiments, cells
were also pretreated with rapamycin for 20
min before being loaded in an Attofluor cell
chamber (Molecular Probes) for analysis.
Z-series images of the cells were collected
with a laser scanning confocal microscope
(Zeiss Meta 510) using a PlanApo ×60, 1.4
NA oil-immersion objective lens. Images
were acquired immediately before and 2.5, 5
and 10 min after addition of leucine to a
final concentration of 0.8 mM.
Colocalization of α2AAR-mcherry and Rab5-
EGFP was analyzed by using Zeiss LSM
image software.
TIR-FM was performed at 37°C using a
Zeiss TIRF system. HEK-293T cells were
transiently transfected with α2AAR-mcherry
and clathrin-Lca-ECFP a day before the
experiment. The cells were incubated in
leucine-minus NB medium for at least 1 h
prior to being loaded into the recording
chamber. Images were acquired
immediately before and 1, 2, 5, 10 min after
addition of leucine to a final concentration
0.8 mM. The depth of the TIRF field was
set at 80 nm. Colocalization of clathrin and
α2AAR was analyzed using the NIH Image J
program.
by guest on May 6, 2018
http://ww
w.jbc.org/
Dow
nloaded from

5
Surface biotinylation assay HEK293T or
islet cells were first incubated at 37 °C in
leucine-minus medium for 1 h. Cells were
then treated with 0.2 M rapamycin or
vehicle for 5 min, followed by addition of
leucine for 20 min. Afterwards, the cells
were kept at 4oC for 30 min to stop
membrane protein trafficking. After
removal of the medium, the cells were
rinsed with ice-cold PBS twice and then
incubated in sulfo-NHS-SS-Biotin buffer
(0.8 mM) at 4oC for 1 h. Biotinylation was
stopped by adding a quenching solution
(TBS: 25 mM Tris, 0.15M sodium chloride).
The cells were then washed three times with
cold PBS and lysed in ice-cold lysis buffer
(25 mM Tris, pH 7.4; 150 mM NaCl; 1 mM
EDTA; protease inhibitor cocktail; 1%
Triton X-100) for 30 min, followed by a
brief sonication. Insoluble cell debris was
removed by centrifugation at 10,000 g for 5
min at 4oC. The supernatant was mixed with
immobilized NeutrAvidin™ Gel at 4oC for 2
h. After washing 5 times, the samples were
boiled in sample loading buffer and resolved
by SDS PAGE. The surface biotinylation
assay in islets was performed essentially as
above. Briefly, islets were starved in
leucine-minus medium for 1 h followed by
addition of leucine to a final concentration
0.8 mM. Islets were treated with sulfo-
NHS-SS-Biotin buffer (0.8 mM) either
immediately before or 5 and 10 min after
replenishing the leucine.
Western blot HEK 293T cells or pancreatic
islets were starved in for 1 h in neural basal
medium lacking leucine, then treated with
0.2 M rapamycin or vehicle for 5 min,
followed by addition of leucine (0.8 mM).
After incubation at 37 °C for an additional
20 min, the medium was removed and cells
were lysed in 2× SDS sample buffer and
heated at 95 °C for 5 min. The protein
samples were resolved by SDS PAGE and
then transferred onto a nitrocellulose
membrane. Anti-S6, anti-p70, anti-phospho-
S6, anti-phospho- p70(Thr389) and anti-
GAPDH antibodies were purchased from
Cell Signaling Technology, and anti-GFP
from Biovision.
cAMP assay HEK293T cells were plated in
6-well plates, transiently transfected with
2AAR, and allowed to grow overnight at
37oC. Cells were then starved in leucine-
minus neural basal medium for 1 h at 37oC,
and harvested by dissociation from plates
using non-enzymatic cell dissociation
solution [0.48 mM EDTA and 0.5 mM
phosphodiesterase inhibitor 3-isobutyl-1-
methylxanthine (IBMX) in the absence of
leucine]. Afterwards, the cells were
resuspended at a concentration of 4×10⁶
cells/ml and aliquoted in a volume of 10 l
into a 96-well plate. Cells were then treated
with various concentrations of clonidine
either in the presence or absence of 0.8 mM
leucine for 30 min at room temperature.
cAMP was measured using a LANCE
cAMP kit (Perkin Elmer) and Victor 3V
(Perkin Elmer) plate reader following the
manufacturers’ instructions. cAMP
concentrations were determined by using a
standard curve.
Renal transplant patients chart review A
retrospective chart review was approved by
the Institutional Review Board (IRB) on
Human Subjects Committee at Albany
Medical College (AMC). Charts were
systematically reviewed for all recipients
who received renal transplantation at AMC
during 2005-2010. Clinical data reviewed
included entire history, laboratory tests and
medications before and up to two years after
transplantation. Those recipients with a
prior history of diabetes were excluded.
New-onset diabetes after transplantation
(NODAT) was defined according to the
criteria set by the American Diabetes
Association/World Health Organization.
by guest on May 6, 2018
http://ww
w.jbc.org/
Dow
nloaded from

6
Specifically, the diagnosis was based on
preprandial blood glucose levels exceeding
126 mg/dL at least in two separate
measurements. We noticed that blood
glucose levels were unstable during the
perioperative period. Thus, NODAT was
defined as sustained abnormal high glucose
(exceeding 126 mg/dL) that occurred three
months following renal transplantation.
Statistical analysis Data were analyzed
using Prism GraphPad software. NODAT
incidence was determined by Chi-square
testing, with a p value less than 0.05
considered statistically significant. Other
tests, including student’s t-test and ANOVA,
were also used as indicated either in the
results section or in the figure legends.
Results
Leucine stimulates insulin secretion and
reduces blood glucose via the mTOR
pathway
Starved SD rats were first gavaged with an
amino acid cocktail including all amino
acids except leucine prior to a glucose
tolerance test. Twenty minutes after gavage,
they were challenged with 1.5 g/kg glucose
either with or without leucine (131 mg/kg
body weight) via i.p. injection as indicated
in Fig 1A. We observed that blood glucose
levels in the rats given both glucose and
leucine were consistently lower at all time-
points than control rats that received glucose
only, with a statistically significant
difference at 45 min (137.33 + 8.63 for
leucine-plus versus 200.22 + 10.17 for
leucine-minus in mg/dL) (Fig 1B).
Conversely, blood insulin levels were higher
in rats given leucine than that in control rats,
with a statistically significant difference at
15 min (0.67+ 0.11 for leucine-plus versus
0.38+ 0.12 for leucine-minus in ng/dL) (Fig
1C). These data suggest that leucine
stimulates insulin secretion and lowers
blood glucose. To determine if leucine-
induced insulin release involves the mTOR
pathway, we treated rats with rapamycin (3
mg/kg) 40 min prior to the glucose tolerance
test (Fig 1D). At all time points monitored,
we found no difference in blood glucose
levels between rats that received either
leucine or vehicle. Therefore, rapamycin
almost completely abolished the leucine-
induced insulin release (Fig 1E and 1F).
We also monitored blood glucose and
insulin levels in rats that did not receive a
glucose challenge (Fig 1G); both
measurements remained steady and at low
levels over the course of the experiment (Fig
1H and 1I) regardless of whether the rats
were given leucine or vehicle, suggesting
that the impact of animal handling on insulin
release and thus blood glucose levels is
minimal.
Besides its actions in pancreatic islet -cells,
leucine and the mTOR pathway could
indirectly influence insulin secretion and
glucose homeostasis by exerting influence
on other organ systems such as the liver and
muscles. To confirm that the effect we
observed of leucine and rapamycin on
insulin release in vivo involves a direct
action on pancreatic -cells, we performed
an insulin release assay on pancreatic islets
isolated from SD rats. Of note, in vitro
insulin release assays reported in previous
studies were carried out in Krebs buffer
containing a high concentration of leucine
(up to 20 mM) but lacking other amino acids
(25,26). Conceivably, depletion of other
amino acids could perturb the metabolic
route in islets and force leucine to enter the
TCA cycle. Thus, we performed all insulin
release assays under physiological
conditions in the presence of all other amino
acids along with leucine at 0.8 mM, a
standard concentration in regular cell culture
media. Under such conditions, we found
that leucine alone was able to stimulate
insulin release by 1.7- fold (Fig 2).
by guest on May 6, 2018
http://ww
w.jbc.org/
Dow
nloaded from

7
Similarly, glucose itself stimulated insulin
release by 2.4- fold. However, leucine and
glucose together elicited a much larger
increase in insulin release, by approximately
4.5- fold, suggesting an additive effect on
insulin release by leucine and glucose. To
determine if leucine regulates insulin release
through the mTOR pathway, we included
0.2 M rapamycin in the assay 20 min prior
to performing the in vitro insulin release
assay (Fig 2). Rapamycin almost
completely suppressed insulin release under
all assay conditions, including the presence
of leucine or glucose or both. These data
suggest that the mTOR pathway is involved
in leucine-induced insulin release in addition
to its role in glucose-induced insulin release
(17).
2AR activation attenuates the response
of pancreatic islets to leucine
It is well documented that inhibition of
2ARs stimulates insulin secretion (20,21).
To test if the secretagogue effect of leucine
involves 2ARs, we treated islets with an
2AR antagonist, yohimbine, at 10 M. We
found that yohimbine stimulated insulin
release to a level comparable to that induced
by either glucose or leucine (Fig 2),
suggesting that 2AR regulates insulin
secretion of pancreatic islets. Yohimbine
also slightly enhanced (26%) glucose-
induced insulin release. However, it had
little, if any, further effect on insulin release
elicited by leucine or by a combination of
leucine and glucose (Fig 2). To ascertain
that leucine-induced insulin release involves
2ARs, we treated the islets with the 2AR
agonist clonidine. We found that clonidine
markedly suppressed insulin release
triggered by either glucose or leucine, or
both (Fig 2).
Leucine regulates 2AR trafficking via
the mTOR pathway
Having demonstrated that leucine-induced
insulin release is blocked by the 2AR
agonist clonidine, we asked how 2ARs
could influence the leucine-induced release
of insulin. As receptor trafficking between
the plasma surface and intracellular
compartments is an important point of
regulation of 2ARs, we hypothesized that
leucine could exert its stimulatory effect on
insulin release by regulating 2AR
trafficking. Previous studies revealed that
2AR internalization involves clathrin-
coated pits (24). We transiently transfected
2AAR, the major subtype in regulating
insulin release (22,27), into HEK293T cells
in which its expression is low, along with
clathrin-CFP. We monitored 2AR
internalization using total internal reflection
fluorescent microscopy (TIRF). Under the
condition of leucine depletion, about 40%
2AR-mCherry puncta were colocalized
with clathrin-CFP (green) (Fig 3A). Within
1-2 min following the addition of leucine,
we observed a noticeable increase in
colocalization of 2AR-mCherry and
clathrin, indicating that leucine stimulates
the formation of new clathrin-coated pits
(Fig 3A). The effect peaked within 5-10
min after addition of leucine (Fig 3A and
3B). Furthermore, the number of 2AR-
mCherry (red) puncta was reduced in the
TIRF field (Fig 3A), suggesting that 2AR
was internalized. A recent study reported
that 2AR internalization is regulated by
arrestin-dependent clathrin-mediated
endocytosis (24). To determine if arrestin is
involved in the internalization of 2AR, we
performed a co-immunoprecipitation assay
in HEK293Tcells coexpressing eGFP-
arrestin3 and 2AR-mCherry (red). We
employed an mCherry-specific antibody to
pull down 2AR complex and then
monitored the level of associated arrestin3
using anti-arrestin3 antibody. We observed
by guest on May 6, 2018
http://ww
w.jbc.org/
Dow
nloaded from

8
an increased amount of arrestin3 associated
with 2AR in the presence of leucine.
Replenishing leucine activates mTOR. To
determine if the effect of leucine involves
activation of mTOR, we treated HEK293T
cells with 200 nM rapamycin 20 min before
leucine stimulation. We found that the
effect of leucine on colocalization of 2AR
and clathrin was largely inhibited (Fig 3D
and 3E). To further confirm if the 2AR
puncta that disappeared from the TIRF field
following leucine stimulation were
internalized, we utilized confocal
microscopy to trace 2AR subcellular
localization in HEK293T cells transiently
transfected with 2AR-mCherry along with
Rab5-GFP, an early endosome marker. We
observed an increased amount of
colocalization of 2AR-mCherry and Rab5-
GFP (Fig 4A and 4B), indicating that 2AR
is internalized and concentrated in the
endosomal compartment. Again, the effect
of leucine was blocked by rapamycin (Fig
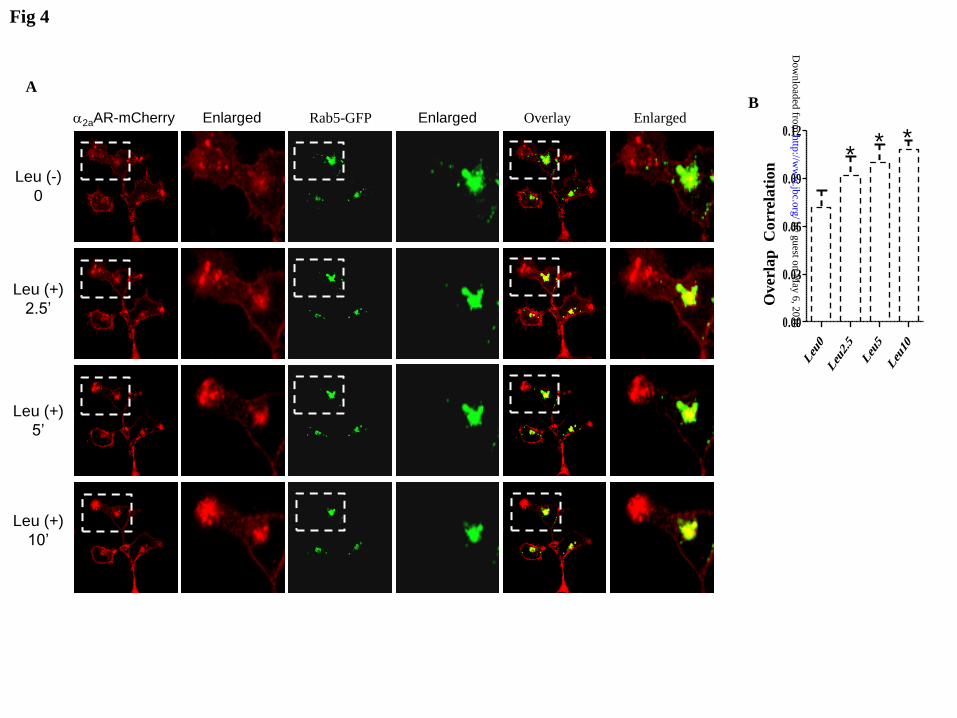
4C and 4D), suggesting that mTOR is
involved in 2AR internalization.
To further confirm that leucine reduces the
surface expression of 2ARs, we performed
a surface biotinylation assay in HEK293T
cells transiently transfected with 2AAR.
We found a marked decrease in surface
expression of 2AAR by 45.1% (Fig 5A and
5B) 20 min after leucine stimulation.
However, it had little effect on the surface
expression of glycosylphosphatidyl-inositol
(GPI) -anchored GFP, a membrane-bound
target protein that was co-expressed in
HEK293T cells and that served as a control
for the surface biotinylation assay (Fig 5A).
To test if leucine regulates 2AAR
trafficking through the mTOR pathway, we
treated HEK293T cells with rapamycin 5
min prior to the assay. We observed that
rapamycin led to a marked increase in
surface expression of 2AAR and averted the
down-regulation of surface 2AAR induced
by leucine (Fig 5C and 5D). Apparently,
the effect of leucine on 2AAR surface
expression inversely correlates with mTOR
activity, as indicated in Fig 5E-5G wherein
the phosphorylation of p70 and S6 induced
by leucine was largely inhibited by
rapamycin. To confirm if the down-
regulation of surface 2AAR by leucine
observed in HEK293T cells reflects its
action in pancreatic islets, we repeated the
assay using pancreatic islets prepared from
SD rats. As anticipated, we observed a
similar effect from leucine treatment, which
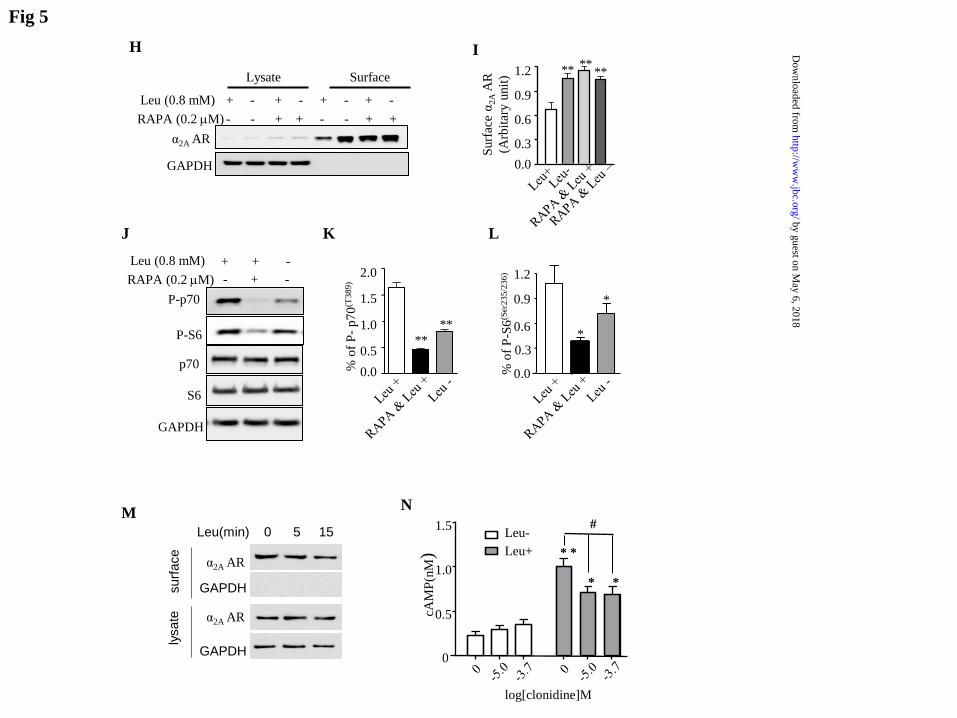
was prevented by rapamycin (Fig 5H and
5I). This effect was also accompanied by a
change in phosphorylation of p70 and S6
(Fig 5J-5L). We also performed the surface
biotinylation assay in islets at 5 and 15 min
after leucine addition. A noticeable effect
on the surface level of 2AAR occurred as
early as 5 min after leucine stimulation (Fig
5M). Taken together, these data strongly
suggest that leucine down-regulates the
surface expression of 2AAR in pancreatic
islets through activation of mTOR.
2ARs are coupled to Gi -protein, with their
activation reducing cAMP production.
Because leucine reduces the surface
expression of 2AAR, we asked if leucine
regulates cAMP production in HEK293T
cells expressing 2AR. In the absence of
leucine, the level of cAMP was low and was
not affected by clonidine (Fig 5N). This
suggests that 2AARs are tonically activated
in HEK293T cells. The addition of leucine
to the medium markedly augmented the
level of cAMP. Clonidine at 10 M and 200
M was able to suppress cAMP production
induced by leucine by 29.0% and 31.4%,
respectively (P< 0.05) (Fig 5N).
Impaired pancreatic response to leucine
in GK rats
by guest on May 6, 2018
http://ww
w.jbc.org/
Dow
nloaded from

9
A recent study revealed that overexpression
of 2AAR in GK rats is responsible for
impaired insulin release and glucose
intolerance (22). Accordingly, we employed
this diabetic model to test the involvement
of 2AAR in leucine-induced insulin release.
We compared the leucine-stimulated insulin
release in GK to that in the genetically
matched Wistar control rats. While leucine
effectively stimulated insulin secretion in
Wistar rats by 155.3%, 93.6%, and 87.8% at
5, 15, and 30 min, respectively, after
challenge with glucose (Fig 6B) it had a
modest effect in GK rats, with a 59.3%
increase seen only at 30 min (Fig 6D).
Blood glucose levels were also significantly
lower in the presence of leucine compared to
those in the absence of leucine in Wistar
control rats at 30 min (181.00 + 7.92 in
leucine-plus versus 212.73 + 12.66 in
leucine-minus, in mg/dL) (Fig 6C) and at 45
min (151.62 + 8.06 in leucine-plus versus
179.10 + 13.14 in leucine-minus, in mg/dL).
However, we observed only a transient
decrease in blood glucose in GK rats at 30
min (345.13 + 42.11 in leucine-plus versus
484.00 + 35.05 in leucine-minus, in mg/dL)
(Fig 6E). These data suggest that the
stimulatory effect of leucine on insulin
release is compromised in GK rats. Western
blot confirmed that islets from GK rats
express more 2AAR concurrent with an
increased amount of surface 2AAR (Fig
6F). To confirm if this observation indicates
a poor response of pancreatic -cells to
leucine in GK rats, we performed an in vitro
insulin release assay in pancreatic islets
isolated from both GK and Wistar rats. We
observed that glucose effectively stimulated
insulin release from pancreatic islets
prepared from Wistar rats (2.05 + 0.10 fold
increase), but it had a very modest effect on
pancreatic islets from GK rats (1.02 + 0.06)
(Fig 4G), which is consistent with previous
studies (22). Likewise, leucine- and
leucine/glucose-induced insulin release were
significantly less in GK islets than in Wistar
islets (1.2+0.08 and 2.22+0.11; 2.37 + 0.08
and 2.98 + 0.24, respectively). Yohimbine
also became less potent in the stimulation of
insulin release elicited by leucine and
glucose in GK islets than in Wistar islets (2.
1.82+0.15 and 2.82+0.15; 2. 27 + 0.09 and
2.66 + 0.08, respectively).
New-onset diabetes in renal transplant
patients treated with rapamycin and
clonidine
The findings just described suggested to us
the need to evaluate their clinical
significance, as both rapamycin and
clonidine are frequently used in the
management of renal transplant patients.
The remainder of this paper deals with the
potential clinical application of these
findings. New-onset diabetes mellitus is
frequently observed in patients following
solid organ transplantation and is known to
be associated with the administration of
immunosuppressants, including rapamycin
(also called sirolimus) and FK506 (also
called tacrolimus) (19,28-31). Intriguingly,
most transplant patients also develop high
blood pressure (32) and require additional
anti-hypertensive therapy. Clonidine is
sometimes used in an antihypertensive drug
regimen as it has less impact on blood flow
to the kidney. We therefore expected that at
least a portion of renal transplant patients
could have been treated by both rapamycin
and clonidine, which would allow an
opportunity to determine if concomitant
exposure to rapamycin and clonidine has a
synergistic impact on the development of
new-onset diabetes after transplantation
(NODAT) in humans. We performed a
retrospective chart review of the incidence
of NODAT in renal transplant recipients
who were treated with rapamycin. Of the
287 recipients reviewed, 207 had a previous
by guest on May 6, 2018
http://ww
w.jbc.org/
Dow
nloaded from

10
history of glucose abnormalities prior to
renal transplantation and were excluded
from further analysis. In the remaining 80
patients who received a standard
immunosuppressive regimen including
rapamycin, tacrolimus and mycophenolate
mofetil, we found that 31 developed
diabetes (fasting blood glucose level of >
126 mg/dL). Thus in this population the
overall incidence of NODAT is about
38.75%, which is comparable to the
incidence levels reported in recent studies
(19,30,31). We also found that 21 patients
within this group also received clonidine for
hypertension treatment following renal
transplantation (rapamycin
/tacrolimus/mycophenolate mofetil
/clonidine), in which 15 patients (71.4%)
developed NODAT. In contrast, among 59
patients (rapamycin
/tacrolimus/mycophenolate mofetil) without
exposure to clonidine, only 16 (27.1%)
developed NODAT (Fig 7 A). Therefore
the incidence of NODAT in renal transplant
patients who received rapamycin and
clonidine (rapamycin
/tacrolimus/mycophenolate mofetil
/clonidine) was significantly higher than in
those who did not (rapamycin
/tacrolimus/mycophenolate mofetil) (P=
0.025, Chi-square test, two-sided). These
data suggest that the combination of
rapamycin and clonidine significantly
increases the risk of diabetes. We also
analyzed 45 renal transplant patients who
were not treated with rapamcycin. Eighteen
patients had a history of diabetes and were
excluded from this study. In the remaining
27 patients, we found only 4 patients who
received clonidine treatment
(tacrolimus/mycophenolate mofetil
/clonidine), but none of them developed
new-onset diabetes. However, in the 23
patients who were not treated with clonidine
(tacrolimus/mycophenolate mofetil), 7
developed NODAT (Fig 7B). As
hypertension in this setting is generally
thought to be associated with the use of
rapamycin (32), the less frequent use of
clonidine we observed in the non-
rapamycin-treated group perhaps reflects the
low incidence of hypertension.
Methylprednisolone was also prescribed in
some patients to reduce rejection reactions.
As it is a corticosteroid, conceivably, it
could be a confounding factor of NODAT.
We found that only a very small portion of
patients in the rapamycin group (rapamycin
/tacrolimus/mycophenolate mofetil /
methylprednisolone) were additionally
treated with methylprednisolone.
Apparently, methylprednisolone does not
significantly contribute to the incidence of
NODAT caused by the combination of
rapamycin and clonidine in the present study
(Fig 7C and 7D).
Discussion
Most well-documented mechanisms by
which leucine stimulates insulin release
involve metabolic pathways, including those
producing the metabolic intermediate KIC
or facilitating ATP production (6,8-10). In
the present study, we found that leucine also
regulates pancreatic insulin release through
the mTOR pathway and 2AR. This finding
has additionally led us to identify co-
administration of rapamycin and clonidine
as a risk factor for new-onset diabetes in
renal transplant patients.
Pancreatic -cells are innervated by the
peripheral sympathetic nervous system,
which mediates acute regulation of blood
glucose under stress conditions. Although
2BAR is also expressed in the pancreatic
islets, 2AAR is the major subtype in
regulating insulin release (27). Previous
studies revealed that activation of 2AAR by
either electric stimulation or norepinephrine
inhibits insulin secretion, which is likely
by guest on May 6, 2018
http://ww
w.jbc.org/
Dow
nloaded from

11
through inhibition of cAMP production (33).
The role of the 2AAR in regulating
pancreatic function and glucose homeostasis
was further cemented by a recent genetic
study revealing that overexpression of
2AAR causes impaired insulin granule
membrane docking and secretion in -cells
in the diabetic GK rat (22). In the present
study, we found that leucine down-regulates
membrane surface 2AAR and increases
cAMP production, thus revealing a novel
route regulating insulin release by leucine-
sensing mTOR signaling. Additional lines
of evidence that support the involvement of
2AAR in leucine-induced insulin release
include compromised insulin release in vivo
as well as in vitro in pancreatic islets
prepared from diabetic GK rats
overexpressing 2AAR. These observations
are also consistent with a previous study
showing poor response of insulin release to
leucine in pancreatic islets prepared from the
GK rat (34). We also observed that, in the
absence of leucine, the 2AR agonist
clonidine has little, if any, effect on cAMP
production. This suggests that 2AAR is
already tonically activated under a basal
condition. Consistent with this notion, we
also observed that the 2AAR antagonist
yohimbine stimulates insulin release in
pancreatic islets. This was also reported by
previous studies (22). We observed that
rapamycin posseses an inhibitory effect on
glucose-stimulated insulin release even in
the absence of leucine. Similarly, the
2AAR inhibitor clonidine also inhibits
glucose-induced insulin release in the
absence of leucine. A possible
interpretation would be that rapamycin may
have a stronger effect on 2AAR than does
leucine depletion. Alternatively, besides
attenuating leucine-induced internalization
of 2AAR, rapamycin may regulate glucose-
induced insulin release involving an
additional mechanism.
The membrane trafficking of 2AARs is one
of principal mechanisms of regulating
receptor activity (35,36). We found that
leucine reduces the surface expression of
2AAR via activation of mTOR, suggesting
a new pathway for nutrient sensing in
pancreatic islets. However, the detailed
cellular processes by which leucine
regulates 2AAR membrane trafficking
remain to be elucidated. A recent study
revealed that leucine can elicit a transient
rise in intracellular calcium, resulting in
activation of the class III lipid kinase Vps34
and the mTOR complex 1 (37).
Interestingly, leucine also induces calcium
oscillation in pancreatic islets as well, which
is thought to be a critical step in regulating
insulin granule docking and membrane
fusion (7). Because Vps34 is known to
regulate receptor vesicle recycling (38 56),
conceivably it could be a candidate that
regulates 2AAR trafficking. Of particular
note, glucose stimulates insulin release in
part by depolarizing beta cells and thus
resulting in Ca2+
influx (7,11). It will be
interesting to know if the Ca2+
transient
elicited by leucine involves a similar
mechanism, for example via electrogenic
amino acid transporters (39). Because
leucine and glucose together have a
synergistic effect on insulin release, they
likely act through different mechanisms.
New-onset diabetes has been increasingly
recognized as a complication associated
with organ transplantation, which creates
additional challenges for patient care and
likely generates significant negative impacts
on long-term patient survival following
organ transplantation (40). Recent clinical
studies revealed that NODAT is strongly
associated with immunosuppressive
medications (40), in which rapamycin is one
of the major risk factors (19). We found that
inhibition of mTOR by rapamycin increases
the surface level of 2AAR. This result led
by guest on May 6, 2018
http://ww
w.jbc.org/
Dow
nloaded from

12
us to hypothesize that exposure to clonidine
in addition to rapamycin could lead to
stronger activation of 2AAR, consequently
generating a greater negative impact on
blood glucose homeostasis. Indeed, the
incidence of NODAT is significantly higher
in patients treated with both rapamycin and
clonidine than those just receiving
rapamycin alone. Therefore, our data
suggest that administration of both
rapamycin and clonidine could represent a
double-hit that contributes to the high
incidence of NODAT in renal transplant
patients.
In the 27 renal transplant patients who were
not treated with rapamycin, only 4 patients
were treated with clonidine, but none of
them developed NODAT. While we
acknowledge that the interpretability is
constrained by the small number of cases,
this observation tends to suggest that
clonidine itself, without rapamycin, has a
minimal effect on NODAT. Moreover, it is
also in line with previous studies reporting
that 2AR agonists such as clonidine have
very limited effect on blood glucose in
humans (41 ), which is perhaps due to a
general attenuation of adrenergic input into
the pancreas because of its additional effect
on sympathetic output (42). Nevertheless,
the overall high incidence of NODAT we
observed in the renal transplant recipients
more likely reflects a joint effect from
rapamycin and clonidine.
Methylprednisolone was also prescribed in a
small portion of renal transplant patients;
apparently it has no significant effect on
NODAT in the present study.
In summary, our study suggests that amino
acids influence pancreatic function and
glucose homeostasis in part through2AR.
Additionally, we found a significant high
risk of NODAT in transplant patients
undergoing treatment with both rapamycin
and clonidine. This finding is of particular
importance because hypertension has been a
pressing issue in renal transplant patients
(32) and clonidine has been considered as a
favorable option for hypertension control.
Our data suggest that clonidine should be
prescribed with precaution in renal
transplant patients who are undergoing
treatment with rapamycin.
References Cited
1. Reis, M. A., Carneiro, E. M., Mello, M. A., Boschero, A. C., Saad, M. J., and Velloso, L. A.
(1997) The Journal of nutrition 127, 403-410
2. van Loon, L. J., Saris, W. H., Verhagen, H., and Wagenmakers, A. J. (2000) The American
journal of clinical nutrition 72, 96-105
3. Bernard, J. R., Liao, Y. H., Hara, D., Ding, Z., Chen, C. Y., Nelson, J. L., and Ivy, J. L. (2011)
American journal of physiology. Endocrinology and metabolism 300, E752-760
4. Floyd, J. C., Jr., Fajans, S. S., Conn, J. W., Thiffault, C., Knopf, R. F., and Guntsche, E. (1968)
The Journal of clinical endocrinology and metabolism 28, 266-276
5. Kalogeropoulou, D., Lafave, L., Schweim, K., Gannon, M. C., and Nuttall, F. Q. (2008)
Metabolism: clinical and experimental 57, 1747-1752
6. Hutton, J. C., Sener, A., and Malaisse, W. J. (1980) The Journal of biological chemistry 255,
7340-7346
7. Malaisse, W. J., Hutton, J. C., Carpinelli, A. R., Herchuelz, A., and Sener, A. (1980) Diabetes 29,
431-437
8. Branstrom, R., Efendic, S., Berggren, P. O., and Larsson, O. (1998) The Journal of biological
chemistry 273, 14113-14118
by guest on May 6, 2018
http://ww
w.jbc.org/
Dow
nloaded from

13
9. Gao, Z., Young, R. A., Li, G., Najafi, H., Buettger, C., Sukumvanich, S. S., Wong, R. K., Wolf,
B. A., and Matschinsky, F. M. (2003) Endocrinology 144, 1949-1957
10. Li, C., Najafi, H., Daikhin, Y., Nissim, I. B., Collins, H. W., Yudkoff, M., Matschinsky, F. M.,
and Stanley, C. A. (2003) The Journal of biological chemistry 278, 2853-2858
11. Jonkers, F. C., and Henquin, J. C. (2001) Diabetes 50, 540-550
12. Yang, J., Chi, Y., Burkhardt, B. R., Guan, Y., and Wolf, B. A. (2010) Nutrition reviews 68, 270-
279
13. Sarbassov, D. D., Ali, S. M., and Sabatini, D. M. (2005) Current opinion in cell biology 17, 596-
603
14. Avruch, J., Long, X., Ortiz-Vega, S., Rapley, J., Papageorgiou, A., and Dai, N. (2009) American
journal of physiology 296, E592-602
15. Kwon, G., Marshall, C. A., Pappan, K. L., Remedi, M. S., and McDaniel, M. L. (2004) Diabetes
53 Suppl 3, S225-232
16. Gleason, C. E., Lu, D., Witters, L. A., Newgard, C. B., and Birnbaum, M. J. (2007) The Journal
of biological chemistry 282, 10341-10351
17. Fraenkel, M., Ketzinel-Gilad, M., Ariav, Y., Pappo, O., Karaca, M., Castel, J., Berthault, M. F.,
Magnan, C., Cerasi, E., Kaiser, N., and Leibowitz, G. (2008) Diabetes 57, 945-957
18. Shimodahira, M., Fujimoto, S., Mukai, E., Nakamura, Y., Nishi, Y., Sasaki, M., Sato, Y., Sato,
H., Hosokawa, M., Nagashima, K., Seino, Y., and Inagaki, N. (2010) The Journal of
endocrinology 204, 37-46
19. Gyurus, E., Kaposztas, Z., and Kahan, B. D. (2011) Transplant Proc 43, 1583-1592
20. DiTullio, N. W., Cieslinski, L., Matthews, W. D., and Storer, B. (1984) The Journal of
pharmacology and experimental therapeutics 228, 168-173
21. Devedjian, J. C., Pujol, A., Cayla, C., George, M., Casellas, A., Paris, H., and Bosch, F. (2000)
Diabetologia 43, 899-906
22. Rosengren, A. H., Jokubka, R., Tojjar, D., Granhall, C., Hansson, O., Li, D. Q., Nagaraj, V.,
Reinbothe, T. M., Tuncel, J., Eliasson, L., Groop, L., Rorsman, P., Salehi, A., Lyssenko, V.,
Luthman, H., and Renstrom, E. (2010) Science (New York, N.Y 327, 217-220
23. Brewer, G. J., Torricelli, J. R., Evege, E. K., and Price, P. J. (1993) J Neurosci Res 35, 567-576
24. Cottingham, C., Chen, Y., Jiao, K., and Wang, Q. (2011) The Journal of biological chemistry
286, 36063-36075
25. Milner, R. D. (1970) The Journal of endocrinology 47, 347-356
26. MacDonald, M. J., McKenzie, D. I., Kaysen, J. H., Walker, T. M., Moran, S. M., Fahien, L. A.,
and Towle, H. C. (1991) The Journal of biological chemistry 266, 1335-1340
27. Peterhoff, M., Sieg, A., Brede, M., Chao, C. M., Hein, L., and Ullrich, S. (2003) European
journal of endocrinology / European Federation of Endocrine Societies 149, 343-350
28. Friedman, E. A., Shyh, T. P., Beyer, M. M., Manis, T., and Butt, K. M. (1985) Am J Nephrol 5,
196-202
29. Kasiske, B. L., Snyder, J. J., Gilbertson, D., and Matas, A. J. (2003) Am J Transplant 3, 178-185
30. Johnston, O., Rose, C. L., Webster, A. C., and Gill, J. S. (2008) J Am Soc Nephrol 19, 1411-1418
31. Sharif, A., and Baboolal, K. Nat Rev Nephrol 6, 415-423
32. Mangray, M., and Vella, J. P. (2011) Am J Kidney Dis 57, 331-341
33. Ahren, B. (2000) Diabetologia 43, 393-410
34. Giroix, M. H., Saulnier, C., and Portha, B. (1999) Diabetologia 42, 965-977
35. Saunders, C., and Limbird, L. E. (1999) Pharmacology & therapeutics 84, 193-205
36. Hall, R. A., and Lefkowitz, R. J. (2002) Circulation research 91, 672-680
37. Gulati, P., Gaspers, L. D., Dann, S. G., Joaquin, M., Nobukuni, T., Natt, F., Kozma, S. C.,
Thomas, A. P., and Thomas, G. (2008) Cell metabolism 7, 456-465
38. Stack, J. H., Horazdovsky, B., and Emr, S. D. (1995) Annual review of cell and developmental
biology 11, 1-33
by guest on May 6, 2018
http://ww
w.jbc.org/
Dow
nloaded from

14
39. Smith, P. A., Sakura, H., Coles, B., Gummerson, N., Proks, P., and Ashcroft, F. M. (1997) The
Journal of physiology 499 ( Pt 3), 625-635
40. Kaposztas, Z., Gyurus, E., and Kahan, B. D. (2011) Transplant Proc 43, 1375-1394
41. Guthrie, G. P., Jr., Miller, R. E., Kotchen, T. A., and Koenig, S. H. (1983) Clin Pharmacol Ther
34, 713-717
42. Fagerholm, V., Haaparanta, M., and Scheinin, M. (2011) Basic Clin Pharmacol Toxicol 108, 365-
370
Acknowledgement: This work was funded
by grants from the National Institute of
Neurological Disorders and Strokes
NS062068 (Y.H.) and the National Institute
of Diabetes and Digestive and Kidney
Diseases K08DK088950 (X. Z.).
Figure legends:
Figure 1 Leucine enhances insulin release and lowers blood glucose. Schematic diagrams
showing the order of drug treatment, feeding of amino acid cocktail, glucose challenge and blood
sampling in three experimental paradigms (A,D,G). (B) Intraperitoneal glucose tolerance test
(IPGTT). Blood glucose levels in the presence (Leu (+)) or absence (Leu (-)) of leucine (131
mg/kg) via i.p. injection. (C) Insulin measurements. Blood samples were collected as indicated
for measurements of glucose (E) and insulin (F). Blood glucose (H) and insulin (I) without
glucose challenge. Data are presented as means + SEM (N=4-7). * and ** indicate p<0.05 or
0.01, respectively (ANOVA test).
Figure 2 Stimulatory effect of leucine on insulin release from pancreatic islets. Insulin release
from pancreatic islets in the presence of leucine (0.8 mM), glucose (16.7 mM), rapamycin
(RAPA) (0.2 M), yohimbine (Yoh) (10 M), and clonidine (Clo) (1 M) either individually or
as a combination as indicated. Data are presented as means + SEM (N=4-6). * and ** indicate
p<0.05 or 0.01, respectively, between the test group and the control (ANOVA test).
Figure 3 Leucine stimulates colocalization of α2AAR and clathrin. Surface α2AAR -mCherry
and clathrin-ECFP were monitored by multichannel TIRF immediately before and 1, 2, 5, 10 min
after addition of leucine in HEK293T cells (A) or in cells pretreated with 200 nM rapamycin (E).
Quantification of colocalization of α2AAR-mCherry and clathrin-ECFP (B, D). Data are
presented as means + SE (n=8-11). * indicates p< 0.05 (ANOVA). Co-immunoprecipitation
assay monitoring complex formation between α2AAR and arrestin 3 in HEK293 cells 5 and 10
min after stimulation with 800μM (C). α2A AR-mChery and GFP-arrestin3 were detected by
anti-DsRed and anti-arrestin antibodies respectively. The experiment was repeated once with
similar results.
Figure 4 Leucine stimulates α2AAR endocytosis in HEK293T cells. HEK293T cells were
transiently transfected with α2AAR-mCherry and Rab5-EGFP. Time-lapses of confocal images
were acquired immediately before and 2.5, 5, 10 min after leucine addition in the absence (A) or
presence of rapamycin (C). Quantification of overlap correlation between Rab5 and α2AAR in the
by guest on May 6, 2018
http://ww
w.jbc.org/
Dow
nloaded from

15
absence (B) or presence of rapamycin (D). Data are presented as means + SE (n=5-7). *
indicates p< 0.05(ANOVA) .
Figure 5 Leucine reduces membrane α2AAR and increases cAMP production. HEK293T cells
were transiently transfected with α2AAR and GPI-GFP and incubated in a medium with leucine
(Leu(+)) or without leucine (Leu(-)). Surface α2AAR was evaluated by surface biotinylation
assay (A) and quantified (B). ** indicates p<0.01 (t test). Rapamycin blocks leucine-induced
reduction in surface expression of α2AAR in HEK293 cells (C) and quantification (D). **
indicates p<0.01 (ANOVA). Leucine reduces surface expression of α2AAR in pancreatic islets,
which was blocked by rapamycin (H), and quantification (I). Leucine stimulates
phosphorylation of p70 and S6, which was inhibited by rapamycin in HEK293T cells (E, F, & G)
and in pancreatic islets (J, K, & L). Surface biotinylation assay on surface expression of α2AAR
5 and 15 min after addition of leucine (M). Leucine stimulates accumulation of cAMP in
HEK293 cells overexpressing α2AAR (N) in the absence or presence of clonidine at a
concentration of 10 or 200 M. Data are presented as means + SEM.** and * indicate p<0.01
and p< 0.05 respectively (N=12) (ANOVA ) between leucine-plus and their leucine-minus
control. The symbol # indicates that clonidine significantly reduces cAMP production at p< 0.05
(ANOVA).
Figure 6 Schematic diagram showing the order of treatments in Wistar and GK rats (A). Insulin
(B & D) and glucose (C & E) measurements from blood samples collected from Wistar control
or GK rats immediately before and 5, 15, and 30 min after glucose challenge. Data are presented
as means + SEM. The symbol * indicates p<0.05 between leucine-plus and -minus groups (N=4-
8, ANOVA). (F) Total and surface levels of α2AAR in islets prepared from Wistar and GK rats.
(G) Pancreatic islets isolated from Wistar or GK rats were incubated in media in the presence of
glucose (16.7 mM), leucine (0.8 mM), yohimbine (10 M), or rapamycin (0.2 M) either
individually or in a combination as indicated. The symbol ** indicates p< 0.01 between the test
and control groups. The symbol ## indicates p< 0.01 between pancreatic islet preparations from
Wistar and GK rats (N=3-7).
Figure 7 (A) Significant increase in NODAT in renal transplant patients treated with both
rapamycin and clonidine. After excluding those with a prior history of diabetes, the remaining
renal transplant patients who received immunosuppressive regimens [rapamycin (RAPA),
tacrolimus (TRL) and mycophenolate mofetil (MMF)] were assigned to two groups, either with
or without clonidine treatment. The table indicates gender ratio, average age, and the total
number of patients who had fasting blood glucose levels over 126 mg/dL in each group. The
symbol * indicates p < 0.05 between two groups (Chi-square test). (B) Renal transplantation
recipients who received immunosuppressive regimens [tacrolimus (TRL) and mycophenolate
mofetil (MMF)] and with or without clonidine. (C) Renal transplantation recipients who
received immunosuppressive regimens [rapamycin (RAPA), tacrolimus (TRL), mycophenolate
(MP) and mycophenolate mofetil (MMF)] and with or without clonidine. (D) Renal
transplantation recipients who received immunosuppressive regimens [tacrolimus (TRL) and
mycophenolate mofetil (MMF)] and with or without mycophenolate. (E) A proposed model
showing how rapamycin and clonidine synergistically increase the incidence of NODAT.
Inhibition of mTOR by rapamycin increases surface expression of 2AR, which leads to stronger
activation of 2AR by its agonist clonidine, thereby interfering with glucose homeostasis.
by guest on May 6, 2018
http://ww
w.jbc.org/
Dow
nloaded from

Fig 1
Starvation
16hs
Glucose or
glucose with leu AA cocktail
without leu
20'
A
B
C
E
F
H
I
0 10 20 30
0.0
0.2
0.4
0.6
0.8
Time(min)
Ser
um
Insu
lin (
ng/m
l)
RAPA & Leu + RAPA & Leu -
0 20 40 60 0
60
120
180
240
Time (min)
Pla
sma
Glu
cose
(m
g/d
l)
0 10 20 30 0.0
0.2
0.4
0.6
0.8 Leu +
Leu -
Time(min)
Ser
um
Insu
lin (
ng/m
l) **
0.00
0.25
0.50
0.75
1.00
0 10 20 30 Time (min)
Ser
um
Iin
suli
n (
ng/m
l) RAPA & Leu +
RAPA & Leu -
**
0 20 40 60 0
60
120
180
240
Time (min)
Pla
sma
Glu
cose
(m
g/d
l)
0 20 40 60 0
60
120
180
240
Time(min)
Pla
sma
Glu
cose
(m
g/d
l)
Starvation
16hs
Glucose or
glucose with leu
20'
D
Starvation
16hs
Leu/Veh
20'
G
40'
RAPA
Leu +
Leu - Leu +
Leu -
Leu +
Leu -
AA cocktail
without leu
AA cocktail
without leu
by guest on May 6, 2018
http://ww
w.jbc.org/
Dow
nloaded from

Fo
ld i
ncr
ease
of
in
suli
n r
elea
se
**
0.0
1.5
3.0
4.5
6.0
*
*
*
**
P>0.05
P>0.05
*
* *
Fig 2
by guest on May 6, 2018
http://ww
w.jbc.org/
Dow
nloaded from

2’ 5’
Cla
thrin
-GF
P
1’ 10’
a2
aA
R-m
Ch
err
y
Ove
rlay
En
larg
ed
0’
Fig 3
A
Leu 0.8 mM
0
20
40
60
80
100
% o
f co
localiz
ation
of
a2
aA
R a
nd
cla
thrin
Total
lysate
EGFP-arrestin
IP: mcherry
Leu (min) - 5 10
a2aAR-mCherry
EGFP-arrestin
a2aAR-mCherry
B
C
* *
*
by guest on May 6, 2018
http://ww
w.jbc.org/
Dow
nloaded from

Cla
thrin
-GF
P
a2
aA
R-m
Ch
err
y
Ove
rla
y
En
larg
ed
Leu 0.8 mM 2’ 5’ 1’ 10’ 0’
Rapa 200 nM
D
E
Fig 3
0
10
20
30
40
% o
f co
localiz
ation
of
a2
aA
R a
nd
cla
thrin
by guest on May 6, 2018
http://ww
w.jbc.org/
Dow
nloaded from
Rab5-GFP Overlay a2aAR-mCherry Enlarged Enlarged Enlarged
Leu (-)
0
Leu (+)
5’
Leu (+)
2.5’
Leu (+)
10’
Over
lap
C
orr
elati
on
Leu
0
Leu
2.5
Leu
5
Leu
10
0.00
0.03
0.06
0.09
0.12
A B
Fig 4
* * *
by guest on May 6, 2018
http://ww
w.jbc.org/
Dow
nloaded from

Rab5-GFP Overlay a2aAR-mCherry Enlarged Enlarged Enlarged
Leu (-)
RAPA (+)
0
Leu (+)
RAPA (+)
5’
Leu (+)
RAPA (+)
2.5’
Leu (+)
RAPA (+)
10’
Over
lap
C
orr
elati
on
Leu
0+Rap
a
Leu
2.5+
Rap
a
Leu
5+Rap
a
Leu
10+Rap
a
0.00
0.02
0.04
0.06
0.08
0.10
C D
Fig 4
by guest on May 6, 2018
http://ww
w.jbc.org/
Dow
nloaded from

A
+ - + -
Lysate Surface
α2A AR
GAPDH
GPI-GFP
Leu (0.8 mM)
Fig 5
3.2
0.0
0.8
1.6
2.4
Surf
ace α
2A
AR
(Arb
itar
y u
nit
)
**
B
C
α2A AR
GAPDH
RAPA (0.2 mM)
Leu (0.8 mM)
- - + + - - + +
+ - + - + - + -
Lysate Surface
Surf
ace α
2A
AR
(Arb
itar
y u
nit
)
0.0
0.6
1.2
1.8
2.4
** ** **
D
P-p70
p70
P-S6
S6
GAPDH
- + -
+ + - RAPA(0.2 mM)
Leu (0.8 mM)
% o
f P
- p
70
(T3
89
)
1.6
0.0
0.4
0.8
1.2
**
**
% o
f P
-S6
(Ser
23
5/2
36
)
*
0.0
0.3
0.6
0.9
1.2
*
E F G
by guest on May 6, 2018
http://ww
w.jbc.org/
Dow
nloaded from
H
Fig 5
RAPA (0.2 mM)
Leu (0.8 mM)
- - + + - - + +
+ - + - + - + -
Lysate Surface
α2A AR
GAPDH
Surf
ace α
2A
AR
(Arb
itar
y u
nit
)
0.0
0.3
0.6
0.9
1.2 ** ** **
J
I
- + -
+ + -
RAPA (0.2 mM)
Leu (0.8 mM)
P-p70
p70
P-S6
S6
GAPDH
*
0.0
0.3
0.6
0.9
1.2
*
% o
f P
-S6
(Ser
235/2
36)
0.0
0.5
1.0
1.5
2.0
**
**
% o
f P
- p
70
(T389)
0
0.5
1.0
1.5 Leu-
Leu+
log[clonidine]M
cAM
P(n
M)
* *
* *
#
K L
N
surf
ace
ly
sate
α2A AR
GAPDH
α2A AR
Leu(min) 0 5 15
GAPDH
M
by guest on May 6, 2018
http://ww
w.jbc.org/
Dow
nloaded from

Fig 6
Pla
sma
Glu
cose
(m
g/d
l)
0 20 40 60 0
150
300
450
600
Time (min)
*
GK
Leu +
Leu -
E
G
D
0 10 20 30 0.0
0.4
0.8
1.2
Time(min)
Ser
um
Insu
lin (
ng/m
l)
GK Leu +
Leu -
*
C
0 20 40 60 0
60
120
180
240
Time (min)
Pla
sma
Glu
cose
(m
g/d
l) *
Wistar
Leu +
Leu -
*
B
0 10 20 30 0.0
0.3
0.6
0.9
1.2
Time(min)
Ser
um
Insu
lin (
ng/m
l)
* *
Wistar Leu +
Leu -
*
A
Starvation
16hs
Glucose or glucose
with leu
20'
AA cocktail
without leu
Anti-GAPDH
Anti- α2A AR
W GK W GK
Lysate Surface
0
1
2
3
4
Fold
incr
ease
of
insu
lin r
elea
se
Wistar
GK
** **
** **
**
** ** **
# # # # # # # # # #
F
by guest on May 6, 2018
http://ww
w.jbc.org/
Dow
nloaded from

RAPA/TRL/MMF RAPA/TRL/MMF/Clonidine
Total patients 59 21
Male/Female 38/21 12/9
Average of age 50.07 49.43
Glucose >126 mg/dl 16 15
Incidence of diabetes 27.1% 71.4%*
Fig 7
A
TRL/MMF TRL/MMF/Clonidine
Total patients 23 4
Male/Female 12/11 4/0
Average of age 48.12 38.25
Glucose >126 mg/dl 7 0
Incidence of diabetes 30.4% 0
B
by guest on May 6, 2018
http://ww
w.jbc.org/
Dow
nloaded from

Fig 7
RAPA/TRL/MMF/MP RAPA/TRL/MMF/MP/Clonidine
Total patients 3 3
Male/Female 1/2 2/1
Average of age 52.67 41.67
Glucose >126 mg/dl 0 3
Incidence of
diabetes 0 100%
C
D
TRL/MMF TRL/MMF//MP
Total patients 11 15
Male/Female 6/5 9/6
Average of age 49.36 46.92
Glucose >126
mg/dl 3 4
Incidence of
diabetes 27.3% 26.7%
mTOR
a2AAR
Leucine
Insulin release
Rapamycin
Clonidine
E
Yohimbine
by guest on May 6, 2018
http://ww
w.jbc.org/
Dow
nloaded from

Xinjun Zhu and Yunfei HuangJun Yang, Micheal Dolinger, Gabrielle Ritaccio, Joseph Mazurkiewicz, David Conti,
new-onset diabetes in renal transplantationadrenergic alpha 2A receptor through the mTOR pathway and its implication in Leucine stimulates insulin secretion via down-regulation of surface expression of
published online May 29, 2012J. Biol. Chem.
10.1074/jbc.M112.344259Access the most updated version of this article at doi:
Alerts:
When a correction for this article is posted•
When this article is cited•
to choose from all of JBC's e-mail alertsClick here
by guest on May 6, 2018
http://ww
w.jbc.org/
Dow
nloaded from