JB Hi-Fi Limited...JB HI-FI LIMITED PAGE 8 Group Highlights • Sales up 3.9% to $4.0bn with...
37
PAGE 1 15 AUGUST 2016 PAGE 1 15 AUGUST 2016 10 FEBRUARY 2020 JB Hi-Fi Limited HY20 Results Presentation For personal use only
Transcript of JB Hi-Fi Limited...JB HI-FI LIMITED PAGE 8 Group Highlights • Sales up 3.9% to $4.0bn with...

PAGE 115 AUGUST 2016 PAGE 115 AUGUST 201610 FEBRUARY 2020
JB Hi-Fi LimitedHY20 Results Presentation
For
per
sona
l use
onl
y

PAGE 2JB HI-FI LIMITED
▪ Group overview
▪ JB HI-FI Australia and JB HI-FI New Zealand
▪ The Good Guys
▪ Group Balance Sheet and Cash Flow
▪ Group FY20 Trading Update and Outlook
▪ Investment Checklist
Richard Murray Nick Wells
Group CEO Group CFO
Agenda
For
per
sona
l use
onl
y

PAGE 315 AUGUST 2016 PAGE 315 AUGUST 201610 FEBRUARY 2020
Group Overview
For
per
sona
l use
onl
y

PAGE 4JB HI-FI LIMITED
Group Model
Strong position with a young tech-
savvy demographic
Product offeringLeading retailer of technology and
consumer electronics
Leading retailer of home appliances
and consumer electronics
Target customer base /
demographic
Strong position with home-making
families and Gen X demographics
Value proposition Best brands at low prices
Customer focusExceptional customer service provided by passionate, knowledgeable team
members
Multi-channel In-store, online, commercial
leveraging a Group support function and underpinned by 5 unique competitive advantages
Scale
1Low Cost Operating
Model
2Quality Store
Locations
3Supplier
Partnerships
4Multichannel
Capability
5
Two iconic Australian retail brands
For
per
sona
l use
onl
y

PAGE 5JB HI-FI LIMITED
Group Model
ScaleLow Cost
Operating Model
Quality Store
Locations
Supplier
Partnerships
Multichannel
Capability
• #1 player in Australian
market with opportunity
for further consolidation
• Global supplier relevance
• Spread investments
across a large base and
drive efficiencies
JB HI-FI
• Major shopping centres,
CBD, homemaker centres,
airports
• High foot traffic and
convenient locations
The Good Guys
• Leading homemaker
centres and standalones
• Destination locations, easily
accessible
• Strong partnerships with all
major suppliers, both locally
and globally
• Store locations and high
traffic websites provide
suppliers with high visibility
for their product
• Knowledgeable team
members assist to inform
the customer of product
benefits
• Dual brand retail approach
provides:
• Ranging and
merchandising optionality
• Ability to execute strategic
initiatives at scale
• Integrated, high quality in-
store and online offer that
provides customers with
choice on how to transact
with us
• Store network provides:
• Fast online fulfillment, via
delivery from store or click
and collect
• Online customers with
after sales service and
support
• National Commercial
business supporting
corporate, government and
education customers
1 2 3 4 5
Underpinned by 5 unique competitive advantages
1 Source: JBH FY19 Sales and CODB and other market leading companies’ data as reported in their most
recent full year result translated to AUD.
15.5%18.0%
25.0%
21.4%
15.4%
24.6%
17.1% 17.0%
JBH M Video FNACDarty
Gome DixonsCarphone
YamadaDenki
Ceconomy Best Buy
CODB1
• Low CODB relative to retail
peers driven by:
• Productive floor space
with high sales per square
metre
• Continued focus on
productivity and
minimising unnecessary
expenditure
• Enabler for maintaining low
prices (gross margins of
~21.5%) and responding to
market prices
7.1 7.612.2 13.7
20.2 21.7
35.0
63.5
JBH M Video FNACDarty
Gome DixonsCarphone
YamadaDenki
Ceconomy Best Buy
Sales AUD($bn)1
For
per
sona
l use
onl
y

PAGE 6JB HI-FI LIMITED
Group HY20 Performance
HY20 HY20 HY19
(Statutory) (Pre AASB 16) (Pre AASB 16)
Total sales ($m) 3,995.2 3,995.2 3,843.7 151.5 3.9% ▲
Earnings before interest and tax ($m) 263.0 255.6 236.6 19.0 8.0% ▲
Net profit after tax ($m) 170.6 174.4 160.1 14.3 8.9% ▲
Earnings per share (basic ¢) 148.5 151.8 139.4 +12 cps 8.9% ▲
Dividend per share (¢) 99.0 99.0 91.0 +8 cps 8.8% ▲
AUD(Pre AASB 16)
Growth
HY20 Group Performance
▪ The Statutory results for HY20 reflect the adoption of the new Accounting Standard AASB 16 Leases. The Group has adopted AASB 16
using the modified retrospective approach and, as a result, prior period comparatives have not been restated. To allow for prior period
comparison, all HY20 results disclosed in this presentation are pre application of AASB 16 (“Pre AASB 16”) and exclude the impact of
AASB 16. Refer Appendix I for reconciliations of Statutory and Pre AASB 16 results
For
per
sona
l use
onl
y

PAGE 7JB HI-FI LIMITED
Group HY20 Performance
HY20 HY19
(Pre AASB 16) (Pre AASB 16) $m %
Sales ($m)
- JB HI-FI Australia 2,722.4 2,591.3 131.1 5.1% ▲
- JB HI-FI New Zealand (NZD) 132.8 131.8 1.0 0.8% ▲
- The Good Guys 1,147.5 1,130.7 16.8 1.5% ▲
Total Sales (AUDm) 3,995.2 3,843.7 151.5 3.9% ▲
EBIT ($m)
- JB HI-FI Australia 204.5 191.9 12.6 6.5% ▲
- JB HI-FI New Zealand (NZD) 1.1 1.1 (0.0) (2.4%) ▼
- The Good Guys 50.1 43.7 6.4 14.7% ▲
Total EBIT (AUDm) 255.6 236.6 19.0 8.0% ▲
EBIT Margin (%)
- JB HI-FI Australia 7.51% 7.41% +10 bps ▲
- JB HI-FI New Zealand 0.83% 0.86% (3 bps) ▼
- The Good Guys 4.36% 3.86% +50 bps ▲
Total EBIT Margin (%) 6.40% 6.16% +24 bps ▲
Growth (Pre AASB 16)1
1 HY20 results exclude the impact of AASB 16. Refer Appendix I for reconciliations of Statutory and Pre application AASB 16 results
HY20 Divisional Performance
For
per
sona
l use
onl
y

PAGE 8JB HI-FI LIMITED
Group Highlights
• Sales up 3.9% to $4.0bn with positive comparable sales growth
across all three divisions
• Pre AASB16 EBIT up 8.0% to $255.6m with strong growth in
earnings and record results for both JB HI-FI Australia and The
Good Guys
• Pre AASB16 NPAT up 8.9% to $174.4m (Statutory NPAT up
6.6% to $170.6m)
• Pre AASB 16 EPS up 8.9% to 151.8cps
• Dividend per share of 99.0cps, up 8.8%, representing
approximately 65% of Pre AASB 16 NPAT
• Sustainability policy implemented - our commitment to
having a positive impact on our people, our environment
and our community
• New combined Support Office completed enabling the
sharing of best practice whilst maintaining individual brand
DNA
• Established Group IT and Group HR functions
• Launched Group entry level TV offer FFALCON with strong
adoption from customers and staff
• Commenced consolidation of 18 Bulky Goods DC’s into 7
Group Home Delivery Centres with Sydney transitioned in
September and Melbourne and Brisbane underway
• Continued expansion of our Group Commercial businesses
product and service offering
• Supporting the communities and wildlife impacted by the
bushfires with over $560,000 in contributions from the
Group, our team members and customers
Group HY20 Financial achievements1 Group Operational achievements
1 HY20 results exclude the impact of AASB 16. Refer Appendix I for reconciliations of Statutory and Pre application AASB 16 results
For
per
sona
l use
onl
y

PAGE 915 AUGUST 2016 PAGE 915 AUGUST 201610 FEBRUARY 2020
JB HI-FI Australia and New Zealand
For
per
sona
l use
onl
y

PAGE 10JB HI-FI LIMITED
HY20 HY19
(Pre AASB 16) (Pre AASB 16)
Sales ($m) 2,722.4 2,591.3 5.1% ▲
Gross Profit ($m) 600.8 573.6 4.8% ▲
Gross Margin (%) 22.07% 22.13% (6 bps) ▼
Cost of Doing Business (%) 13.86% 13.96% (10 bps) ▼`
EBITDA ($m) 223.5 211.8 5.5% ▲
EBITDA Margin (%) 8.21% 8.17% +4 bps ▲
EBIT ($m) 204.5 191.9 6.5% ▲
EBIT Margin (%) 7.51% 7.41% +10 bps ▲
Stores (#) 199 196 +3 stores ▲
AUDGrowth
(Pre AASB 16)
JB Hi-Fi Australia HY20 Performance
1 HY20 results exclude the impact of AASB 16. Refer Appendix I for reconciliations of Statutory and Pre application AASB 16 results
2 As at 30 June 2019
1
2
For
per
sona
l use
onl
y

PAGE 11JB HI-FI LIMITED
JB Hi-Fi Australia HY20 Performance
▪ Total sales grew by 5.1% to $2.72 billion, with comparable sales up
4.4%. Sales momentum has been strong through the half, but it
was pleasing to deliver 4.8% comparable sales growth in the key
Christmas quarter
▪ Hardware and Services1 sales were up 7.8%, with comparable
sales up 7.0% driven by the Communications, Audio, Computers,
Visual and Accessories categories
▪ Software sales were down 18.2% with comparable sales down
17.9% as a result of continued declines in the Movies and Music
categories, and a significant decline in the Games Software
category as we cycled strong new release titles in the pcp.
Software sales were 8.3% of total sales (HY19: 10.6%)
▪ Online sales grew 18.3% (HY19: 21.0%) to $170.8 million or 6.3%
of total sales (HY19: 5.6%), as we continue to invest in and evolve
our Online offer
▪ The Commercial business recorded strong sales growth as we
continue to expand our product and service offering
1 Hardware & Services is defined as all sales excluding the Movies, Music and Games Software categories
4.7%
5.3%5.1%
3.7%
4.8%4.4%
Q1 Q2 H1
Total
Comp
Sales Growth
HY20 Sales
For
per
sona
l use
onl
y

PAGE 12JB HI-FI LIMITED
▪ We are a sales led organisation with a focus on growing top line sales
and gross profit dollars. HY20 Gross profit increased by 4.8% to $600.8
million whilst gross margin was down 6 bps at 22.1%, driven by:
▪ sales mix, as we manage the decline in higher margin software
categories and an acceleration of growth in low margin brands
and categories. This was particularly evident in Q2 as we saw
strong growth in Communications and Apple branded product;
and
▪ price investment to reinforce our market leadership
▪ CODB was 13.9%, down 10 bps. CODB in absolute terms grew 4.3%.
Our low CODB is a key competitive advantage and is maintained
through our continued focus on productivity, minimising unnecessary
expenditure and leveraging our scale
▪ EBITDA grew 5.5% driven by sales growth and cost control
▪ Depreciation declined by 4.4% as we continue to manage our
investment in the store network
▪ EBIT was up 6.5% to $204.5 million with EBIT margin up 10 bps to 7.5%
1 HY20 results exclude the impact of AASB 16. Refer Appendix I for reconciliations of Statutory and Pre application AASB 16 results
HY20 Earnings1
JB Hi-Fi Australia HY20 Performance
$439m$497m
$545m $574m $601m
HY16 HY17 HY18 HY19 HY20
Gross Profit
$136m$166m
$184m $192m $204m
HY16 HY17 HY18 HY19 HY20
EBIT $
(Pre AASB 16)1
For
per
sona
l use
onl
y
PAGE 13JB HI-FI LIMITED
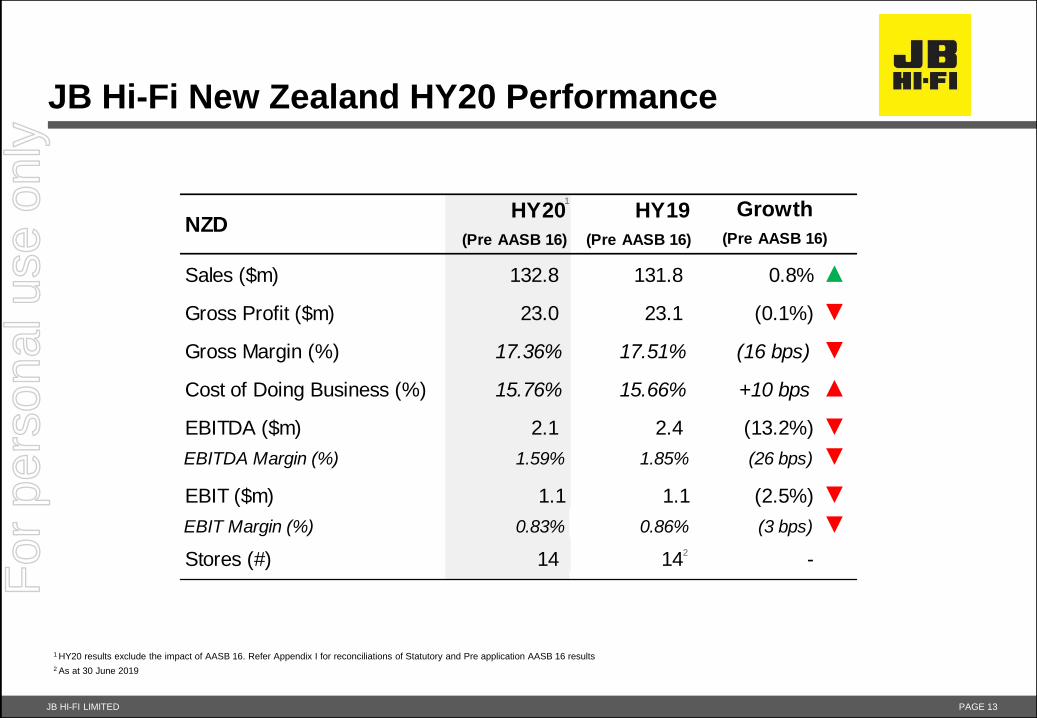
HY20 HY19
(Pre AASB 16) (Pre AASB 16)
Sales ($m) 132.8 131.8 0.8% ▲
Gross Profit ($m) 23.0 23.1 (0.1%) ▼
Gross Margin (%) 17.36% 17.51% (16 bps) ▼
Cost of Doing Business (%) 15.76% 15.66% +10 bps ▲
EBITDA ($m) 2.1 2.4 (13.2%) ▼
EBITDA Margin (%) 1.59% 1.85% (26 bps) ▼
EBIT ($m) 1.1 1.1 (2.5%) ▼
EBIT Margin (%) 0.83% 0.86% (3 bps) ▼
Stores (#) 14 14 -
NZDGrowth
(Pre AASB 16)
JB Hi-Fi New Zealand HY20 Performance
1 HY20 results exclude the impact of AASB 16. Refer Appendix I for reconciliations of Statutory and Pre application AASB 16 results
2 As at 30 June 2019
1
2
For
per
sona
l use
onl
y

PAGE 14JB HI-FI LIMITED
3.8%
(1.2%)
0.8%
3.8%
(1.2%)
0.8%
Q1 Q2 H1
Total
Comp
Sales Growth
JB Hi-Fi New Zealand HY20 Performance
▪ Total sales were up 0.8% to NZD132.8 million, with comparable sales up
0.8%. Whilst Q2 sales moderated as we cycled strong comparable sales in
the pcp (HY19 Q2 comparable sales growth of 14.4%), we are pleased
with the progress made over the last 18 months
▪ The key growth categories were Communications, Small Appliances,
Accessories and Fitness
▪ Online sales grew 22.3% to NZD9.6 million or 7.3% of total sales (HY19:
6.0%)
▪ Gross margin was down 16 bps to 17.4% primarily due to sales mix
▪ CODB was 15.8%, up 10 bps, and in absolute terms up 1.4% as store
wages remained well controlled
▪ EBITDA was NZD2.1 million, down NZD0.3 million or 13.2%, primarily
driven by the gross margin decline
▪ Depreciation declined by 22.6%, as we continue to manage our investment
in the store network
▪ EBIT was NZD1.1 million, in line with the pcp
1 HY20 results exclude the impact of AASB 16. Refer Appendix I for reconciliations of Statutory and Pre application AASB 16 results
HY20 Sales
HY20 Earnings1
$2.0m
$1.0m
$0.0m
$1.1m $1.1m
HY16 HY17 HY18 HY19 HY20
EBIT NZD
(Pre AASB 16)1
For
per
sona
l use
onl
y

PAGE 15JB HI-FI LIMITED
JB HI-FI Australia and New Zealand Focus Areas
JB HI-FI continues to execute well, whilst positioning for future growth
Sales • Continue driving sales across all channels - in-store, online and commercial
• Focus on growing top line sales and gross profit dollars
Category evolution • Expansion of Communications and Connected Tech
• Optimise category space allocation to maintain productivity of floor space
Stores • Continue investment in and optimisation of the store network to maximise profitability (In JB Hi-Fi Australia 3
stores opened in 1HY20 and 3 stores will close in 2HY20)
Airports • Roll out of small format stores in domestic airport locations
New Zealand • Continue to execute on strategy to improve performance in New Zealand
Services • National rollout of TV install service with positive customer feedback and strong supplier engagement
eCommerce • Successful migration to Shopify Plus, completed in September 2019, providing the foundation to continue to
expand and enhance our digital offering
Productivity • Simplify processes and drive productivity, with a focus on improved stock flow into store and back of house
operations
FY20 Focus Areas
For
per
sona
l use
onl
y

PAGE 1615 AUGUST 2016 PAGE 1615 AUGUST 201610 FEBRUARY 2020
The Good Guys
For
per
sona
l use
onl
y
PAGE 17JB HI-FI LIMITED
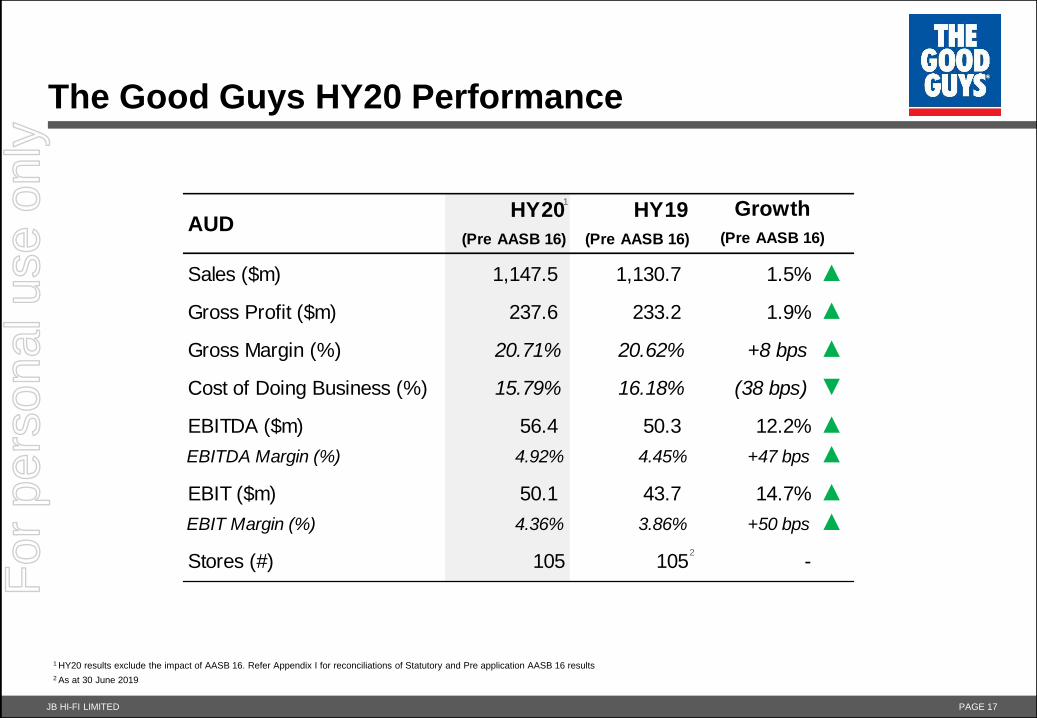
HY20 HY19
(Pre AASB 16) (Pre AASB 16)
Sales ($m) 1,147.5 1,130.7 1.5% ▲
Gross Profit ($m) 237.6 233.2 1.9% ▲
Gross Margin (%) 20.71% 20.62% +8 bps ▲
Cost of Doing Business (%) 15.79% 16.18% (38 bps) ▼
EBITDA ($m) 56.4 50.3 12.2% ▲
EBITDA Margin (%) 4.92% 4.45% +47 bps ▲
EBIT ($m) 50.1 43.7 14.7% ▲
EBIT Margin (%) 4.36% 3.86% +50 bps ▲
Stores (#) 105 105 -
AUDGrowth
(Pre AASB 16)
The Good Guys HY20 Performance
1 HY20 results exclude the impact of AASB 16. Refer Appendix I for reconciliations of Statutory and Pre application AASB 16 results
2 As at 30 June 2019
1
2
For
per
sona
l use
onl
y

PAGE 18JB HI-FI LIMITED
(0.5%)
3.2%
1.5%
(1.8%)
2.7%
0.6%
Q1 Q2 H1
Total
Comp
The Good Guys HY20 Performance
▪ Total sales grew by 1.5% to $1.15 billion, with comparable sales up
0.6%. Sales momentum improved through the half with 2.7%
comparable sales growth in the key Christmas quarter
▪ The key growth categories were Dishwashers, Floorcare, Cooking,
Communications and Computers. We were pleased with our
performance in the large Home Appliance categories in a
challenging market
▪ Online sales were up 12.6% to $79.6 million or 6.9% of total sales
(HY19: 6.3%) with strong sales on The Good Guys website partially
offset by a decline in third party marketplace sales
Sales GrowthHY20 Sales
For
per
sona
l use
onl
y

PAGE 19JB HI-FI LIMITED
▪ Gross profit was $237.6 million with gross margin up 8 bps to
20.7%, driven by improvements in gross margin partially offset
by sales mix
▪ CODB was 15.8%, down 38 bps, and in absolute terms declined
0.9% as store wages remained well controlled and the business
benefited from productivity initiatives implemented in 2HY19
▪ Sales growth, gross margin expansion and cost control drove
strong EBITDA growth of 12.2%
▪ Depreciation declined by 4.6% as pre-acquisition IT investment
is now fully amortised
▪ EBIT was up 14.7% to $50.1 million while EBIT margin was up
50 bps to 4.4%
1 HY20 results exclude the impact of AASB 16. Refer Appendix I for reconciliations of Statutory and Pre application AASB 16 results
The Good Guys HY20 Performance
HY20 Earnings1
Gross Profit
EBIT $
(Pre AASB 16)1
$229m $233m $238m
HY18 HY19 HY20
$42m $44m$50m
HY18 HY19 HY20
For
per
sona
l use
onl
y

PAGE 20JB HI-FI LIMITED
Strong first half results with continued opportunities for improvement
The Good Guys Focus Areas
Sales • Continue to focus on driving sales - in-store, online and commercial
Category evolution• Establish leading position in the growing Connected Home Appliances market
• Improve Cooking offer and in-store experience
• National rollout of Telco services in partnership with Telstra
Stores• Continue the store upgrade program that focuses on adjacencies, improved customer flow and
showcasing the home appliance categories
Supplier relationships
• Continue to build on supplier relationships
• Work with suppliers to create branded in-store displays and improved visual merchandising
• Introduction of SMEG into the portable appliances range
• Rollout of Miele Cooking into 17 stores in 2HY20
Delivery experience• Utilise Group supply chain capability to consolidate carriers and provide customers an
enhanced delivery experience
Productivity • Roll out of technology to streamline in-store processes
eCommerce • Leverage multichannel capability to further connect the online and in-store experience
FY20 Focus Areas
For
per
sona
l use
onl
y

PAGE 2115 AUGUST 2016 PAGE 2115 AUGUST 201610 FEBRUARY 2020
Group Balance Sheet and Cash Flow
For
per
sona
l use
onl
y

PAGE 22JB HI-FI LIMITED
AUDm HY20 HY20 FY19 HY19(Statutory) (Pre AASB 16) (Pre AASB 16) (Pre AASB 16)
Cash 76.8 76.8 119.2 117.1
Receivables 386.6 386.6 254.4 311.2
Inventories 1,132.3 1,132.3 886.7 1,076.4
Other 37.6 37.8 34.6 41.2
Total Current Assets 1,633.3 1,633.5 1,294.9 1,545.9
Fixed Assets 189.5 191.7 191.5 206.8
Intangibles & Goodwill 1,031.4 1,037.2 1,037.3 1,037.3
Other 59.7 39.6 43.5 50.5
Right of Use Asset 724.0 - - -
Total Non-Current Assets 2,004.6 1,268.5 1,272.3 1,294.6
Total Assets 3,637.9 2,902.0 2,567.2 2,840.5
Payables 1,025.1 1,025.1 672.7 1,015.5
Other 288.3 294.8 272.8 295.1
Lease Liabilities 162.7 - - -
Total Current Liabilities 1,476.1 1,320.0 945.5 1,310.6
Borrowings 292.3 292.3 439.1 330.8
Other 123.7 138.7 138.5 143.9
Lease Liabilities 648.5 - - -
Total Non-Current Liabilities 1,064.5 431.0 577.6 474.7
Total Liabilities 2,540.6 1,751.0 1,523.1 1,785.3
Net Assets 1,097.3 1,151.0 1,044.1 1,055.2
Net Debt 215.5 215.5 319.9 213.7
$1,076.4m
($5.2m)
$7.9m
$53.2m
$1,132.3m
HY19 ClosingInventory
New Stores ClosedStores
ExistingStores
HY20 ClosingInventory
Group Balance Sheet and Cash Flow
Inventory Bridge – HY19 to HY20
▪ Inventory was well controlled with inventory turnover up 8 bps to
6.2x (HY19: 6.1x)
▪ Receivables were up year on year due primarily to the later Black
Friday promotional period (ending in Dec this year vs Nov last year)
changing the timing of promotional support claims to Suppliers
▪ Payables, which ordinarily would grow in line with inventory, were
impacted by the earlier purchasing of inventory to capitalise on the
increasingly important Black Friday promotional period
Group Balance Sheet
1 HY20 results exclude the impact of AASB 16. Refer Appendix I for reconciliations of Statutory and Pre application AASB 16 results
2 Net Debt excluding AASB 16 Lease Liability
1
2
For
per
sona
l use
onl
y

PAGE 23JB HI-FI LIMITED
AUDm HY20 HY20 HY19(Statutory) (Pre AASB 16) (Pre AASB 16)
Statutory EBITDA 372.1 281.9 264.3
Change in Working Capital (17.7) (20.3) 84.5
Net Interest Paid (4.8) (4.8) (6.5)
Interest on lease liabilities (12.8) - -
Income Tax Paid (57.7) (57.7) (58.6)
Other 5.2 5.2 (3.4)
Net Cash Flow from Operations 284.5 204.4 280.3
Purchases of P&E (net) (26.2) (26.2) (36.4)
Net Cash Flow from Investing (26.2) (26.2) (36.4)
Free Cash Flow2 258.2 178.1 243.9
Proceeds / (Repayment) of borrowings (147.0) (147.0) (139.2)
Repayment of lease liabilities (80.1) - -
Proceeds from issue of equity 1.1 1.1 1.8
Shares acquired by the employee share trust (16.2) (16.2) (8.9)
Share issue costs - - -
Dividends Paid (58.6) (58.6) (52.8)
Net Cash Flow from Financing (300.8) (220.7) (199.1)
Net Change in Cash Position (42.5) (42.5) 44.8
Effect of exchange rates (0.0) (0.0) 0.3
Cash at the end of Period 76.8 76.8 117.1
Net Debt at the end of Period 215.5 215.5 213.7
HY20 HY19
(Pre AASB 16) (Pre AASB 16)
Fixed Charge Ratio 3.0x 2.9x
Interest Cover 46.0x 33.2x
Gearing Ratio 0.7 0.8
Return on Invested Capital 18.7% 18.6%
Group Cash Flow Statement
▪ Operating cash flows and operating cash conversion,
whilst down on the pcp due to the Black Friday timing
differences year on year, continue to be strong
▪ Capex remains in line with expectations as we continue
to invest in the store portfolio, our digital propositions
and strategic initiatives
▪ In line with prior years, Net Debt at 31 December is
seasonally low. We expect Net Debt at 30 June 2020
to be in the range of $240 million to $270 million, a
reduction of circa $50 million to $80 million year on year
Group Performance Indicators
Group Balance Sheet and Cash Flow
1 HY20 results exclude the impact of AASB 16. Refer Appendix I for reconciliations of Statutory and Pre application AASB 16 results
2 Free Cash Flow = Net Cash Flow from Operations less Purchases of P&E (net)
3 Net Debt excluding AASB 16 Lease Liability
1 1
3For
per
sona
l use
onl
y

PAGE 24JB HI-FI LIMITED
6372
86 9199
37
46
4651
FY16 FY17 FY18 FY19 HY20
Dividends (cps)
Capital Management
▪ The Board regularly reviews the Company’s capital structure
and believes the current dividend payout ratio of 65%
appropriately balances the distribution of profit to shareholders,
the repayment of debt and the reinvestment of earnings for
future growth
▪ The interim dividend is 99 cents per share (cps) fully franked, up
8.8% from the pcp, representing 65% of Pre AASB 16 NPAT.
The record date for the interim dividend is 21 February 2020,
with payment to be made on 6 March 2020
HY20 dividend up 8.8% to 99 cps
Group Balance Sheet and Cash Flow
Interim
Final
For
per
sona
l use
onl
y

PAGE 25JB HI-FI LIMITED
Group Balance Sheet and Cash Flow
Impact of new lease accounting standard AASB 16 Leases
AASB 16 Leases was adopted on 1 July 2019 and has significantly changed the HY20 reported results however has had no economic
impact on the Group, its cashflows, debt covenants or shareholder value. The impact of the adoption of AASB 16 is as follows:
Balance Sheet
▪ Recognition of right of use asset and lease liability
▪ Total Assets – initial increase of $764.9 million on 1 July 2019 ($735.9 million at 31 December 2019)
▪ Total Liabilities – initial increase of $814.8 million on 1 July 2019 ($789.6 million at 31 December 2019)
▪ Net Asset impact – initial reduction of $49.9 million on 1 July 2019 ($53.7 million at 31 December 2019)
Profit and Loss
▪ Increase in HY20 EBIT of $7.4 million and HY20 EBITDA of $90.2 million as a result of operating lease expenses being
replaced by depreciation and finance costs
▪ Overall HY20 NPAT impact – reduction of $3.8 million
▪ Expected FY20 NPAT impact – reduction of $6.5 million to $7.5 million
Cashflow▪ Increase in HY20 operating cashflows of $80.1 million offset by increase in HY20 financing cashflows of $80.1 million
▪ No impact to net cashflows
Comparatives ▪ AASB 16 has been adopted from 1 July 2019 prospectively with no prior period restatement
Reconciliations detailing the impact of the adoption of AASB 16 on HY20 reported results are set out in Appendix I
For
per
sona
l use
onl
y

PAGE 2615 AUGUST 2016 PAGE 2615 AUGUST 201610 FEBRUARY 2020
FY20 Trading Update and Outlook
For
per
sona
l use
onl
y

PAGE 27JB HI-FI LIMITED
January 2020 sales update:
▪ Total sales growth for JB HI-FI Australia was 6.5% (January 2019: 3.0%) with comparable sales growth of 6.0% (January 2019 : 1.5%)
▪ Total sales growth for JB HI-FI New Zealand was -1.6% (January 2019 : -1.8%) with comparable sales growth of -1.6% (January 2019 : 4.1%)
▪ Total sales growth for The Good Guys was 1.4% (January 2019 : 1.8%) with comparable sales growth of 1.4% (January 2019 : 0.3%)
We are pleased with the Q2 and January sales momentum in Australia, however we continue to see growth in low margin categories and a bias
in customer purchasing towards key promotional periods
FY20 Guidance:
▪ In FY20 the Group expects:
▪ Total Group sales to be circa $7.33 billion, comprising:
▪ JB HI-FI Australia $4.93 billion;
▪ JB HI-FI New Zealand (NZD) $0.24 billion; and
▪ The Good Guys $2.18 billion
▪ Total Group NPAT, pre application of AASB 16, to be in the range of $265m to $270m, an increase of 6.1% to 8.1% on the pcp
Group FY20 Trading Update and Outlook
For
per
sona
l use
onl
y

PAGE 2815 AUGUST 2016 PAGE 2815 AUGUST 201610 FEBRUARY 2020
Investment Checklist
For
per
sona
l use
onl
y

PAGE 29JB HI-FI LIMITED
Investment Checklist
Unique and relevant brands
Flexible business model – history of category growth and development
Diversity of product categories across brands
Scale operator, market leader
Global best in class metrics including low cost of doing business and high sales per square metre
High quality store portfolio and unrivalled customer service
Multichannel capability
Experienced management team
High return on invested capital
Shareholder return focused – through proactive capital management and dividend policies
For
per
sona
l use
onl
y

PAGE 3015 AUGUST 2016 PAGE 3015 AUGUST 201610 FEBRUARY 2020
Appendices
For
per
sona
l use
onl
y

PAGE 31JB HI-FI LIMITED
AUDm HY20 AASB 16 HY20 HY20 HY19 HY18 HY17. HY16
(Statutory) Impact (Pre AASB 16) (Pre AASB 16) (Pre AASB 16) (Pre AASB 16) (Pre AASB 16) (Pre AASB 16)
Sales 3,995.2 - 3,995.2 3,995.2 3,843.7 3,689.8 2,616.2 2,116.8
Gross Profit 860.2 - 860.2 860.2 828.0 793.9 571.1 459.6
Gross Margin 21.53% 21.53% 21.53% 21.54% 21.52% 21.83% 21.71%
EBITDA 372.1 (90.2) 281.9 281.9 264.3 256.3 203.9 157.9
Depreciation & Impairment 109.1 82.9 26.3 26.3 27.7 30.5 23.1 19.7
EBIT 263.0 (7.4) 255.6 255.6 236.6 225.8 180.8 138.2
EBIT Margin 6.58% 6.40% 6.40% 6.16% 6.12% 6.91% 6.53%
Net Interest 17.8 12.8 5.0 5.0 6.7 8.1 1.4 1.7
Profit before Tax 245.2 5.4 250.6 250.6 229.9 217.7 179.5 136.4
Tax Expense 74.6 1.6 76.2 76.2 69.8 66.0 54.1 41.2
NPAT 170.6 3.8 174.4 174.4 160.1 151.7 125.4 95.2
Headline Statistics:
Dividends per share (¢) 99.0 - 99.0 99.0 91.0 86.0 72.0 63.0
Earnings per share (basic ¢) 148.5 3.3 151.8 151.8 139.4 132.2 116.3 95.0
Cost of doing business 12.22% +226 bps 14.48% 14.48% 14.67% 14.57% 14.04% 14.25%
Earnings per Share reconciliation
NPAT (AUDm) 170.6 3.8 174.4
Weighted average number of ordinary shares (m) 114.9 - 114.9
Earnings per share (basic ¢) 148.5 3.3 151.8
a) Group Profit and Loss reconciliation to Pre application AASB 16
results
Appendix I
1 HY17 results are underlying results which exclude transaction fees and implementation costs totaling $15.3m associated with the acquisition of The Good Guys in November 2016
1
b) 5 year Group Profit and Loss
For
per
sona
l use
onl
y

PAGE 32JB HI-FI LIMITED
AUDm HY20 AASB 16 HY20 HY20 HY19 HY18 HY17. HY16
(Statutory) Impact (Pre AASB 16) (Pre AASB 16) (Pre AASB 16) (Pre AASB 16) (Pre AASB 16) (Pre AASB 16)
EBITDA
- JB HI-FI Australia 277.5 (54.0) 223.5 223.5 211.8 204.5 185.3 154.7
- JB HI-FI New Zealand (NZD) 5.8 (3.6) 2.1 2.1 2.4 1.4 2.6 3.5
- The Good Guys 89.2 (32.8) 56.4 56.4 50.3 50.4 16.1 -
Total EBITDA (AUDm) 372.1 (90.2) 281.9 281.9 264.3 256.3 203.9 157.9
EBIT
- JB HI-FI Australia 209.3 (4.8) 204.5 204.5 191.9 183.7 165.6 136.4
- JB HI-FI New Zealand (NZD) 1.5 (0.4) 1.1 1.1 1.1 0.0 1.0 2.0
- The Good Guys 52.3 (2.2) 50.1 50.1 43.7 42.0 14.3 -
Total EBIT (AUDm) 263.0 (7.4) 255.6 255.6 236.6 225.8 180.8 138.2
Appendix I
1 HY17 results are underlying results which exclude transaction fees and implementation costs totaling $15.3m associated with the acquisition of The Good Guys in November 2016
1
c) Divisional EBITDA and EBIT reconciliation to Pre application
AASB 16 resultsd) 5 year Divisional EBITDA and EBIT
For
per
sona
l use
onl
y

PAGE 33JB HI-FI LIMITED
e) Group CODB reconciliation
Appendix I
AUDm HY20 HY20 HY19
(Statutory) (Pre AASB 16) (Pre AASB 16)
Other income (ex interest revenue) (0.8) (0.8) (0.7)
Sales and marketing expenses 395.7 395.7 379.3
Occupancy expenses 149.4 153.5 151.4
less depreciation, amortisation & impairment (104.6) (21.8) (23.3)
Administration expenses 21.3 21.3 24.6
less depreciation & impairment (4.5) (4.5) (4.4)
Other expenses 31.6 34.9 36.9
CODB 488.1 578.3 563.7
Sales 3,995.2 3,995.2 3,843.7
CODB (% of sales) 12.22% 14.48% 14.67%
For
per
sona
l use
onl
y

PAGE 34JB HI-FI LIMITED
AUDm HY20 AASB 16 HY20 HY20 HY19 HY18 HY17 HY16
(Statutory) Impact (Pre AASB 16) (Pre AASB 16) (Pre AASB 16) (Pre AASB 16) (Pre AASB 16) (Pre AASB 16)
Cash 76.8 - 76.8 76.8 117.1 182.7 124.5 101.4
Receivables 386.6 - 386.6 386.6 311.2 302.2 257.5 146.1
Inventories 1,132.3 - 1,132.3 1,132.3 1,076.4 986.7 898.1 621.5
Other 37.6 0.2 37.8 37.8 41.2 45.3 47.5 9.7
Total Current Assets 1,633.3 0.2 1,633.5 1,633.5 1,545.9 1,516.9 1,327.6 878.7
Fixed Assets 189.5 2.2 191.7 191.7 206.8 207.2 215.7 185.5
Intangibles & Goodwill 1,031.4 5.8 1,037.2 1,037.2 1,037.3 1,037.3 1,052.0 85.3
Other 59.7 (20.1) 39.6 39.6 50.5 47.7 46.5 20.7
Right of Use Asset 724.0 (724.0) - - - - - -
Total Non-Current Assets 2,004.6 (736.1) 1,268.5 1,268.5 1,294.6 1,292.2 1,314.2 291.5
Total Assets 3,637.9 (735.9) 2,902.0 2,902.0 2,840.5 2,809.1 2,641.8 1,170.2
Payables 1,025.1 - 1,025.1 1,025.1 1,015.5 1,048.4 920.5 604.9
Other 288.3 6.5 294.8 294.8 295.1 268.6 269.2 128.1
Lease Liabilities 162.7 (162.7) - - - - - -
Total Current Liabilities 1,476.1 (156.1) 1,320.0 1,320.0 1,310.6 1,317.0 1,189.7 733.0
Borrowings 292.3 - 292.3 292.3 330.8 374.2 423.4 -
Other 123.7 15.0 138.7 138.7 143.9 159.2 155.9 31.4
Lease Liabilities 648.5 (648.5) - - - - - -
Total Non-Current Liabilities 1,064.5 (633.5) 431.0 431.0 474.7 533.4 579.3 31.4
Total Liabilities 2,540.6 (789.6) 1,751.0 1,751.0 1,785.3 1,850.4 1,769.0 764.3
Net Assets 1,097.3 53.7 1,151.0 1,151.0 1,055.2 958.7 872.8 405.8
Net Debt / (Net Cash) 215.5 - 215.5 215.5 213.7 191.5 299.0 (101.4)
Appendix I
f) Group Balance Sheet Reconciliation to Pre application AASB 16
results
g) 5 year Group Balance Sheet
1 Net Debt excluding AASB 16 Lease Liability
1
For
per
sona
l use
onl
y

PAGE 35JB HI-FI LIMITED
Appendix I
h) Group Cash Flow Reconciliation to Pre application AASB 16
results
i) 5 year Group Cash Flow
AUDm HY20 AASB 16 HY20 HY20 HY19 HY18 HY17 HY16
(Statutory) Impact (Pre AASB 16) (Pre AASB 16) (Pre AASB 16) (Pre AASB 16) (Pre AASB 16) (Pre AASB 16)
Statutory EBITDA 372.1 (90.2) 281.9 281.9 264.3 256.3 188.5 157.9
Change in Working Capital (17.7) (2.7) (20.3) (20.3) 84.5 179.3 117.0 134.4
Net Interest Paid (4.8) - (4.8) (4.8) (6.5) (8.5) (0.1) (1.7)
Interest on lease liabilities (12.8) 12.8 - - - - - -
Income Tax Paid (57.7) - (57.7) (57.7) (58.6) (58.9) (34.2) (33.6)
Other 5.2 0.0 5.2 5.2 (3.4) 5.4 4.8 2.6
Net Cash Flow from Operations 284.5 (80.1) 204.4 204.4 280.3 373.7 276.1 259.6
Purchases of P&E (net) (26.2) - (26.2) (26.2) (36.4) (30.2) (20.0) (28.6)
Investments (net of cash acquired) - - - - - - (846.5) -
Net Cash Flow from Investing (26.2) - (26.2) (26.2) (36.4) (30.2) (866.5) (28.6)
Free Cash Flow 258.2 (80.1) 178.1 178.1 243.9 343.5 256.1 231.0
Borrowings / (Repayments) (147.0) - (147.0) (147.0) (139.2) (183.8) 315.0 (140.0)
Repayment of lease liabilities (80.1) 80.1 - - - - - -
Proceeds from issue of Equity 1.1 - 1.1 1.1 1.8 2.8 395.2 5.0
Shares acquired by the employee share trust (16.2) - (16.2) (16.2) (8.9) - - -
Share buy-back - - - - - - - (13.2)
Share issue costs - - - - - - (9.0) -
Dividends Paid (58.6) - (58.6) (58.6) (52.8) (52.8) (36.7) (30.9)
Other - - - - - - (1.5) 0.1
Net Cash Flow from Financing (300.8) 80.1 (220.7) (220.7) (199.1) (233.8) 663.0 (179.0)
Net Change in Cash Position (42.5) (0.0) (42.5) (42.5) 44.8 109.7 72.6 52.0 - -
Effect of exchange rates (0.0) - (0.0) (0.0) 0.3 0.2 (0.0) 0.3
Cash at the end of Period 76.8 - 76.8 76.8 117.1 182.7 124.5 101.4
For
per
sona
l use
onl
y

PAGE 36JB HI-FI LIMITED
AUDm
JB HI-FI
AUST
JB HI-FI
NZ (NZD)TGG Group
JB HI-FI
AUST
JB HI-FI
NZ (NZD)TGG Group
Sales 2,722.4 132.8 1,147.5 3,995.2 2,591.3 131.8 1,130.7 3,843.7 3.9% ▲
Gross Profit 600.8 23.0 237.6 860.2 573.6 23.1 233.2 828.0 3.9% ▲
Gross Margin 22.07% 17.36% 20.71% 21.53% 22.13% 17.51% 20.62% 21.54% (1 bps) ▼
EBITDA 223.5 2.1 56.4 281.9 211.8 2.4 50.3 264.3 6.6% ▲
Depreciation & Impairment 19.0 1.0 6.3 26.3 19.9 1.3 6.6 27.7 (5.2%) ▼
EBIT 204.5 1.1 50.1 255.6 191.9 1.1 43.7 236.6 8.0% ▲
EBIT Margin 7.51% 0.83% 4.36% 6.40% 7.41% 0.86% 3.86% 6.16% +24 bps ▲
Net Interest 5.0 6.7 (25.1%) ▼
Profit before Tax 250.6 229.9 9.0% ▲
Tax Expense 76.2 69.8 9.1%
NPAT 174.4 160.1 8.9% ▲
Headline Statistics:
Dividends per share (¢) 99.0 91.0 8.8% ▲
Earnings per share (basic ¢) 151.8 139.4 8.9% ▲
Cost of doing business 13.86% 15.76% 15.79% 14.48% 13.96% 15.66% 16.18% 14.67% (19 bps) ▼
Stores 199 14 105 318 196 14 105 315 +3 stores ▲
HY20 (Pre AASB 16) HY19 (Pre AASB 16)Growth
(Pre AASB 16)
Group Profit and Loss – Breakdown1
Appendix II
1 HY20 results exclude the impact of AASB 16. Refer Appendix I for reconciliations of Statutory and Pre application AASB 16 results
2 As at 30 June 2019
1
2 222For
per
sona
l use
onl
y

PAGE 37JB HI-FI LIMITED
Opened Converted Closed Total
Australia JB HI-FI 138 3 - - 141 JB HI-FI HOME 58 - - - 58
196 3 - - 199
New Zealand JB HI-FI 14 - - - 14 JB HI-FI HOME - - - - -
14 - - - 14
JB HI-FI TOTAL 210 3 - - 213
105 - - - 105
TOTAL 315 3 - - 318
Store type: JB HI-FI 152 2 - - 154 JB HI-FI HOME 58 1 - - 59 THE GOOD GUYS 105 - - - 105
315 3 - - 318
Store format: Shopping centre 123 - - - 123 Other 192 3 - - 195
315 3 - - 318
FY19
THE GOOD GUYS
HY20
318 stores across Australia and New Zealand
Appendix III
Group store reconciliation
1
2
14
23
5
10
23
40
30
63
3
5
1
3
28 53
14
1 As at 31 December 2019
1
1
For
per
sona
l use
onl
y