THE RECIPE passionate about potatoes - Idaho Potato Commission

THIS REPORT CONTAINS ASSESSMENTS OF COMMODITY AND TRADE ISSUES MADE BY
USDA STAFF AND NOT NECESSARILY STATEMENTS OF OFFICIAL U.S. GOVERNMENT
POLICY
Required Report - public distribution
Date: 10/18/2010
GAIN Report Number: JA0030
Japan
Potatoes and Potato Products Annual
Japanese Imports of U.S. Fresh Potatoes Hit a Record High
Approved By:
Jeffrey Nawn
Prepared By:
Kenzo Ito, Jennifer Clever
Report Highlights:
In marketing year 2009/10, Japan imported a record 1,899 metric tons of U.S. fresh potatoes, the
highest level of imports since Japan opened its market in 2006. Similarly, Japanese imports of U.S.
frozen (not fried) potato products reached the highest level on record at 8,910 metric tons, a 40 percent
jump from the previous season. Imports of U.S. frozen French fries also increased by about 2
percent.
Commodities:
Potato Products, Fresh, frozen, and dehydrated
Potatoes and Potato Products Annual
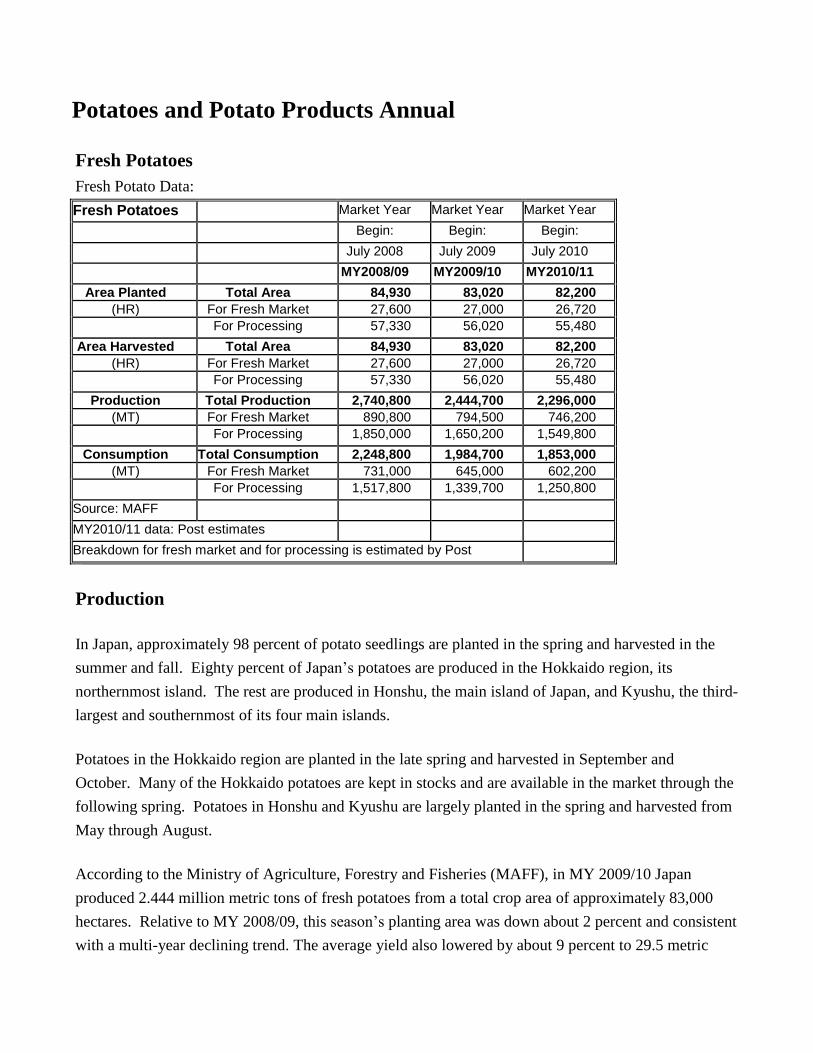
Fresh Potatoes
Fresh Potato Data:
Fresh Potatoes Market Year Market Year Market Year
Begin: Begin: Begin:
July 2008 July 2009 July 2010
MY2008/09 MY2009/10 MY2010/11
Area Planted Total Area 84,930 83,020 82,200 (HR) For Fresh Market 27,600 27,000 26,720
For Processing 57,330 56,020 55,480
Area Harvested Total Area 84,930 83,020 82,200 (HR) For Fresh Market 27,600 27,000 26,720
For Processing 57,330 56,020 55,480
Production Total Production 2,740,800 2,444,700 2,296,000 (MT) For Fresh Market 890,800 794,500 746,200
For Processing 1,850,000 1,650,200 1,549,800
Consumption Total Consumption 2,248,800 1,984,700 1,853,000 (MT) For Fresh Market 731,000 645,000 602,200
For Processing 1,517,800 1,339,700 1,250,800
Source: MAFF MY2010/11 data: Post estimates Breakdown for fresh market and for processing is estimated by Post
Production
In Japan, approximately 98 percent of potato seedlings are planted in the spring and harvested in the
summer and fall. Eighty percent of Japan’s potatoes are produced in the Hokkaido region, its
northernmost island. The rest are produced in Honshu, the main island of Japan, and Kyushu, the third-
largest and southernmost of its four main islands.
Potatoes in the Hokkaido region are planted in the late spring and harvested in September and
October. Many of the Hokkaido potatoes are kept in stocks and are available in the market through the
following spring. Potatoes in Honshu and Kyushu are largely planted in the spring and harvested from
May through August.
According to the Ministry of Agriculture, Forestry and Fisheries (MAFF), in MY 2009/10 Japan
produced 2.444 million metric tons of fresh potatoes from a total crop area of approximately 83,000
hectares. Relative to MY 2008/09, this season’s planting area was down about 2 percent and consistent
with a multi-year declining trend. The average yield also lowered by about 9 percent to 29.5 metric

tons per hectare. In MY2009/10 the Hokkaido region produced 1.879 million metric tons, down
approximately 12 percent from the previous season. Lower temperatures and insufficient sunshine in
2009 contributed to Hokkaido’s production decline.
During the summer of 2010, Japan experienced record high temperatures for over two months. As a
result, the Japanese industry expects farmers in the Hokkaido region to have a 10 to 15 percent
reduction in their upcoming crop. Harvesting in Hokkaido is expected to take place in September and
October. In addition to severe weather changes, other overarching issues such as diversification to
other crops and an aging farming population continue to affect Japan’s potato production. Hence, Post
estimates that Japanese potato production in MY 2010/11 to be approximately 2.296 million metric
tons, down approximately 7 percent from the previous year (MY 2009/10).
Consumption
According to the Ministry of Internal Affairs and Communications (MIC), in CY 2009, household
consumption of fresh potatoes in Japan remained steady at approximately 11.5 kilograms per year, with
an average expenditure of about $30.05* (2,550 yen) per year.
The Ministry of Agriculture, Forestry and Fisheries (MAFF) reports that 32.5 percent of potatoes
harvested in Japan are destined for the fresh market and the rest for processing and seedling. Within
the food processing sector, approximately 41.9 percent of potatoes go to starch makers and
approximately 19.5 percent go to food manufacturing such as potato chip manufactures and frozen
potato processors. The rest, about 6.4 percent is used as seed.
A relatively large volume of Hokkaido production goes to starch makers and food processors, about 55
percent and 22 percent, respectively. Only about 16 percent of Hokkaido’s potato production goes is
sold at fresh markets.
Japanese potato chip manufactures all together use around 310,000 – 340,000 metric tons of fresh
potatoes annually. Japan’s largest potato chip manufacturer alone consumes approximately 240,000 –
250,000 metric tons of fresh potatoes annually.
* The 84.86 yen per dollar exchange rate is based on a Nikkei News quote from September 22, 2010.
Trade – Imports

In MY 2009/10, Japan practically doubled imports of U.S. fresh potatoes hitting a record 1,899 metric
tons, the highest level of imports since Japan opened its market in 2006. Japanese imports of U.S.
fresh potatoes started in 2006 after the Japanese government allowed limited importation of U.S. fresh
potatoes for potato chip manufacturing (see Policy section.) With the exception of last season, when
imports from the U.S. lowered due to shipping cancellations, Japanese imports had averaged about 772
metric tons. This season’s leap in U.S. fresh potato imports, valued at $1.11 million (CIF basis), is
largely due to U.S. exporters supplying higher quality potatoes, providing suitable potato varieties and
successfully meeting the needs of Japanese manufacturers. Higher prices in Japanese domestic
potatoes also contributed to the MY2009/10 increase. Other major world suppliers, such as China,
export to Japan; however, Japan’s imports of fresh potatoes from other suppliers remain negligible.
Japanese chip manufacturers rely heavily on Hokkaido potatoes. Given the expected reduction in
Japan’s next potato crop, Japanese chippers are already looking to increase their sourcing from the
United States. Stronger relationships between U.S. suppliers and Japanese manufacturers signal that
Japanese imports of U.S. potatoes are likely to continue growing.
Trade – Exports

Japanese exports of fresh potatoes are usually extremely small, as domestic production is only large
enough to satisfy local demand. With a stable demand and lower yields during MY 2009/10, Japan
reported no exports of fresh potatoes.
Policy
On February 1, 2006 Japanese MAFF and USDA reached an agreement to allow limited imports of
fresh potatoes from the United States, strictly for chip manufacturing. Prior to that date, the
government of Japan had banned all imports of fresh potatoes from the United States due to
phytosanitary concerns. Under this agreement, 14 U.S. states were allowed limited access to the
Japanese market. These are the states of Idaho, Arizona, Wisconsin, Oregon, California, Colorado,
Texas, New Mexico, North Dakota, Florida, Michigan, Minnesota, Maine, and Washington. However,
in April 2006, after the state of Idaho announced a finding of potato cyst nematode, Japan banned
imports of all U.S. fresh potatoes. In February 2007, the U.S. regained access for all previously
approved States except Idaho. Presently, only 13 U.S. states are allowed to ship fresh potatoes for
chipping to Japan. Negotiations between the two countries continue to reinstate Idaho as an eligible
shipper.
Within the thirteen eligible states, California is the only state currently shipping fresh potatoes to
Japan. Under the current import protocol, Japanese importers have access to U.S. fresh potatoes from
the beginning of February to the end of June. However, depending on weather conditions, this limited
time-frame may not be practical. For example, in June, 2010, poor weather conditions delayed
California’s potato harvest for about two weeks, postponing the shipping and arrival dates at Japan’s
port too close to end of the allowable shipping period. Anticipating lower Japanese crop yields in
MY2010/11 and seeking to accommodate possible delays in U.S. harvest, Japanese manufacturers have
requested MAFF to extend the duration of the shipping period to the end of July. In February 2010,
USDA made a similar request to MAFF as an extended access period would increase availability of
U.S. potatoes in this market. MAFF’s response to these requests is pending.
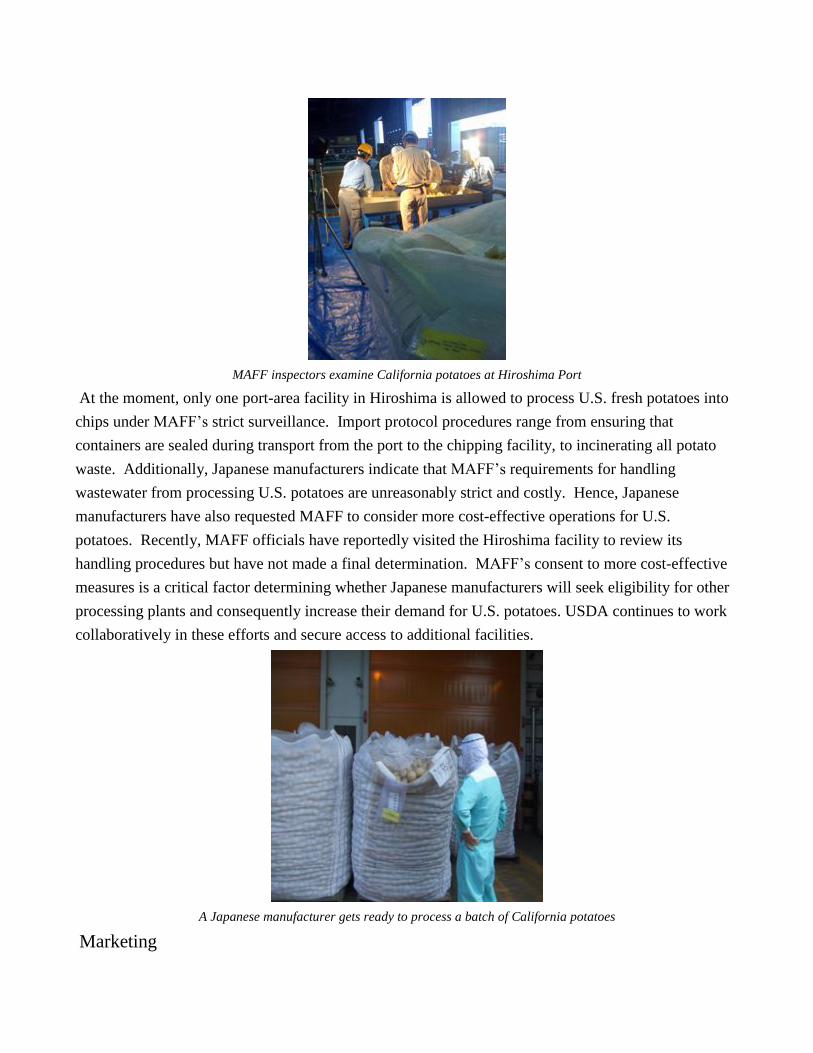
MAFF inspectors examine California potatoes at Hiroshima Port
At the moment, only one port-area facility in Hiroshima is allowed to process U.S. fresh potatoes into
chips under MAFF’s strict surveillance. Import protocol procedures range from ensuring that
containers are sealed during transport from the port to the chipping facility, to incinerating all potato
waste. Additionally, Japanese manufacturers indicate that MAFF’s requirements for handling
wastewater from processing U.S. potatoes are unreasonably strict and costly. Hence, Japanese
manufacturers have also requested MAFF to consider more cost-effective operations for U.S.
potatoes. Recently, MAFF officials have reportedly visited the Hiroshima facility to review its
handling procedures but have not made a final determination. MAFF’s consent to more cost-effective
measures is a critical factor determining whether Japanese manufacturers will seek eligibility for other
processing plants and consequently increase their demand for U.S. potatoes. USDA continues to work
collaboratively in these efforts and secure access to additional facilities.
A Japanese manufacturer gets ready to process a batch of California potatoes
Marketing

In MY 2009/10 Japan imported 1,899 metric tons of U.S. fresh potatoes, the highest level since Japan
began importing fresh potatoes from the United States in 2006. According to Japanese industry
sources, the quality of this marketing year’s U.S. potatoes was excellent. Different from the previous
season, the potato variety shipped (“NY115”) met the taste and color needs of Japanese chip
manufacturers which led to increased orders. Similarly, Japanese manufactures report that their
production yield was reasonably high (the rejection rate of U.S. potatoes was reasonably small
compared to previous years).
Other factors contributed to the increased demand for U.S. potatoes. The yen’s appreciation against the
U.S. dollar (27 percent between September 2007 and September 2010) and a relatively poor domestic
crop in early summer encouraged Japanese buyers to purchase U.S. potatoes.
Currently, Japanese chip manufacturers procure U.S. fresh potatoes from one supplier in
California. Seeking to stabilize potato supply in the future, Japanese buyers are actively looking for
additional U.S. suppliers within and beyond California. The U.S. potato industry and USDA are
working with MAFF inspectors to facilitate sourcing of U.S. potatoes from other eligible states.
Tariff Table
The applicable import duty for fresh potatoes is as follows:
TARIFF CODE (HS) DESCRIPTION DUTY RATE
0701.90 Fresh Potatoes 4.3%
The duty is charged on a CIF basis.
Trade Matrices
Import Trade Matrix (Quantity) Country Japan

Commodity Potatoes, Fresh HS 0701.90 Time Period: July - June Units: Metric Tons Import for: MY2007/08 Import for: MY2008/09 Import for: MY2009/10
U.S. 960 U.S. 328 U.S. 1,899
Others Others Others China 2 China 0 China 1
Total for Others 2 Total for Others 0 Total for Others 1 Others not Listed 0 Others not Listed 0 Others not Listed 0 Grand Total 962 Grand Total 328 Grand Total 1,900 Source: World Trade Atlas
Import Trade Matrix (Value) Country Japan Commodity Potatoes, Fresh Time Period: July - June Units: Millions of US Dollars Import for: MY2007/08 Import for: MY2008/09 Import for: MY2009/10
U.S. 0.511 U.S. 0.176 U.S. 1.113
Others Others Others China 0.002 China 0.000 China 0.002
Total for Others 0.002 Total for Others 0.000 Total for Others 0.002 Others not Listed 0.000 Others not Listed 0.000 Others not Listed 0.000 Grand Total 0.513 Grand Total 0.176 Grand Total 1.115 Source: World Trade Atlas
Wholesale Price Table
Wholesale Price Table Country Japan Commodity Potatoes, Fresh

Prices in: Japanese Yen Per uom: KG
Year: 2009 2010 % Change Jan 98 125 28% Feb 101 126 25% Mar 121 143 18% Apr 144 189 31% May 140 179 28% Jun 150 193 29% Jul 185 168 -9% Aug 183 Sep 112 Oct 109 Nov 115 Dec 121
Exchange Rate: 84.03 (Local Currency/US $) Date of Quote: 9/10/2010 (MM/DD/YYYY) Source: MAFF
Frozen Potatoes
Frozen Potato Data:
Frozen Potato Market Year Market Year Market Year Products Begin: Begin: Begin:
July 2008 July 2009 July 2010
(MT, Net Weight) MY2008/09 MY2009/10 MY2010/11
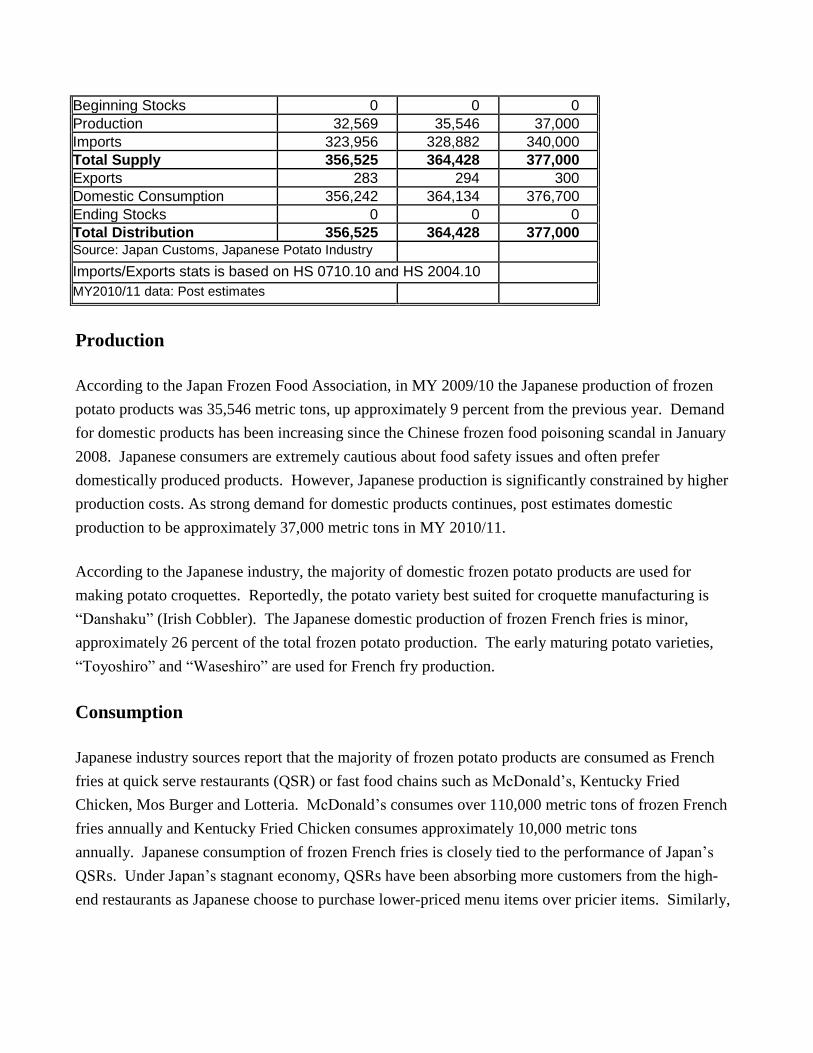
Beginning Stocks 0 0 0 Production 32,569 35,546 37,000 Imports 323,956 328,882 340,000 Total Supply 356,525 364,428 377,000 Exports 283 294 300 Domestic Consumption 356,242 364,134 376,700 Ending Stocks 0 0 0 Total Distribution 356,525 364,428 377,000 Source: Japan Customs, Japanese Potato Industry Imports/Exports stats is based on HS 0710.10 and HS 2004.10 MY2010/11 data: Post estimates
Production
According to the Japan Frozen Food Association, in MY 2009/10 the Japanese production of frozen
potato products was 35,546 metric tons, up approximately 9 percent from the previous year. Demand
for domestic products has been increasing since the Chinese frozen food poisoning scandal in January
2008. Japanese consumers are extremely cautious about food safety issues and often prefer
domestically produced products. However, Japanese production is significantly constrained by higher
production costs. As strong demand for domestic products continues, post estimates domestic
production to be approximately 37,000 metric tons in MY 2010/11.
According to the Japanese industry, the majority of domestic frozen potato products are used for
making potato croquettes. Reportedly, the potato variety best suited for croquette manufacturing is
“Danshaku” (Irish Cobbler). The Japanese domestic production of frozen French fries is minor,
approximately 26 percent of the total frozen potato production. The early maturing potato varieties,
“Toyoshiro” and “Waseshiro” are used for French fry production.
Consumption
Japanese industry sources report that the majority of frozen potato products are consumed as French
fries at quick serve restaurants (QSR) or fast food chains such as McDonald’s, Kentucky Fried
Chicken, Mos Burger and Lotteria. McDonald’s consumes over 110,000 metric tons of frozen French
fries annually and Kentucky Fried Chicken consumes approximately 10,000 metric tons
annually. Japanese consumption of frozen French fries is closely tied to the performance of Japan’s
QSRs. Under Japan’s stagnant economy, QSRs have been absorbing more customers from the high-
end restaurants as Japanese choose to purchase lower-priced menu items over pricier items. Similarly,

family restaurants and “Izakaya”, Japanese style pubs, are also major consumption hubs for frozen
potato products.
Japanese convenience stores also sell a fair amount of frozen potato products. Convenience stores set
full size fryers in the store and sell freshly fried products to consumers. “Mini Stop” convenience
stores have developed unique products such as hashed potato products using Idaho Russet potatoes, X-
cut fried potatoes using German potatoes and fish and chips products. According to the Nikkei News,
there are approximately 45,000 convenience stores in Japan (led by Seven-Eleven stores, Lawson,
Family Mart, et. al.) Sales at convenience stores have reportedly grown approximately 7 – 10 percent
annually.
Approximately 90 percent of Japanese consumption of frozen potato products is satisfied by imports,
mainly in the form of French fries. Domestic frozen potato products are consumed through retail sector
sales and manufactures of frozen croquettes products.
Trade – Imports
In MY2009/10, Japanese total world imports of frozen potato products (including both French fries
(HS: 2004.10) and non-fried potatoes (HS: 0710.10)) were 328,882 metric tons, about 2 percent higher
than the previous season. The total value of imports was approximately $403.2 million on a CIF
basis. Japan imports frozen potato products all year round with a slight increase in early spring through
summer, reflecting Japan’s higher seasonal demand. Japan’s QSRs are expected to continue having
good sales in the coming year and the exchange rate is also expected to encourage Japanese buyers to
purchase from foreign suppliers. Correspondingly, for MY 2010/11, post estimates Japan’s total
imports of frozen potato products to continue their upward trend and increase roughly by 3 percent to
340,000 metric tons.
Within Japanese world imports of frozen potato products, imports of frozen French fries continue to be
by far the biggest contributor compared to imports of frozen non-fried potato products. Nonetheless, is
worth noting that in recent years the rate of growth in the non-fried potato category appears to be
outpacing that of frozen French fries.
Imports of Frozen French Fries (HS: 2004.10)
In MY 2009/10, Japanese imports of U.S. frozen French fries (HS: 2004.10) were 258,864 metric tons,
an increase of about 2 percent from the previous season, and valued at approximately $314.1 million on
a CIF basis.

In the frozen French fry category, the United States continues to be the biggest supplier to
Japan. During the MY 2009/10, 83 percent of Japan’s total imports were supplied by the United States,
followed by Canada and Belgium. Canada and Belgium supplied around 9 percent and 4 percent,
respectively.
Japanese imports of Canadian frozen French fries have been declining at approximately 13 – 18 percent
annually. Japanese industry sources report that Canada’s largest frozen potato supplier has plants in
both Canada and the United States. However, recently the Canadian supplier reportedly increased the
number of product shipments coming out of its U.S. plants and decreased shipments out of
Canada. Given the strong Canadian dollar, shipments from Canadian plants lost their
competiveness. Hence, trade statistics may reflect the Canadian company’s operational changes and
account for the decline in imports from Canada.
Japanese imports of Belgium frozen French fries have been increasing in the last several years as a
result of good sales at Japan’s convenience stores. In MY 2009/10, Japan imported 13,059 metric tons
of Belgium frozen potatoes, valued at $15.6 million on a CIF basis. However, Japanese imports of
frozen potato products from European countries such as Belgium and Germany are likely to decrease
due to the poor crops in Europe resulting from the heat waves in the summer of 2010. With possible
shortages in European supplies, imports from the United States are expected to increase.
Japanese imports of Chinese frozen French fries have been declining since the Chinese food poisoning
scandal in 2008. As Chinese frozen French fries are generally sold at the retail level, where the source
country can be identified, the 2008 scandal continues to lessen Japanese demand for these and other
retail food products. In MY 2009/10, Japan imported only 2,311 metric tons of frozen potato products
(HS: 2004.10) from China, only 61 percent of the pre-food poisoning level and 8 percent less than the
last year.
Imports of Frozen Non-fried potatoes (HS: 0710.10)
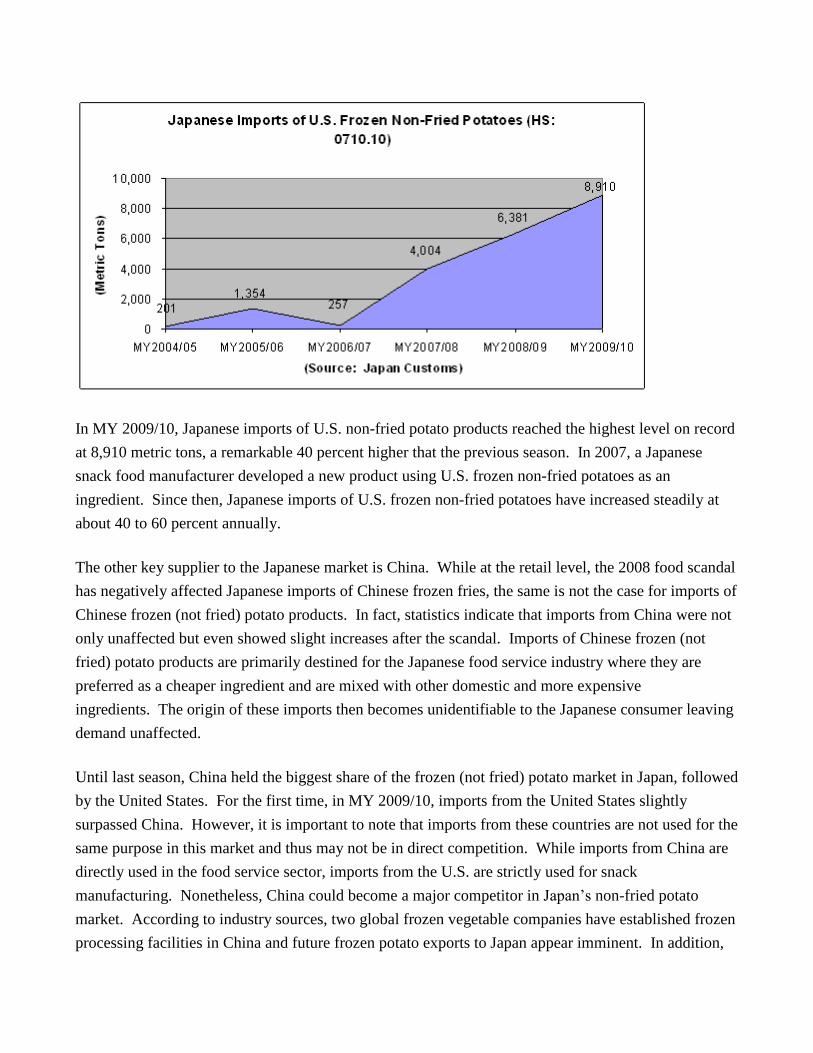
In MY 2009/10, Japanese imports of U.S. non-fried potato products reached the highest level on record
at 8,910 metric tons, a remarkable 40 percent higher that the previous season. In 2007, a Japanese
snack food manufacturer developed a new product using U.S. frozen non-fried potatoes as an
ingredient. Since then, Japanese imports of U.S. frozen non-fried potatoes have increased steadily at
about 40 to 60 percent annually.
The other key supplier to the Japanese market is China. While at the retail level, the 2008 food scandal
has negatively affected Japanese imports of Chinese frozen fries, the same is not the case for imports of
Chinese frozen (not fried) potato products. In fact, statistics indicate that imports from China were not
only unaffected but even showed slight increases after the scandal. Imports of Chinese frozen (not
fried) potato products are primarily destined for the Japanese food service industry where they are
preferred as a cheaper ingredient and are mixed with other domestic and more expensive
ingredients. The origin of these imports then becomes unidentifiable to the Japanese consumer leaving
demand unaffected.
Until last season, China held the biggest share of the frozen (not fried) potato market in Japan, followed
by the United States. For the first time, in MY 2009/10, imports from the United States slightly
surpassed China. However, it is important to note that imports from these countries are not used for the
same purpose in this market and thus may not be in direct competition. While imports from China are
directly used in the food service sector, imports from the U.S. are strictly used for snack
manufacturing. Nonetheless, China could become a major competitor in Japan’s non-fried potato
market. According to industry sources, two global frozen vegetable companies have established frozen
processing facilities in China and future frozen potato exports to Japan appear imminent. In addition,

some Chinese exports appear to be from Japanese companies operating in China. However, as
Japanese manufacturers continue expanding and requiring high quality ingredients for their products,
the United States will remain in the best position to fulfill market demand in this sector.
Trade – Exports
Japan’s exports of frozen potato products are very small. Japan exports around 300 metric tons to
Taiwan, Singapore and Hong Kong, through local Japanese grocery stores.
Marketing
Under the current Japanese economic recession, Japanese consumers have become more price-
sensitive. In recent years, quick serve restaurants (QSR) or fast food restaurants have been performing
well with their lower-priced menu items. Japanese hamburger shops are the key users of imported
frozen French fries. With over 3,700 outlets throughout Japan, McDonald’s is the largest single user of
imported frozen French fries. Kentucky Fried Chicken who has over 1,500 outlets nationwide is also an
important player. U.S. frozen French fry suppliers have earned a good reputation among their Japanese
clients as they are able to provide a high quality product and a steady supply through out the year.
In the recent years, the sales of fried potatoes at convenience stores have been growing. Belgium and
German fried potato products are largely sold at convenience stores, particularly at medium-scale
convenience store chain such as Mini Stop (with approximately 1,770 stores). European suppliers
developed a new product using a European potato variety specifically designed for marketing in
Japanese convenience stores. In terms of volume, frozen French fry supplies from European countries
are rather limited compared to the United States. Therefore, European suppliers target their sales at
medium-scale chains. On the other hand, Japan’s large-scale convenience store chains such as Seven-
Eleven (around 12,300 stores) and Lawson (around 9,500 stores) require bigger volumes and hence sell
U.S. fried potato products.
Family restaurants such as Denny’s and Saizeriya use all types of frozen potatoes from a whole potato
to wedge-cut fries. U.S. frozen potato sales at family restaurants have been steady. U.S. suppliers have
recently concentrated marketing efforts for frozen whole potatoes towards itzakaya restaurants,
Japanese-style pubs. Retail stores also sell imported frozen potato products as well as domestically
produced potato products. Individually packed frozen potatoes from shoestrings to wedge cut fries are
also mainly sold at retail stores.
As mentioned above, starting in 2007, a Japanese food processing plant began using non-fried U.S.
frozen potatoes (HS: 0710.10) for snack manufacturing. The volume is still small compared to fried
potato products but it has been steadily increasing.
The Japanese food industry believes that Japan’s frozen potato market has potential to grow. Given
Japan’s high quality and high food safety standards, the United States is best-positioned for marketing
frozen potato products in the Japanese market. However, competitors are always looking for
opportunities to expand their sales in this country.
Policy
Japan’s testing for Coliform on U.S. Frozen Fries:
Japan applies a negative (zero) tolerance for coliform (a common microorganism) and requires
coliform testing on U.S. frozen fries entering the country. The U.S. fry processing standards do not
require a negative coliform result. The U.S. potato industry and, USDA worked closely with MHLW
and discussed the usefulness of the testing requirements. MHLW has since accepted U.S. arguments
and has shown great flexibility by allowing a phase-out of the coliform testing by the end of 2010.
Japanese MRL Issues:
On May 29, 2006 the Ministry of Health, Labor and Welfare (MHLW) introduced the positive list
system for all agricultural chemicals in food. MHLW implemented maximum residue limits (MRL)
guidance on all food products, including imported frozen potato products. MHLW has newly
established MRLs for some food commodities as well as has comprehensively reviewed the current
MRLs. The recent activities are announced in the following GAIN reports (JA0016, JA0017, JA0018
and JA0020.)
JA0016
http://gain.fas.usda.gov/Recent%20GAIN%20Publications/MRL%20Changes%20in%20Imibenconazole%20and%20other
%205%20chemicals_Tokyo_Japan_2010-05-28.pdf
JA0017
http://gain.fas.usda.gov/Recent%20GAIN%20Publications/MRL%20Changes%20in%20Cyflufenamid%20an
d%20other%206%20chemicals_Tokyo_Japan_2010-05-28.pdf
JA0018

http://gain.fas.usda.gov/Recent%20GAIN%20Publications/MRL%20changes%20in%20Azimsulfuron%20and
%20other%207%20chemicals_Tokyo_Japan_2010-05-28.pdf
JA0020
http://gain.fas.usda.gov/Recent%20GAIN%20Publications/MRLs%20for%20Ethoprophos%20Chlorethoxyfos
%20Spinetoram%20Tribufos%20Fludioxonil_Tokyo_Japan_8-11-2010.pdf
The following Website will assist you to find MRLs for a certain agricultural chemical: The Japan Food
Chemical Research Foundation http://www.m5.ws001.squarestart.ne.jp/foundation/search.html
Tariff Tables:
The applicable import duty for frozen potato products are as follows:
HS Code Description Rate of
Duty
0710.10 0710.10-
000 Frozen potatoes: Uncooked or cooked by steaming or boiling
in water 8.5%
2004.10 2004.10-
100 Frozen potatoes: Cooked, not otherwise prepared (fried
potatoes) 8.5%
2004.10-
210 Frozen potatoes: Mashed potatoes 13.6%
2004.10-
220 Frozen potatoes: Others 9.0%
The duty is charged on a CIF basis.
Trade Matrices:
Import Trade Matrix (Quantity) Country Japan Commodity 2004.10 - Frozen Potato Products Time Period: July - June Units: Metric Tons Import for: MY2007/08 Import for: MY2008/09 Import for: MY2009/10
U.S. 241,711 U.S. 253,482 U.S. 258,864

Others Others Others Canada 39,074 Canada 34,023 Canada 28,029 Belgium 6,607 Belgium 10,886 Belgium 13,059 China 5,972 New Zealand 3,506 New Zealand 4,069 New Zealand 3,658 Germany 2,425 China 2,311 Germany 2,155 China 2,191 Germany 2,018 Egypt 1,905 Egypt 1,401 Egypt 1,253
Total for Others 59,371 Total for Others 54,432 Total for Others 50,739 Others not Listed 1,093 Others not Listed 582 Others not Listed 996 Grand Total 302,175 Grand Total 308,496 Grand Total 310,599 Source: World Trade Atlas
Import Trade Matrix (Value) Country Japan Commodity 2004.10 - Frozen Potato Products Time Period: July - June Units: Millions of US Dollars Import for: MY2007/08 Import for: MY2008/09 Import for: MY2009/10
U.S. 253.4 U.S. 306.0 U.S. 314.1
Others Others Others Canada 40.6 Canada 38.4 Canada 33.5 Belgium 7.4 Belgium 13.0 Belgium 15.6 China 7.7 New Zealand 4.3 New Zealand 4.8 New Zealand 3.7 Germany 3.2 Germany 2.8 Germany 3.0 China 5.5 China 5.3 Egypt 1.5 Egypt 1.1 Egypt 1.1
Total for Others 63.9 Total for Others 65.5 Total for Others 63.1 Others not Listed 2.4 Others not Listed 1.5 Others not Listed 1.8 Grand Total 319.7 Grand Total 373.0 Grand Total 379.0 Source: World Trade Atlas
Import Trade Matrix (Quantity) Country Japan Commodity 0710.10 - Frozen Potato Products, not Fried Time Period: July - June Units: Metric Tons Import for: MY2007/08 Import for: MY2008/09 Import for: MY2009/10
U.S. 4,004 U.S. 6,381 U.S. 8,910
Others Others Others China 6,060 China 8,409 China 8,822 Colombia 220 Vietnam 294 Vietnam 291
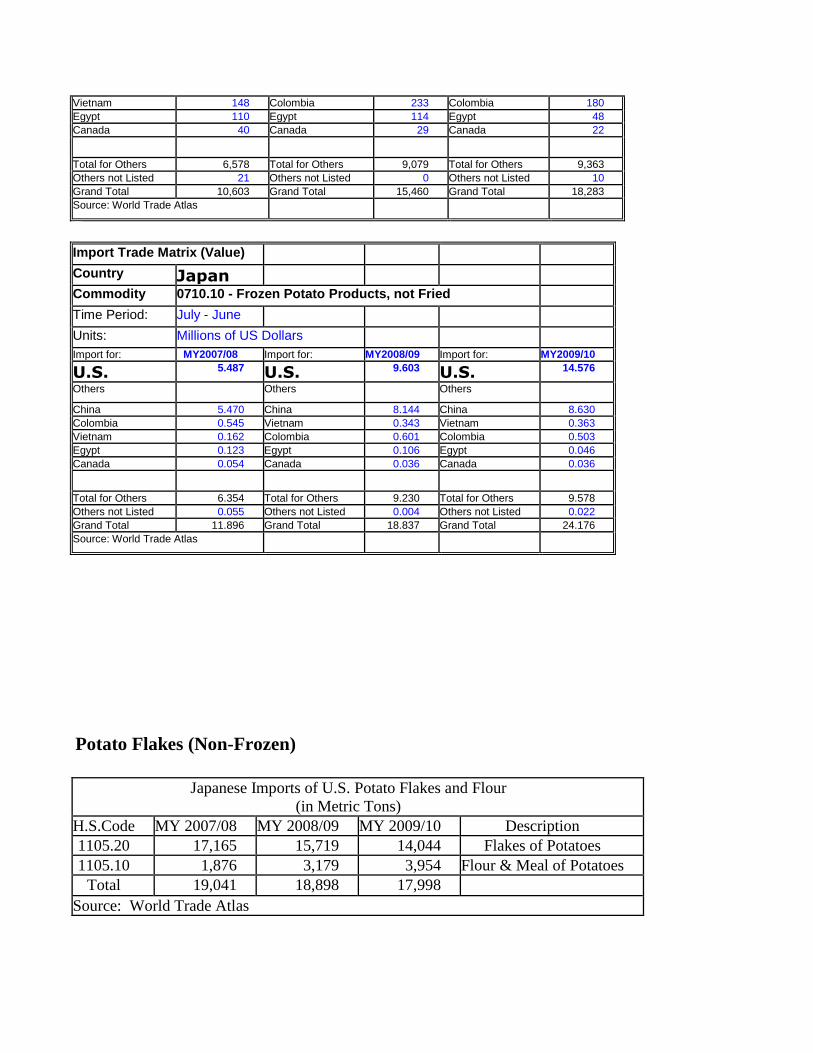
Vietnam 148 Colombia 233 Colombia 180 Egypt 110 Egypt 114 Egypt 48 Canada 40 Canada 29 Canada 22
Total for Others 6,578 Total for Others 9,079 Total for Others 9,363 Others not Listed 21 Others not Listed 0 Others not Listed 10 Grand Total 10,603 Grand Total 15,460 Grand Total 18,283 Source: World Trade Atlas
Import Trade Matrix (Value) Country Japan Commodity 0710.10 - Frozen Potato Products, not Fried Time Period: July - June Units: Millions of US Dollars Import for: MY2007/08 Import for: MY2008/09 Import for: MY2009/10
U.S. 5.487 U.S. 9.603 U.S. 14.576
Others Others Others China 5.470 China 8.144 China 8.630 Colombia 0.545 Vietnam 0.343 Vietnam 0.363 Vietnam 0.162 Colombia 0.601 Colombia 0.503 Egypt 0.123 Egypt 0.106 Egypt 0.046 Canada 0.054 Canada 0.036 Canada 0.036
Total for Others 6.354 Total for Others 9.230 Total for Others 9.578 Others not Listed 0.055 Others not Listed 0.004 Others not Listed 0.022 Grand Total 11.896 Grand Total 18.837 Grand Total 24.176 Source: World Trade Atlas
Potato Flakes (Non-Frozen)
Japanese Imports of U.S. Potato Flakes and Flour (in Metric Tons)
H.S.Code MY 2007/08 MY 2008/09 MY 2009/10 Description
1105.20 17,165 15,719 14,044 Flakes of Potatoes
1105.10 1,876 3,179 3,954 Flour & Meal of Potatoes
Total 19,041 18,898 17,998 Source: World Trade Atlas
Japan has a modest production of dehydrated potato products. According to the Japanese industry, in
MY 2010/11, domestic production of dried potato products (mainly potato flakes) is expected to be
approximately 2,000 metric tons, down approximately 30 percent from the previous season. A poor
potato crop in Hokkaido is the main reason for the expected decline in production. Secondary grade
potatoes are often used to make potato flakes. Domestic potato flakes are mainly used for soup powder
and snack manufacturing.
The United States is by far the largest supplier of potato flakes and flour to Japan, supplying
approximately 85 percent of Japan’s total imports. In MY 2009/10, the United States supplied 17,998
metric tons, valued at $29.06 million on a CIF basis. Other smaller suppliers include Germany and
China.
Japan uses U.S. dehydrated potato flakes in various food processing operations within the
manufacturing and food service sectors. Japanese reconstituted potato chips are mainly manufactured
from imported U.S. potato flakes. Pringles Japan, Yamazaki Nabisco, and Gaban are the key
manufacturers of reconstituted potato chips in Japan.
The Japanese food service sector is also an important consumer of U.S. potato flakes. An English-
style pub restaurant chain called “Hub” serves various menus items made from U.S. potato flakes such
as Sheppard pies and mashed potatoes. U.S. dehydrated potato flakes are also used for manufacturing
potato croquettes and salads often served at restaurants and at supermarkets. Several bakers use U.S.
dehy-potato flakes to improve the texture of bread. High-end restaurants also favor U.S. dehydrated
potatoes (diced, shredded, and sliced potatoes) as they are considered to be more versatile and easier to
use than fresh potatoes.
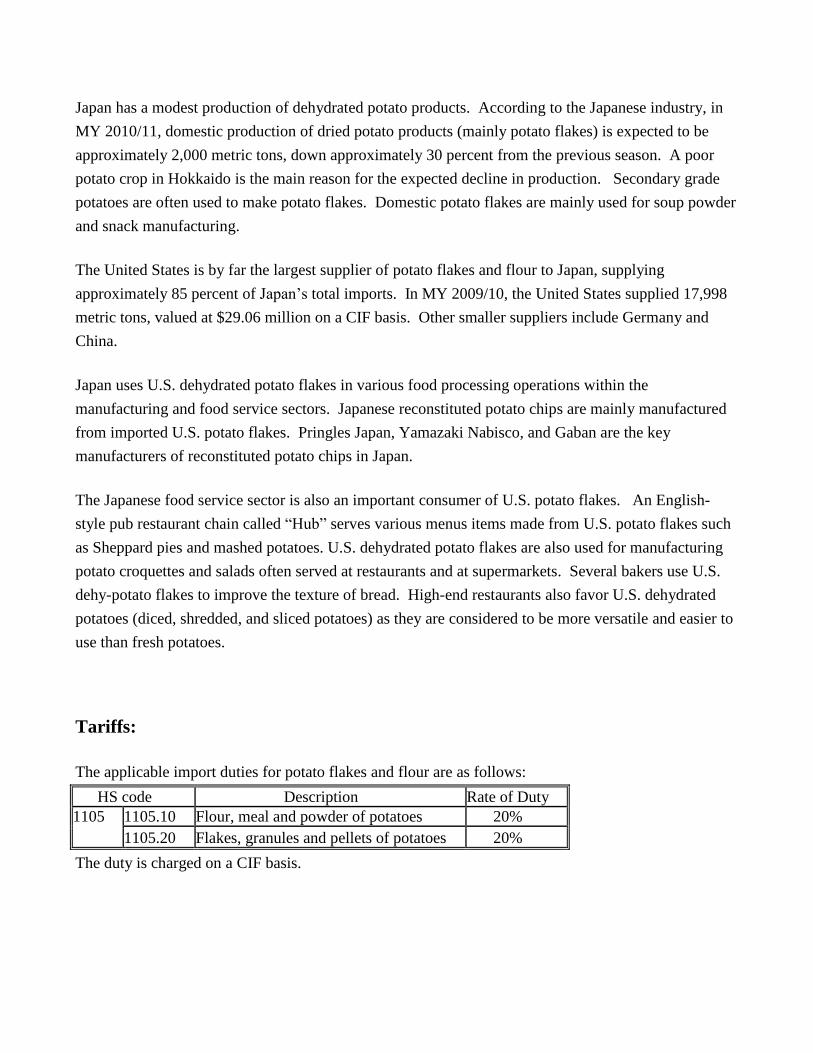
Tariffs:
The applicable import duties for potato flakes and flour are as follows:
HS code Description Rate of Duty
1105 1105.10 Flour, meal and powder of potatoes 20%
1105.20 Flakes, granules and pellets of potatoes 20%
The duty is charged on a CIF basis.
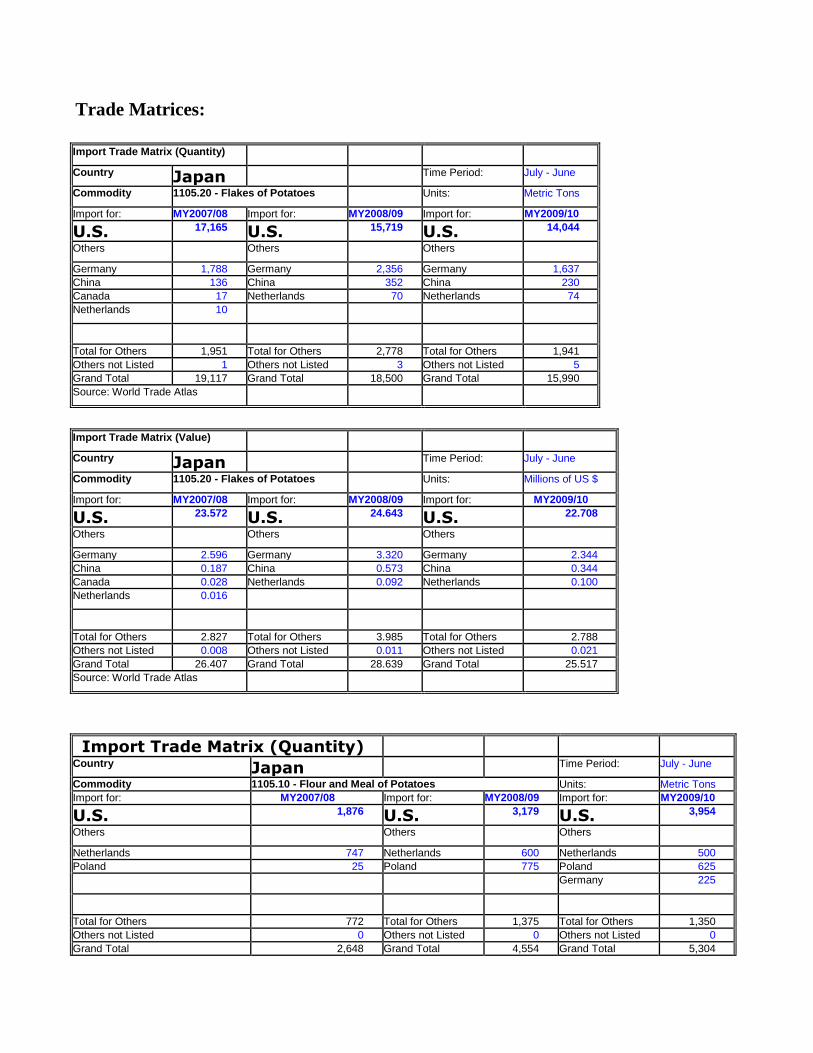
Trade Matrices:
Import Trade Matrix (Quantity) Country Japan Time Period: July - June
Commodity 1105.20 - Flakes of Potatoes Units: Metric Tons
Import for: MY2007/08 Import for: MY2008/09 Import for: MY2009/10
U.S. 17,165 U.S. 15,719 U.S. 14,044
Others Others Others Germany 1,788 Germany 2,356 Germany 1,637 China 136 China 352 China 230 Canada 17 Netherlands 70 Netherlands 74 Netherlands 10
Total for Others 1,951 Total for Others 2,778 Total for Others 1,941 Others not Listed 1 Others not Listed 3 Others not Listed 5 Grand Total 19,117 Grand Total 18,500 Grand Total 15,990 Source: World Trade Atlas
Import Trade Matrix (Value) Country Japan Time Period: July - June
Commodity 1105.20 - Flakes of Potatoes Units: Millions of US $
Import for: MY2007/08 Import for: MY2008/09 Import for: MY2009/10
U.S. 23.572 U.S. 24.643 U.S. 22.708
Others Others Others Germany 2.596 Germany 3.320 Germany 2.344 China 0.187 China 0.573 China 0.344 Canada 0.028 Netherlands 0.092 Netherlands 0.100 Netherlands 0.016
Total for Others 2.827 Total for Others 3.985 Total for Others 2.788 Others not Listed 0.008 Others not Listed 0.011 Others not Listed 0.021 Grand Total 26.407 Grand Total 28.639 Grand Total 25.517 Source: World Trade Atlas
Import Trade Matrix (Quantity) Country Japan Time Period: July - June
Commodity 1105.10 - Flour and Meal of Potatoes Units: Metric Tons Import for: MY2007/08 Import for: MY2008/09 Import for: MY2009/10
U.S. 1,876 U.S. 3,179 U.S. 3,954
Others Others Others Netherlands 747 Netherlands 600 Netherlands 500 Poland 25 Poland 775 Poland 625
Germany 225
Total for Others 772 Total for Others 1,375 Total for Others 1,350 Others not Listed 0 Others not Listed 0 Others not Listed 0 Grand Total 2,648 Grand Total 4,554 Grand Total 5,304

Source: World Trade Atlas
Import Trade Matrix (Value) Country Japan Time Period: July - June
Commodity 1105.10 - Flour and Meal of Potatoes Units: Millions of US $ Import for: MY2007/08 Import for: MY2008/09 Import for: MY2009/10
U.S. 2.951 U.S. 5.087 U.S. 6.356
Others Others Others Netherlands 1.052 Netherlands 0.777 Netherlands 0.617 Poland 0.039 Poland 1.080 Poland 0.831
Germany 0.262
Total for Others 1.091 Total for Others 1.857 Total for Others 1.710 Others not Listed 0.000 Others not Listed 0.000 Others not Listed 0.000 Grand Total 4.042 Grand Total 6.944 Grand Total 8.066 Source: World Trade Atlas