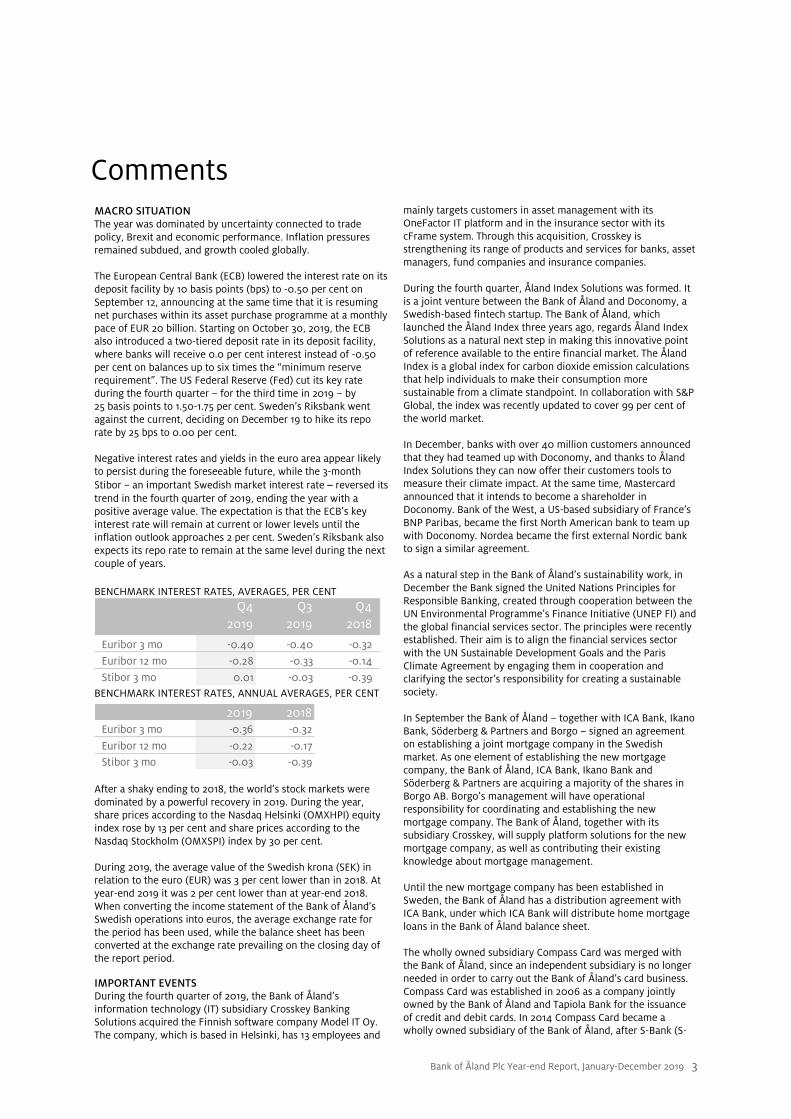
January−December 2019
28
The Bank of Åland is a bank with strong customer relationships and personalised service. The Bank has extensive financial investment expertise and at the same time can offer good financing services. The commercial bank was founded in 1919 and has been listed on the Nasdaq Helsinki Oy (Helsinki Stock Exchange) since 1942. The Bank of Åland’s Head Office is in Mariehamn. The Bank has three offices in the Åland Islands, five offices elsewhere in Finland and three offices in Sweden. A total of two subsidiaries, whose operations are connected in various ways to banking, belong to the Bank of Åland Group. Bank of Åland Plc. Registered office: Mariehamn Address: Nygatan 2, AX-22100 Mariehamn, Åland, Finland Business Identity Code: 0145019-3. Telephone: +358 204 29 011. Website: www.alandsbanken.fi January−December 2019 Compared to January - December 2018 Net operating profit increased by 15 per cent to EUR 33.2 M (29.0). Profit for the period attributable to shareholders rose by 15 per cent to EUR 26.3 M (22.9). Net interest income decreased by 1 per cent to EUR 53.9 M (54.5). Net commission income increased by 7 per cent to EUR 58.0 M (54.3). Total expenses were at an unchanged level and amounted to EUR 97.5 M (97.8). Net impairment losses on financial assets (including recoveries) totalled EUR 3.2 M (0.8), equivalent to a loan loss level of 0.08 (0.02) per cent. Return on equity after taxes (ROE) increased to 10.7 (9.8) per cent. Earnings per share increased by 14 per cent to EUR 1.69 (1.48). The common equity Tier 1 ratio amounted to 13.4 per cent (13.0). The Board of Directors proposes a regular dividend of EUR 0.80 (0.70) per share plus an anniversary dividend of EUR 0.20 per share. Future outlook: The Bank of Åland expects its net operating profit in 2020 to be better than in 2019. The fourth quarter of 2019 Compared to the fourth quarter of 2018 Net operating profit increased by 18 per cent to EUR 9.1 M (7.7). Profit for the period attributable to shareholders rose by 16 per cent to EUR 7.2 M (6.2). Net interest income increased by 6 per cent to EUR 14.0 M (13.3). Net commission income increased by 17 per cent to EUR 16.3 M (13.9). Total expenses increased by 4 per cent to EUR 25.5 M (24.6). Net impairment losses on financial assets (including recoveries) totalled EUR 1.8 M (-0.1), equivalent to a loan loss level of 0.18 (0.00) per cent. Return on equity after taxes (ROE) increased to 11.4 (10.3) per cent. Earnings per share increased by 15 per cent to EUR 0.46 (0.40). “We ended our 100 th financial year in a strong way and delivered our best net operating profit ever, EUR 33.2 M, which was 15 per cent higher than the preceding year (29.0). Return on equity after taxes (ROE) exceeded our long-term financial target, ending up at 10.7 per cent for the full year. “During the fourth quarter, we saw a strong inflow of actively managed assets and healthy lending growth. This growth came primarily from new customers. Overall growth in actively managed assets during 2019 was 23 per cent and resulted in a new record year-end figure, EUR 6,343 M (5,177). “Because of our positive trend, the Board of Directors expects net operating profit in 2020 to be better than in 2019. The Board is proposing an increased dividend of EUR 0.80 (0.70) per share, and an additional anniversary dividend of EUR 0.20 for our 100t h financial year.” Peter Wiklöf, Managing Director and Chief Executive 20 22 24 26 28 30 32 34 Q4 2018 Q1 2019 Q2 2019 Q3 2019 Q4 2019 EUR M 4-quarter moving net operating profit 6 8 10 Q4 2018 Q1 2019 Q2 2019 Q3 2019 Q4 2019 Per cent 4-quarter moving ROE 10 12 14 Q4 2018 Q1 2019 Q2 2019 Q3 2019 Q4 2019 Per cent Common equity Tier 1 ratio
Transcript of January−December 2019
The Bank of Åland is a bank with strong customer relationships and personalised service. The Bank has extensive financial investment expertise and at the same time can
offer good financing services. The commercial bank was founded in 1919 and has been listed on the Nasdaq Helsinki Oy (Helsinki Stock Exchange) since 1942. The Bank of Åland’s Head Office is in Mariehamn. The Bank has three offices in the Åland Islands, five offices elsewhere in Finland and three offices in Sweden.
A total of two subsidiaries, whose operations are connected in various ways to banking, belong to the Bank of Åland Group.
Bank of Åland Plc. Registered office: Mariehamn Address: Nygatan 2, AX-22100 Mariehamn, Åland, Finland Business Identity Code: 0145019-3. Telephone: +358 204 29 011. Website: www.alandsbanken.fi
January−December 2019 Compared to January - December 2018
Net operating profit increased by 15 per cent to EUR 33.2 M (29.0). Profit for the period attributable to shareholders rose by 15 per cent to EUR 26.3 M (22.9). Net interest income decreased by 1 per cent to EUR 53.9 M (54.5). Net commission income increased by 7 per cent to EUR 58.0 M (54.3). Total expenses were at an unchanged level and amounted to EUR 97.5 M (97.8). Net impairment losses on financial assets (including recoveries) totalled EUR 3.2 M (0.8),
equivalent to a loan loss level of 0.08 (0.02) per cent. Return on equity after taxes (ROE) increased to 10.7 (9.8) per cent. Earnings per share increased by 14 per cent to EUR 1.69 (1.48). The common equity Tier 1 ratio amounted to 13.4 per cent (13.0). The Board of Directors proposes a regular dividend of EUR 0.80 (0.70) per share plus an
anniversary dividend of EUR 0.20 per share. Future outlook: The Bank of Åland expects its net operating profit in 2020 to be better
than in 2019.
The fourth quarter of 2019 Compared to the fourth quarter of 2018
Net operating profit increased by 18 per cent to EUR 9.1 M (7.7).
Profit for the period attributable to shareholders rose by 16 per cent to EUR 7.2 M (6.2).
Net interest income increased by 6 per cent to EUR 14.0 M (13.3).
Net commission income increased by 17 per cent to EUR 16.3 M (13.9).
Total expenses increased by 4 per cent to EUR 25.5 M (24.6). Net impairment losses on financial assets (including recoveries) totalled EUR 1.8 M (-0.1),
equivalent to a loan loss level of 0.18 (0.00) per cent. Return on equity after taxes (ROE) increased to 11.4 (10.3) per cent. Earnings per share increased by 15 per cent to EUR 0.46 (0.40). “We ended our 100th financial year in a strong way and delivered our best net operating profit ever, EUR 33.2 M, which was 15 per cent higher than the preceding year (29.0). Return on equity after taxes (ROE) exceeded our long-term financial target, ending up at 10.7 per cent for the full year. “During the fourth quarter, we saw a strong inflow of actively managed assets and healthy lending growth. This growth came primarily from new customers. Overall growth in actively managed assets during 2019 was 23 per cent and resulted in a new record year-end figure, EUR 6,343 M (5,177). “Because of our positive trend, the Board of Directors expects net operating profit in 2020 to be better than in 2019. The Board is proposing an increased dividend of EUR 0.80 (0.70) per share, and an additional anniversary dividend of EUR 0.20 for our 100th financial year.”
Peter Wiklöf, Managing Director and Chief Executive
20
22
24
26
28
30
32
34
Q42018
Q12019
Q22019
Q32019
Q42019
EUR M
PlaceringsvolymPlaceringsvolym4-qua rter moving net operating profit
6
8
10
Q42018
Q12019
Q22019
Q32019
Q42019
Per cent
4-qua rter moving ROE
10
12
14
Q42018
Q12019
Q22019
Q32019
Q42019
Per cent
Common equity Tier 1 ra tio

Bank of Åland Plc Year-end Report, January-December 2019 2
Financial summary
GroupQ4
2019Q3
2019%
Q42018
%Jan-Dec
2019Jan-Dec
2018%
EUR M
Income Net interest income 14.0 13.3 5 13.3 6 53.9 54.5 -1Net commission income 16.3 13.8 18 13.9 17 58.0 54.3 7Net income from financial items at fair value 1.1 1.6 -33 0.2 3.9 1.5 Other income 5.0 4.2 21 4.9 4 18.1 17.4 4
Total income 36.4 32.9 11 32.3 13 133.9 127.6 5
Staff costs -14.6 -13.4 9 -14.3 2 -57.0 -57.1 0Other expenses -7.6 -6.3 20 -8.5 -11 -28.7 -33.4 -14Depreciation/amortisation -3.3 -2.9 17 -1.8 84 -11.8 -7.3 62
Total expenses -25.5 -22.5 13 -24.6 4 -97.5 -97.8 0
Profit before impairment losses 10.9 10.4 5 7.7 43 36.4 29.8 22
Impairment losses on financial assets, net -1.8 -0.8 0.1 -3.2 -0.8 Net operating profit 9.1 9.5 -4 7.7 18 33.2 29.0 15
Income taxes -1.9 -1.9 -1 -1.5 27 -6.9 -6.1 14Profit for the report period 7.2 7.6 -5 6.2 16 26.3 22.9 15
Attributable to:Shareholders in Bank of Åland Plc 7.2 7.6 -5 6.2 16 26.3 22.9 15
VolumeReceivables from the public and public sector 4,110 3,985 3 4,022 2Deposits from the public and public sector 3,368 3,288 2 3,304 2Actively managed assets 1 6,343 5,788 10 5,177 23Equity capital 258 247 5 242 7Balance sheet total 5,607 5,555 1 5,558 1Risk exposure amount 1,583 1,571 1 1,578 0
Financial ratiosReturn on equity after taxes, % (ROE) 2 11.4 12.3 10.3 10.7 9.8Return on equity after taxes, % (ROE), moving 12-month average to end of report period 10.7 10.5 9.8Expense/income ratio 3 0.70 0.69 0.76 0.73 0.77Loan loss level, % 4 0.18 0.08 0.00 0.08 0.02Liquidity coverage ratio (LCR), % 5 139 163 120Loan/deposit ratio, % 6 122 121 122Core funding ratio, % 7 90 88 90Equity/assets ratio, % 8 4.6 4.4 4.4Common equtiy Tier 1 capital ratio, % 9 13.4 13.3 13.0Earnings per share, EUR 10 0.46 0.49 -5 0.40 15 1.69 1.48 14Earnings per share after dilution, EUR 0.46 0.49 -5 0.40 16 1.69 1.48 14Earnings per share, EUR, moving 12-month average to end of report period 1.69 1.63 4 1.48 14Equity capital per share, EUR 11 16.61 15.86 5 15.67 6Equity capital per share after dilution, EUR 16.59 15.83 5 15.58 6Market price per Series A share, EUR 17.00 14.70 16 13.30 28Market price per Series B share, EUR 16.55 14.85 11 13.10 26Number of shares outstanding, 000s 15,551 15,551 15,472 1Number of shares outstanding, after dilution, 000s 15,601 15,587 0 15,590 0Working hours re-calculated to full-time equivalent positions 705 713 -1 692 2 700 691 1
3 Expenses / Income
5 Liquidity coverage ratio (LCR) = liquid assets, level 1 and 2 / 30-day net outflow6 Receivables from the public and public sector / Deposits from the public and public sector
1 Actively managed assets encompassed managed assets in the Group’s own mutual funds, as well as discretionary and advisory securities volume.2 Profit for the report period attributable to shareholders / Average shareholders´portion of equity capital
4 Impairment losses on loan portfolio and other commitments / Receivables from the public and public sector at the beginning of the period
8 Equity capital / Balance sheet total
7 Receivables from the public and public sector / Deposits including certificates of deposit, index bonds and debentures issued to the public and public sector plus covered bonds issued
11 Shareholders’ portion of equity capital / Number of shares on closing day
9 Common equity Tier 1 capital / Risk exposure amount
10 Shareholders’ portion of earnings for the period / Avarage number of shares
Bank of Åland Plc Year-end Report, January-December 2019 3
Comments
MACRO SITUATION The year was dominated by uncertainty connected to trade policy, Brexit and economic performance. Inflation pressures remained subdued, and growth cooled globally. The European Central Bank (ECB) lowered the interest rate on its deposit facility by 10 basis points (bps) to -0.50 per cent on September 12, announcing at the same time that it is resuming net purchases within its asset purchase programme at a monthly pace of EUR 20 billion. Starting on October 30, 2019, the ECB also introduced a two-tiered deposit rate in its deposit facility, where banks will receive 0.0 per cent interest instead of -0.50 per cent on balances up to six times the “minimum reserve requirement”. The US Federal Reserve (Fed) cut its key rate during the fourth quarter – for the third time in 2019 – by 25 basis points to 1.50-1.75 per cent. Sweden’s Riksbank went against the current, deciding on December 19 to hike its repo rate by 25 bps to 0.00 per cent. Negative interest rates and yields in the euro area appear likely to persist during the foreseeable future, while the 3-month Stibor − an important Swedish market interest rate – reversed its trend in the fourth quarter of 2019, ending the year with a positive average value. The expectation is that the ECB’s key interest rate will remain at current or lower levels until the inflation outlook approaches 2 per cent. Sweden’s Riksbank also expects its repo rate to remain at the same level during the next couple of years. BENCHMARK INTEREST RATES, AVERAGES, PER CENT
Q42019
Q32019
Q42018
Euribor 3 mo -0.40 -0.40 -0.32Euribor 12 mo -0.28 -0.33 -0.14Stibor 3 mo 0.01 -0.03 -0.39
BENCHMARK INTEREST RATES, ANNUAL AVERAGES, PER CENT
2019 2018Euribor 3 mo -0.36 -0.32
Euribor 12 mo -0.22 -0.17Stibor 3 mo -0.03 -0.39
After a shaky ending to 2018, the world’s stock markets were dominated by a powerful recovery in 2019. During the year, share prices according to the Nasdaq Helsinki (OMXHPI) equity index rose by 13 per cent and share prices according to the Nasdaq Stockholm (OMXSPI) index by 30 per cent. During 2019, the average value of the Swedish krona (SEK) in relation to the euro (EUR) was 3 per cent lower than in 2018. At year-end 2019 it was 2 per cent lower than at year-end 2018. When converting the income statement of the Bank of Åland’s Swedish operations into euros, the average exchange rate for the period has been used, while the balance sheet has been converted at the exchange rate prevailing on the closing day of the report period.
IMPORTANT EVENTS During the fourth quarter of 2019, the Bank of Åland’s information technology (IT) subsidiary Crosskey Banking Solutions acquired the Finnish software company Model IT Oy. The company, which is based in Helsinki, has 13 employees and
mainly targets customers in asset management with its OneFactor IT platform and in the insurance sector with its cFrame system. Through this acquisition, Crosskey is strengthening its range of products and services for banks, asset managers, fund companies and insurance companies. During the fourth quarter, Åland Index Solutions was formed. It is a joint venture between the Bank of Åland and Doconomy, a Swedish-based fintech startup. The Bank of Åland, which launched the Åland Index three years ago, regards Åland Index Solutions as a natural next step in making this innovative point of reference available to the entire financial market. The Åland Index is a global index for carbon dioxide emission calculations that help individuals to make their consumption more sustainable from a climate standpoint. In collaboration with S&P Global, the index was recently updated to cover 99 per cent of the world market. In December, banks with over 40 million customers announced that they had teamed up with Doconomy, and thanks to Åland Index Solutions they can now offer their customers tools to measure their climate impact. At the same time, Mastercard announced that it intends to become a shareholder in Doconomy. Bank of the West, a US-based subsidiary of France’s BNP Paribas, became the first North American bank to team up with Doconomy. Nordea became the first external Nordic bank to sign a similar agreement. As a natural step in the Bank of Åland’s sustainability work, in December the Bank signed the United Nations Principles for Responsible Banking, created through cooperation between the UN Environmental Programme’s Finance Initiative (UNEP FI) and the global financial services sector. The principles were recently established. Their aim is to align the financial services sector with the UN Sustainable Development Goals and the Paris Climate Agreement by engaging them in cooperation and clarifying the sector’s responsibility for creating a sustainable society. In September the Bank of Åland – together with ICA Bank, Ikano Bank, Söderberg & Partners and Borgo – signed an agreement on establishing a joint mortgage company in the Swedish market. As one element of establishing the new mortgage company, the Bank of Åland, ICA Bank, Ikano Bank and Söderberg & Partners are acquiring a majority of the shares in Borgo AB. Borgo’s management will have operational responsibility for coordinating and establishing the new mortgage company. The Bank of Åland, together with its subsidiary Crosskey, will supply platform solutions for the new mortgage company, as well as contributing their existing knowledge about mortgage management. Until the new mortgage company has been established in Sweden, the Bank of Åland has a distribution agreement with ICA Bank, under which ICA Bank will distribute home mortgage loans in the Bank of Åland balance sheet. The wholly owned subsidiary Compass Card was merged with the Bank of Åland, since an independent subsidiary is no longer needed in order to carry out the Bank of Åland’s card business. Compass Card was established in 2006 as a company jointly owned by the Bank of Åland and Tapiola Bank for the issuance of credit and debit cards. In 2014 Compass Card became a wholly owned subsidiary of the Bank of Åland, after S-Bank (S-

Bank of Åland Plc Year-end Report, January-December 2019 4
Pankki) had acquired Tapiola Bank and S-Bank had taken over the card business handled by Compass Card on behalf of Tapiola Bank’s customers. In April, the Bank was included for the first time in Europe’s largest brand study on sustainability, the Sustainable Brand Index. Statistics for 2018 show that the Bank of Åland decreased its carbon footprint by about 14 per cent compared to the preceding year. The Bank thereby exceeded its target, which was a decrease of 10 per cent. Together with its customers, the Bank of Åland is continuing its commitment to a cleaner Baltic Sea. In 2019 the Baltic Sea Project contributed EUR 300,000 to a number of projects that promote the health of the Baltic Sea. Since 1997 the Bank of Åland has awarded EUR 2.3 M to various environmentally related projects. As part of its responsible investment strategy, the Bank of Åland launched a new sustainable bond fund, Ålandsbanken Green Bond ESG. The fund was granted the Nordic Swan Ecolabel, making it the first Finnish bond fund to carry this label. The fund invests in green bonds and in bonds issued by companies with the best sustainability ratings. The aim of the fund’s operations is to offer an opportunity for fund investors to earn a competitive fixed income return in an environmentally sound and sustainable manner. For the sixth consecutive year, the Bank of Åland (Ålandsbanken) Euro Bond Fund was named the best Nordic Fund in its category and received the prestigious Lipper Fund Award Nordic. The Fund won the award for all management periods that were analysed: 3, 5 and 10 years. The Annual General Meeting (AGM) on April 3, 2019 re-elected the Board of Directors consisting of Nils Lampi, Christoffer Taxell, Åsa Ceder, Anders Å. Karlsson, Göran Persson, Ulrika Valassi and Anders Wiklöf. At the statutory meeting of the Board the same day, Nils Lampi was elected as Chairman and Christoffer Taxell as Deputy Chairman of the Board. Göran Persson resigned from the Board on April 29, however, in light of his nomination as Chairman of the Board of Swedbank AB (publ). During 2019 the number of Series B shares outstanding increased by 79,813 as a result of the Bank’s obligations within the framework of its incentive and share savings programmes. EARNINGS FOR JANUARY – DECEMBER 2019 Profit for the period attributable to shareholders increased by EUR 3.4 M or 15 per cent to EUR 26.3 M (22.9). In accordance with the prevailing regulator-based reporting interpretations, and in line with other Finnish banks, starting in 2019 the Bank of Åland has chosen to recognise the entire annual cost of the stability fee in the first quarter, when liability for this fee arises, instead of applying a straight-line accrual of this cost over the four quarters of the year. The estimated annual cost in the first quarter amounted to EUR 2.3 M. During the second quarter, the final fee was set at EUR 1.8 M. The Bank of Åland’s earnings will thus show greater seasonal variations, with weaker first quarter earnings. Historical periods have been restated for the sake of comparability. Net operating profit increased by EUR 4.2 M or 15 per cent to EUR 33.2 M (29.0).
Return on equity after taxes (ROE) increased to 10.7 per cent (9.8). Total income rose by EUR 6.3 M or 5 per cent to EUR 133.9 M (127.6). Net interest income fell by EUR 0.6 M or 1 per cent to EUR 53.9 M (54.5). The decrease primarily came from Swedish operations, with the depreciation of the krona together with a narrower lending margin – due to a reweighting towards lower risk in the portfolio – adversely affecting net interest income. In addition, because of IFRS 16, leases are now recognised as an estimated interest expense plus an estimated depreciation, instead of as an operating expense. Net commission income increased by EUR 3.7 M or 7 per cent to EUR 58.0 M (54.3), mainly as a consequence of higher mutual fund commissions. Net income on financial items increased by EUR 2.4 M to EUR 3.9 M (1.5), mainly thanks to higher capital gains in the liquidity portfolio. Information technology (IT) income rose by EUR 1.1 M or 7 per cent to EUR 17.5 M (16.4), primarily due to increased project income at Crosskey, the Bank’s IT subsidiary. Total expenses were essentially unchanged and amounted to EUR 97.5 M (97.8). The stability fee decreased by EUR 0.8 M or 31 per cent to EUR 1.8 M (2.6). IT expenses decreased by EUR 1.0 M or 10 per cent, principally because of lower project expenses. Depreciation rose by a full EUR 4.5 M or 62 per cent, which was largely explained by reclassification of lease expenses in compliance with IFRS 16. Amortisation of intangible assets also increased. Net impairment losses on financial assets increased by EUR 2.4 M to EUR 3.2 M (0.8), equivalent to a loan loss level of 0.08 per cent (0.02). Tax expense amounted to EUR 6.9 M (6.1), equivalent to an effective tax rate of 20.7 (20.9) per cent. EARNINGS FOR THE FOURTH QUARTER OF 2019 Profit for the period attributable to shareholders amounted to EUR 7.2 M (6.2), which was an increase of EUR 1.0 M or 16 per cent from the fourth quarter of 2018. Net operating profit increased by EUR 1.4 M or 18 per cent to EUR 9.1 M (7.7). Return on equity after taxes (ROE) amounted to 11.4 (10.3) per cent. Total income increased by EUR 4.2 M or 13 per cent to EUR 36.4 M (32.3). Net interest income increased by EUR 0.7 M or 6 per cent to EUR 14.0 M (13.3), mainly thanks to higher lending volume. Net commission income increased by EUR 2.4 M or 17 per cent to EUR 16.3 M (13.9), mainly as a consequence of higher mutual fund and securities commissions. Net income on financial items increased by EUR 0.9 M to EUR 1.1 M (0.2), mainly thanks to higher capital gains in the liquidity portfolio. IT income rose by EUR 0.4 M or 10 per cent to EUR 4.8 M (4.4), primarily due to higher project income.
Bank of Åland Plc Year-end Report, January-December 2019 5
Total expenses increased by EUR 0.9 M or 4 per cent to EUR 25.5 M (24.6). Net impairment losses on financial assets amounted to EUR 1.8 M (-0.1), equivalent to a loan loss level of 0.18 per cent (0.00). STRATEGIC BUSINESS AREAS The Group’s EUR 4.2 M increase in net operating profit to EUR 33.2 M was allocated as follows: Private Banking +2.1 (higher income and lower
expenses) Premium Banking -3.3 (higher impairment losses) IT +0.9 (higher project income) Corporate Units & +4.5 (higher capital gains)
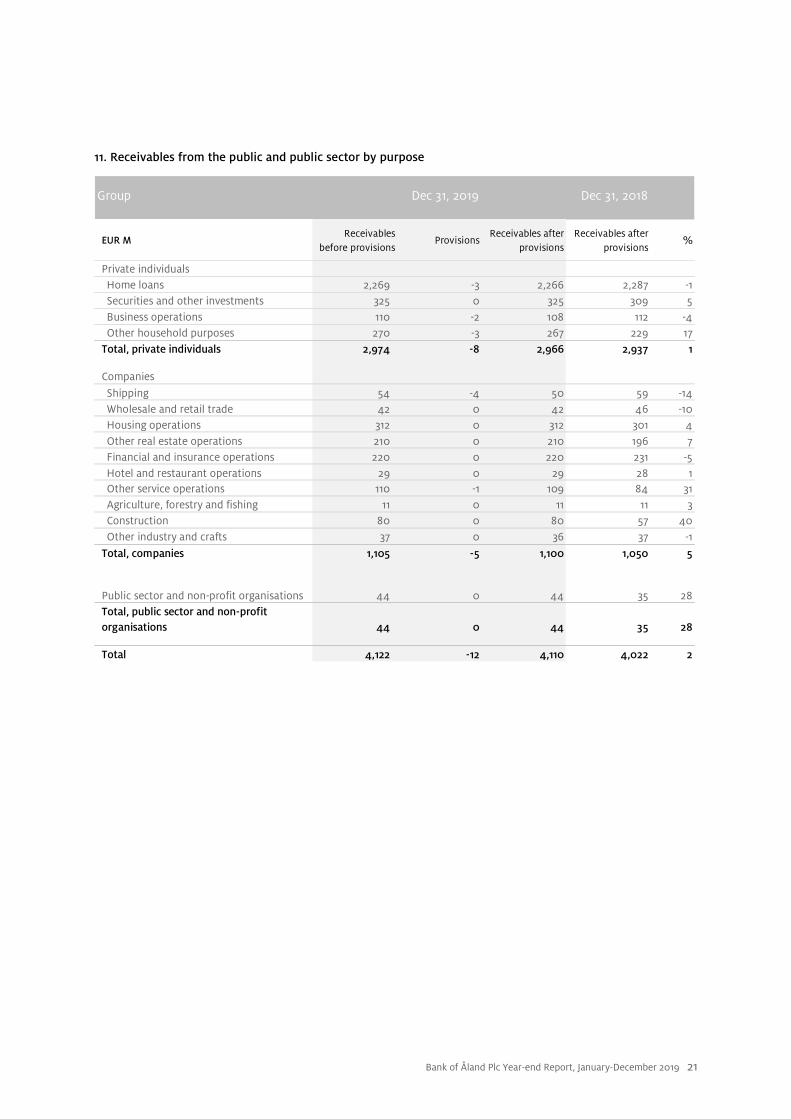
Eliminations BUSINESS VOLUME Actively managed assets on behalf of customers increased by EUR 1,166 M or 23 per cent compared to year-end 2018 and amounted to EUR 6,343 M (5,177). The increase was due to both positive net flows and higher market values. Deposits from the public increased by 2 per cent compared to year-end 2018 and amounted to EUR 3,368 M (3,304). Receivables from the public increased by 2 per cent compared to year-end 2018 and amounted to EUR 4,110 M (4,022). CREDIT QUALITY Lending to private individuals comprised 72 per cent of the loan portfolio. Home mortgage loans accounted for 76 per cent of lending to private individuals. Loans for the purchase of securities, with market-listed securities as collateral, comprised the second-largest type of lending to individuals. Historically, the Bank of Åland has not had any substantial loan losses on this type of lending. The corporate portfolio has a close affinity with the retail portfolio, since many of the companies are owned by customers who, as individuals, are also Private Banking customers. Stage 3 loans increased during the report period by EUR 13.6 M to EUR 33.5 M. Stage 3 loans as a share of gross lending to the public totalled 0.81 per cent (0.49). The level of provisions for Stage 3 loans amounted to 33 (47) per cent. Most of these loans have good collateral. The Bank of Åland Group had EUR 12.4 M (11.3) in impairment loss provisions, of which EUR 0.5 M (0.9) in Stage 1; EUR 0.9 M (1.2) in Stage 2 and EUR 11.1 M (9.3) in Stage 3. LIQUIDITY AND BORROWING The Bank of Åland’s liquidity reserve in the form of cash and deposits with the central bank, account balances and investments with other banks, liquid interest-bearing securities plus holdings of unencumbered covered bonds issued by the Bank amounted to EUR 1,129 M on December 31, 2019 (1,195). This was equivalent to 20 (22) per cent of total assets and 27 (30) per cent of receivables from the public. Starting on October 30, 2019, the European Central Bank introduced a two-tiered deposit rate in its deposit facility, where banks will receive 0.0 per cent interest instead of -0.50 per cent on balances up to six times the “minimum reserve requirement”. In the Bank of Åland’s case, this represents about EUR 150 M with a zero interest rate instead of a negative interest rate.
In March, the Bank of Åland issued EUR 300 M in covered bonds with a five-year maturity. In March, SEK 1,000 M in covered bonds matured. In June, EUR 100 M in covered bonds matured. In December, a further SEK 750 M in covered bonds matured. On December 31, 2019, the average remaining maturity of bonds outstanding was about 2.5 (2.7) years. On December 31, 2019, the Bank of Åland’s core funding ratio, defined as receivables from the public divided by deposits from the public − including certificates of deposit, index bonds and subordinated debentures issued to the public, as well as covered bonds issued − amounted to 90 (90) per cent. The loan/deposit ratio amounted to 122 (122) per cent. Of the Bank of Åland’s external funding sources aside from equity capital, deposits from the public accounted for 65 (64) per cent and covered bonds issued accounted for 22 (22) per cent. The liquidity coverage ratio (LCR) amounted to 139 (120) per cent. The net stable funding ratio (NSFR) amounted to 115 (113) per cent. RATING The Bank of Åland has a credit rating from the Standard & Poor’s Global Ratings agency of BBB/A-2 with a positive outlook for its long- and short-term borrowing. Covered bonds issued by the Bank of Åland have a credit rating of AAA with a stable outlook. EQUITY AND CAPITAL ADEQUACY During the report period, equity capital changed in the amount of profit for the period, EUR 26.3 M; other comprehensive income, EUR 0.0 M; the issuance of new shares as part of the incentive programme, EUR 0.4 M; EUR 0.2 M related to the share savings programme; and payment to shareholders of a dividend totalling EUR -10.9 M. On December 31, 2019, equity capital amounted to EUR 258.4 M (242.4). Other comprehensive income included re-measurements of defined-benefit pension plans by EUR -2.2 M after taxes, in compliance with IAS 19, and a change in the value of equity instruments by EUR 3.7 M. Common equity Tier 1 capital rose by EUR 7.1 M or 3 per cent during 2019 to EUR 211.5 M (204.4), mainly thanks to comprehensive income for the period. The risk exposure amount was at an unchanged level and amounted to EUR 1,583 M (1,578). IFRS 16 led to an increase in the risk exposure amount by EUR 14 M. The risk exposure amount for credit risk, excluding the risk weight floor for mortgage loans and IFRS 16, decreased by EUR 23 M, while the risk exposure amount for the risk weight floor related to mortgage loans increased by EUR 7 M. The operational risk exposure amount, calculated using a three-year moving average of the Group’s income, increased by EUR 7 M. The common equity Tier 1 capital ratio increased to 13.4 (13.0) per cent. Since the Bank of Åland has no hybrid capital, its common equity Tier 1 capital ratio is the same as its Tier 1 capital ratio. The total capital ratio increased to 15.8 (15.4) per cent.

Bank of Åland Plc Year-end Report, January-December 2019 6
In addition to the basic capital requirement, various buffer requirements apply. These are mainly imposed by national regulatory authorities. The capital conservation buffer requirement, 2.5 per cent of common equity Tier 1 capital, applies in all European Union countries. The countercyclical capital buffer requirement may vary between 0-2.5 per cent. For Finnish exposures, the requirement is currently 0.0 per cent. For Swedish exposures, the requirement was raised from 2.0 per cent to 2.5 per cent starting on September 19, 2019. The Finnish FSA has identified systemically important institutions in Finland and has imposed individual buffer requirements for them. The Bank of Åland is not included in the buffer requirements for systemically important institutions. Because of Nordea’s move of its head office from Sweden to Finland, the Board of the Finnish FSA decided that starting on July 1, 2019 it would introduce a systemic risk buffer for all credit institutions in the country. The purpose of the buffer is to strengthen the risk tolerance of all credit institutions to structural systemic risks. For the Bank of Åland, a buffer requirement of 1.0 per cent applies. This requirement must be covered by common equity Tier 1 capital. The Finnish FSA has established a buffer requirement related to Pillar 2 capital adequacy regulations totalling 1.5 per cent of the Group’s risk exposure amount (REA). This requirement is related to credit concentration risk (1.0 per cent of REA) and interest rate risk in the balance sheet (0.5 per cent of REA). The requirement, which must be covered by common equity Tier 1 capital, went into effect starting in the third quarter of 2018. When all these buffer requirements are taken into account, the minimum levels for the Bank of Åland will be: Common equity Tier 1 capital ratio 10.7 per cent Tier 1 capital ratio 12.2 per cent Total capital ratio 14.2 per cent In relation to the above buffer requirements, the Bank of Åland has a substantial capital surplus: Common equity Tier 1 capital ratio +2.7 per cent Tier 1 capital ratio +1.2 per cent Total capital ratio +1.6 per cent The Bank of Åland has no minimum requirement for own funds and eligible liabilities (MREL) under European Union regulations. DIVIDEND The Board of Directors proposes that the Annual General Meeting approve the payment of a regular divided of EUR 0.80 per share (0.70) plus an anniversary dividend of EUR 0.20 per share, equivalent to a total amount of EUR 15.6 M. The regular dividend is equivalent to a 47 per cent payout ratio, while the anniversary dividend is equivalent to a 12 per cent payout ratio. IMPORTANT EVENTS AFTER CLOSE OF REPORT PERIOD No important events have occurred since the close of the report period. RISK AND UNCERTAINTIES The Bank of Åland’s earnings are affected by external changes that the Company itself cannot control. Among other things, the Group’s trend of earnings is affected by macroeconomic changes and changes in general interest rates, share prices and exchange
rates, along with higher expenses due to regulatory decisions and directives as well as the competitive situation. The Group aims at achieving operations with reasonable and carefully considered risks. The Group is exposed to credit risk, liquidity risk, market risk, operational risk and business risk. The Bank does not engage in trading for its own account. FUTURE OUTLOOK The Bank of Åland expects its net operating profit in 2020 to be better than in 2019. The Bank of Åland is especially dependent on developments in the fixed income and stock markets. There is concern about the economic trends in various important markets. For this reason, there is some uncertainty in the Bank’s current forecast of the future. GENERAL MEETING The Annual General Meeting will be held on Thursday, April 2, 2020. FINANCIAL INFORMATION The Annual Report for 2019 will be published on Friday, February 28, 2020. The corporate governance report is included in the Annual Report, while the risk report (Pillar 3) will be published separately at the same time as the Annual Report. The Interim Report for the period January−March 2020 will be published on Friday, April 24, 2020. The Half-year Financial Report for the period January−June 2020 will be published on Friday, July 17, 2020. The Interim Report for the period January−September 2020 will be published on Thursday, October 22, 2020. This Year-end Report is unaudited.
Mariehamn, February 7, 2020 THE BOARD OF DIRECTORS
Bank of Åland Plc Year-end Report, January-December 2019 7
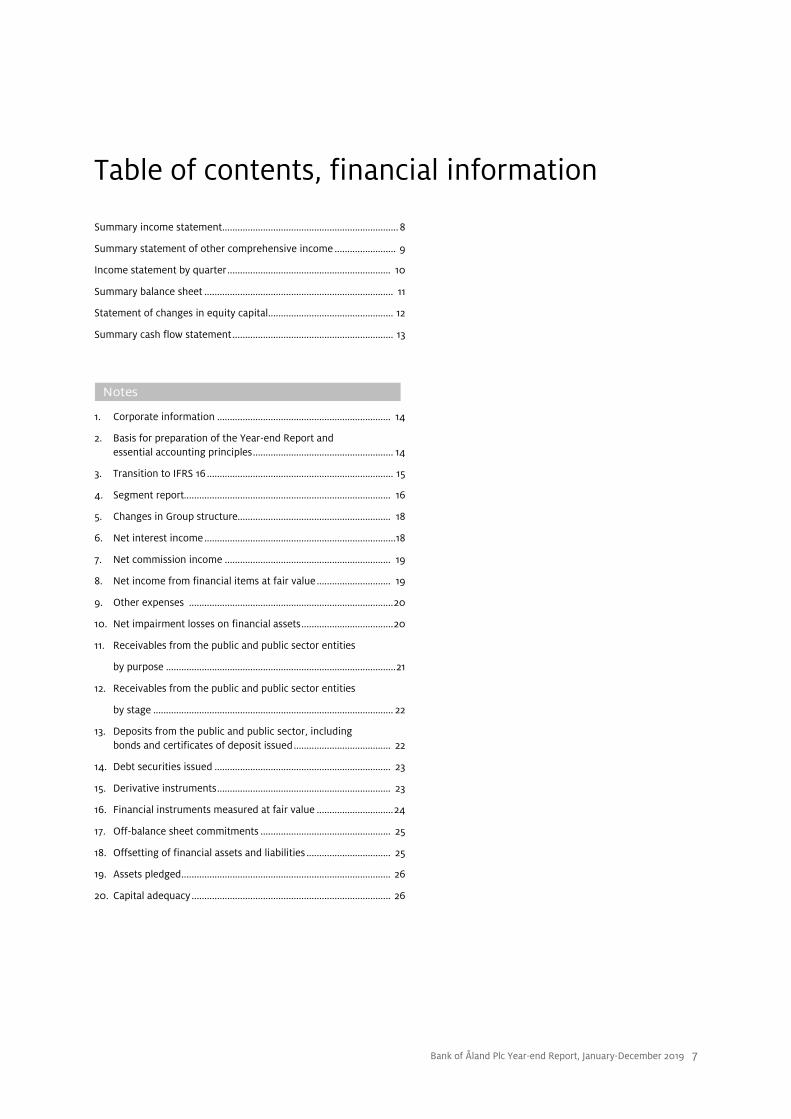
Table of contents, financial information
Summary income statement ..................................................................... 8
Summary statement of other comprehensive income ........................ 9
Income statement by quarter ................................................................ 10
Summary balance sheet .......................................................................... 11
Statement of changes in equity capital ................................................. 12
Summary cash flow statement ............................................................... 13
Notes
1. Corporate information .................................................................... 14
2. Basis for preparation of the Year-end Report and essential accounting principles ....................................................... 14
3. Transition to IFRS 16 ......................................................................... 15
4. Segment report................................................................................. 16
5. Changes in Group structure............................................................ 18
6. Net interest income ...........................................................................18
7. Net commission income ................................................................. 19
8. Net income from financial items at fair value ............................. 19
9. Other expenses ................................................................................ 20
10. Net impairment losses on financial assets .................................... 20
11. Receivables from the public and public sector entities
by purpose .......................................................................................... 21
12. Receivables from the public and public sector entities
by stage .............................................................................................. 22
13. Deposits from the public and public sector, including bonds and certificates of deposit issued ...................................... 22
14. Debt securities issued ..................................................................... 23
15. Derivative instruments .................................................................... 23
16. Financial instruments measured at fair value .............................. 24
17. Off-balance sheet commitments ................................................... 25
18. Offsetting of financial assets and liabilities ................................. 25
19. Assets pledged .................................................................................. 26
20. Capital adequacy .............................................................................. 26

Bank of Åland Plc Year-end Report, January-December 2019 8
Summary income statement
Group NoteQ4
2019Q3
2019%
Q42018
%Jan-Dec
2019Jan-Dec
2018%
EUR M
Net interest income 6 14.0 13.3 5 13.3 6 53.9 54.5 -1Net commission income 7 16.3 13.8 18 13.9 17 58.0 54.3 7Net income from financial items at fair value 8 1.1 1.6 -33 0.2 3.9 1.5 IT income 4.8 4.0 20 4.4 10 17.5 16.4 7Other operating income 0.2 0.1 36 0.4 -58 0.7 1.0 -35
Total income 36.4 32.9 11 32.3 13 133.9 127.6 5
Staff costs -14.6 -13.4 9 -14.3 2 -57.0 -57.1 0Other expenses 9 -7.6 -6.3 20 -8.5 -11 -28.7 -33.4 -14Depreciation/amortisation -3.3 -2.9 17 -1.8 84 -11.8 -7.3 62Total expenses -25.5 -22.5 13 -24.6 4 -97.5 -97.8 0
Profit before impairment losses 10.9 10.4 5 7.7 43 36.4 29.8 22
Impairment losses on financial assets, net 10 -1.8 -0.8 0.1 -3.2 -0.8 Net operating profit 9.1 9.5 -4 7.7 18 33.2 29.0 15
Income taxes -1.9 -1.9 -1 -1.5 27 -6.9 -6.1 14
Profit for the period 7.2 7.6 -5 6.2 16 26.3 22.9 15
Attributable to:Non-controlling interests 0.0 0.0 0.0 -3 0.0 0.0 Shareholders in Bank of Åland Plc 7.2 7.6 -5 6.2 16 26.3 22.9 15
Earnings per share, EUR 0.46 0.49 -5 0.40 15 1.69 1.48 14Earnings per share after dilution, EUR 0.46 0.49 -5 0.40 16 1.69 1.48 14Earnings per share, EUR, moving 12-month average to end of report period 1.69 1.63 4 1.48 14
Bank of Åland Plc Year-end Report, January-December 2019 9
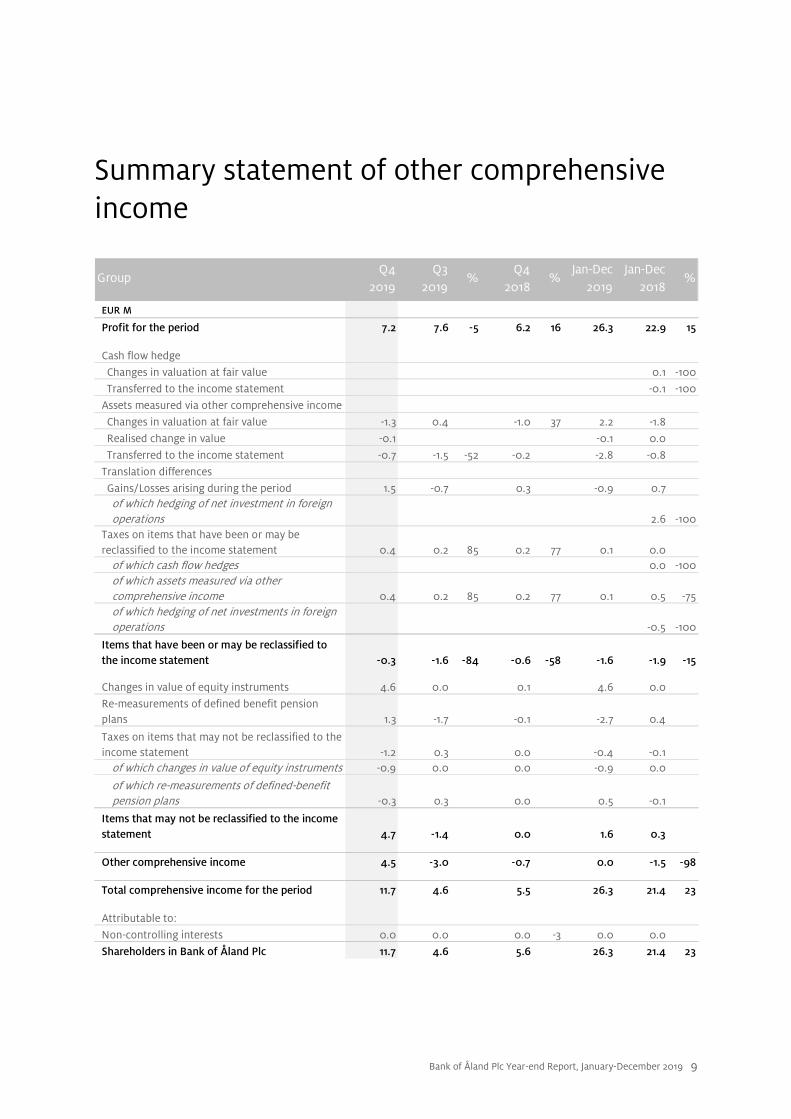
Summary statement of other comprehensive income
GroupQ4
2019Q3
2019%
Q42018
%Jan-Dec
2019Jan-Dec
2018%
EUR M
Profit for the period 7.2 7.6 -5 6.2 16 26.3 22.9 15
Cash flow hedge
Changes in valuation at fair value 0.1 -100Transferred to the income statement -0.1 -100
Assets measured via other comprehensive income
Changes in valuation at fair value -1.3 0.4 -1.0 37 2.2 -1.8
Realised change in value -0.1 -0.1 0.0
Transferred to the income statement -0.7 -1.5 -52 -0.2 -2.8 -0.8
Translation differences
Gains/Losses arising during the period 1.5 -0.7 0.3 -0.9 0.7 of which hedging of net investment in foreign operations 2.6 -100
Taxes on items that have been or may be reclassified to the income statement 0.4 0.2 85 0.2 77 0.1 0.0
of which cash flow hedges 0.0 -100of which assets measured via other comprehensive income 0.4 0.2 85 0.2 77 0.1 0.5 -75of which hedging of net investments in foreign operations -0.5 -100
Items that have been or may be reclassified to the income statement -0.3 -1.6 -84 -0.6 -58 -1.6 -1.9 -15
Changes in value of equity instruments 4.6 0.0 0.1 4.6 0.0
Re-measurements of defined benefit pension plans 1.3 -1.7 -0.1 -2.7 0.4
Taxes on items that may not be reclassified to the income statement -1.2 0.3 0.0 -0.4 -0.1
of which changes in value of equity instruments -0.9 0.0 0.0 -0.9 0.0
of which re-measurements of defined-benefit pension plans -0.3 0.3 0.0 0.5 -0.1
Items that may not be reclassified to the income statement 4.7 -1.4 0.0 1.6 0.3
Other comprehensive income 4.5 -3.0 -0.7 0.0 -1.5 -98
Total comprehensive income for the period 11.7 4.6 5.5 26.3 21.4 23
Attributable to:
Non-controlling interests 0.0 0.0 0.0 -3 0.0 0.0
Shareholders in Bank of Åland Plc 11.7 4.6 5.6 26.3 21.4 23
Bank of Åland Plc Year-end Report, January-December 2019 10
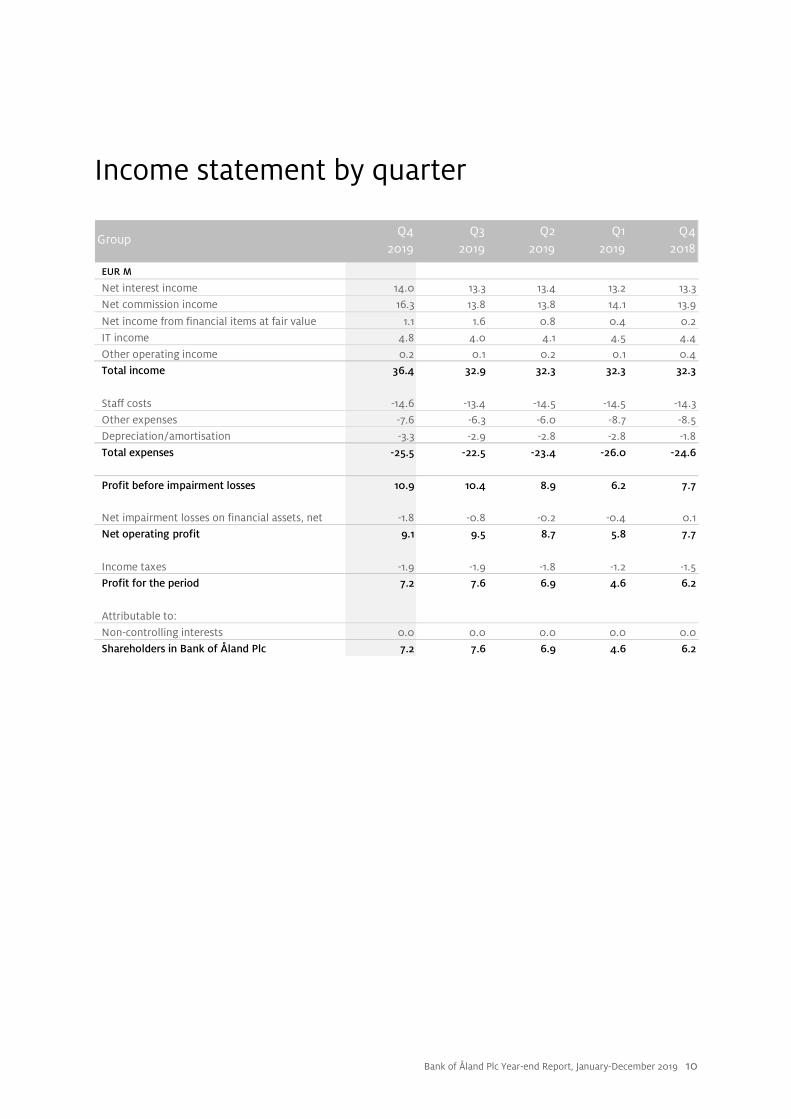
Income statement by quarter
GroupQ4
2019Q3
2019Q2
2019Q1
2019Q4
2018
EUR M
Net interest income 14.0 13.3 13.4 13.2 13.3
Net commission income 16.3 13.8 13.8 14.1 13.9
Net income from financial items at fair value 1.1 1.6 0.8 0.4 0.2
IT income 4.8 4.0 4.1 4.5 4.4
Other operating income 0.2 0.1 0.2 0.1 0.4Total income 36.4 32.9 32.3 32.3 32.3
Staff costs -14.6 -13.4 -14.5 -14.5 -14.3
Other expenses -7.6 -6.3 -6.0 -8.7 -8.5Depreciation/amortisation -3.3 -2.9 -2.8 -2.8 -1.8
Total expenses -25.5 -22.5 -23.4 -26.0 -24.6
Profit before impairment losses 10.9 10.4 8.9 6.2 7.7
Net impairment losses on financial assets, net -1.8 -0.8 -0.2 -0.4 0.1Net operating profit 9.1 9.5 8.7 5.8 7.7
Income taxes -1.9 -1.9 -1.8 -1.2 -1.5Profit for the period 7.2 7.6 6.9 4.6 6.2
Attributable to:
Non-controlling interests 0.0 0.0 0.0 0.0 0.0Shareholders in Bank of Åland Plc 7.2 7.6 6.9 4.6 6.2
Bank of Åland Plc Year-end Report, January-December 2019 11
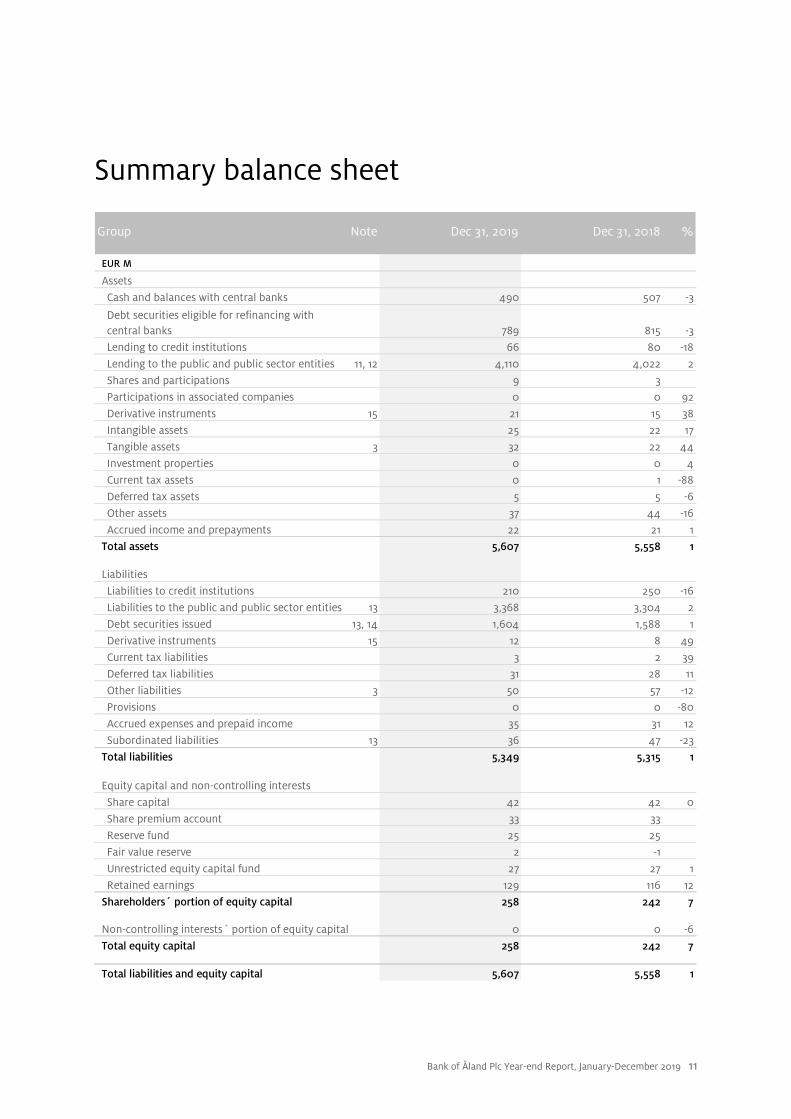
Summary balance sheet
Group Note Dec 31, 2019 Dec 31, 2018 %
EUR M
AssetsCash and balances with central banks 490 507 -3
Debt securities eligible for refinancing with central banks 789 815 -3Lending to credit institutions 66 80 -18
Lending to the public and public sector entities 11, 12 4,110 4,022 2Shares and participations 9 3 Participations in associated companies 0 0 92Derivative instruments 15 21 15 38Intangible assets 25 22 17Tangible assets 3 32 22 44Investment properties 0 0 4Current tax assets 0 1 -88Deferred tax assets 5 5 -6Other assets 37 44 -16
Accrued income and prepayments 22 21 1Total assets 5,607 5,558 1
LiabilitiesLiabilities to credit institutions 210 250 -16Liabilities to the public and public sector entities 13 3,368 3,304 2Debt securities issued 13, 14 1,604 1,588 1Derivative instruments 15 12 8 49Current tax liabilities 3 2 39Deferred tax liabilities 31 28 11Other liabilities 3 50 57 -12Provisions 0 0 -80Accrued expenses and prepaid income 35 31 12
Subordinated liabilities 13 36 47 -23Total liabilities 5,349 5,315 1
Equity capital and non-controlling interestsShare capital 42 42 0Share premium account 33 33Reserve fund 25 25Fair value reserve 2 -1 Unrestricted equity capital fund 27 27 1
Retained earnings 129 116 12Shareholders´ portion of equity capital 258 242 7
Non-controlling interests´ portion of equity capital 0 0 -6Total equity capital 258 242 7
Total liabilities and equity capital 5,607 5,558 1

Bank of Åland Plc Year-end Report, January-December 2019 12
Statement of changes in equity capital
Group
EUR MShare
capital
Share premium account
Reserve fund
Hedging reserve
Fair value
reserveTranslation differance
Unrestricted equity
capital fundRetained earnings
Shareholders´portion of
equity capital
Non-controlling interests´ portion of
equity capital Total
Equity capital, Dec 31, 2017 41.9 32.7 25.1 0.0 1.8 -0.6 26.9 105.7 233.6 0.0 233.6Adjustment for application of IFRS 9 0.1 -3.2 -3.1 -3.1
Equity capital, Jan 1, 2018 41.9 32.7 25.1 0.0 1.9 -0.6 26.9 102.5 230.5 0.0 230.5Profit for the period 22.9 22.9 0.0 22.9Other comprehensive income 0.0 -2.1 0.2 0.3 -1.5 -1.5Transactions with the Group’s owners Dividends paid -10.0 -10.0 -10.0
Incentive programme 0.0 0.1 0.0 0.2 0.2Share savings programme 0.3 0.3 0.3
Equity capital, Dec 31, 2018 42.0 32.7 25.1 -0.1 -0.4 27.1 116.0 242.4 0.0 242.4Profit for the period 26.3 26.3 0.0 26.3Other comprehensive income 3.2 -0.9 -2.3 0.0 0.0Transactions with the Group’s owners Dividends paid -10.9 -10.9 -10.9
Incentive programme 0.1 0.3 0.0 0.4 0.4Share savings programme 0.2 0.2 0.2
Equity capital, Dec 31, 2019 42.0 32.7 25.1 3.1 -1.3 27.4 129.3 258.3 0.0 258.4

Bank of Åland Plc Year-end Report, January-December 2019 13
Summary cash flow statement
Group
EUR M
Cash flow from operating activities
Net operating profit 33.2 29.0Adjustment for net operating profit items not affecting cash flow 22.7 12.6
Gains/losses from investing activities -0.1 -0.1Income taxes paid -2.1 -1.1
Changes in assets and liabilities in operating activities -88.7 -35.0 -124.4 -84.0Cash flow from investing activities -12.8 -11.9
Cash flow from financing activities 4.9 54.3
Exchange rate differences in cash and cash equivalents -2.4 -3.7Change in cash and cash equivalents -45.3 -45.3
Cash and cash equivalents at beginning of period 541.0 586.4
Cash and cash equivalents at end of period 495.7 541.0
Change in cash and cash equivalents -45.3 -45.3
Jan-Dec 2019 Jan-Dec 2018
Bank of Åland Plc Year-end Report, January-December 2019 14
Notes to the consolidated Interim Report 1. Corporate information The Bank of Åland Plc (Ålandsbanken Abp) is a Finnish public limited company with its Head Office in Mariehamn. It is a commercial bank with a total of 11 offices in the Åland Islands, elsewhere in Finland and in Sweden. Through its subsidiary Crosskey Banking Solutions Ab Ltd, the Bank of Åland Group is also a supplier of modern banking computer systems for small and medium sized banks. The Head Office of the Parent Company has the following address: Bank of Åland Plc Nygatan 2 AX-22100 Mariehamn, Åland, Finland The shares of the Bank of Åland Plc are traded on the Nasdaq Helsinki Oy (Helsinki Stock Exchange). The Year-end Report for the period January 1–December 31, 2019 was approved by the Board of Directors on February 6, 2020.
2. Basis for preparation of the Year-end Report and essential accounting principles BASIS FOR PREPARATION OF THE YEAR-END REPORT This Year-end Report for the period January 1–December 31, 2019 has been prepared in compliance with the International Financial Reporting Standards (IFRSs) and International Accounting Standard IAS 34, “Interim Financial Reporting”, which have been adopted by the European Union. The Year-end Report does not contain all information and notes required in annual financial statements and should be read together with the consolidated financial statements for the year ending December 31, 2018. Tables show correct rounded-off figures on each line, but this does not mean that rounded-off figures add up to the correct total. In cases where rounded-off figures add up to zero, they are shown as “0” in the tables, while a lack of figures is shown as an empty space. ESSENTIAL ACCOUNTING PRINCIPLES The essential accounting principles that have been used in preparing this Year-end Report are the same as those used in preparing the financial statements for the year ending December 31, 2018, except for the application of IFRS 16, “Leases”, which is being applied going forward starting on January 1, 2019 and went into service during the first quarter of 2019. IFRS 16, “Leases” replaces the IAS 17 standard and related interpretations. IFRS 16 removes the requirement that lessees must distinguish between finance and operational leases and requires lessees to report a “right-of-use” asset and a lease liability for most leases in the balance sheet. In the income statement, rent expenses are replaced by depreciation of the assets and interest expenses for the lease liability. This accounting model resembles the previous treatment of finance leases according to IAS 17. The Bank of Åland has chosen to apply the exemption found in IFRS 16, under which leases running for 12 months or less or leases of low-value assets will be recognised as expenses in the income statement. The lessor’s accounting is essentially equivalent to the previous treatment according to IAS 17. Due to the introduction of IFRS 16, tangible assets related to right-of-use increased by EUR 14 M and the risk exposure amount increased by the equivalent amount. For an account of the transitional effects, see Note 3. The Bank of Åland is applying the
modified retrospective approach. No comparative figures have been restated. The most significant effect of IFRS 16 is that the Bank of Åland is reporting new assets and liabilities for its operational leases related to banking and office premises. Lease liabilities are initially being calculated upon the transition to the present value of future lease payments discounted using the incremental borrowing rate on the introductory date of January 1, 2019. Right-of-use assets are initially being recognised at an amount equal to the lease liability. In accordance with the prevailing regulator-based reporting interpretations, and in line with other Finnish banks, starting in 2019 the Bank of Åland has chosen to recognise the entire annual cost of the stability fee in the first quarter, when responsibility for the fee arises, instead of a straight-line accrual of this cost over the four quarters of the year. The Bank of Åland’s earnings will thus show greater seasonal variations, with weaker first quarter earnings. Historical periods have been restated. The Bank of Åland is changing its reporting of foreign exchange commissions connected to customers’ payments and securities trading. The Bank of Åland has previously reported these under net income from financial items, but starting in 2019 it will report them as payment intermediation commissions and securities brokerage commissions under net commission income. Historical periods have been restated. For further information, see the Stock Exchange Release that was published on April 23, 2019. ESTIMATES AND JUDGEMENTS Preparation of this Year-end Report in compliance with IFRSs requires the Company’s Executive Team to make assessments, estimates and assumptions that affect the application of accounting principles and the recognised amounts of assets and liabilities, income and expenses as well as disclosures about commitments. Although these estimates are based on the best knowledge of the Executive Team on current events and measures, the actual outcome may diverge from the estimates. The substantial accounting assessments that have been made when applying the Group’s accounting principles are primarily related to the application of the new impairment model and accounting of financial instruments. As for recognition of leases, estimates have been made in establishing the lease period and the choice of discount rate.
Bank of Åland Plc Year-end Report, January-December 2019 15
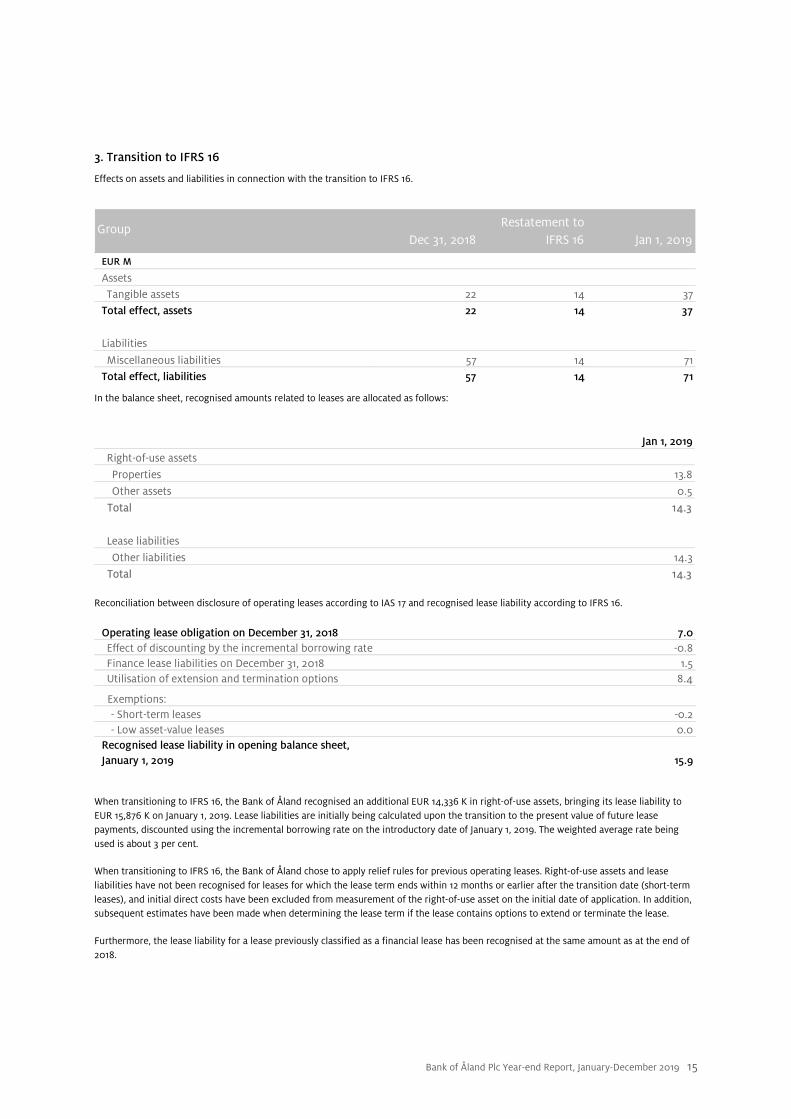
3. Transition to IFRS 16
Effects on assets and liabilities in connection with the transition to IFRS 16.
GroupDec 31, 2018
Restatement to IFRS 16 Jan 1, 2019
EUR M
AssetsTangible assets 22 14 37
Total effect, assets 22 14 37
Liabilities
Miscellaneous liabilities 57 14 71Total effect, liabilities 57 14 71
In the balance sheet, recognised amounts related to leases are allocated as follows:
Jan 1, 2019Right-of-use assets
Properties 13.8
Other assets 0.5
Total 14.3
Lease liabilities
Other liabilities 14.3Total 14.3
Reconciliation between disclosure of operating leases according to IAS 17 and recognised lease liability according to IFRS 16.
Operating lease obligation on December 31, 2018 7.0Effect of discounting by the incremental borrowing rate -0.8Finance lease liabilities on December 31, 2018 1.5Utilisation of extension and termination options 8.4
Exemptions: - Short-term leases -0.2 - Low asset-value leases 0.0Recognised lease liability in opening balance sheet, January 1, 2019 15.9
When transitioning to IFRS 16, the Bank of Åland recognised an additional EUR 14,336 K in right-of-use assets, bringing its lease liability to EUR 15,876 K on January 1, 2019. Lease liabilities are initially being calculated upon the transition to the present value of future lease payments, discounted using the incremental borrowing rate on the introductory date of January 1, 2019. The weighted average rate being used is about 3 per cent.
When transitioning to IFRS 16, the Bank of Åland chose to apply relief rules for previous operating leases. Right-of-use assets and lease liabilities have not been recognised for leases for which the lease term ends within 12 months or earlier after the transition date (short-term leases), and initial direct costs have been excluded from measurement of the right-of-use asset on the initial date of application. In addition, subsequent estimates have been made when determining the lease term if the lease contains options to extend or terminate the lease.
Furthermore, the lease liability for a lease previously classified as a financial lease has been recognised at the same amount as at the end of 2018.

Bank of Åland Plc Year-end Report, January-December 2019 16
4. Segment report The Bank of Åland Group reports operating segments in compliance with IFRS 8, which means that operating segments reflect the information that the Group’s Executive Team receives. “Private Banking” encompasses Private Banking operations in Åland, on the Finnish mainland, in Sweden and Asset Management (Ålandsbanken Fondbolag Ab, Ålandsbanken Fonder Ab and Ålandsbanken Fonder II Ab). “Premium Banking” encompasses operations in all customer segments excluding private banking in Åland, on the Finnish mainland, in Sweden and Asset Management. “IT” encompasses the subsidiary Crosskey Banking Solutions Ab Ltd including Model IT Oy and S-Crosskey Ab. “Corporate and Other” encompasses all central corporate units in the Group including Treasury and external partner collaborations. Until August, the subsidiary Ab Compass Card Oy Ltd was part of “Corporate and Other”. Starting in September, when Ab Compass Card Oy Ltd was merged with the parent company, the Bank of Åland’s card business is included in Private Banking and Premium Banking, while card business with external partner collaborations is included in “Corporate and Other”. For further information concerning new accounting principles for segment reporting, see the Stock Exchange Release that was published on April 23, 2019.
Group Jan-Dec 2019
EUR MPrivate
BankingPremium Banking IT
Corporateand Other Eliminations Total
Net interest income 23.6 26.3 0.0 4.0 0.0 53.9
Net commission income 41.9 12.9 -0.1 2.8 0.5 58.0
Net income from financial items at fair value 0.0 0.1 0.0 3.8 0.0 3.9
IT income 33.3 0.1 -15.9 17.5
Other income 0.1 0.0 0.9 0.9 -1.3 0.7
Total income 65.7 39.3 34.1 11.6 -16.8 133.9
Staff costs -14.8 -6.3 -17.0 -18.9 0.0 -57.0
Other expenses -8.3 -4.7 -11.6 -18.1 14.0 -28.7
Depreciation/amortisation -0.9 -0.3 -2.6 -10.4 2.4 -11.8
Internal allocation of expenses -20.7 -18.4 39.1 0.0Total expenses -44.7 -29.7 -31.3 -8.3 16.4 -97.5
Profit before impairment losses 21.0 9.6 2.9 3.3 -0.4 36.4
Net impairment losses on financial assets, net 0.0 -3.0 -0.3 0.0 -3.2
Net operating profit 21.1 6.6 2.9 3.0 -0.4 33.2
Income taxes -4.3 -1.4 -0.6 -0.6 -6.9Profit for the period attributableto shareholders in Bank of Åland Plc 16.7 5.3 2.3 2.4 -0.4 26.3
Business volume
Receivables from the public and public sector 1,876 2,221 14 0 4,110
Deposits from the public and public sector 1,710 1,621 51 -14 3,368
Actively managed assets 5,922 417 3 6,343
Risk exposure amount 704 604 36 239 1,583
Equity capital 103 83 21 51 258
Financial ratios etc.
Return on equity after taxes,% (ROE) 17.4 6.0 16.7 5.0 10.7
Expense/income ratio 0.68 0.76 0.92 0.71 0.73
Bank of Åland Plc Year-end Report, January-December 2019 17
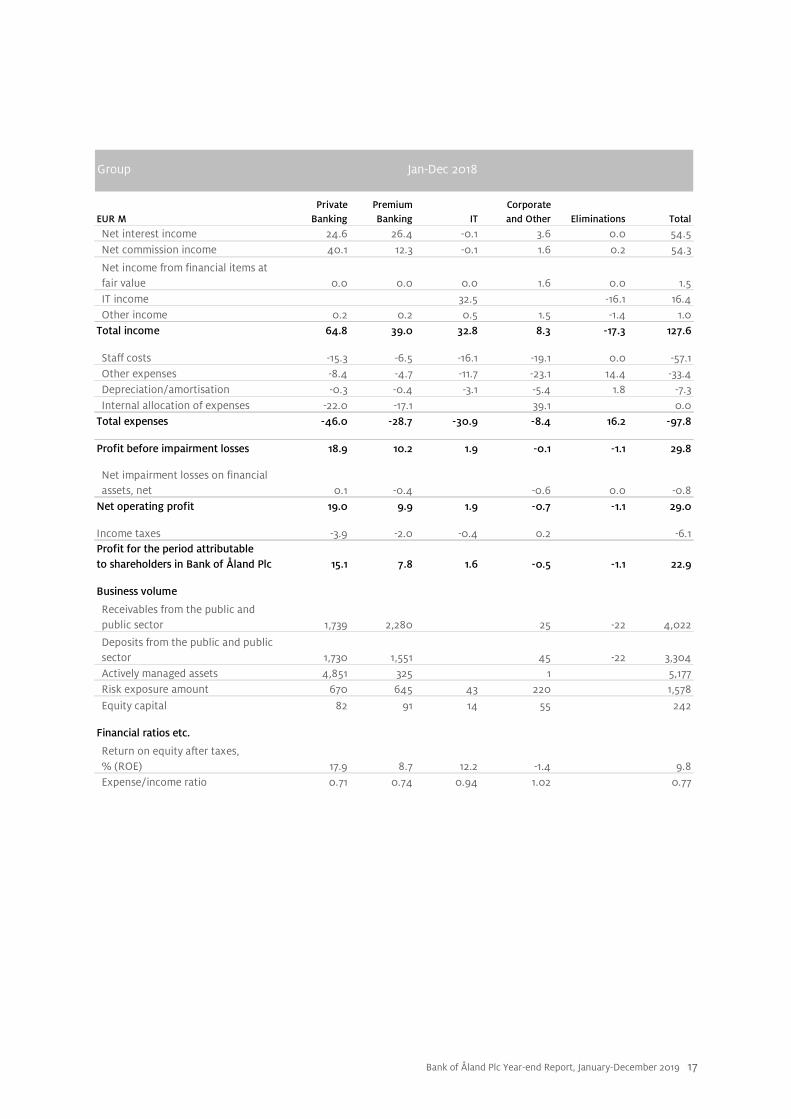
Group Jan-Dec 2018
EUR MPrivate
BankingPremium Banking IT
Corporateand Other Eliminations Total
Net interest income 24.6 26.4 -0.1 3.6 0.0 54.5Net commission income 40.1 12.3 -0.1 1.6 0.2 54.3
Net income from financial items at fair value 0.0 0.0 0.0 1.6 0.0 1.5IT income 32.5 -16.1 16.4Other income 0.2 0.2 0.5 1.5 -1.4 1.0
Total income 64.8 39.0 32.8 8.3 -17.3 127.6
Staff costs -15.3 -6.5 -16.1 -19.1 0.0 -57.1Other expenses -8.4 -4.7 -11.7 -23.1 14.4 -33.4Depreciation/amortisation -0.3 -0.4 -3.1 -5.4 1.8 -7.3Internal allocation of expenses -22.0 -17.1 39.1 0.0
Total expenses -46.0 -28.7 -30.9 -8.4 16.2 -97.8
Profit before impairment losses 18.9 10.2 1.9 -0.1 -1.1 29.8
Net impairment losses on financial assets, net 0.1 -0.4 -0.6 0.0 -0.8
Net operating profit 19.0 9.9 1.9 -0.7 -1.1 29.0
Income taxes -3.9 -2.0 -0.4 0.2 -6.1Profit for the period attributableto shareholders in Bank of Åland Plc 15.1 7.8 1.6 -0.5 -1.1 22.9
Business volume
Receivables from the public and public sector 1,739 2,280 25 -22 4,022
Deposits from the public and public sector 1,730 1,551 45 -22 3,304Actively managed assets 4,851 325 1 5,177Risk exposure amount 670 645 43 220 1,578Equity capital 82 91 14 55 242
Financial ratios etc.
Return on equity after taxes,% (ROE) 17.9 8.7 12.2 -1.4 9.8Expense/income ratio 0.71 0.74 0.94 1.02 0.77
Bank of Åland Plc Year-end Report, January-December 2019 18
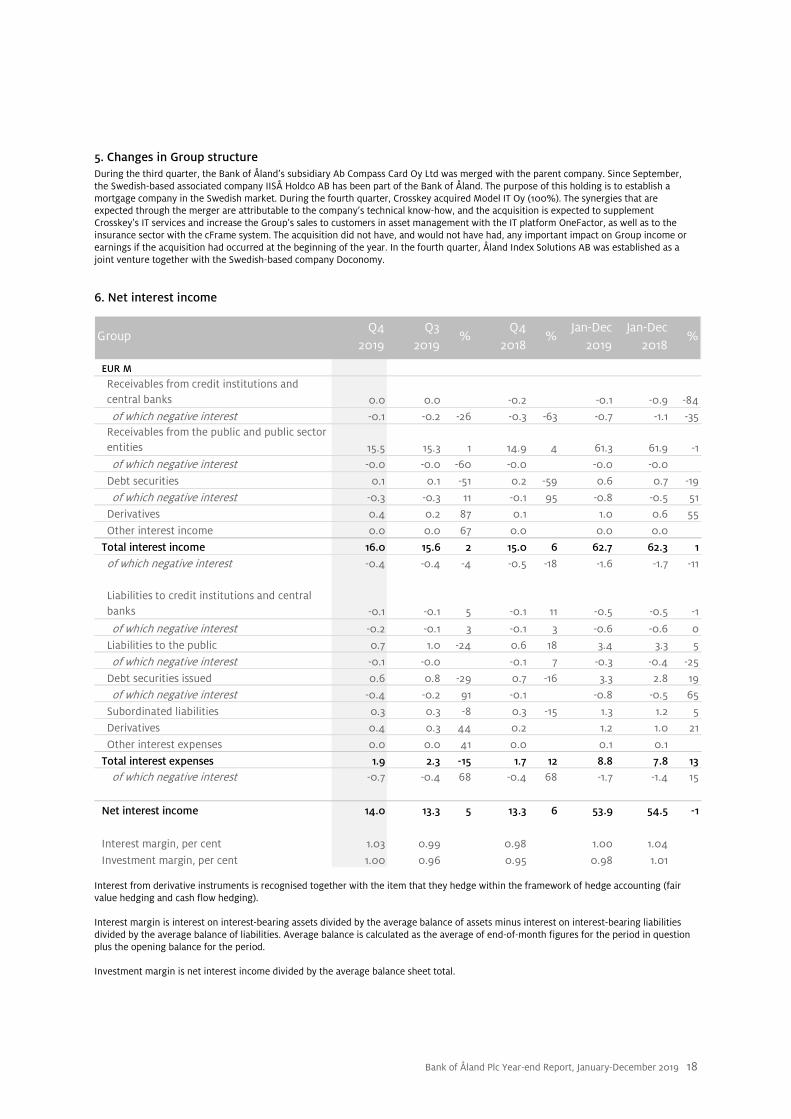
5. Changes in Group structure During the third quarter, the Bank of Åland’s subsidiary Ab Compass Card Oy Ltd was merged with the parent company. Since September, the Swedish-based associated company IISÅ Holdco AB has been part of the Bank of Åland. The purpose of this holding is to establish a mortgage company in the Swedish market. During the fourth quarter, Crosskey acquired Model IT Oy (100%). The synergies that are expected through the merger are attributable to the company’s technical know-how, and the acquisition is expected to supplement Crosskey’s IT services and increase the Group’s sales to customers in asset management with the IT platform OneFactor, as well as to the insurance sector with the cFrame system. The acquisition did not have, and would not have had, any important impact on Group income or earnings if the acquisition had occurred at the beginning of the year. In the fourth quarter, Åland Index Solutions AB was established as a joint venture together with the Swedish-based company Doconomy.
6. Net interest income
GroupQ4
2019Q3
2019%
Q42018
%Jan-Dec
2019Jan-Dec
2018%
EUR M
Receivables from credit institutions and central banks 0.0 0.0 -0.2 -0.1 -0.9 -84of which negative interest -0.1 -0.2 -26 -0.3 -63 -0.7 -1.1 -35
Receivables from the public and public sector entities 15.5 15.3 1 14.9 4 61.3 61.9 -1of which negative interest -0.0 -0.0 -60 -0.0 -0.0 -0.0
Debt securities 0.1 0.1 -51 0.2 -59 0.6 0.7 -19
of which negative interest -0.3 -0.3 11 -0.1 95 -0.8 -0.5 51Derivatives 0.4 0.2 87 0.1 1.0 0.6 55
Other interest income 0.0 0.0 67 0.0 0.0 0.0
Total interest income 16.0 15.6 2 15.0 6 62.7 62.3 1of which negative interest -0.4 -0.4 -4 -0.5 -18 -1.6 -1.7 -11
Liabilities to credit institutions and central banks -0.1 -0.1 5 -0.1 11 -0.5 -0.5 -1
of which negative interest -0.2 -0.1 3 -0.1 3 -0.6 -0.6 0Liabilities to the public 0.7 1.0 -24 0.6 18 3.4 3.3 5
of which negative interest -0.1 -0.0 -0.1 7 -0.3 -0.4 -25
Debt securities issued 0.6 0.8 -29 0.7 -16 3.3 2.8 19of which negative interest -0.4 -0.2 91 -0.1 -0.8 -0.5 65
Subordinated liabilities 0.3 0.3 -8 0.3 -15 1.3 1.2 5Derivatives 0.4 0.3 44 0.2 1.2 1.0 21
Other interest expenses 0.0 0.0 41 0.0 0.1 0.1
Total interest expenses 1.9 2.3 -15 1.7 12 8.8 7.8 13of which negative interest -0.7 -0.4 68 -0.4 68 -1.7 -1.4 15
Net interest income 14.0 13.3 5 13.3 6 53.9 54.5 -1
Interest margin, per cent 1.03 0.99 0.98 1.00 1.04
Investment margin, per cent 1.00 0.96 0.95 0.98 1.01
Interest from derivative instruments is recognised together with the item that they hedge within the framework of hedge accounting (fair value hedging and cash flow hedging). Interest margin is interest on interest-bearing assets divided by the average balance of assets minus interest on interest-bearing liabilities divided by the average balance of liabilities. Average balance is calculated as the average of end-of-month figures for the period in question plus the opening balance for the period. Investment margin is net interest income divided by the average balance sheet total.
Bank of Åland Plc Year-end Report, January-December 2019 19
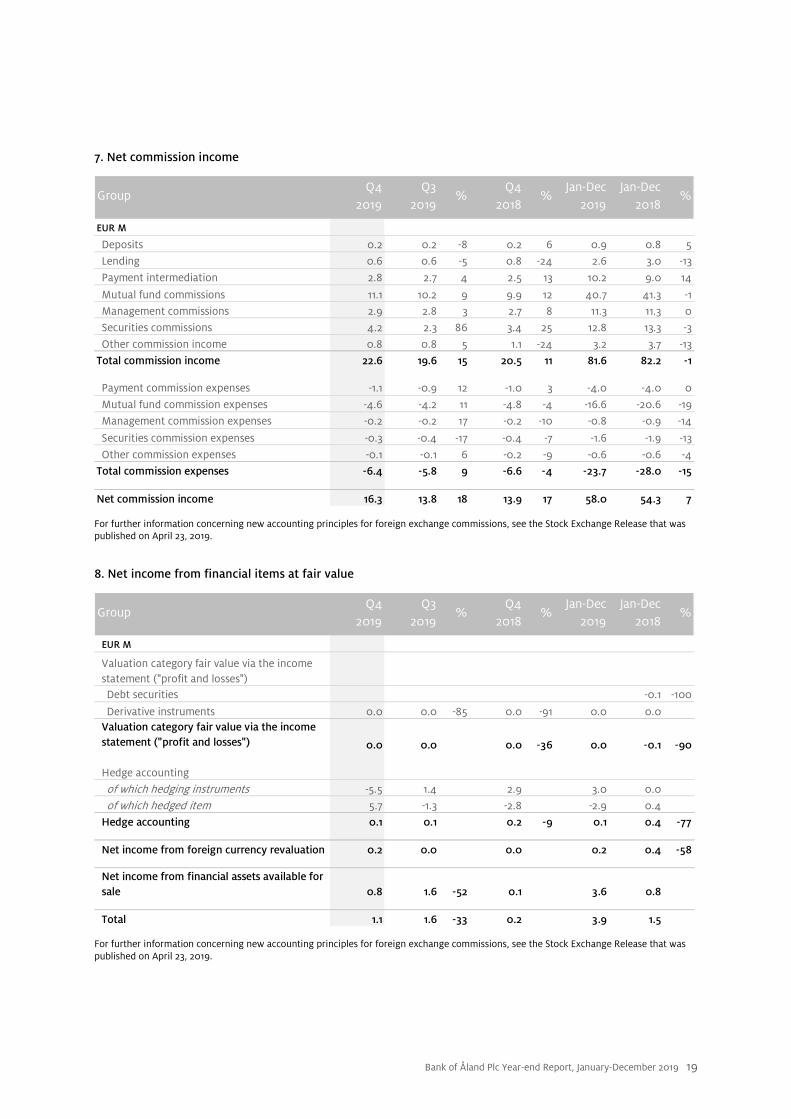
7. Net commission income
GroupQ4
2019Q3
2019%
Q42018
%Jan-Dec
2019Jan-Dec
2018%
EUR M
Deposits 0.2 0.2 -8 0.2 6 0.9 0.8 5Lending 0.6 0.6 -5 0.8 -24 2.6 3.0 -13
Payment intermediation 2.8 2.7 4 2.5 13 10.2 9.0 14
Mutual fund commissions 11.1 10.2 9 9.9 12 40.7 41.3 -1Management commissions 2.9 2.8 3 2.7 8 11.3 11.3 0Securities commissions 4.2 2.3 86 3.4 25 12.8 13.3 -3
Other commission income 0.8 0.8 5 1.1 -24 3.2 3.7 -13Total commission income 22.6 19.6 15 20.5 11 81.6 82.2 -1
Payment commission expenses -1.1 -0.9 12 -1.0 3 -4.0 -4.0 0
Mutual fund commission expenses -4.6 -4.2 11 -4.8 -4 -16.6 -20.6 -19Management commission expenses -0.2 -0.2 17 -0.2 -10 -0.8 -0.9 -14
Securities commission expenses -0.3 -0.4 -17 -0.4 -7 -1.6 -1.9 -13
Other commission expenses -0.1 -0.1 6 -0.2 -9 -0.6 -0.6 -4Total commission expenses -6.4 -5.8 9 -6.6 -4 -23.7 -28.0 -15
Net commission income 16.3 13.8 18 13.9 17 58.0 54.3 7
For further information concerning new accounting principles for foreign exchange commissions, see the Stock Exchange Release that was published on April 23, 2019.
8. Net income from financial items at fair value
GroupQ4
2019Q3
2019%
Q42018
%Jan-Dec
2019Jan-Dec
2018%
EUR M
Valuation category fair value via the incomestatement ("profit and losses")Debt securities -0.1 -100
Derivative instruments 0.0 0.0 -85 0.0 -91 0.0 0.0 Valuation category fair value via the incomestatement ("profit and losses") 0.0 0.0 0.0 -36 0.0 -0.1 -90
Hedge accounting
of which hedging instruments -5.5 1.4 2.9 3.0 0.0
of which hedged item 5.7 -1.3 -2.8 -2.9 0.4
Hedge accounting 0.1 0.1 0.2 -9 0.1 0.4 -77
Net income from foreign currency revaluation 0.2 0.0 0.0 0.2 0.4 -58
Net income from financial assets available for sale 0.8 1.6 -52 0.1 3.6 0.8
Total 1.1 1.6 -33 0.2 3.9 1.5
For further information concerning new accounting principles for foreign exchange commissions, see the Stock Exchange Release that was published on April 23, 2019.
Bank of Åland Plc Year-end Report, January-December 2019 20
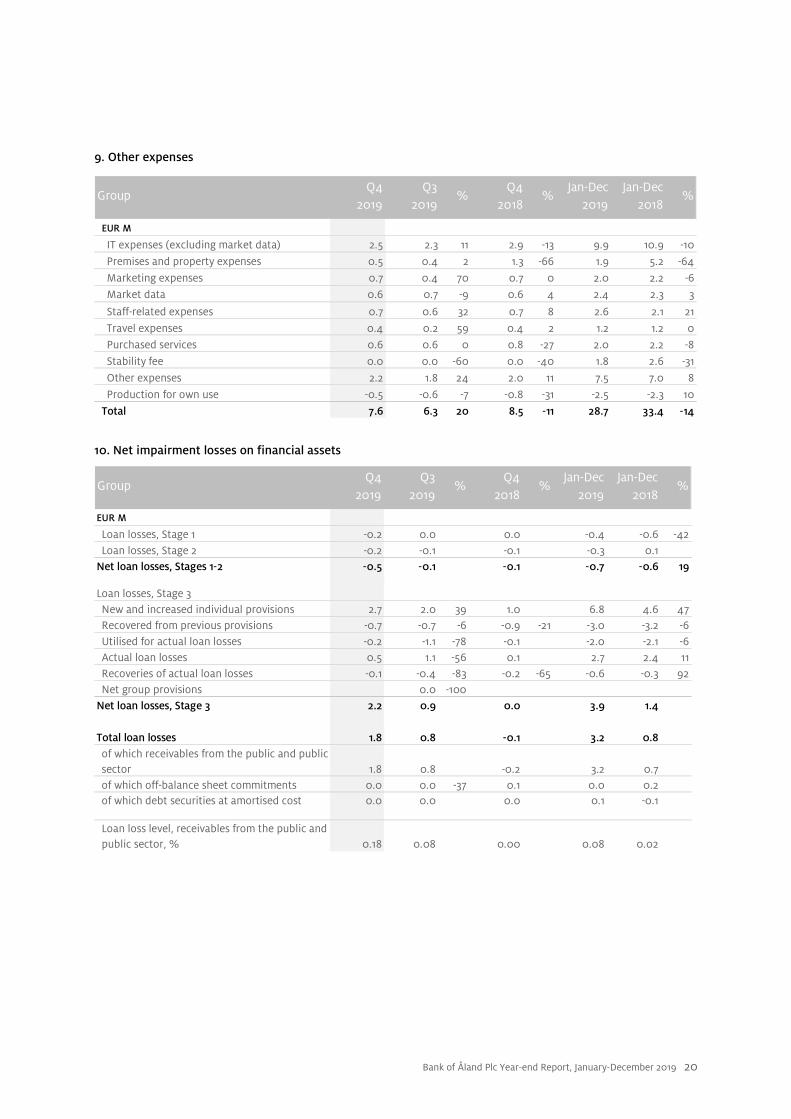
9. Other expenses
GroupQ4
2019Q3
2019%
Q42018
%Jan-Dec
2019Jan-Dec
2018%
EUR M
IT expenses (excluding market data) 2.5 2.3 11 2.9 -13 9.9 10.9 -10
Premises and property expenses 0.5 0.4 2 1.3 -66 1.9 5.2 -64
Marketing expenses 0.7 0.4 70 0.7 0 2.0 2.2 -6Market data 0.6 0.7 -9 0.6 4 2.4 2.3 3
Staff-related expenses 0.7 0.6 32 0.7 8 2.6 2.1 21
Travel expenses 0.4 0.2 59 0.4 2 1.2 1.2 0Purchased services 0.6 0.6 0 0.8 -27 2.0 2.2 -8
Stability fee 0.0 0.0 -60 0.0 -40 1.8 2.6 -31
Other expenses 2.2 1.8 24 2.0 11 7.5 7.0 8
Production for own use -0.5 -0.6 -7 -0.8 -31 -2.5 -2.3 10
Total 7.6 6.3 20 8.5 -11 28.7 33.4 -14
10. Net impairment losses on financial assets
GroupQ4
2019Q3
2019%
Q42018
%Jan-Dec
2019Jan-Dec
2018%
EUR M
Loan losses, Stage 1 -0.2 0.0 0.0 -0.4 -0.6 -42Loan losses, Stage 2 -0.2 -0.1 -0.1 -0.3 0.1
Net loan losses, Stages 1-2 -0.5 -0.1 -0.1 -0.7 -0.6 19
Loan losses, Stage 3New and increased individual provisions 2.7 2.0 39 1.0 6.8 4.6 47Recovered from previous provisions -0.7 -0.7 -6 -0.9 -21 -3.0 -3.2 -6Utilised for actual loan losses -0.2 -1.1 -78 -0.1 -2.0 -2.1 -6Actual loan losses 0.5 1.1 -56 0.1 2.7 2.4 11Recoveries of actual loan losses -0.1 -0.4 -83 -0.2 -65 -0.6 -0.3 92Net group provisions 0.0 -100
Net loan losses, Stage 3 2.2 0.9 0.0 3.9 1.4
Total loan losses 1.8 0.8 -0.1 3.2 0.8 of which receivables from the public and public sector 1.8 0.8 -0.2 3.2 0.7 of which off-balance sheet commitments 0.0 0.0 -37 0.1 0.0 0.2 of which debt securities at amortised cost 0.0 0.0 0.0 0.1 -0.1
Loan loss level, receivables from the public and public sector, % 0.18 0.08 0.00 0.08 0.02
Bank of Åland Plc Year-end Report, January-December 2019 21
11. Receivables from the public and public sector by purpose
Group Dec 31, 2019 Dec 31, 2018
EUR MReceivables
before provisionsProvisions
Receivables after provisions
Receivables after provisions
%
Private individualsHome loans 2,269 -3 2,266 2,287 -1Securities and other investments 325 0 325 309 5Business operations 110 -2 108 112 -4Other household purposes 270 -3 267 229 17
Total, private individuals 2,974 -8 2,966 2,937 1
CompaniesShipping 54 -4 50 59 -14Wholesale and retail trade 42 0 42 46 -10Housing operations 312 0 312 301 4Other real estate operations 210 0 210 196 7Financial and insurance operations 220 0 220 231 -5Hotel and restaurant operations 29 0 29 28 1Other service operations 110 -1 109 84 31Agriculture, forestry and fishing 11 0 11 11 3Construction 80 0 80 57 40Other industry and crafts 37 0 36 37 -1
Total, companies 1,105 -5 1,100 1,050 5
Public sector and non-profit organisations 44 0 44 35 28Total, public sector and non-profit organisations 44 0 44 35 28
Total 4,122 -12 4,110 4,022 2
Bank of Åland Plc Year-end Report, January-December 2019 22
12. Receivables from the public and public sector by stage
Jan 1, 2018-Dec 31, 2018
Group Stage 1 Stage 2 Stage 3 Total Total
EUR M
Carrying amount, grossOpening balance, January 1 3,847.5 165.7 19.7 4,033.0 3,987.6Closing balance, December 31 3,972.5 116.4 33.5 4,122.5 4,033.0
Provisions for expected lossesOpening balance, January 1 0.9 1.2 9.3 11.3 12.5Increases due to issuances and acquisitions 0.2 0.0 0.1 0.3 0.5Decrease due to removal from balance sheet -0.2 -0.6 -0.6 -1.5 -0.6Decrease due to write-offs 0.0 0.0 -2.0 -2.0 -2.1Transfer to Stage 1 0.7 -0.7 0.0 0.0 0.0Transfer to Stage 2 -0.2 0.4 -0.2 0.0 0.0Transfer to Stage 3 0.0 -0.3 0.3 0.0 0.0Net changes due to changed credit risk -0.6 0.8 4.2 4.4 1.6Net changes due to changed estimation method -0.3 0.1 0.0 -0.2 -0.6Exchange rate differences and other adjustments 0.0 0.0 0.0 0.0 0.0
Closing balance, December 31 0.5 0.9 11.1 12.4 11.3
Carrying amount, netOpening balance, January 1 3,846.7 164.6 10.4 4,021.7 3,975.1Closing balance, December 31 3,972.0 115.5 22.5 4,110.0 4,021.7
Impairment losses, IFRS 9 - Financial ratiosDec 31,
2019Dec 31,
2018Total provision ratio, receivables from the public, % 0.30 0.28Provision ratio, Stage 1, receivables from the public, % 0.01 0.02Provision ratio, Stage 2, receivables from the public, % 0.74 0.71Provision ratio, Stage 3, receivables from the public, % 33 47Share of receivables from the public in Stage 3, % 0.81 0.49
Jan 1, 2019 - Dec 31, 2019
13. Deposits from the public and public sector, including bonds and certificates of deposit issued
Group Dec 31, 2019 Dec 31, 2018 %
EUR M
Deposit accounts from the public and public sectorDemand deposits 3,295 3,103 6
Time deposits 73 200 -63
Total deposit accounts 3,368 3,304 2
Certificates of deposit issued to the public
and public sector1 23 1 Subordinate debentures 1 17 27 -25
Total bonds and certificates of deposit 40 29 39
Total deposits 3,408 3,332 2
1) This item does not include debt securities subscribed by credit institutions.

Bank of Åland Plc Year-end Report, January-December 2019 23
14. Debt securities issued
Group Dec 31, 2019 Dec 31, 2018 %
EUR M
Certificates of deposit 108 121 -11
Covered bonds 1,145 1,117 3Senior non-covered bonds 351 350 0
Total 1,604 1,588 1
15. Derivative instruments
Group
EUR M Under 1 yr 1-5 yrs over 5 yrsNominal amount
Positive market values
Negative market values
Nominal amount
Positive market values
Negative market values
Derivatives for trading
Interest-related contracts
Interest rate swaps 1 58 6 65 3 3 55 2 3Currency-related contracts
Currency forward contracts 716 716 4 5 383 1 1
Total 717 58 6 781 7 8 438 3 3
Derivatives for fair value hedge
Interest-related contracts
Interest rate swaps 250 1,068 38 1,356 14 4 1,053 12 5
Total 250 1,068 38 1,356 14 4 1,053 12 5
Total derivative instruments 967 1,126 44 2,136 21 12 1,491 15 8of which cleared 250 1,123 41 1,414 16 7 1,102 13 7
Nominal amount/maturity
Dec 31, 2019 Dec 31, 2018
Bank of Åland Plc Year-end Report, January-December 2019 24
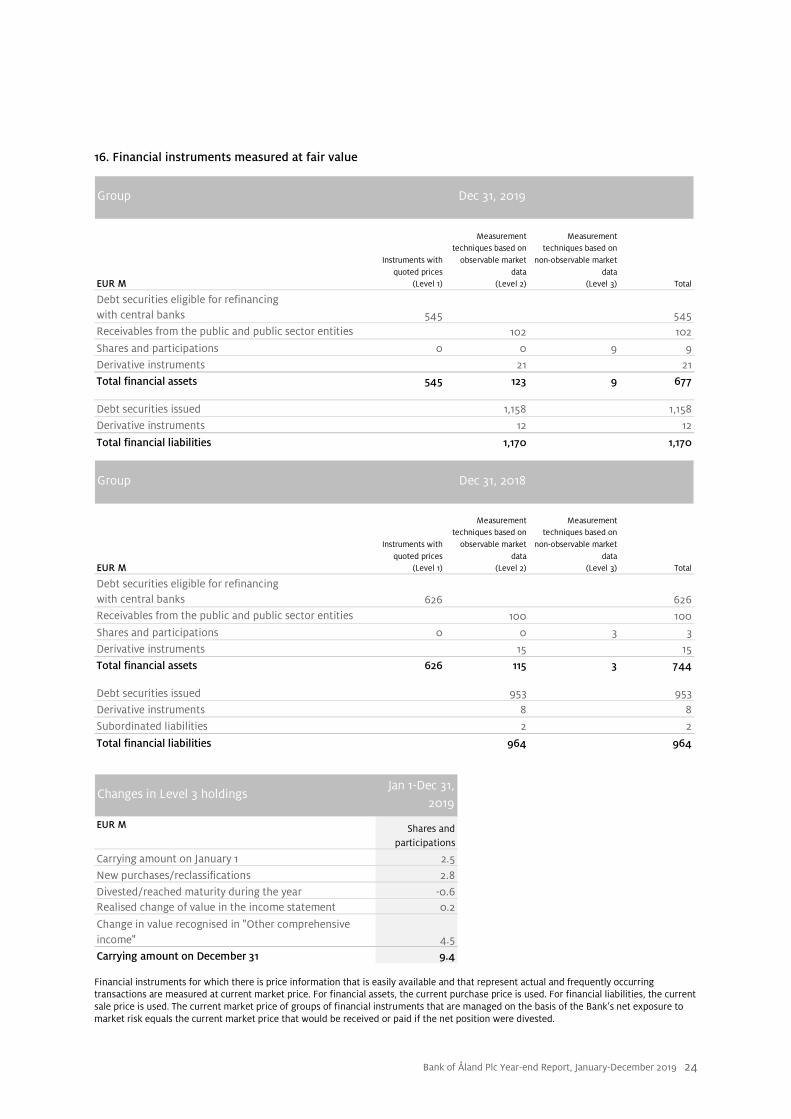
16. Financial instruments measured at fair value
Group
EUR M
Instruments with quoted prices
(Level 1)
Measurement techniques based on
observable market data
(Level 2)
Measurement techniques based on
non-observable market data
(Level 3) Total
Debt securities eligible for refinancingwith central banks 545 545Receivables from the public and public sector entities 102 102Shares and participations 0 0 9 9Derivative instruments 21 21Total financial assets 545 123 9 677
Debt securities issued 1,158 1,158Derivative instruments 12 12
Total financial liabilities 1,170 1,170
Group
EUR M
Instruments with quoted prices
(Level 1)
Measurement techniques based on
observable market data
(Level 2)
Measurement techniques based on
non-observable market data
(Level 3) Total
Debt securities eligible for refinancingwith central banks 626 626Receivables from the public and public sector entities 100 100Shares and participations 0 0 3 3Derivative instruments 15 15Total financial assets 626 115 3 744
Debt securities issued 953 953Derivative instruments 8 8Subordinated liabilities 2 2
Total financial liabilities 964 964
Dec 31, 2019
Dec 31, 2018
Changes in Level 3 holdings Jan 1-Dec 31,
2019
EUR M Shares and participations
Carrying amount on January 1 2.5
New purchases/reclassifications 2.8Divested/reached maturity during the year -0.6Realised change of value in the income statement 0.2
Change in value recognised in "Other comprehensive income" 4.5Carrying amount on December 31 9.4 Financial instruments for which there is price information that is easily available and that represent actual and frequently occurring transactions are measured at current market price. For financial assets, the current purchase price is used. For financial liabilities, the current sale price is used. The current market price of groups of financial instruments that are managed on the basis of the Bank’s net exposure to market risk equals the current market price that would be received or paid if the net position were divested.
Bank of Åland Plc Year-end Report, January-December 2019 25
In the case of financial assets for which reliable market price information is not available, fair value is determined with the help of measurement models. Such models may, for example, be based on price comparisons, present value estimates or option valuation theory, depending on the nature of the instrument. The models use incoming data in the form of market prices and other variables that are deemed to influence pricing. The models and incoming data on which the measurements are based are validated regularly to ensure that they are consistent with market practices and generally accepted financial theory. The measurement hierarchy Financial instruments that are measured according to quoted prices in an active market for identical assets/liabilities are categorised as Level 1. Financial instruments that are measured using measurement models that are, in all essential respects, based on market data are categorised as Level 2. Financial instruments that are measured with the help of models based on incoming data that cannot be verified with external market information are categorised in Level 3. These assets essentially consist of unlisted shares. Such holdings are generally measured as the Bank’s portion of the net asset value of the company. Unlisted shares are essentially classified as available for sale. The changes in the value of these holdings are reported in “Other comprehensive income”. In the tables on the previous page, financial instruments measured at fair value have been classified with regard to how they have been measured and the degree of market data used in this measurement on closing day. If the classification on closing day has changed, compared to the classification at the end of the previous year, the instrument has been moved between the levels in the table. During the period, no instruments were moved between Levels 1 and 2. Changes in Level 3 are presented in a separate table on the previous page.
17. Off-balance sheet commitments
Group Dec 31, 2019 Dec 31, 2018 %
EUR M
Guarantees 9 43 -80
Unutilised overdraft limits 241 228 6Unutilised credit card limits 79 76 4
Lines of credit 92 131 -30Other commitments 23 14 56
Total 444 493 -10Provision for expected loss 0 0 -41
18. Offsetting of financial assets and liabilities
Group
Dec 31, 2019
Dec 31, 2018 %
Dec 31, 2019
Dec 31, 2018 %
EUR M
Financial assets and liabilities covered by offsetting, netting or similar agreements
Gross amount 21 15 38 51 39 32
Offset amount
Total 21 15 38 51 39 32
Related amounts not offset Financial instruments, netting agreements -8 -7 5 -8 -7 5
Financial instruments, collateral -14 -14 -3
Cash, collateral -2 -26 -15 73Total amounts not offset -10 -7 32 -48 -37 29
Net amount 11 8 44 4 2 68
Assets Liabilities
The tables report financial instruments that were offset in the balance sheet in compliance with IAS 32 and those that were covered by legally binding master netting agreements or similar agreements not qualified for netting. The financial instruments consisted of derivatives, repurchase agreements (repos) and reverse repos, securities deposits and securities loans. Collateral consisted of financial instruments or cash received or paid for transactions covered by legally binding netting agreements or similar agreements that allow netting of obligations to counterparties in case of default. The value of the collateral was limited to the related amount recognised in the balance sheet, so the excess value of collateral is not included. Amounts not offset in the balance sheet are presented as a reduction in the carrying amount of financial assets or liabilities in order to recognise the net exposure of the asset and liability.
Bank of Åland Plc Year-end Report, January-December 2019 26
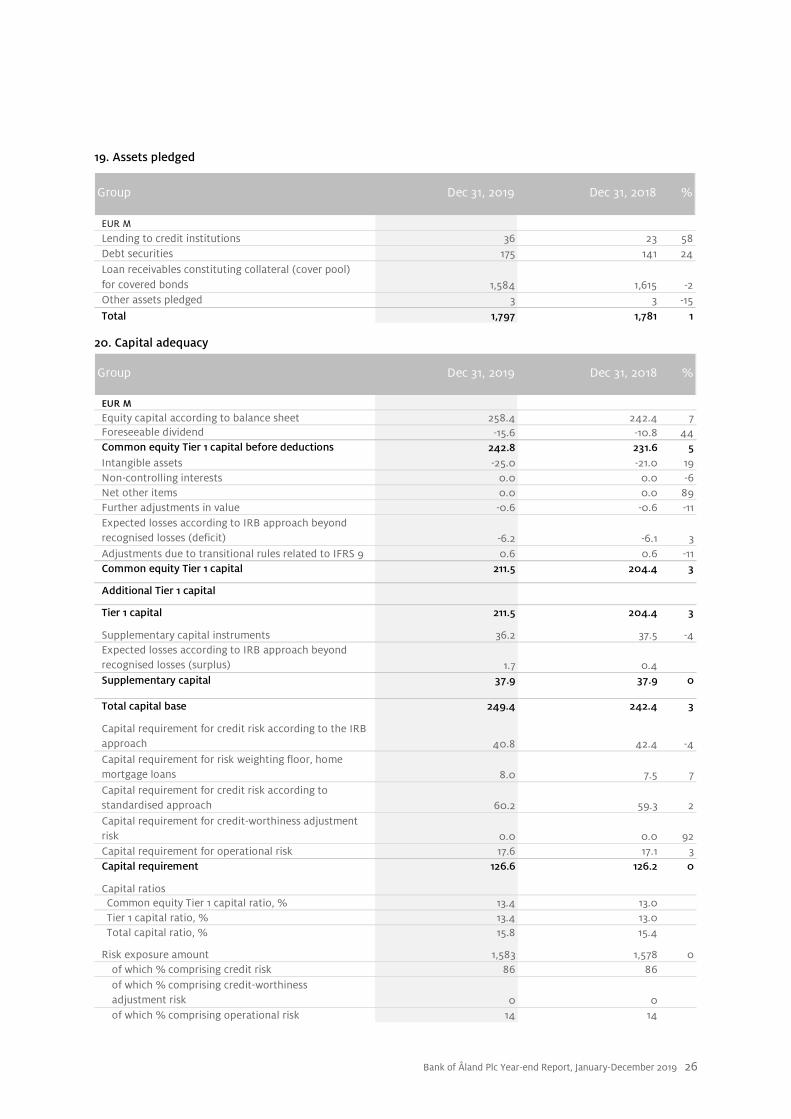
19. Assets pledged
Group Dec 31, 2019 Dec 31, 2018 %
EUR M
Lending to credit institutions 36 23 58Debt securities 175 141 24Loan receivables constituting collateral (cover pool)for covered bonds 1,584 1,615 -2Other assets pledged 3 3 -15Total 1,797 1,781 1
20. Capital adequacy
Group Dec 31, 2019 Dec 31, 2018 %
EUR M
Equity capital according to balance sheet 258.4 242.4 7Foreseeable dividend -15.6 -10.8 44Common equity Tier 1 capital before deductions 242.8 231.6 5Intangible assets -25.0 -21.0 19Non-controlling interests 0.0 0.0 -6Net other items 0.0 0.0 89Further adjustments in value -0.6 -0.6 -11Expected losses according to IRB approach beyond recognised losses (deficit) -6.2 -6.1 3Adjustments due to transitional rules related to IFRS 9 0.6 0.6 -11Common equity Tier 1 capital 211.5 204.4 3
Additional Tier 1 capital
Tier 1 capital 211.5 204.4 3
Supplementary capital instruments 36.2 37.5 -4Expected losses according to IRB approach beyond recognised losses (surplus) 1.7 0.4 Supplementary capital 37.9 37.9 0
Total capital base 249.4 242.4 3
Capital requirement for credit risk according to the IRB approach 40.8 42.4 -4Capital requirement for risk weighting floor, home mortgage loans 8.0 7.5 7Capital requirement for credit risk according to standardised approach 60.2 59.3 2Capital requirement for credit-worthiness adjustment risk 0.0 0.0 92Capital requirement for operational risk 17.6 17.1 3Capital requirement 126.6 126.2 0
Capital ratiosCommon equity Tier 1 capital ratio, % 13.4 13.0Tier 1 capital ratio, % 13.4 13.0Total capital ratio, % 15.8 15.4
Risk exposure amount 1,583 1,578 0of which % comprising credit risk 86 86of which % comprising credit-worthinessadjustment risk 0 0of which % comprising operational risk 14 14
Bank of Åland Plc Year-end Report, January-December 2019 27
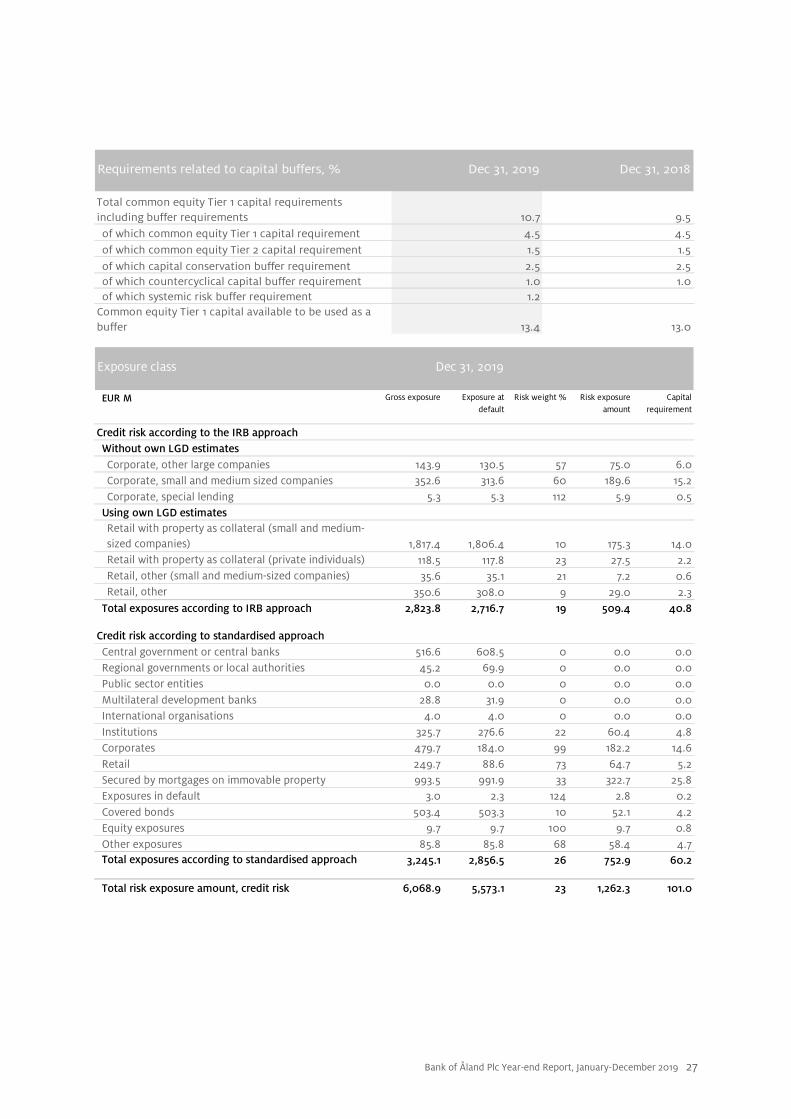
Requirements related to capital buffers, % Dec 31, 2019 Dec 31, 2018
Total common equity Tier 1 capital requirements including buffer requirements 10.7 9.5of which common equity Tier 1 capital requirement 4.5 4.5of which common equity Tier 2 capital requirement 1.5 1.5
of which capital conservation buffer requirement 2.5 2.5of which countercyclical capital buffer requirement 1.0 1.0of which systemic risk buffer requirement 1.2
Common equity Tier 1 capital available to be used as a buffer 13.4 13.0
Exposure class Dec 31, 2019
EUR M Gross exposure Exposure at default
Risk weight % Risk exposure amount
Capital requirement
Credit risk according to the IRB approach Without own LGD estimatesCorporate, other large companies 143.9 130.5 57 75.0 6.0Corporate, small and medium sized companies 352.6 313.6 60 189.6 15.2Corporate, special lending 5.3 5.3 112 5.9 0.5
Using own LGD estimatesRetail with property as collateral (small and medium-sized companies) 1,817.4 1,806.4 10 175.3 14.0Retail with property as collateral (private individuals) 118.5 117.8 23 27.5 2.2Retail, other (small and medium-sized companies) 35.6 35.1 21 7.2 0.6Retail, other 350.6 308.0 9 29.0 2.3
Total exposures according to IRB approach 2,823.8 2,716.7 19 509.4 40.8
Credit risk according to standardised approachCentral government or central banks 516.6 608.5 0 0.0 0.0Regional governments or local authorities 45.2 69.9 0 0.0 0.0Public sector entities 0.0 0.0 0 0.0 0.0Multilateral development banks 28.8 31.9 0 0.0 0.0International organisations 4.0 4.0 0 0.0 0.0Institutions 325.7 276.6 22 60.4 4.8Corporates 479.7 184.0 99 182.2 14.6Retail 249.7 88.6 73 64.7 5.2Secured by mortgages on immovable property 993.5 991.9 33 322.7 25.8Exposures in default 3.0 2.3 124 2.8 0.2Covered bonds 503.4 503.3 10 52.1 4.2Equity exposures 9.7 9.7 100 9.7 0.8Other exposures 85.8 85.8 68 58.4 4.7Total exposures according to standardised approach 3,245.1 2,856.5 26 752.9 60.2
Total risk exposure amount, credit risk 6,068.9 5,573.1 23 1,262.3 101.0

Bank of Åland Plc Year-end Report, January-December 2019 28
Exposure class Dec 31, 2018
EUR M Gross exposure Exposure at default
Risk weight % Risk exposure amount
Capital requirement
Credit risk according to the IRB approach Without own LGD estimatesCorporate, other large companies 206.6 156.0 0 80.5 6.4Corporate, small and medium sized companies 349.0 325.4 0 214.2 17.1Corporate, special lending 5.3 5.3 0 4.6 0.4
Using own LGD estimatesRetail with property as collateral (small and medium-sized companies) 109.6 108.9 0 25.4 2.0Retail with property as collateral (private individuals) 1,802.9 1,792.7 9 166.7 13.3Retail, other (small and medium-sized companies) 38.8 37.9 21 8.1 0.6Retail, other 339.3 302.7 10 30.5 2.4
Total exposures according to IRB approach 2,851.5 2,728.7 19 530.0 42.4
Credit risk according to standardised approachCentral government or central banks 546.7 610.2 0 0.0 0.0Regional governments or local authorities 30.6 53.2 0 0.0 0.0Public sector entities 5.0 5.0 0 0.0 0.0Multilateral development banks 45.2 46.7 0 0.0 0.0International organisations 42.2 42.2 0 0.0 0.0Institutions 311.6 272.2 25 67.7 5.4Corporates 440.5 195.2 98 191.9 15.4Retail 177.7 88.7 72 64.3 5.1Secured by mortgages on immovable property 963.8 963.0 33 315.9 25.3Exposures in default 3.4 3.3 135 4.5 0.4Items associated with particularly high risk 0.0 0.0 150 0.0 0.0Covered bonds 492.9 492.8 10 49.3 3.9Equity exposures 2.7 2.7 100 2.7 0.2Other exposures 82.0 82.0 54 44.5 3.6Total exposures according to standardised approach 3,144.2 2,857.3 26 740.8 59.3
Total risk exposure amount, credit risk 5,995.7 5,586.0 23 1,270.8 101.7
Leverage ratio Dec 31, 2019 Dec 31, 2018 %
EUR M
Tier 1 capital 211.5 204.4 3Total exposure measure 5,663.4 5,635.9 0
of which balance sheet items 5,581.4 5,538.9 1of which off-balance sheet items 82.0 97.0 -15
Leverage ratio, % 3.7 3.6 The leverage ratio is calculated according to the situation at the end of the period. Tier 1 capital includes profit for the period.