January 25, 2012 Wastila - pharmacy.umaryland.edupharmacy.umaryland.edu/media/SOP/... · New data...
43
January 25, 2012 Linda Simoni‐Wastila Professor Diane L. McNally Assistant Director, PRC University of Maryland School of Pharmacy [email protected] 1
Transcript of January 25, 2012 Wastila - pharmacy.umaryland.edupharmacy.umaryland.edu/media/SOP/... · New data...

January 25, 2012
Linda Simoni‐WastilaProfessor
Diane L. McNallyAssistant Director, PRC
University of Maryland School of [email protected]
1

The SEOW and its Purpose◦ Now and into the future◦ The need for this groupIndicators◦ What makes for a good indicator?◦ Data sources◦ Primary indicators◦ Secondary indicatorsEpidemiological Profile◦ Alcohol use and consequences among 18‐25 young adultsNext Steps
2

Identify key data sourcesAnalyze available data benchmarks on use, risk factors, and consequences of alcohol, tobacco, and other substances ◦ Prevention focus◦ National, State and jurisdiction levels Assist state and local prevention professionals in identification, use, implementation, and interpretation of dataThe Hat Thing: SEOW and MSPF
3

The Maryland SEOW will monitor the use of alcohol, tobacco, and other drugs and the consequences of their use in Maryland in order to identify and prioritize the prevention needs of the state. To achieve this end, the Maryland SEOW will oversee the collection, interpretation, and dissemination of statewide data that quantifies substance use and its consequences for Maryland.
4

The Maryland SEOW will monitor the use of alcohol, tobacco, and other drugs and the consequences of their use in Maryland in order to identify and prioritize the prevention AND TREATMENT needs of the state. To achieve this end, the Maryland SEOW will oversee the collection, interpretation, and dissemination of statewide data that quantifies substance use and its consequences IN THE BROADER CONTEXT OF BEHAVIORAL HEALTH for Maryland.
5

Past few years have focused on: ◦ Users of prevention data ◦ Alcohol, tobacco, and other substances◦ Consumption and consequences◦ State and jurisdiction
Now need to expand to:◦ Users of treatment data◦ Suppliers and collectors of data (prevention AND treatment)◦ Risk and other mitigating factors◦ Psychiatric and other behavioral health◦ National
6
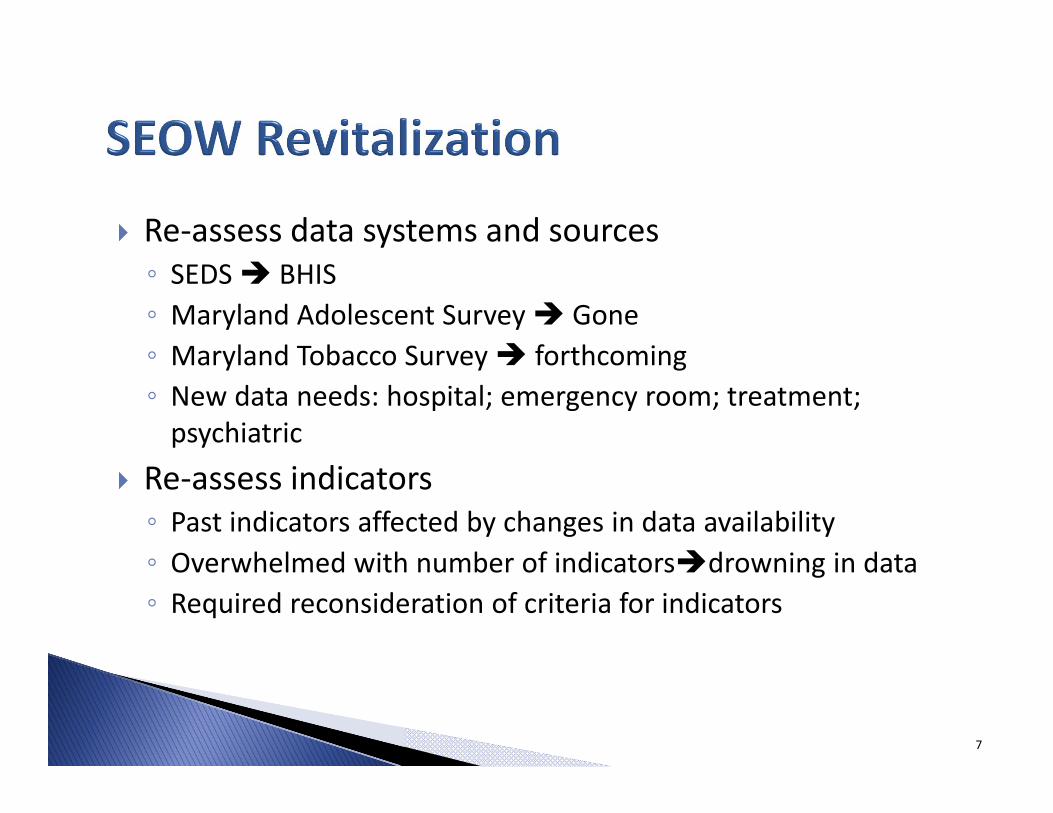
Re‐assess data systems and sources◦ SEDS BHIS◦ Maryland Adolescent Survey Gone◦ Maryland Tobacco Survey forthcoming◦ New data needs: hospital; emergency room; treatment; psychiatric
Re‐assess indicators◦ Past indicators affected by changes in data availability◦ Overwhelmed with number of indicators drowning in data◦ Required reconsideration of criteria for indicators
7

In past 6 months the SEOW has:◦ Reviewed other states’ SEOW/SEW programs for best models◦ Reviewed SEDD and BHIS guidance for recommended indicator criteria and indicators◦ Researched and brought ‘in house’ relevant data systems and sources◦ Identified core SEOW members◦ Developed a working document for your use: SEOW DATA INVENTORYA work always in progress
8

An indicator is a benchmark that provides information on consequences of alcohol and substance use, as well as measures of useDerived from various data sourcesUsed to:◦ Identify potential substance use problems◦ Monitor substance use concerns◦ Evaluate outcomes associated with programs ◦ Help determine prevention priorities to state and county prevention planners
9

GeneralizabilityAvailable over timeValid and reliableEvaluableCurrent
10

1) Available at the state level AND national AND/OR sub‐state levels. ◦ The ability to generalize the prevalence of an indicator to the nation provides both context and an assessment of a particular indicator’s relative severity. ◦ National comparisons context for whether a particular problem (e.g., binge drinking among young adults) is significant in the state. Such knowledge helps prioritize prevention efforts, as well as evaluate efforts that have active prevention initiatives. ◦ Similarly, comparison of sub‐state regions can help identify areas to target resources and initiatives.
11

Preferred: Jurisdiction, i.e., county (23) and Baltimore CityNSDUH provides 9 sub‐regions◦ Anne Arundel◦ Baltimore◦ Baltimore City◦ Montgomery◦ Prince George’s◦ North Central (Carroll, Howard)◦ Northeast (Caroline, Cecil, Harford, Kent, QA, Talbot)
◦ South (Calvert, Charles, Dorchester, St. Mary’s, Somerset, Wicomico, Worcester)
◦ West (Allegany, Frederick, Garrett, Washington)
12

2) The proposed indicator must be available over time. ◦ Evaluation of indicators over time provides a sense of change, and hence the effectiveness of prevention and policy initiatives.
13

3) The data from which the proposed indicator derives must have accepted validity and reliability. ◦ An indicator is only as good as its data source.
If sample sizes are inadequate, then reliable estimates cannot be made. If the data are not collected uniformly or routinely, then the indicator may not be valid.
14

4) The proposed indicator must be evaluable. That is, the chosen indicator must be related to the problem being assessed. ◦ If an indicator is too broadly defined, inferences about its relationship to alcohol and/or substances may not be clear or direct.
15

5) The proposed indicator should be current and available. ◦ Lag time between data collection and availability is important for states and their jurisdictions in prioritizing prevention efforts. ◦ Current data provides a more accurate snapshot of consequences and consumption.
16

Criteria applied to potential indicators sorting into primary and secondary indicator ‘buckets’◦ Primary Indicators meet mostof the 5 criteria◦ Secondary do not
17

Behavioral Health Indicator System (BHIS)Alcohol Epidemiologic Data System (AEDS)Fatality Analysis Reporting System (FARS)◦ Maryland Automated Accident Reporting System (MAARS)National Vital Statistics System (NVSS)Treatment Episode Data Set (TEDS)◦ State of Maryland Automated Record Tracking (SMART)Uniform Crime Report (UCR)
18

Behavioral Risk Factor Surveillance System (BRFSS)Youth Risk Behavior Survey (YRBS)National Survey on Drug Use and Health (NSDUH)Maryland Adolescent Survey Maryland Youth Tobacco SurveyOTHER: MSDE data; HIV/AIDS; PRAMS; State Emergency Department Database (SEDD); State Inpatient Databases (SID)
19

Consumption and Consequences associated with◦ Alcohol◦ Illicit Drugs◦ Tobacco
20

Consequences◦ Abuse/Dependence◦ Mortality (chronic liver disease)◦ Motor vehicle fatalities◦ Crashes related to alcohol use◦ Treatment admissions◦ Need for treatmentConsumption◦ Past‐month use ◦ Past‐month binge drinking◦ Past‐month heavy drinking◦ Perception of harm from binge drinking◦ Past‐month drinking + driving◦ First use before age 13◦ Per capita alcohol consumption
21

Consequences◦ Abuse or Dependence◦ Dependence◦ Treatment admissions (any; cocaine; heroin; marijuana; stimulants)◦ Need for treatmentConsumption◦ Past‐month use (any; marijuana; any other than marijuana)◦ Past‐year use (marijuana; cocaine)◦ Past‐year use non‐medical rx opioids◦ Age at first use (marijuana; cocaine)◦ Perception of harm from marijuana◦ First use before age 13
22

Consequences◦ Mortality (lung cancer; lung disease; cardiovascular disease)
Consumption◦ Past‐month use (cigarettes; smokeless tobacco)◦ First use before age 13◦ Perceptions of risk smoking >1 or more packs/day
23

School suspensions related to substance useSubstance use during pregnancySuicide ratesHomicide ratesDeaths from drug useViolent crimesProperty crimesNew state‐level measures in NSDUH: PY major depressive episode; PY MI; PY SMI; PY suicide thoughts; HIV/AIDS; state‐level inpatient and ED events; poison center calls
24

Objective: Provide a snapshot of Maryland young adults’ alcohol use and consequences patternsTwo levels of comparison:◦ Maryland vs U.S.◦ Within Maryland, Sub‐state jurisdictionsConsequences:◦ Motor Vehicle Crashes (MAARS/FARS)◦ % of Motor Vehicle Crashes that are Fatal (MAARS)◦ Alcohol Abuse/Dependence (NSDUH)◦ Alcohol‐related Treatment Admissions (SMART/TEDS)Consumption:◦ Any past‐Month Use (NSDUH)◦ Any Binge drinking (NSDUH)◦ Perceptions of Binge Drinking (NSDUH)
25

Maryland vs. United States: 2002‐2008 (2‐year estimates)◦ Past‐Month Alcohol Use◦ Perceptions of Great Risk of Binge‐Drinking◦ Past‐Month Binge Drinking
Maryland Sub‐State: 2004‐2006 vs.2006‐2008◦ Past‐Month Alcohol Use◦ Perceptions of Great Risk of Binge‐Drinking◦ Past‐Month Binge Drinking
26

60.9 60.9 60.7 61.4 61.6 61.2 61.5
64.2 64.1 62.9 62.965.9 65.6
60.8
0
10
20
30
40
50
60
70
80
02‐03 03‐04 04‐05 05‐06 06‐07 07‐08 08‐09
% Rep
ortin
g Use
Years
NSDUH: Past‐Month Alcohol Use Age 18‐25 years, MD vs US
US MD
27

61.062.8
57.0
67.1
53.5
61.464.4
54.2
69.1 68.1
0
10
20
30
40
50
60
70
80
% Rep
ortin
g Use
NSDUH: Past‐Month Alcohol Use Age 18‐25 Years by MD Sub‐State
2004‐2006 2006‐2008
Data not available for the following regions:‐ Anne Arundel‐Mongomery(2004‐2006)‐ North Central‐ Northeast‐ Prince George's (2006‐2008)
‐ South‐West
28

32.6 31.7 32.1 32.7 33.0 33.2 33.3
35.1 34.7 34.2 35.4 35.9 35.537.7
0
10
20
30
40
50
60
70
80
02‐03 03‐04 04‐05 05‐06 06‐07 07‐08 08‐09
Percen
t (%)
Years
NSDUH: Perception of Great Risk from Binge Drinking Age 18‐25 years, MD vs US
US MD
29

32.4
36.0
31.3
46.4
34.233.6
27.0
29.8
45.8
32.229.3
33.0
36.7
31.6
46.1
33.3
35.9
29.230.4
46.4
34.7
28.5
0
5
10
15
20
25
30
35
40
45
50
Percen
t (%)
NSDUH: Perception of Great Risk from Binge Drinking Age 18‐25 Years by MD Sub‐State
2004‐2006 2006‐2008
30

41.3 41.4 41.5 42.0 42.0 41.4 41.4
39.837.6 37.3 37.5
40.2 40.6
36.7
0
10
20
30
40
50
60
70
80
02‐03 03‐04 04‐05 05‐06 06‐07 07‐08 08‐09
% Rep
ortin
g Use
Years
NSDUH: Past‐Month Binge Drinking Age 18‐25 years, MD vs US
US MD31

41.6
36.9
31.1
39.0
35.3
27.6
41.7
39.1
31.6
45.5
27.7
0
5
10
15
20
25
30
35
40
45
50
% Rep
ortin
g Use
NSDUH: Past‐Month Binge Drinking Age 18‐25 Years by MD Sub‐State
2004‐2006 2006‐2008
Data not available for the following regions:‐ Anne Arundel‐ Mongomery(2006‐2008)‐ North Central‐ Northeast‐ South‐West
32

Alcohol Abuse/Dependence◦ Maryland vs. US, 2002‐2009 (2‐yr estimates)◦ Maryland Sub‐State 2004‐2006 vs. 2006‐2008 (3‐yr estimates)
Alcohol Treatment Admissions◦ Maryland, 2000‐2010◦ Jurisdiction, 2010
Traffic Fatalities◦ Proportion of Total Alcohol/Drug‐Related Crashes that are Fatal, by Jurisdiction (2006‐2010)
33

17.4 17.3 17.5 17.617.2 17.0
16.0
16.8 15.116.7
18.6
16.3
0.00
2.00
4.00
6.00
8.00
10.00
12.00
14.00
16.00
18.00
20.00
03‐04 04‐05 05‐06 06‐07 07‐08 08‐09
Percen
t (%)
Years
NSDUH: Percent of Residents meeting DSM‐IV for Alcohol Abuse/Dependence in the Past Year, Aged 18‐25,
MD vs. US
US MD
34

17.3
15.814.9
17.6
15.7
13.2
14.4
16.117.2
16.6
19.3
14.8
19.3
15.4
12.7
15.9
17.2
0.00
5.00
10.00
15.00
20.00
25.00
Percen
t (%)
NSDUH: Percent of Residents meeting DSM‐IV for Alcohol Abuse/Dependence in the Past Year, Aged 18‐25
2004‐2006
2006‐2008
Data not available for following regions: ‐ Anne Arundel(2004‐2006)‐ North Central ‐ Northeast (2004‐2006,
35

36
386 378 390371 364 361
384 398 411392
753
897 896 888 882855 847
750
644
561
0
100
200
300
400
500
600
700
800
900
1000
2000 2001 2002 2003 2004 2005 2006 2007 2008 2009
Admission
s per 100
,000
pop
ulation aged
18‐24
YEARS
TEDS: Primary Alcohol Treatment Admissions Aged 18‐24, US vs. MD
US MD

402.7 390.8
451.9437.5 449.4
512.9 524.2499.5
421.0437.9 434.1
0.00
100.00
200.00
300.00
400.00
500.00
600.00
2000 2001 2002 2003 2004 2005 2006 2007 2008 2009 2010
Rate per 100,000
Years
TEDS/SMART: MD Alcohol Related Treatment Admissions Aged 18‐25, 2000‐2010
37
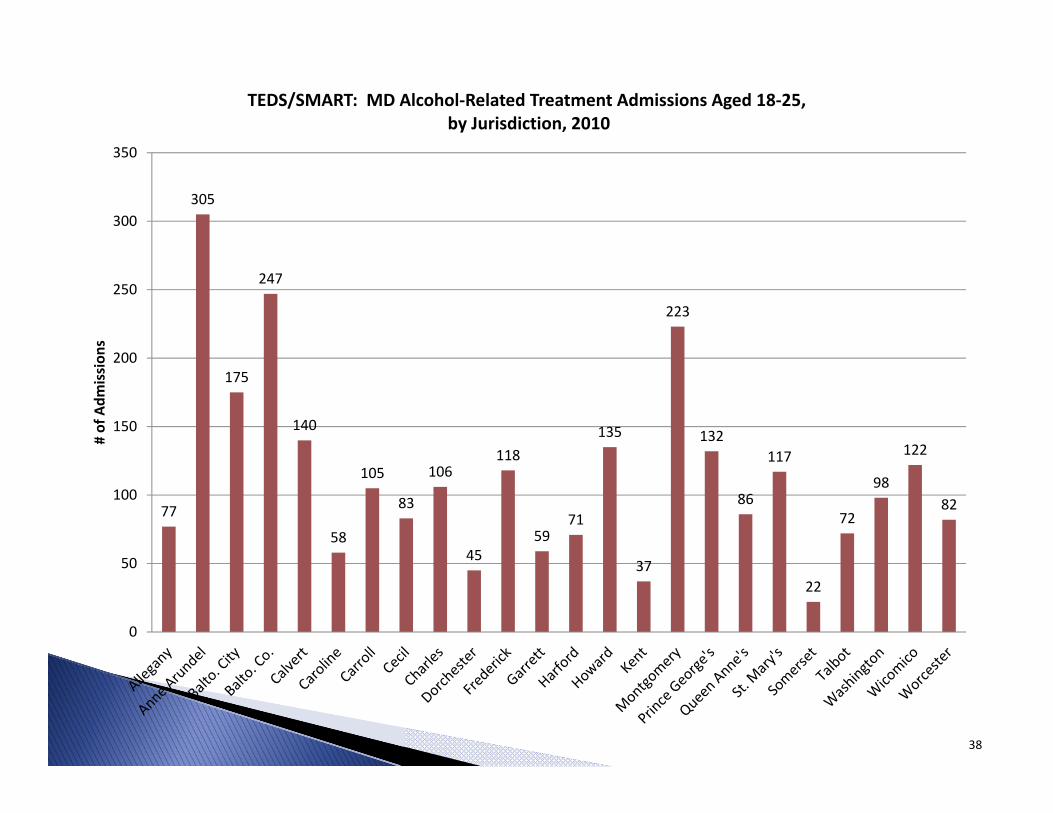
77
305
175
247
140
58
105
83
106
45
118
5971
135
37
223
132
86
117
22
72
98
122
82
0
50
100
150
200
250
300
350
# of Adm
ission
sTEDS/SMART: MD Alcohol‐Related Treatment Admissions Aged 18‐25,
by Jurisdiction, 2010
38

39
41.6 41.641.3
42.0
40.5
41.8
39.2
41.8
38
38
39
39
40
40
41
41
42
42
43
2006 2007 2008 2009
Percen
t (%
)
Years
FARS: Percentage of Alcohol‐Related Fatal Crashes All Ages, US vs MD
Fatal Crashes in US Involving Alcohol Fatal Crashes in MD Involving Alcohol

40
3.0 3.0
2.01.9
2.5
0
1
2
3
4
2006 2007 2008 2009 2010
% of T
otal Crashes
Years
MAARS: Percent of Alcohol or Drug‐Related Fatalities,Among All Crashes Age 18‐25 Years, Maryland

41
17
238
290
48
13
78 7464
13
92
17
84
110
12
272 278
29
46
1123
51
7366
153
0
50
100
150
200
250
300
350# of Crashes
MAARS: Total Number Crashes involving Alcohol or Drugs Aged 18‐25 Years, by Maryland Counties, 2010

42
5.9
0.8 0.7
0.0
7.7
1.3
0.0
3.1
0.0
5.4
0.0
4.84.5
0.0
1.5
4.7
0.0
2.2
9.1 8.7
3.9
0.0 0.0
4.6
0
1
2
3
4
5
6
7
8
9
10
Percen
t (%)
MAARS: Percent of Fatal Crashes involving Alcohol or Drugs Among All Crashes Aged 18‐25, by Maryland Counties, 2010

WebsiteHow to Meet the ADAA Mandate to Expand?◦ Other Data Sources?
Substance Use PreventionSubstance Use TreatmentOther Behavioral Prevention and Treatment?
◦ Other People?In DHMH?Other state agencies? Federal agencies?Other institutional?
43