January, 2014 - krblrice.comkrblrice.com/fy-2014/presentation/corporate_presentation_180114.pdf ·...
24
Confidential INVESTOR PRESENTATION INVESTOR PRESENTATION January, 2014 January, 2014
Transcript of January, 2014 - krblrice.comkrblrice.com/fy-2014/presentation/corporate_presentation_180114.pdf ·...
Confidential
INVESTOR PRESENTATIONINVESTOR PRESENTATIONJanuary, 2014January, 2014
Safe Harbor
This presentation contains statements that contain “forward looking statements” including, butwithout limitation, statements relating to the implementation of strategic initiatives, and otherstatements relating to KRBL Limited and its affiliated companies (“KRBL”) future businessdevelopments and economic performance.
While these forward looking statements indicate our assessment and future expectations concerningthe development of our business, a number of risks, uncertainties and other unknown factors could
IIMPORTANTMPORTANT NNOTICEOTICE
the development of our business, a number of risks, uncertainties and other unknown factors couldcause actual developments and results to differ materially from our expectations.
These factors include, but are not limited to, general market, macro-economic, governmental andregulatory trends, movements in currency exchange and interest rates, competitive pressures,technological developments, changes in the financial conditions of third parties dealing with us,legislative developments, and other key factors that could affect our business and financialperformance.
KRBL undertakes no obligation to periodically revise any forward looking statements to reflect future/ likely events or circumstances.
2
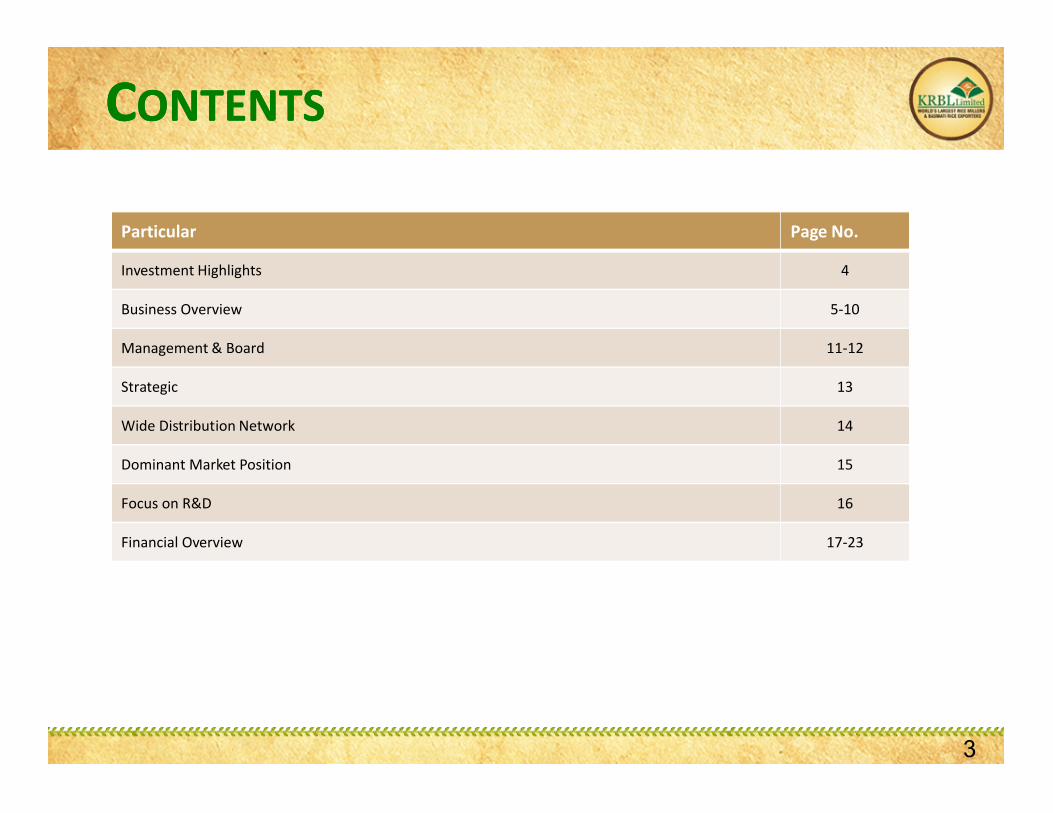
Particular Page No.
Investment Highlights 4
Business Overview 5-10
Management & Board 11-12
Strategic 13
CCONTENTSONTENTS
Wide Distribution Network 14
Dominant Market Position 15
Focus on R&D 16
Financial Overview 17-23
3
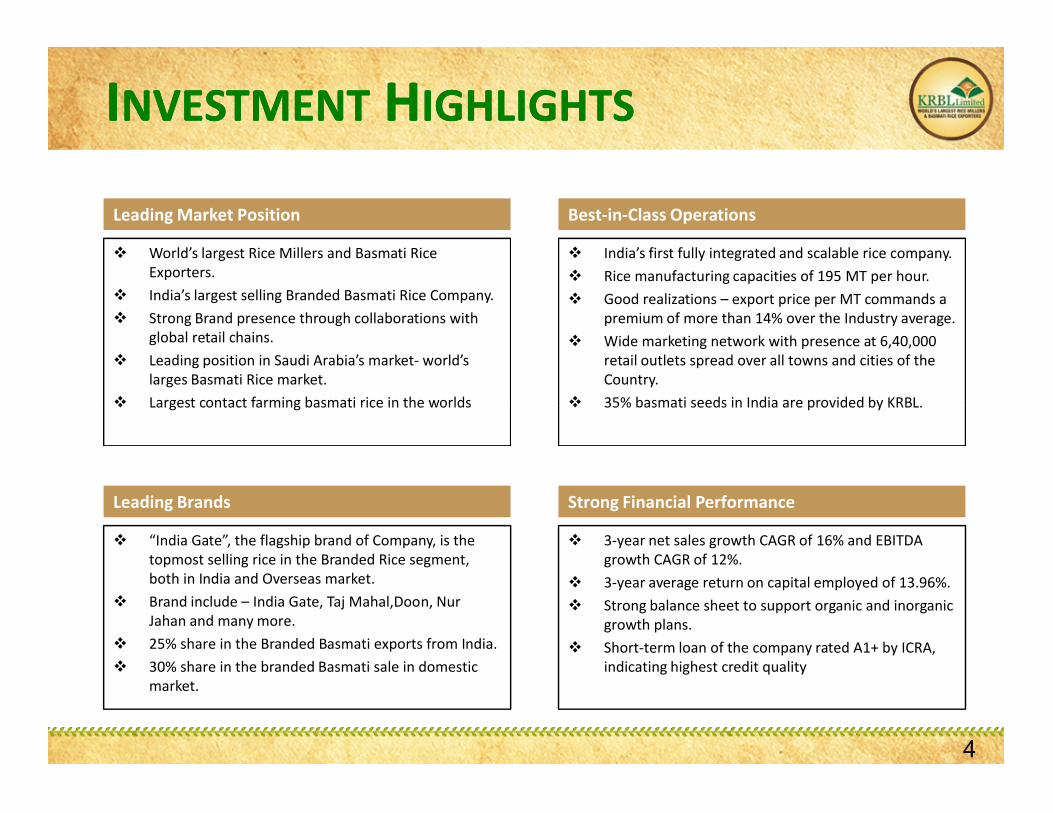
Leading Market Position
World’s largest Rice Millers and Basmati Rice Exporters.
India’s largest selling Branded Basmati Rice Company. Strong Brand presence through collaborations with
global retail chains. Leading position in Saudi Arabia’s market- world’s
larges Basmati Rice market. Largest contact farming basmati rice in the worlds
Best-in-Class Operations
India’s first fully integrated and scalable rice company. Rice manufacturing capacities of 195 MT per hour. Good realizations – export price per MT commands a
premium of more than 14% over the Industry average. Wide marketing network with presence at 6,40,000
retail outlets spread over all towns and cities of the Country.
35% basmati seeds in India are provided by KRBL.
IINVESTMENTNVESTMENT HHIGHLIGHTSIGHLIGHTS
Largest contact farming basmati rice in the worlds
Leading Brands
“India Gate”, the flagship brand of Company, is the topmost selling rice in the Branded Rice segment, both in India and Overseas market.
Brand include – India Gate, Taj Mahal,Doon, NurJahan and many more.
25% share in the Branded Basmati exports from India. 30% share in the branded Basmati sale in domestic
market.
35% basmati seeds in India are provided by KRBL.
Strong Financial Performance
3-year net sales growth CAGR of 16% and EBITDA growth CAGR of 12%.
3-year average return on capital employed of 13.96%. Strong balance sheet to support organic and inorganic
growth plans. Short-term loan of the company rated A1+ by ICRA,
indicating highest credit quality
4
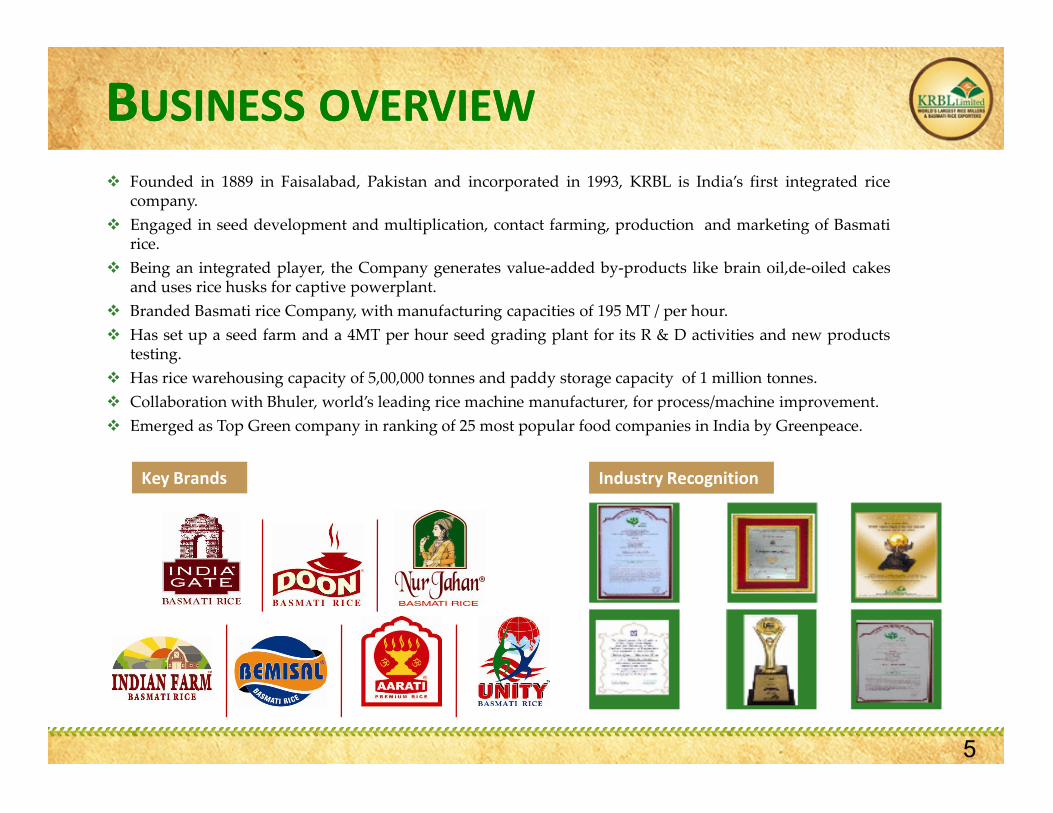
BBUSINESSUSINESS OVERVIEWOVERVIEW Founded in 1889 in Faisalabad, Pakistan and incorporated in 1993, KRBL is India’s first integrated rice
company. Engaged in seed development and multiplication, contact farming, production and marketing of Basmati
rice. Being an integrated player, the Company generates value-added by-products like brain oil,de-oiled cakes
and uses rice husks for captive powerplant. Branded Basmati rice Company, with manufacturing capacities of 195 MT / per hour. Has set up a seed farm and a 4MT per hour seed grading plant for its R & D activities and new products
testing. Has rice warehousing capacity of 5,00,000 tonnes and paddy storage capacity of 1 million tonnes. Collaboration with Bhuler, world’s leading rice machine manufacturer, for process/machine improvement. Collaboration with Bhuler, world’s leading rice machine manufacturer, for process/machine improvement. Emerged as Top Green company in ranking of 25 most popular food companies in India by Greenpeace.
Key Brands Industry Recognition
5
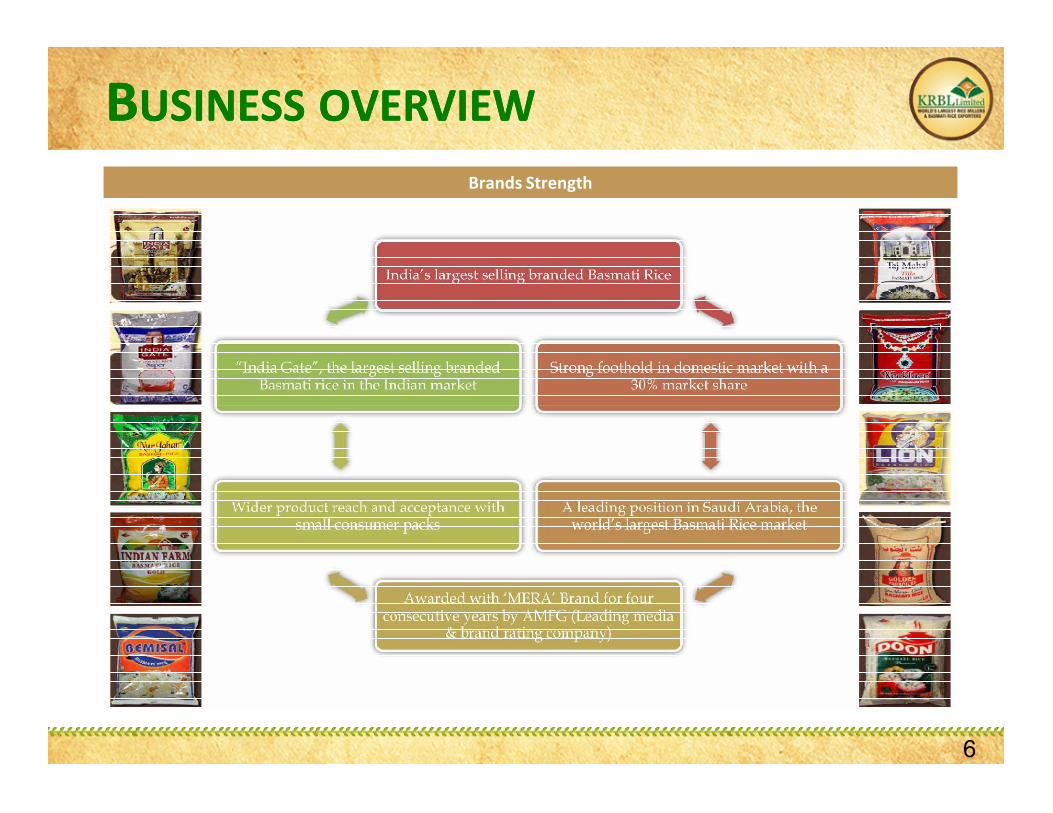
BBUSINESSUSINESS OVERVIEWOVERVIEWBrands Strength
6
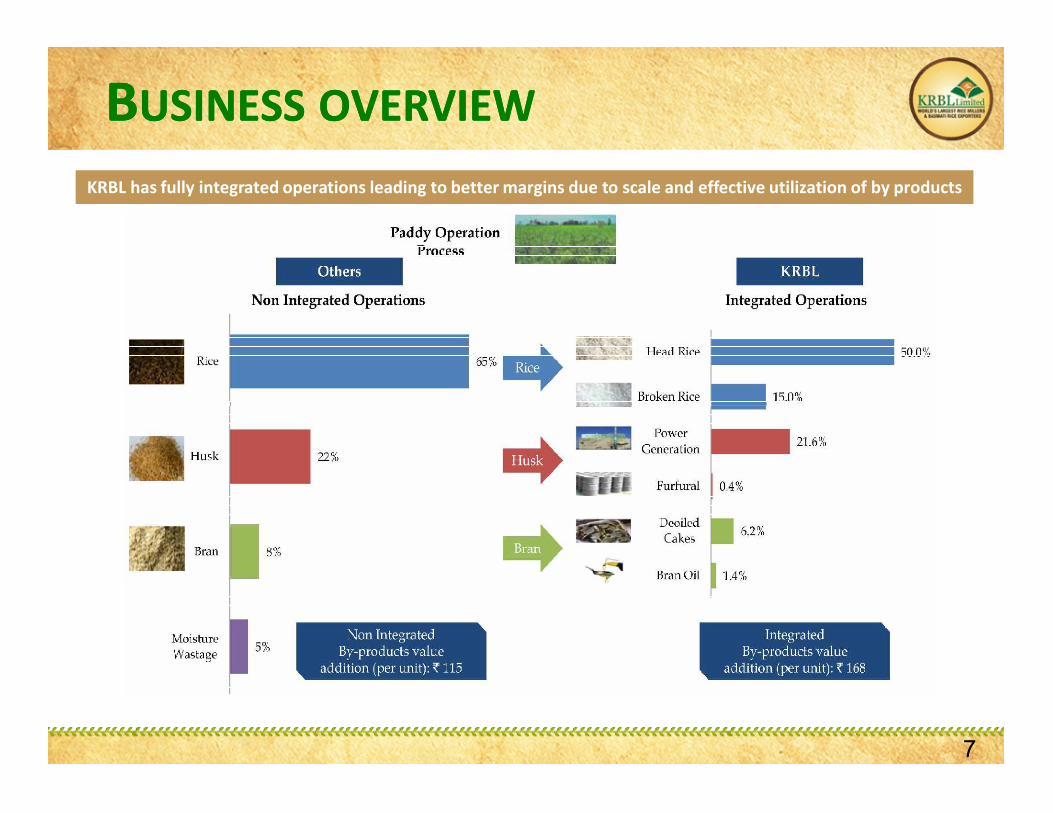
BBUSINESSUSINESS OVERVIEWOVERVIEWKRBL has fully integrated operations leading to better margins due to scale and effective utilization of by products
7
BBUSINESSUSINESS OVERVIEWOVERVIEW
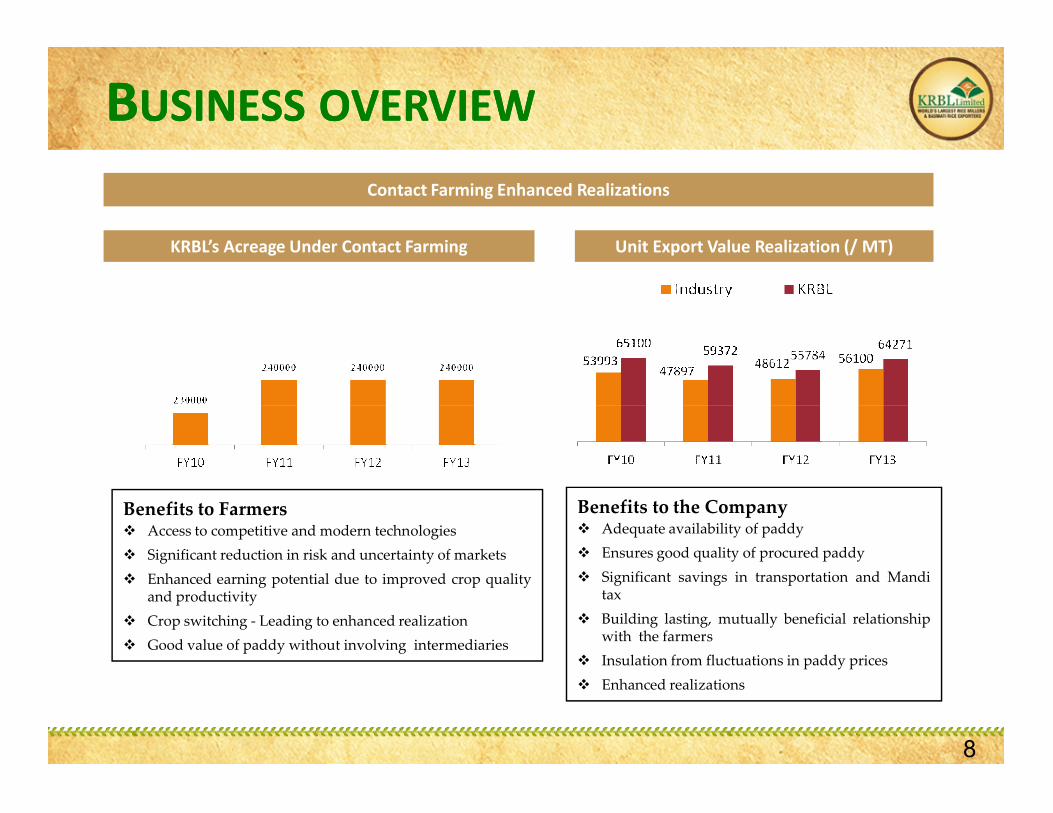
Contact Farming Enhanced Realizations
KRBL’s Acreage Under Contact Farming Unit Export Value Realization (/ MT)
Benefits to Farmers Access to competitive and modern technologies Significant reduction in risk and uncertainty of markets Enhanced earning potential due to improved crop quality
and productivity Crop switching - Leading to enhanced realization Good value of paddy without involving intermediaries
Benefits to the Company Adequate availability of paddy Ensures good quality of procured paddy Significant savings in transportation and Mandi
tax Building lasting, mutually beneficial relationship
with the farmers Insulation from fluctuations in paddy prices Enhanced realizations
8
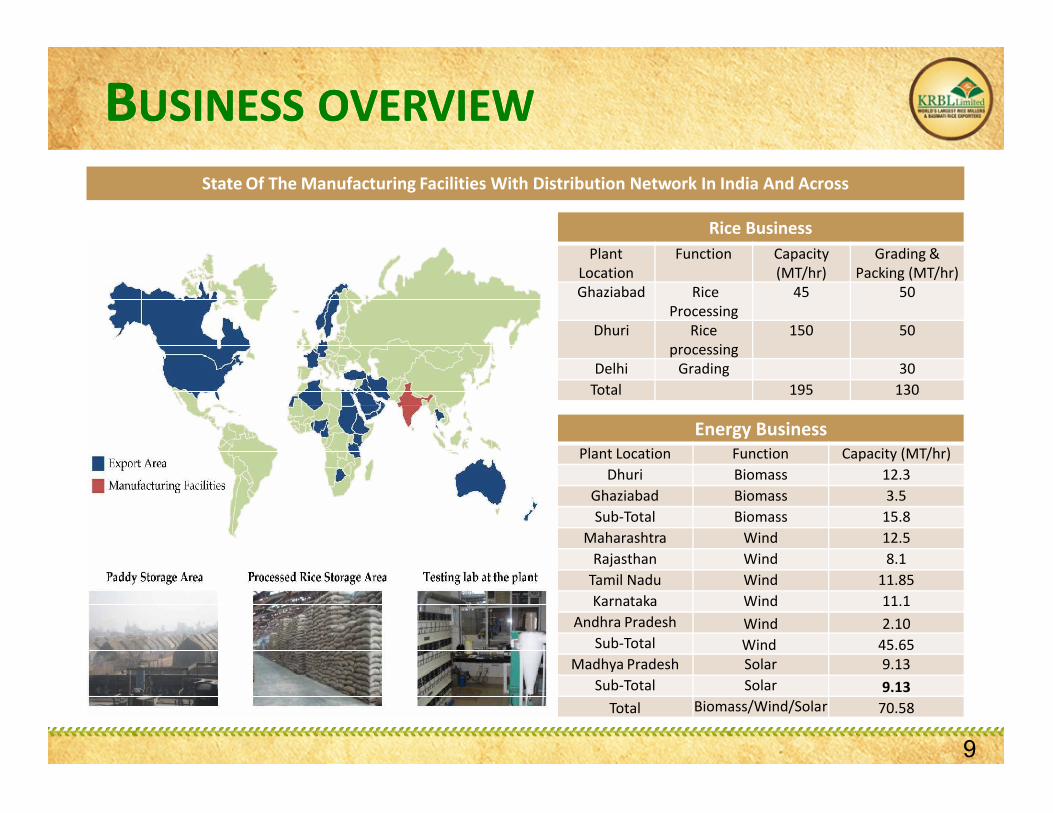
BBUSINESSUSINESS OVERVIEWOVERVIEWState Of The Manufacturing Facilities With Distribution Network In India And Across
Rice BusinessPlant
LocationFunction Capacity
(MT/hr)Grading &
Packing (MT/hr)Ghaziabad Rice
Processing45 50
Dhuri Rice processing
150 50
Delhi Grading 30Total 195 130
9
Energy BusinessPlant Location Function Capacity (MT/hr)
Dhuri Biomass 12.3Ghaziabad Biomass 3.5Sub-Total Biomass 15.8
Maharashtra Wind 12.5Rajasthan Wind 8.1
Tamil Nadu Wind 11.85Karnataka Wind 11.1
Andhra Pradesh Wind 2.10Sub-Total Wind 45.65
Madhya Pradesh Solar 9.13Sub-Total Solar 9.13
Total Biomass/Wind/Solar 70.58
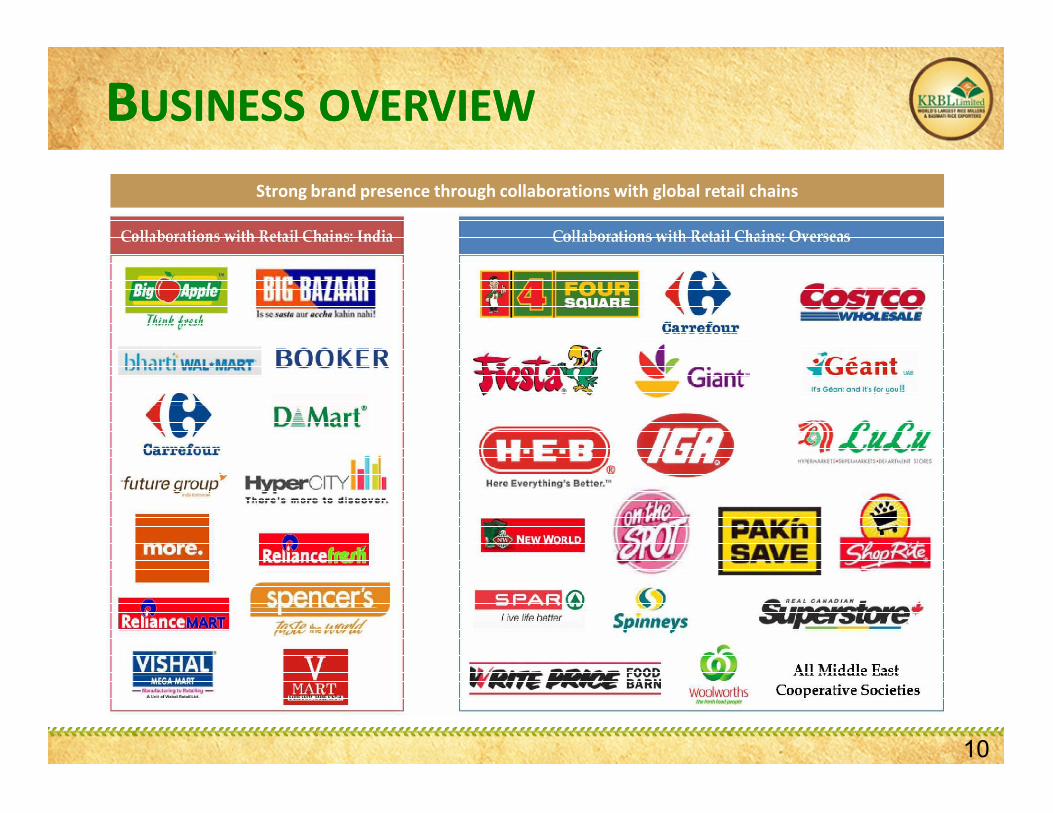
BBUSINESSUSINESS OVERVIEWOVERVIEW
Strong brand presence through collaborations with global retail chains
10
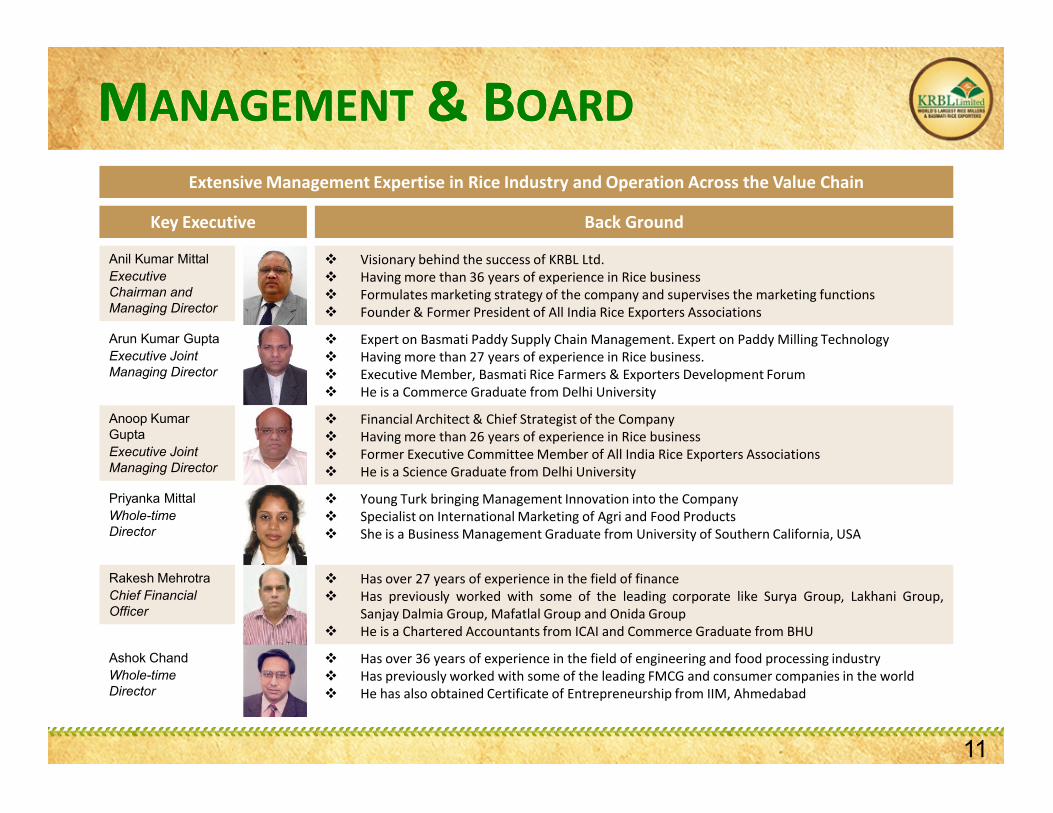
MMANAGEMENTANAGEMENT & B& BOARDOARDExtensive Management Expertise in Rice Industry and Operation Across the Value Chain
Key Executive
Anil Kumar MittalExecutive Chairman and Managing Director
Visionary behind the success of KRBL Ltd. Having more than 36 years of experience in Rice business Formulates marketing strategy of the company and supervises the marketing functions Founder & Former President of All India Rice Exporters Associations
Arun Kumar GuptaExecutive Joint Managing Director
Expert on Basmati Paddy Supply Chain Management. Expert on Paddy Milling Technology Having more than 27 years of experience in Rice business. Executive Member, Basmati Rice Farmers & Exporters Development Forum He is a Commerce Graduate from Delhi University
Back Ground
Anoop Kumar GuptaExecutive Joint Managing Director
Financial Architect & Chief Strategist of the Company Having more than 26 years of experience in Rice business Former Executive Committee Member of All India Rice Exporters Associations He is a Science Graduate from Delhi University
Priyanka MittalWhole-time Director
Young Turk bringing Management Innovation into the Company Specialist on International Marketing of Agri and Food Products She is a Business Management Graduate from University of Southern California, USA
Rakesh MehrotraChief Financial Officer
Has over 27 years of experience in the field of finance Has previously worked with some of the leading corporate like Surya Group, Lakhani Group,
Sanjay Dalmia Group, Mafatlal Group and Onida Group He is a Chartered Accountants from ICAI and Commerce Graduate from BHU
Ashok ChandWhole-time Director
Has over 36 years of experience in the field of engineering and food processing industry Has previously worked with some of the leading FMCG and consumer companies in the world He has also obtained Certificate of Entrepreneurship from IIM, Ahmedabad
11
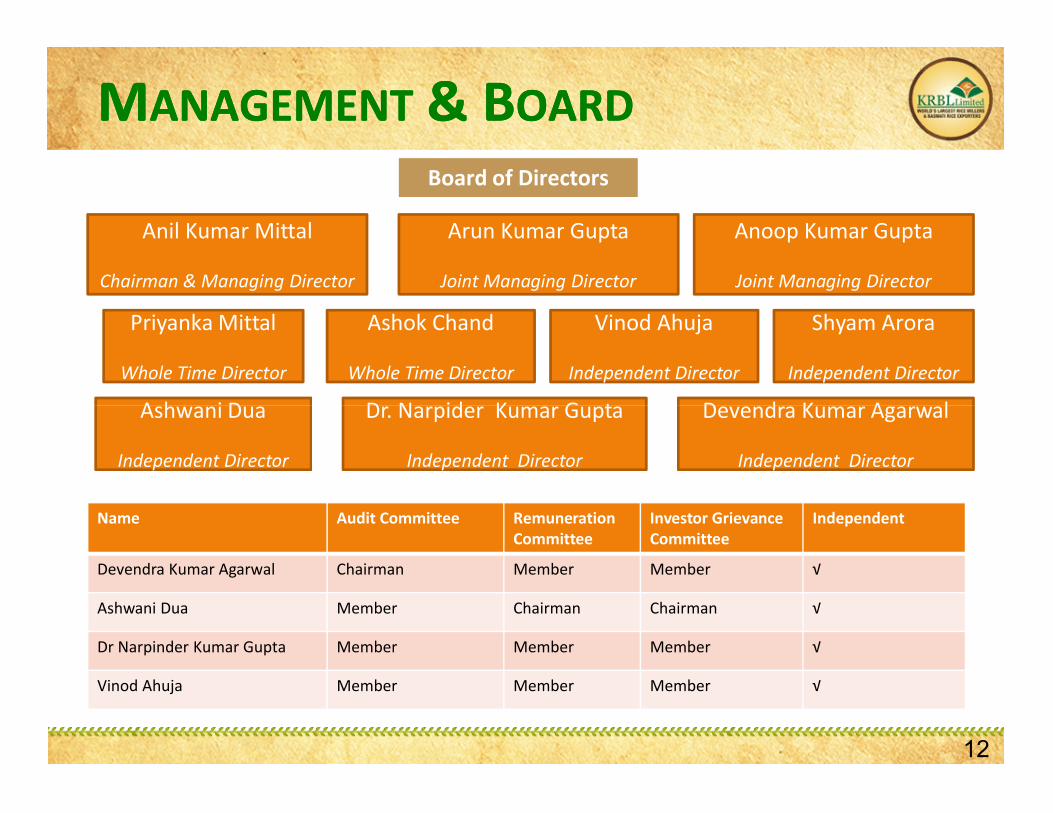
MMANAGEMENTANAGEMENT & B& BOARDOARDBoard of Directors
Anil Kumar Mittal
Chairman & Managing Director
Arun Kumar Gupta
Joint Managing Director
Anoop Kumar Gupta
Joint Managing Director
Priyanka Mittal
Whole Time Director
Ashok Chand
Whole Time Director
Vinod Ahuja
Independent Director
Shyam Arora
Independent Director
Ashwani Dua Dr. Narpider Kumar Gupta Devendra Kumar Agarwal
12
Ashwani Dua
Independent Director
Dr. Narpider Kumar Gupta
Independent Director
Devendra Kumar Agarwal
Independent Director
Name Audit Committee RemunerationCommittee
Investor Grievance Committee
Independent
Devendra Kumar Agarwal Chairman Member Member √
Ashwani Dua Member Chairman Chairman √
Dr Narpinder Kumar Gupta Member Member Member √
Vinod Ahuja Member Member Member √
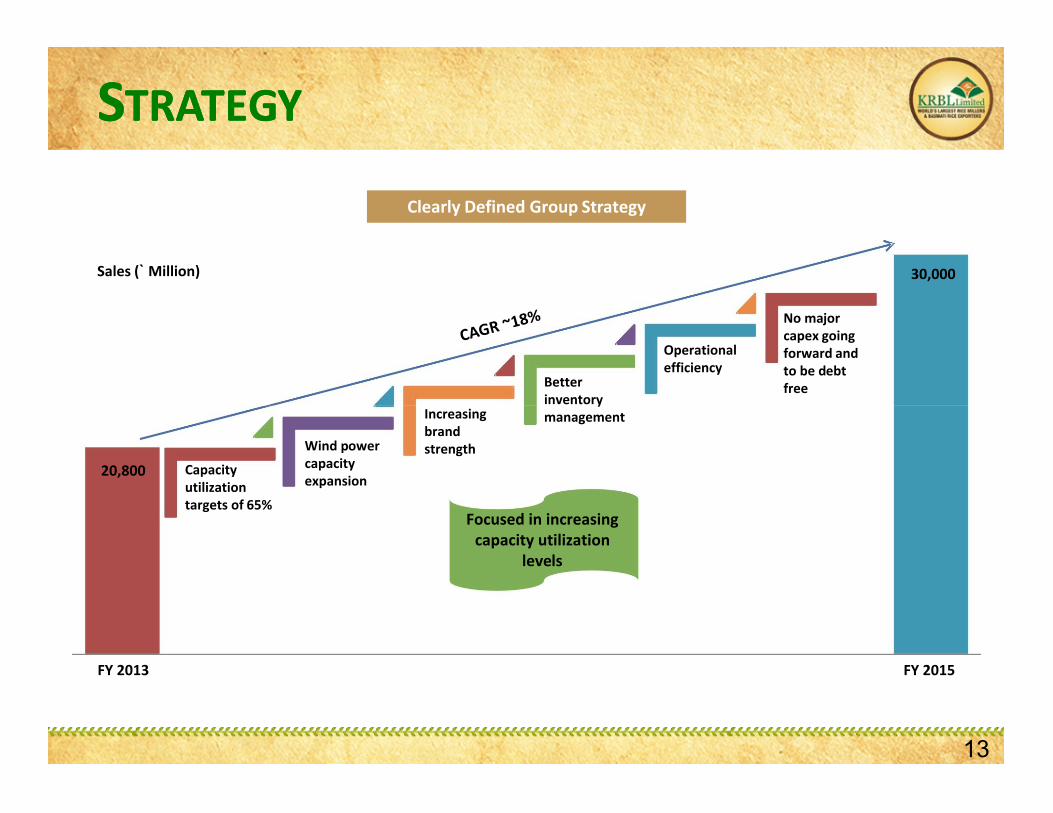
SSTRATEGYTRATEGY
Clearly Defined Group Strategy
Sales (` Million)
Increasing
Better inventory
Operational efficiency
No major capex going forward and to be debt free
30,000
20,800 Capacity utilization targets of 65%
Wind power capacity expansion
Increasing brand strength
inventory management
Focused in increasing capacity utilization
levels
FY 2013 FY 2015
13
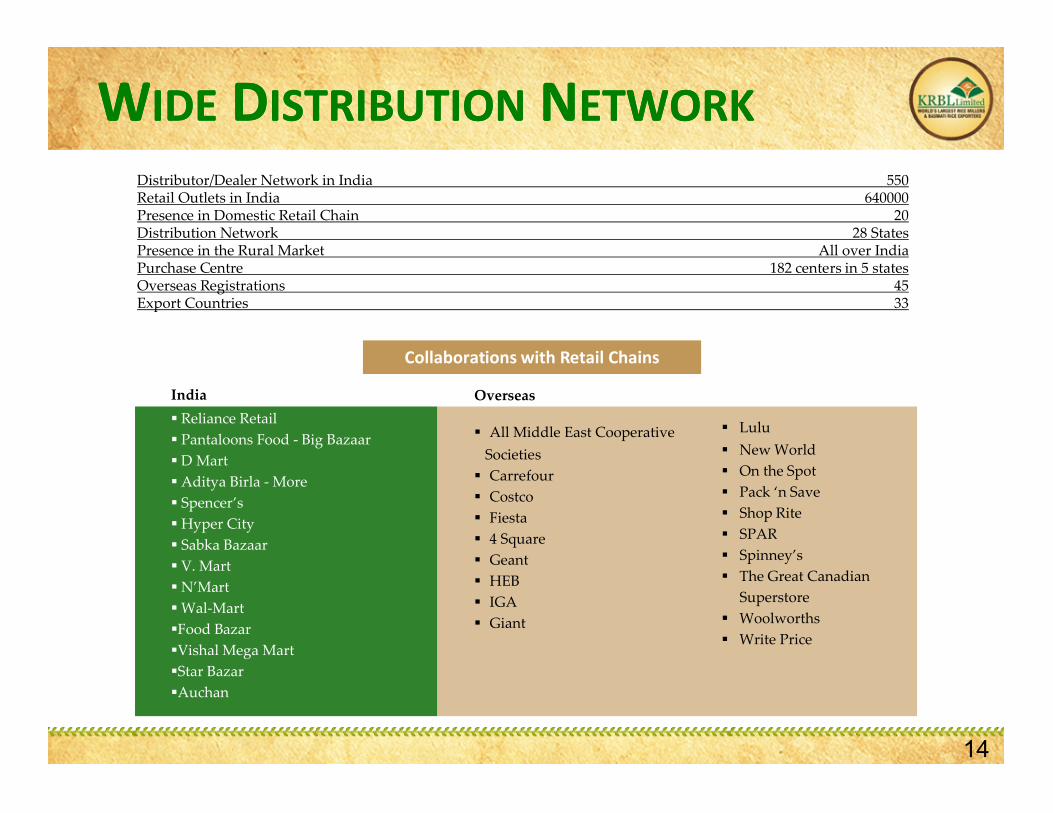
Collaborations with Retail Chains
India Overseas
Distributor/Dealer Network in India 550Retail Outlets in India 640000Presence in Domestic Retail Chain 20Distribution Network 28 StatesPresence in the Rural Market All over IndiaPurchase Centre 182 centers in 5 statesOverseas Registrations 45Export Countries 33
WWIDEIDE DDISTRIBUTIONISTRIBUTION NNETWORKETWORK
Reliance Retail Pantaloons Food - Big Bazaar D Mart Aditya Birla - More Spencer’sHyper City Sabka Bazaar V. MartN’MartWal-MartFood BazarVishal Mega MartStar BazarAuchan
All Middle East Cooperative Societies Carrefour Costco Fiesta 4 Square Geant HEB IGA Giant
Lulu New World On the Spot Pack ‘n Save Shop Rite SPAR Spinney’s The Great Canadian
Superstore Woolworths Write Price
14
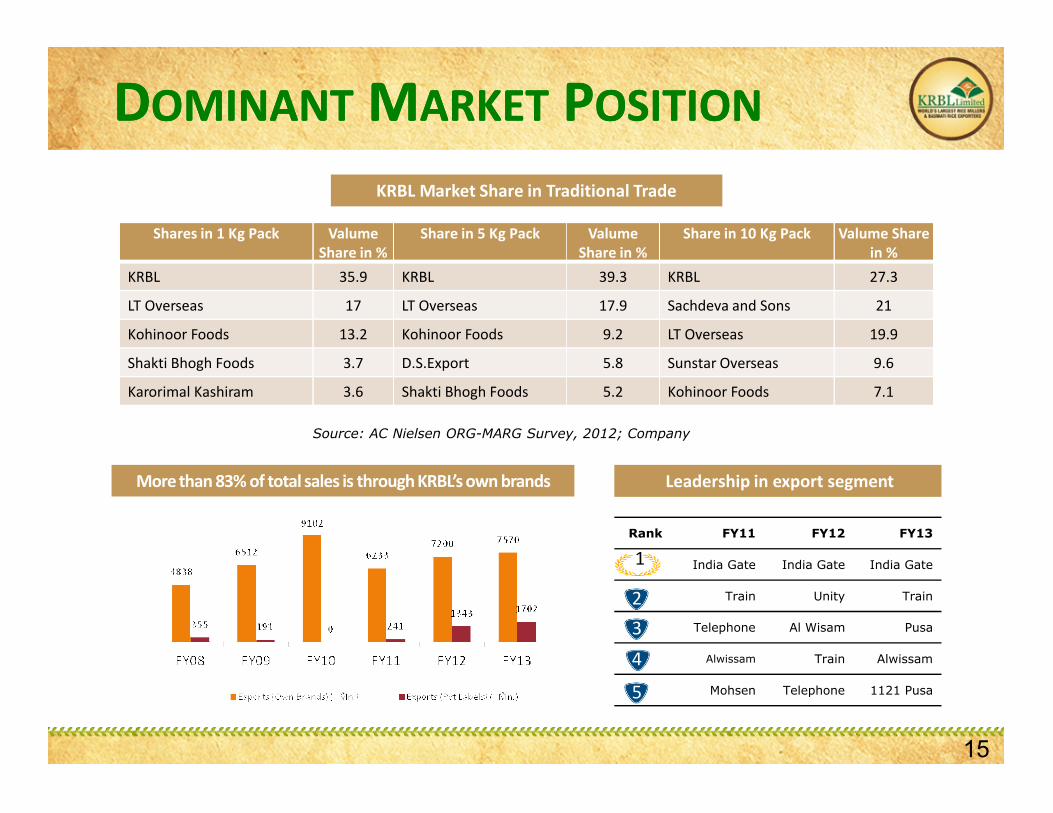
DDOMINANTOMINANT MMARKETARKET PPOSITIONOSITION
KRBL Market Share in Traditional Trade
Shares in 1 Kg Pack ValumeShare in %
Share in 5 Kg Pack ValumeShare in %
Share in 10 Kg Pack Valume Share in %
KRBL 35.9 KRBL 39.3 KRBL 27.3
LT Overseas 17 LT Overseas 17.9 Sachdeva and Sons 21
Kohinoor Foods 13.2 Kohinoor Foods 9.2 LT Overseas 19.9
Shakti Bhogh Foods 3.7 D.S.Export 5.8 Sunstar Overseas 9.6
Karorimal Kashiram 3.6 Shakti Bhogh Foods 5.2 Kohinoor Foods 7.1
More than 83% of total sales is through KRBL’s own brands Leadership in export segment
Rank FY11 FY12 FY13
India Gate India Gate India Gate
Train Unity Train
Telephone Al Wisam Pusa
Alwissam Train Alwissam
Mohsen Telephone 1121 Pusa
1
3
4
5
Source: AC Nielsen ORG-MARG Survey, 2012; Company
2
15
``
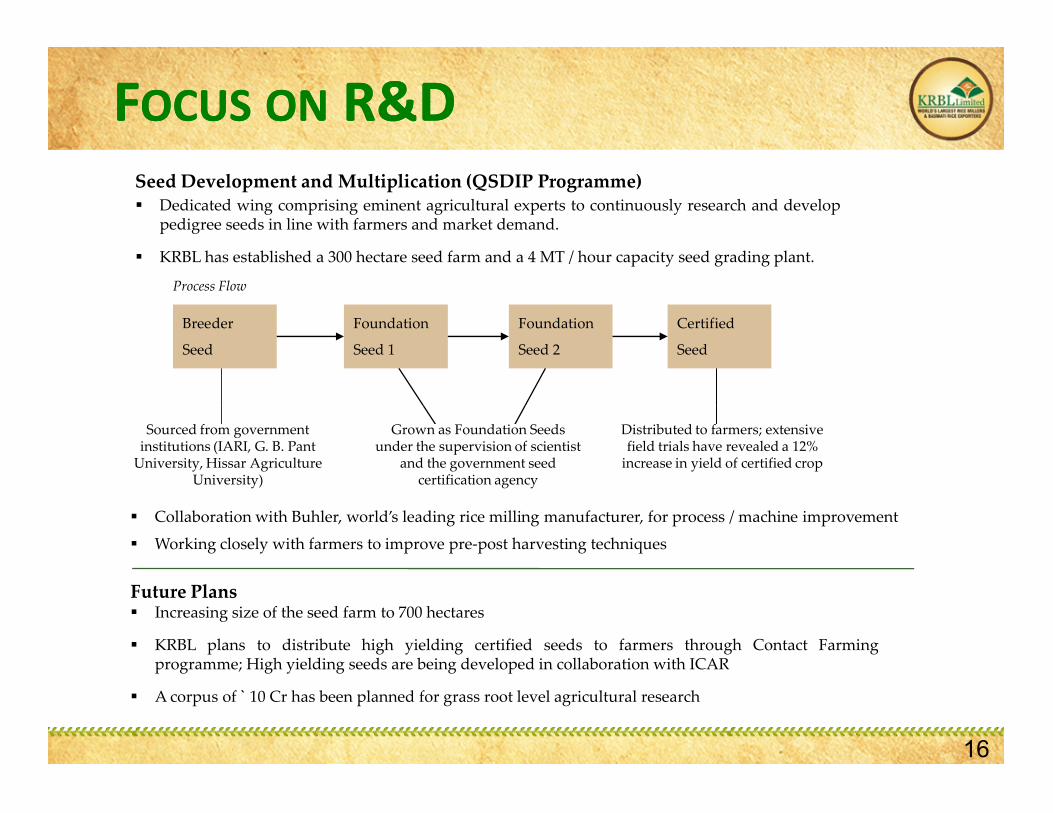
FFOCUSOCUS ONON R&DR&DSeed Development and Multiplication (QSDIP Programme) Dedicated wing comprising eminent agricultural experts to continuously research and develop
pedigree seeds in line with farmers and market demand.
KRBL has established a 300 hectare seed farm and a 4 MT / hour capacity seed grading plant.
Process Flow
Breeder
Seed
Foundation
Seed 1
Foundation
Seed 2
Certified
Seed
Future Plans Increasing size of the seed farm to 700 hectares
KRBL plans to distribute high yielding certified seeds to farmers through Contact Farmingprogramme; High yielding seeds are being developed in collaboration with ICAR
A corpus of ` 10 Cr has been planned for grass root level agricultural research
Sourced from government institutions (IARI, G. B. Pant
University, Hissar Agriculture University)
Grown as Foundation Seeds under the supervision of scientist
and the government seed certification agency
Distributed to farmers; extensive field trials have revealed a 12%
increase in yield of certified crop
Collaboration with Buhler, world’s leading rice milling manufacturer, for process / machine improvement
Working closely with farmers to improve pre-post harvesting techniques
16
FFINANCIALINANCIAL OOVERVIEWVERVIEW
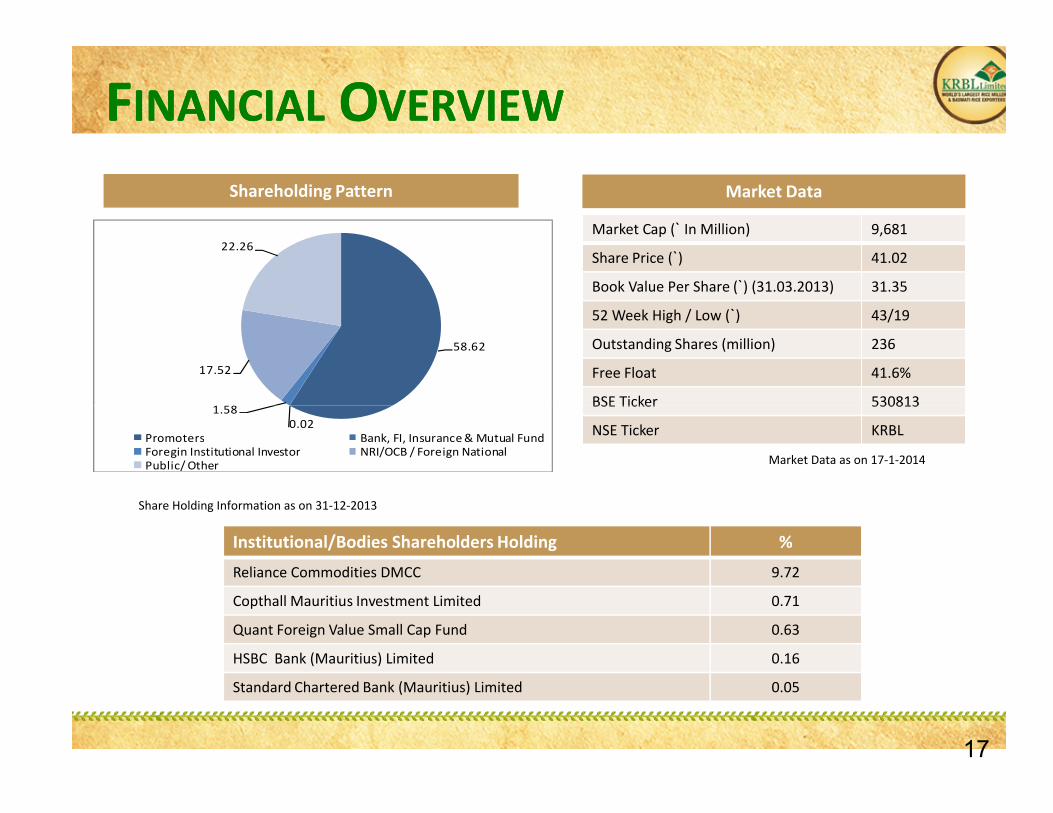
58.62
1.58
17.52
22.26
Shareholding Pattern Market Data
Market Cap (` In Million) 9,681
Share Price (`) 41.02
Book Value Per Share (`) (31.03.2013) 31.35
52 Week High / Low (`) 43/19
Outstanding Shares (million) 236
Free Float 41.6%
BSE Ticker 5308130.02
1.58
Promoters Bank, FI, Insurance & Mutual FundForegin Institutional Investor NRI/OCB / Foreign NationalPublic/ Other
Institutional/Bodies Shareholders Holding %
Reliance Commodities DMCC 9.72
Copthall Mauritius Investment Limited 0.71
Quant Foreign Value Small Cap Fund 0.63
HSBC Bank (Mauritius) Limited 0.16
Standard Chartered Bank (Mauritius) Limited 0.05
BSE Ticker 530813
NSE Ticker KRBL
Share Holding Information as on 31-12-2013
17
Market Data as on 17-1-2014

FFINANCIALINANCIAL OOVERVIEWVERVIEW
Return on Capital Employed Return on Equity
23.14%18.51%
10.11%
15.58%
FY 2010 FY 2011 FY 2012 FY 2013
22.72%
17.54%
9.34%
14.99%
EPS and CASH EPS
` Pe
r Sh
are
FY 2010 FY 2011 FY 2012 FY 2013FY 2010 FY 2011 FY 2012 FY 2013
18
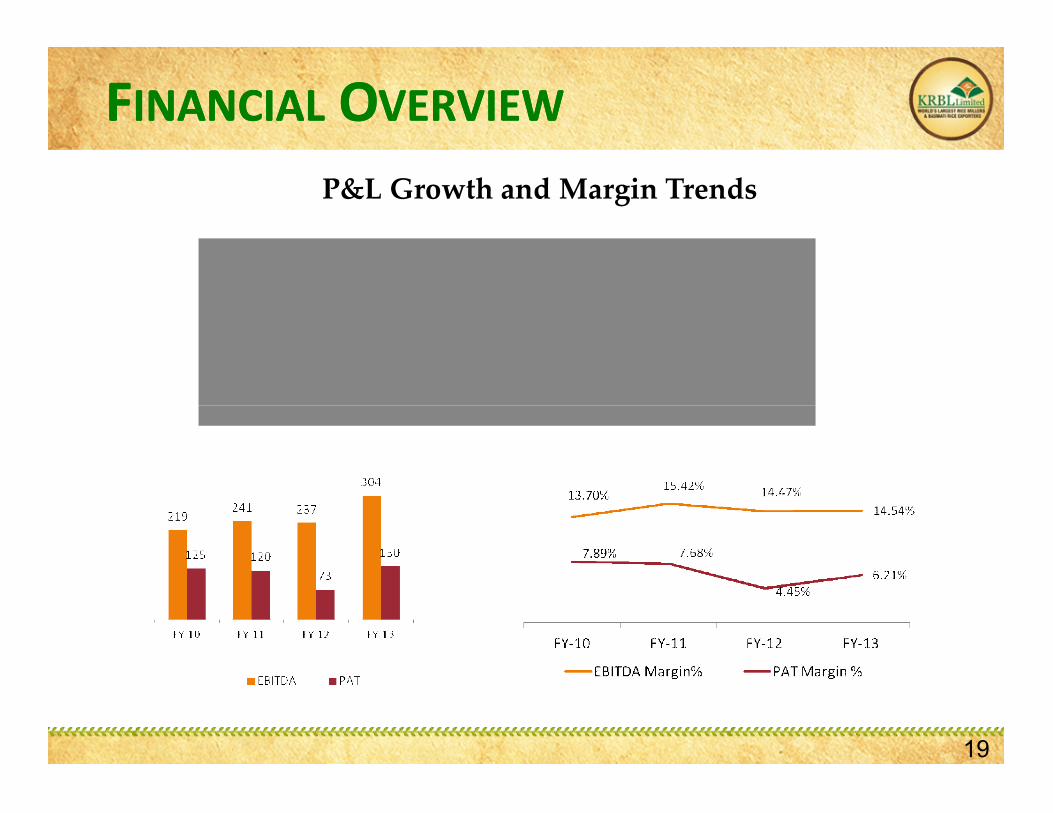
1600 1552 16402091
2700
0
1000
2000
3000
FY-10 FY-11 FY-12 FY-13 FY-14 (Estimated)
Revenue (` in Cr.)
P&L Growth and Margin Trends
FFINANCIALINANCIAL OOVERVIEWVERVIEW
FY-10 FY-11 FY-12 FY-13 FY-14 (Estimated)
19
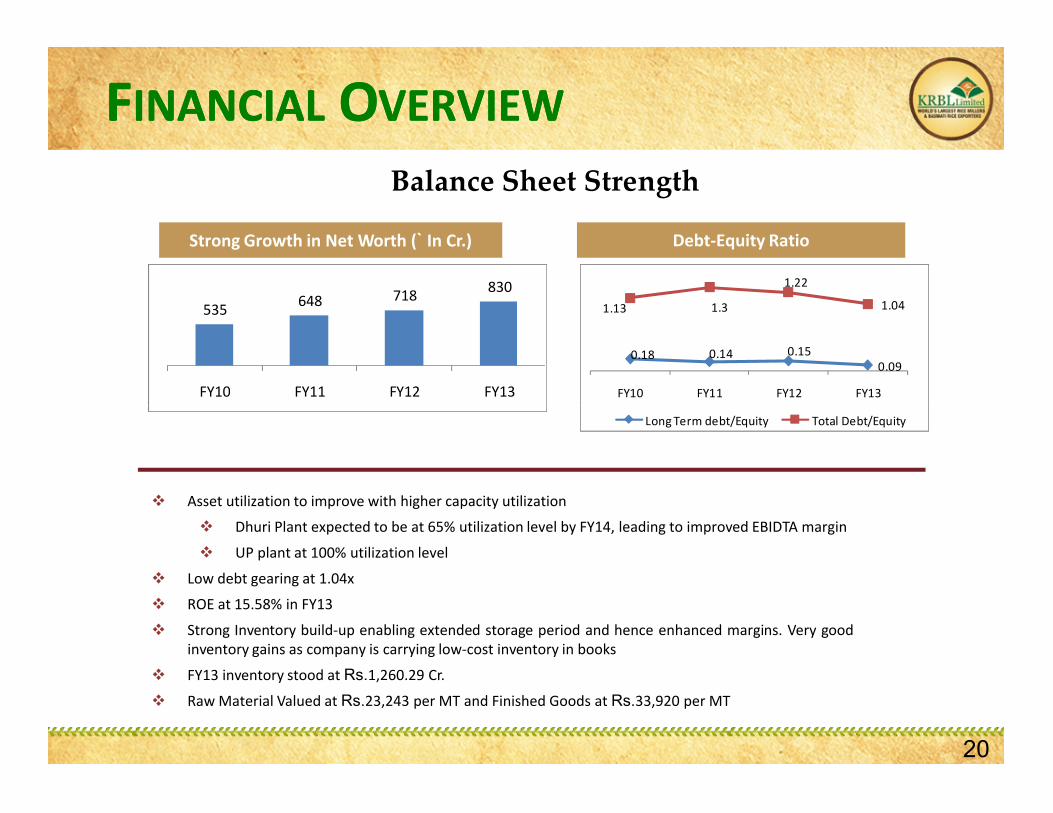
Balance Sheet Strength
Strong Growth in Net Worth (` In Cr.)
535 648 718 830
FY10 FY11 FY12 FY13
Debt-Equity Ratio
0.18 0.14 0.150.09
1.13 1.3
1.22
1.04
FY10 FY11 FY12 FY13
FFINANCIALINANCIAL OOVERVIEWVERVIEW
Asset utilization to improve with higher capacity utilization
Dhuri Plant expected to be at 65% utilization level by FY14, leading to improved EBIDTA margin
UP plant at 100% utilization level
Low debt gearing at 1.04x
ROE at 15.58% in FY13
Strong Inventory build-up enabling extended storage period and hence enhanced margins. Very goodinventory gains as company is carrying low-cost inventory in books
FY13 inventory stood at Rs.1,260.29 Cr.
Raw Material Valued at Rs.23,243 per MT and Finished Goods at Rs.33,920 per MT
Long Term debt/Equity Total Debt/Equity
20
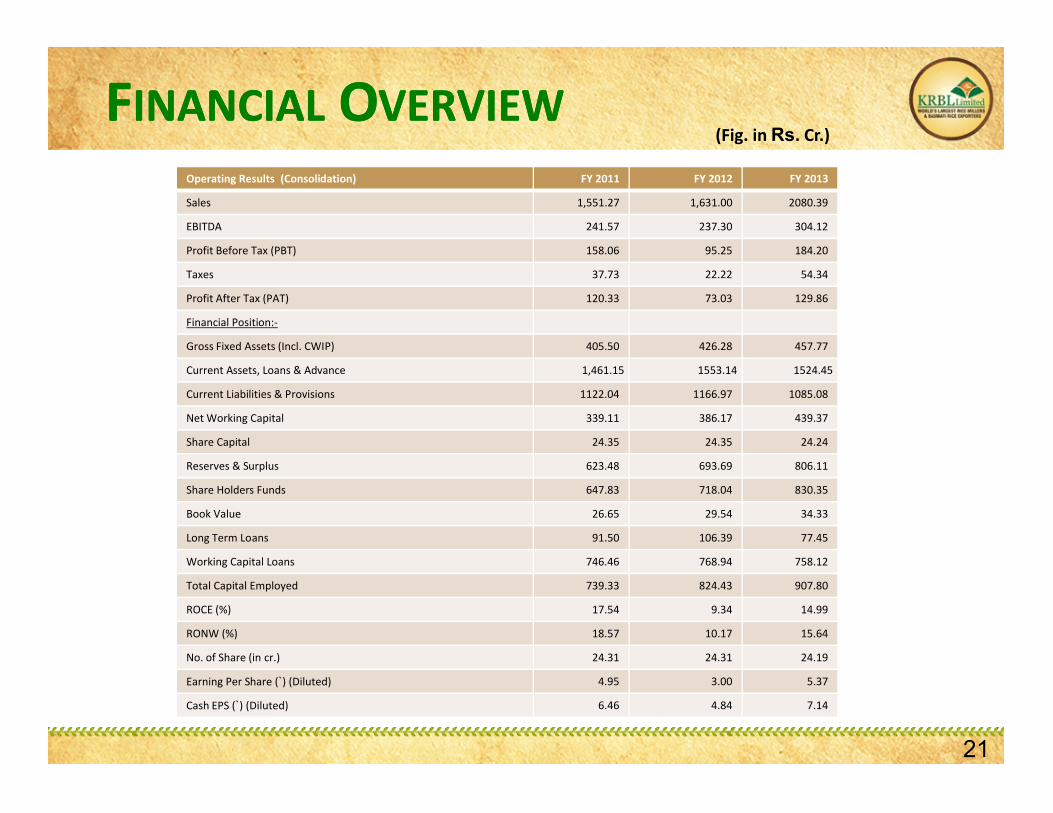
Operating Results (Consolidation) FY 2011 FY 2012 FY 2013
Sales 1,551.27 1,631.00 2080.39
EBITDA 241.57 237.30 304.12
Profit Before Tax (PBT) 158.06 95.25 184.20
Taxes 37.73 22.22 54.34
Profit After Tax (PAT) 120.33 73.03 129.86
Financial Position:-
Gross Fixed Assets (Incl. CWIP) 405.50 426.28 457.77
Current Assets, Loans & Advance 1,461.15 1553.14 1524.45
Current Liabilities & Provisions 1122.04 1166.97 1085.08
(Fig. in Rs. Cr.)FFINANCIALINANCIAL OOVERVIEWVERVIEW
Net Working Capital 339.11 386.17 439.37
Share Capital 24.35 24.35 24.24
Reserves & Surplus 623.48 693.69 806.11
Share Holders Funds 647.83 718.04 830.35
Book Value 26.65 29.54 34.33
Long Term Loans 91.50 106.39 77.45
Working Capital Loans 746.46 768.94 758.12
Total Capital Employed 739.33 824.43 907.80
ROCE (%) 17.54 9.34 14.99
RONW (%) 18.57 10.17 15.64
No. of Share (in cr.) 24.31 24.31 24.19
Earning Per Share (`) (Diluted) 4.95 3.00 5.37
Cash EPS (`) (Diluted) 6.46 4.84 7.14
21
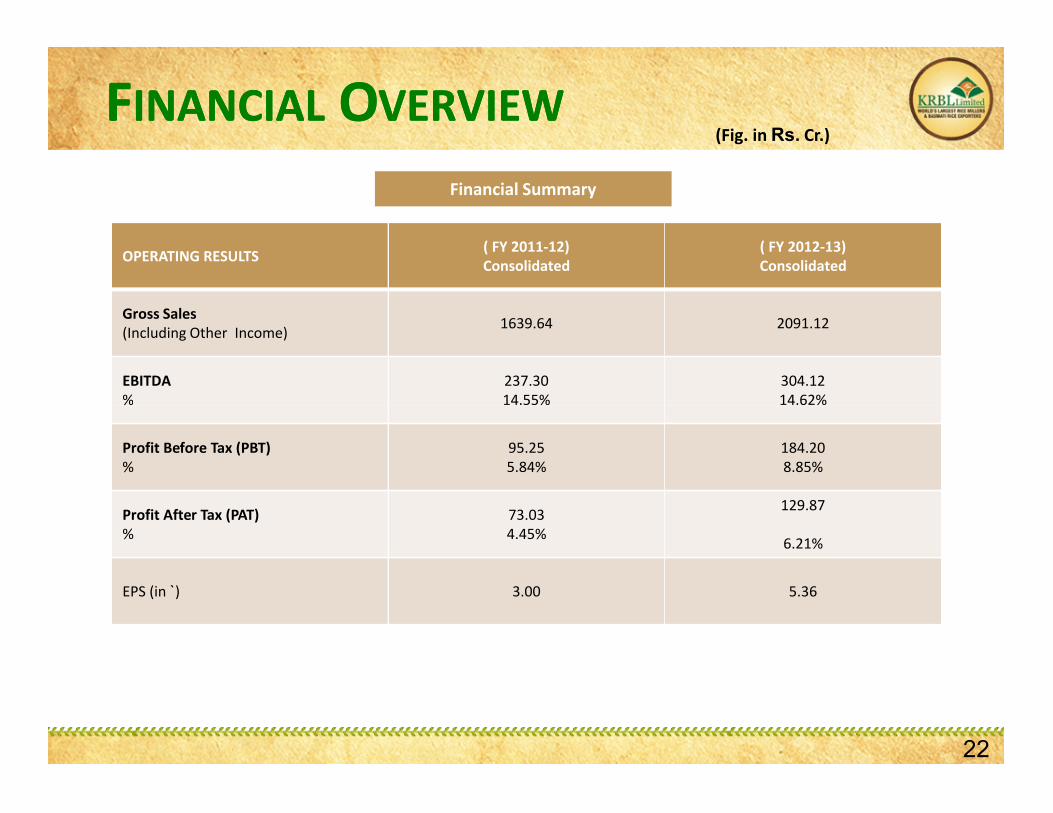
(Fig. in Rs. Cr.)
Financial Summary
FFINANCIALINANCIAL OOVERVIEWVERVIEW
OPERATING RESULTS ( FY 2011-12)Consolidated
( FY 2012-13)Consolidated
Gross Sales (Including Other Income) 1639.64 2091.12
EBITDA%
237.3014.55%
304.1214.62%
22
% 14.55% 14.62%
Profit Before Tax (PBT)%
95.255.84%
184.208.85%
Profit After Tax (PAT)%
73.034.45%
129.87
6.21%
EPS (in `) 3.00 5.36
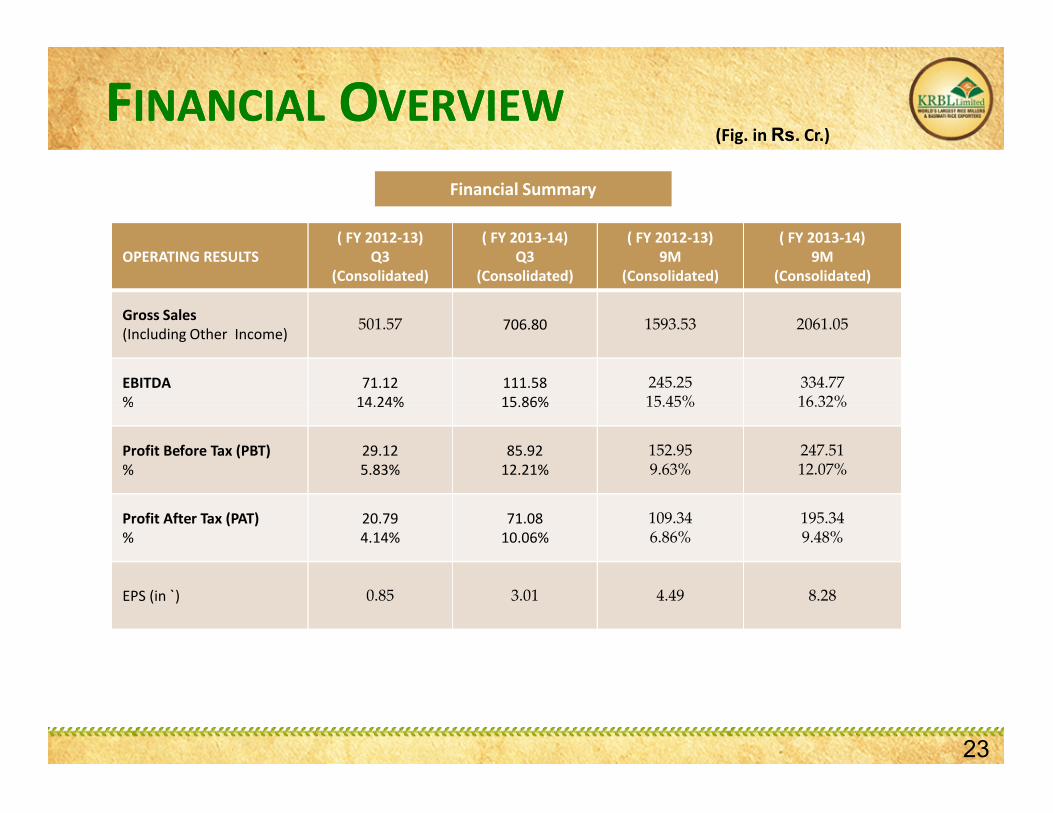
(Fig. in Rs. Cr.)FFINANCIALINANCIAL OOVERVIEWVERVIEW
OPERATING RESULTS( FY 2012-13)
Q3(Consolidated)
( FY 2013-14)Q3
(Consolidated)
( FY 2012-13)9M
(Consolidated)
( FY 2013-14)9M
(Consolidated)
Gross Sales (Including Other Income)
501.57 706.80 1593.53 2061.05
EBITDA%
71.1214.24%
111.5815.86%
245.2515.45%
334.7716.32%
Financial Summary
23
% 14.24% 15.86% 15.45% 16.32%
Profit Before Tax (PBT)%
29.125.83%
85.9212.21%
152.959.63%
247.5112.07%
Profit After Tax (PAT)%
20.794.14%
71.0810.06%
109.346.86%
195.349.48%
EPS (in `) 0.85 3.01 4.49 8.28
Contact Details
KRBL Limited9th Milestone, Post Dujana, Bulandshahar Road
Distt. Gautam Budh NagarUttar Pradesh – 203 207
Contact Person
Rakesh MehrotraChief Financial Officer
Mob. +91 98736 87721. Tel: +91 120 2673471E-mail: [email protected]


![Chapar: Certified Causally Consistent Distributed Key ...people.csail.mit.edu/lesani/companion/popl16/POPL16.pdf · PACELC [3] formulates a trade-off between strong consistency and](https://static.fdocuments.us/doc/165x107/5ebe3b59ab1ed31a9e2d1a7f/chapar-certified-causally-consistent-distributed-key-pacelc-3-formulates.jpg)