India Market Strategy - krblrice.comkrblrice.com/downloads/Credit Suisse Strategy - Rural...
60
ANALYST CERTIFICATIONS ARE IN THE DISCLOSURE APPENDIX. FOR OTHER IMPORTANT DISCLOSURES, visit www.credit-suisse.com/ researchdisclosures or call +1 (877) 291-2683. U.S. Disclosure: Credit Suisse does and seeks to do business with companies covered in its research reports. As a result, investors should be aware that the Firm may have a conflict of interest that could affect the objectivity of this report. Investors should consider this report as only a single factor in making their investment decision. 4 January 2008 Asia Pacific/India Equity Research Investment Strategy India Market Strategy STRATEGY 2008 theme: rural income After the urban consumption theme in 2004-05 and infrastructure in 2006-07, we believe the next big theme is agricultural prices and rural income. Given the unprecedented producer price rises in key crops such as wheat and rice, investors should seek increased exposure to the theme by overweighting staples, consumer discretionary and agro-related stocks. ■ Farm level prices rising. The current situation is an unprecedented one for Indian farmers: global prices and market forces have caused even controlled procurement prices of key crops to rise by a historic 30%-plus YoY. The regulatory structure is such that these prices could rise more even with future supply improvements. The farmers could benefit for years on the potential loss of food self-sufficiency for the country, due to rising demand. The impact on rural income is not visible yet because the sharpest price hikes were implemented only recently. ■ But consumer prices for food are contained. The rural economy normally suffers when food prices rise, as only 30-35% of farmers produce surplus food. But food prices for consumers have remained stable and should remain so, with elections less than 18 months away. This is facilitated through another control structure on food prices and with a historic expansion in the food subsidy bill. While unsustainable longer term with implications for 2009 inflation, the rural economy has sizeable dual benefits from rising procurement and stagnant consumer prices to enjoy in 2008. ■ Equity themes: overweight staples, two-wheelers, public sector banks, farm businesses. Rural income growth accrues to the lowest income categories. In this high-volume segment, companies with leadership in low- priced products and strong distribution should benefit the most. There are benefits also for those providing goods and services related to farm investments such as companies in seeds, crop protection, tractors and irrigation businesses. Companies in relatively high-end/less-regulated farm products such as basmati rice and edible oil are also potential gainers. Figure 1: Major rural plays from Credit Suisses coverage universe Bloomberg Mkt cap Rat- P/E (x) P/B (x) Company code Sector (US$ bn) Price ing TP FY08E FY09E FY08E FY09E BOB BOB IN Banks 4.5 491 O 392 13.2 10.3 1.9 1.6 Bharti BHARTI IN Telecom 45.7 949 U 755 26.9 22.4 8.9 6.4 Hero Honda HH IN Autos 3.6 712 O 792 15.6 13.5 4.8 4.0 HUL HUVR IN Staples 12.5 223 O 254 28.0 23.4 21.1 19.4 IOB IOB IN Banks 2.8 201 O 174 9.5 8.3 2.3 1.8 ITC ITC IN Staples 20.5 215 O 242 26.0 22.2 6.6 5.7 Lupin LPC IN Pharma 1.3 614 O 845 15.0 13.2 4.6 3.5 M&M MM IN Autos 5.2 836 N 772 20.5 18.6 4.8 4.1 PNB PNB IN Banks 5.6 703 O 560 12.9 11.1 1.9 1.7 SBI SBIN IN Banks 32.0 2,396 O 2,358 21.3 18.8 3.5 3.0 Source: Bloomberg, Credit Suisse estimates Research Analysts Nilesh Jasani 91 22 6777 3720 [email protected] Arya Sen 91 22 6777 3807 [email protected] India Research Analyst Team Nilesh Jasani (Head of Research, Strategy) Govindarajan Chellappa (Automobiles) Prashant Gokhale (Chemicals, Oil & Gas) Sanjay Jain (Banks) Neelkanth Mishra (Pharmaceuticals) Sanjay Mookim (Oil & Gas) Bhuvnesh Singh (IT Services, Telecoms) Aditya Singhania (Banks) Vinod Chari (Machinery, Utilities) Anand Agarwal (Infrastructure & Cement, Property) Arya Sen (Research Assistant) Swapnil Nadkar (Research Assistant) R Srinivasan (Research Assistant) R Harishankar (Research Assistant) Anubhav Aggarwal (Research Assistant) Musaed Noorani (Research Assistant) Anand Swaminathan (Research Assistant, Banks) Sunil Tirumalai (Research Assistant, IT Services)
Transcript of India Market Strategy - krblrice.comkrblrice.com/downloads/Credit Suisse Strategy - Rural...
ANALYST CERTIFICATIONS ARE IN THE DISCLOSURE APPENDIX. FOR OTHER IMPORTANT DISCLOSURES, visit www.credit-suisse.com/ researchdisclosures or call +1 (877) 291-2683. U.S. Disclosure: Credit Suisse does and seeks to do business with companies covered in its research reports. As a result, investors should be aware that the Firm may have a conflict of interest that could affect the objectivity of this report. Investors should consider this report as only a single factor in making their investment decision.
4 January 2008Asia Pacific/IndiaEquity Research
Investment Strategy
India Market Strategy STRATEGY
2008 theme: rural income After the urban consumption theme in 2004-05 and infrastructure in 2006-07, we believe the next big theme is agricultural prices and rural income. Given the unprecedented producer price rises in key crops such as wheat and rice, investors should seek increased exposure to the theme by overweighting staples, consumer discretionary and agro-related stocks. ■ Farm level prices rising. The current situation is an unprecedented one for
Indian farmers: global prices and market forces have caused even controlled procurement prices of key crops to rise by a historic 30%-plus YoY. The regulatory structure is such that these prices could rise more even with future supply improvements. The farmers could benefit for years on the potential loss of food self-sufficiency for the country, due to rising demand. The impact on rural income is not visible yet because the sharpest price hikes were implemented only recently.
■ But consumer prices for food are contained. The rural economy normally suffers when food prices rise, as only 30-35% of farmers produce surplus food. But food prices for consumers have remained stable and should remain so, with elections less than 18 months away. This is facilitated through another control structure on food prices and with a historic expansion in the food subsidy bill. While unsustainable longer term with implications for 2009 inflation, the rural economy has sizeable dual benefits from rising procurement and stagnant consumer prices to enjoy in 2008.
■ Equity themes: overweight staples, two-wheelers, public sector banks, farm businesses. Rural income growth accrues to the lowest income categories. In this high-volume segment, companies with leadership in low-priced products and strong distribution should benefit the most. There are benefits also for those providing goods and services related to farm investments such as companies in seeds, crop protection, tractors and irrigation businesses. Companies in relatively high-end/less-regulated farm products such as basmati rice and edible oil are also potential gainers.
Figure 1: Major rural plays from Credit Suisse�s coverage universe Bloomberg Mkt cap Rat- P/E (x) P/B (x) Company code Sector (US$ bn) Price ing TP FY08E FY09E FY08E FY09EBOB BOB IN Banks 4.5 491 O 392 13.2 10.3 1.9 1.6 Bharti BHARTI IN Telecom 45.7 949 U 755 26.9 22.4 8.9 6.4 Hero Honda HH IN Autos 3.6 712 O 792 15.6 13.5 4.8 4.0 HUL HUVR IN Staples 12.5 223 O 254 28.0 23.4 21.1 19.4 IOB IOB IN Banks 2.8 201 O 174 9.5 8.3 2.3 1.8 ITC ITC IN Staples 20.5 215 O 242 26.0 22.2 6.6 5.7 Lupin LPC IN Pharma 1.3 614 O 845 15.0 13.2 4.6 3.5 M&M MM IN Autos 5.2 836 N 772 20.5 18.6 4.8 4.1 PNB PNB IN Banks 5.6 703 O 560 12.9 11.1 1.9 1.7 SBI SBIN IN Banks 32.0 2,396 O 2,358 21.3 18.8 3.5 3.0 Source: Bloomberg, Credit Suisse estimates
Research Analysts Nilesh Jasani
91 22 6777 3720 [email protected]
Arya Sen 91 22 6777 3807
India Research Analyst Team Nilesh Jasani
(Head of Research, Strategy)
Govindarajan Chellappa (Automobiles)
Prashant Gokhale (Chemicals, Oil & Gas)
Sanjay Jain (Banks)
Neelkanth Mishra (Pharmaceuticals)
Sanjay Mookim (Oil & Gas)
Bhuvnesh Singh (IT Services, Telecoms)
Aditya Singhania (Banks)
Vinod Chari (Machinery, Utilities)
Anand Agarwal (Infrastructure & Cement, Property)
Arya Sen (Research Assistant)
Swapnil Nadkar (Research Assistant)
R Srinivasan (Research Assistant)
R Harishankar (Research Assistant)
Anubhav Aggarwal (Research Assistant)
Musaed Noorani (Research Assistant)
Anand Swaminathan (Research Assistant, Banks)
Sunil Tirumalai (Research Assistant, IT Services)
4 January 2008
India Market Strategy 2
Focus charts and table Figure 2: Rice and wheat MSPs* have never seen such a rise before �
Figure 3: � but PDS* prices continue to be at the same level �
-
5
10
15
20
25
30
35
40
1977 1980 1983 1986 1989 1992 1995 1998 2001 2004 2007
Wheat MSP - YOY (%) Rice MSP - YOY (%)
0
400
800
1,200
'98 '99 '00 '01 '02 '03 '04 '05 '06 '07 '08
PDS/BPL - wheat PDS/APL - wheatPDS/BPL - rice PDS/APL - rice
Rs per quintal
* Minimum support price Source: Economic Survey 2006/07, Credit Suisse estimates
* Public distribution system Source: Economic Survey 2006/07, Credit Suisse estimates
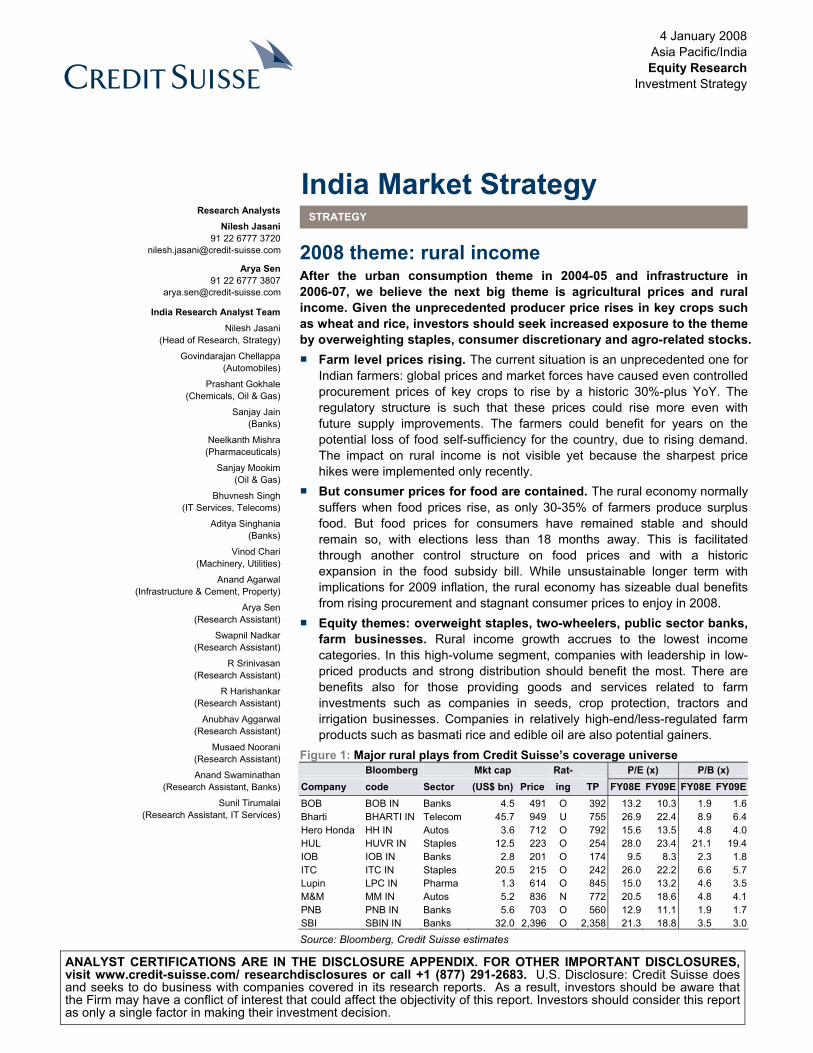
Figure 4: � as the government�s subsidy bill is set to touch historical highs
Figure 5: First decade of less than 1% production growth � potential for real growth ahead?
0.0
0.2
0.4
0.6
0.8
1.0
1.2
'94 '96 '98 '00 '02 '04 '06 08E
Food subsidy as % of GDP Fertilizer subsidy as % of GDP
-1
0
1
2
3
4
5
50-60 60-70 70-80 80-90 90-00 00-07
Acreage expansion (%) Yield growth (%)Foodgrain production growth (%)
Source: Economic Survey, Credit Suisse estimates Source: CMIE, Credit Suisse estimates
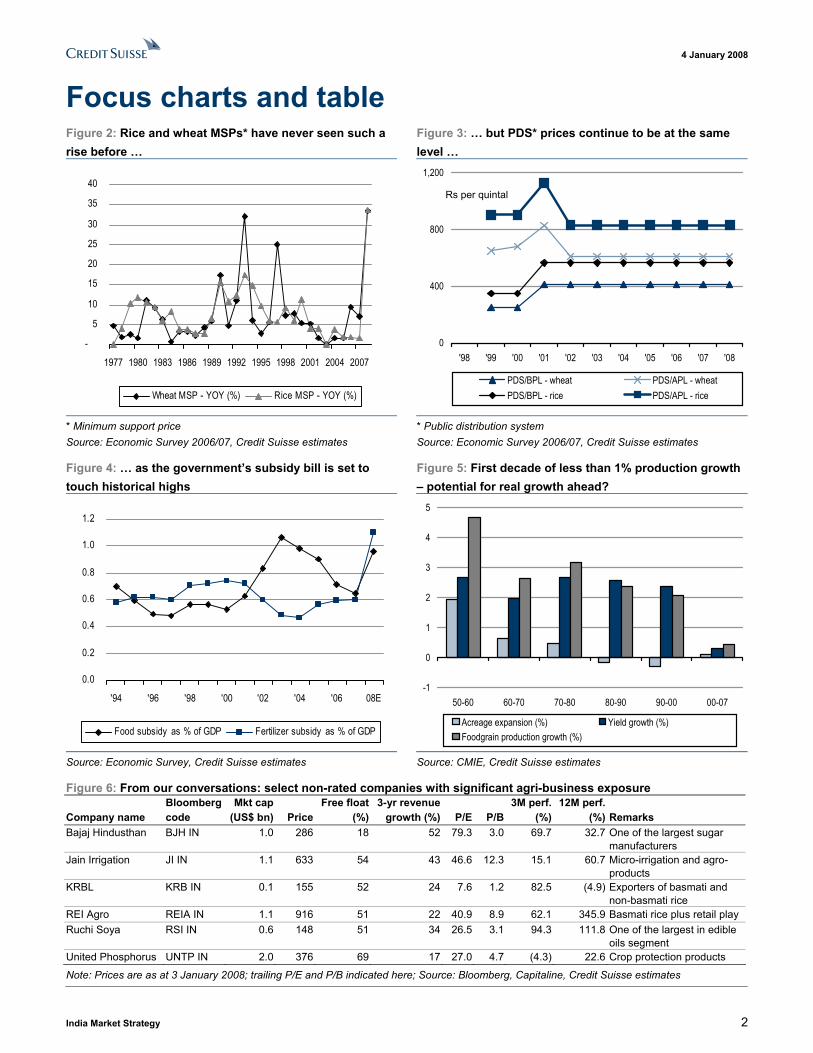
Figure 6: From our conversations: select non-rated companies with significant agri-business exposure Bloomberg Mkt cap Free float 3-yr revenue 3M perf. 12M perf. Company name code (US$ bn) Price (%) growth (%) P/E P/B (%) (%) Remarks Bajaj Hindusthan BJH IN 1.0 286 18 52 79.3 3.0 69.7 32.7 One of the largest sugar
manufacturers Jain Irrigation JI IN 1.1 633 54 43 46.6 12.3 15.1 60.7 Micro-irrigation and agro-
products KRBL KRB IN 0.1 155 52 24 7.6 1.2 82.5 (4.9) Exporters of basmati and
non-basmati rice REI Agro REIA IN 1.1 916 51 22 40.9 8.9 62.1 345.9 Basmati rice plus retail play Ruchi Soya RSI IN 0.6 148 51 34 26.5 3.1 94.3 111.8 One of the largest in edible
oils segment United Phosphorus UNTP IN 2.0 376 69 17 27.0 4.7 (4.3) 22.6 Crop protection products
Note: Prices are as at 3 January 2008; trailing P/E and P/B indicated here; Source: Bloomberg, Capitaline, Credit Suisse estimates
4 January 2008
India Market Strategy 3
2008 theme: rural income Farm-level prices up � The current situation is an unprecedented one for Indian farmers. With global prices soaring, due partly to cyclical and partly to secular factors, free market forces are causing the procurement prices of key crops to rise by a hitherto unforeseen level of 30%-plus YoY in India as well. Even if the global cycle reverses next year, Indian farm-gate prices should remain at an elevated level because of the controlled nature of the prices paid to the farmer, which have almost never been marked down. The fact that India is so close to a general election implies that there is potential for a further rise.
Our demand-supply analysis shows that farmers should continue to benefit in the years to come because the widening demand-supply gap cannot be closed quickly and because of larger private sector participation. Despite heavy imports, food grain stock with the government is now below the minimum buffer, leading to a loss of food self-sufficiency for non-weather-related reasons for the first time in over four decades. For the economy, all of this could also help to spur real growth in the stagnant agricultural sector. In the near term, there are significant benefits for rural India. If the impact on rural incomes has not been visible so far, it is mostly because the sharpest price spikes were implemented only recently.
� and consumer prices controlled In aggregate, the rural economy does not always benefit from rising food prices, as only 30-35% of rural India produces surplus food. Rising food prices at the consumer level could also have had rather negative implications for inflation and economic policies. But in the run-up to the election, we show how food prices at the consumer level have been stable and are likely to remain so. This is made possible by another arm of government control on the food sector � price-setting in the public distribution system (PDS). While unsustainable over the longer term, with negative implications for government deficits and 2009 inflation, the near-term outlook is that the rural economy has sizeable dual benefits to enjoy from rising procurement and stagnant consumer prices in 2008.
Rural income ideas for equity investors Equity investors cannot really benefit directly from wheat or rice MSP (minimum support price) rise. But there are many investment themes from developments such as:
■ Rural income growth and an increase in rural consumption � beneficiaries are companies such as Hero Honda, Hindustan Unilever, ITC, SBI, PNB and mobile operators. We recommend an overweight stance on all of these except telecom
■ Crop switching and a potential inflexion point for sugar prices in a few quarters.
■ An increase in margins for companies dealing in food segments with fewer controls, such as basmati rice and edible oils.
■ An increase in farm sector investment and the impact on businesses in seeds, pesticides, tractors and contract farming.
■ Over the long term, if farm incomes rise rapidly, there could be deregulation of fertilizer companies� profitability, a reduction in subsidies on power and rural lending, further reforms for private-sector participation in procurement, contract farming, seeding and directly, even in organised farming. The beneficiaries could be fertilizer and state power companies, amongst others, but we do not think the stock market will have reason to factor in the speculative gains from any of these potential reforms in 2008.
Apart from short comments on top picks from our coverage list, based on these, we also provide introductory notes on six other not rated companies that are linked to the sector.
Farmers, historically, were subsidised most of the time, but market forces have caused procurement prices of wheat and rice to rise by over 30% this year
Fast-rising demand, stagnant supply and low buffer stocks mean a potential secular shift in the agriculture sector�s growth in the medium term and good income growth in rural India in the near term
Historical expansion in the food deficit as consumer prices are kept in check, giving rise to dual benefits for rural India
Five ways for equity market investors to consider the impact from rising MSPs
HUL, ITC, Hero Honda and SBI are among the likely major beneficiaries
Rising farm income could lead to many long-term reforms, but not likely a theme for 2008
4 January 2008
India Market Strategy 4
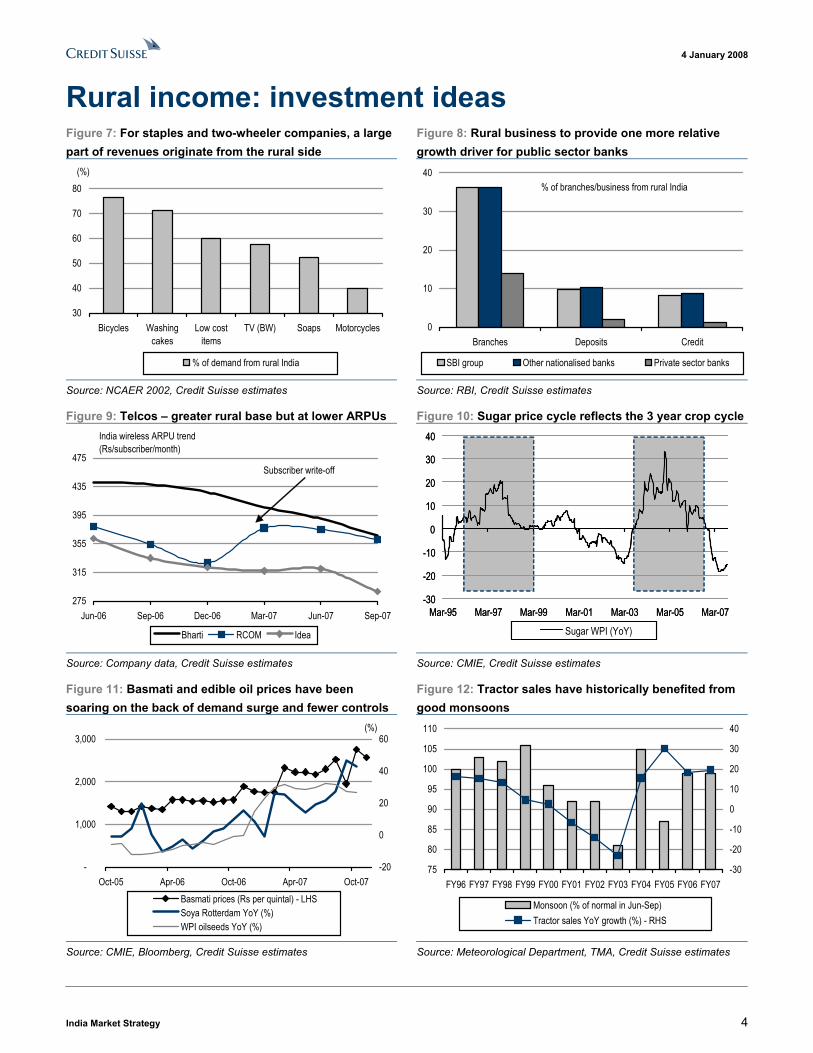
Rural income: investment ideas Figure 7: For staples and two-wheeler companies, a large part of revenues originate from the rural side
Figure 8: Rural business to provide one more relative growth driver for public sector banks
30
40
50
60
70
80
Bicycles Washingcakes
Low costitems
TV (BW) Soaps Motorcycles
% of demand from rural India
(%)
0
10
20
30
40
Branches Deposits Credit
SBI group Other nationalised banks Private sector banks
% of branches/business from rural India
Source: NCAER 2002, Credit Suisse estimates Source: RBI, Credit Suisse estimates
Figure 9: Telcos � greater rural base but at lower ARPUs Figure 10: Sugar price cycle reflects the 3 year crop cycle
275
315
355
395
435
475
Jun-06 Sep-06 Dec-06 Mar-07 Jun-07 Sep-07
Bharti RCOM Idea
Subscriber write-off
India wireless ARPU trend (Rs/subscriber/month)
-30
-20
-10
0
10
20
30
40
Mar-95 Mar-97 Mar-99 Mar-01 Mar-03 Mar-05 Mar-07
Sugar WPI (YoY)
-30
-20
-10
0
10
20
30
40
Mar-95 Mar-97 Mar-99 Mar-01 Mar-03 Mar-05 Mar-07
Sugar WPI (YoY)
Source: Company data, Credit Suisse estimates Source: CMIE, Credit Suisse estimates
Figure 11: Basmati and edible oil prices have been soaring on the back of demand surge and fewer controls
Figure 12: Tractor sales have historically benefited from good monsoons
-
1,000
2,000
3,000
Oct-05 Apr-06 Oct-06 Apr-07 Oct-07-20
0
20
40
60
Basmati prices (Rs per quintal) - LHSSoya Rotterdam YoY (%)WPI oilseeds YoY (%)
(%)
75
80
85
90
95
100
105
110
FY96 FY97 FY98 FY99 FY00 FY01 FY02 FY03 FY04 FY05 FY06 FY07-30
-20
-10
0
10
20
30
40
Monsoon (% of normal in Jun-Sep)Tractor sales YoY growth (%) - RHS
Source: CMIE, Bloomberg, Credit Suisse estimates Source: Meteorological Department, TMA, Credit Suisse estimates
4 January 2008
India Market Strategy 5
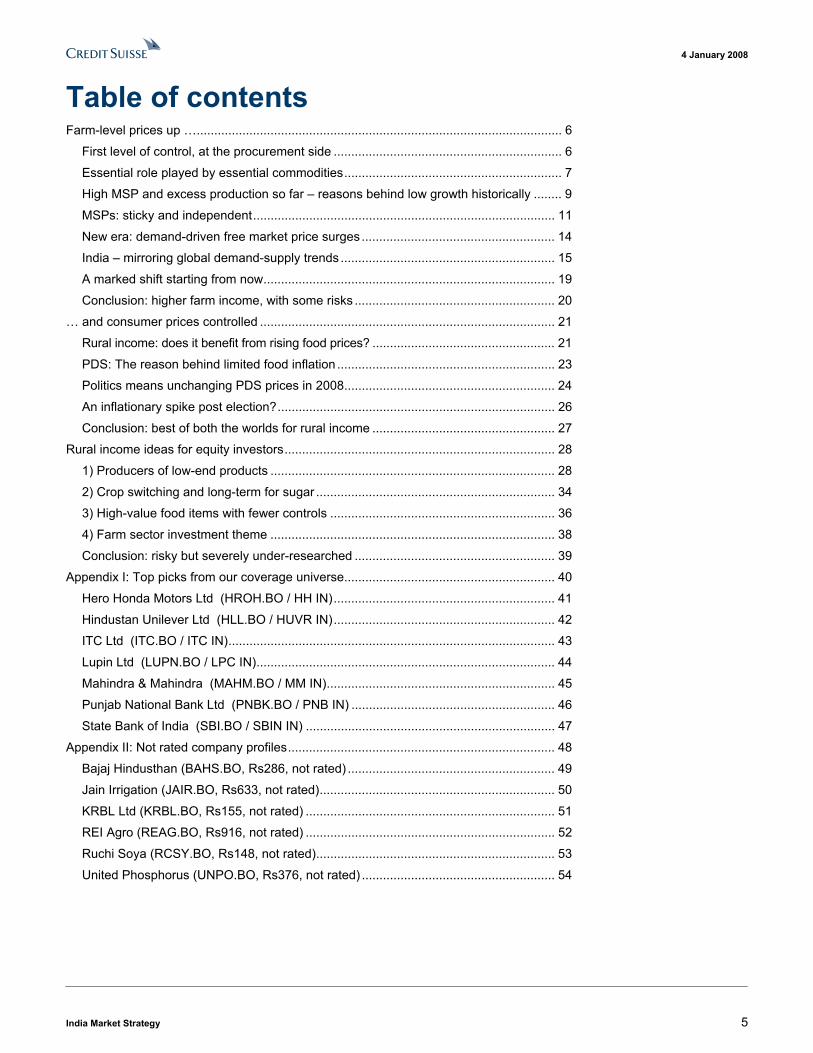
Table of contents Farm-level prices up �........................................................................................................ 6
First level of control, at the procurement side ................................................................. 6 Essential role played by essential commodities.............................................................. 7 High MSP and excess production so far � reasons behind low growth historically ........ 9 MSPs: sticky and independent...................................................................................... 11 New era: demand-driven free market price surges ....................................................... 14 India � mirroring global demand-supply trends ............................................................. 15 A marked shift starting from now................................................................................... 19 Conclusion: higher farm income, with some risks ......................................................... 20
� and consumer prices controlled .................................................................................... 21 Rural income: does it benefit from rising food prices? .................................................... 21 PDS: The reason behind limited food inflation .............................................................. 23 Politics means unchanging PDS prices in 2008............................................................ 24 An inflationary spike post election?............................................................................... 26 Conclusion: best of both the worlds for rural income .................................................... 27
Rural income ideas for equity investors............................................................................. 28 1) Producers of low-end products ................................................................................. 28 2) Crop switching and long-term for sugar .................................................................... 34 3) High-value food items with fewer controls ................................................................ 36 4) Farm sector investment theme ................................................................................. 38 Conclusion: risky but severely under-researched ......................................................... 39
Appendix I: Top picks from our coverage universe............................................................ 40 Hero Honda Motors Ltd (HROH.BO / HH IN)............................................................... 41 Hindustan Unilever Ltd (HLL.BO / HUVR IN)............................................................... 42 ITC Ltd (ITC.BO / ITC IN)............................................................................................. 43 Lupin Ltd (LUPN.BO / LPC IN)..................................................................................... 44 Mahindra & Mahindra (MAHM.BO / MM IN)................................................................. 45 Punjab National Bank Ltd (PNBK.BO / PNB IN) .......................................................... 46 State Bank of India (SBI.BO / SBIN IN) ....................................................................... 47
Appendix II: Not rated company profiles............................................................................ 48 Bajaj Hindusthan (BAHS.BO, Rs286, not rated) ........................................................... 49 Jain Irrigation (JAIR.BO, Rs633, not rated)................................................................... 50 KRBL Ltd (KRBL.BO, Rs155, not rated) ....................................................................... 51 REI Agro (REAG.BO, Rs916, not rated) ....................................................................... 52 Ruchi Soya (RCSY.BO, Rs148, not rated).................................................................... 53 United Phosphorus (UNPO.BO, Rs376, not rated) ....................................................... 54
4 January 2008
India Market Strategy 6
Farm-level prices up � The current situation is an unprecedented one for Indian farmers. With global prices soaring, due partly to cyclical and partly to secular factors, free market forces are causing the procurement prices of key crops to rise by a hitherto unforeseen level of 30%-plus YoY in India as well. Even if the global cycle reverses next year, Indian farm-gate prices are likely to remain at an elevated level because of the controlled nature of the prices paid to the farmer which have almost never been marked down. The fact that India is so close to a general election implies that there is potential for a further rise.
Our demand-supply analysis shows that farmers should continue to benefit in the years to come because of a widening demand-supply gap that cannot be closed quickly, as well as due to larger private sector participation. Despite heavy imports, foodgrain stock with the government is now below the mandatory minimum buffer level, leading to a loss of food self-sufficiency for non-weather-related reasons for the first time in over four decades. For the economy, all this could also help spur real growth in the stagnant agricultural sector. In the near term, there are significant benefits for rural India. If the impact on rural income has not been visible so far, it is mostly because the sharpest price spikes were implemented only recently.
First level of control, at the procurement side Before we talk about trends and new pressures on India�s agricultural product prices, it is important to understand the key features of the food procurement system in place. In our efforts to simplify the description of an extremely complicated system, we cut out on many details and resort to frequent generalisations. We have made our best effort to ensure that the description furthers the understanding of investors without leading to errors that could impact investment decisions.
■ Indian farmers can produce two types of products as defined by the government � essential and non-essential.
■ Until recently, essential commodities needed to be sold only at the government-operated and controlled markets called mandis. Recent reforms have now allowed the private sector to occasionally get involved in contract farming as well as operate their own mandis in certain products and regions.
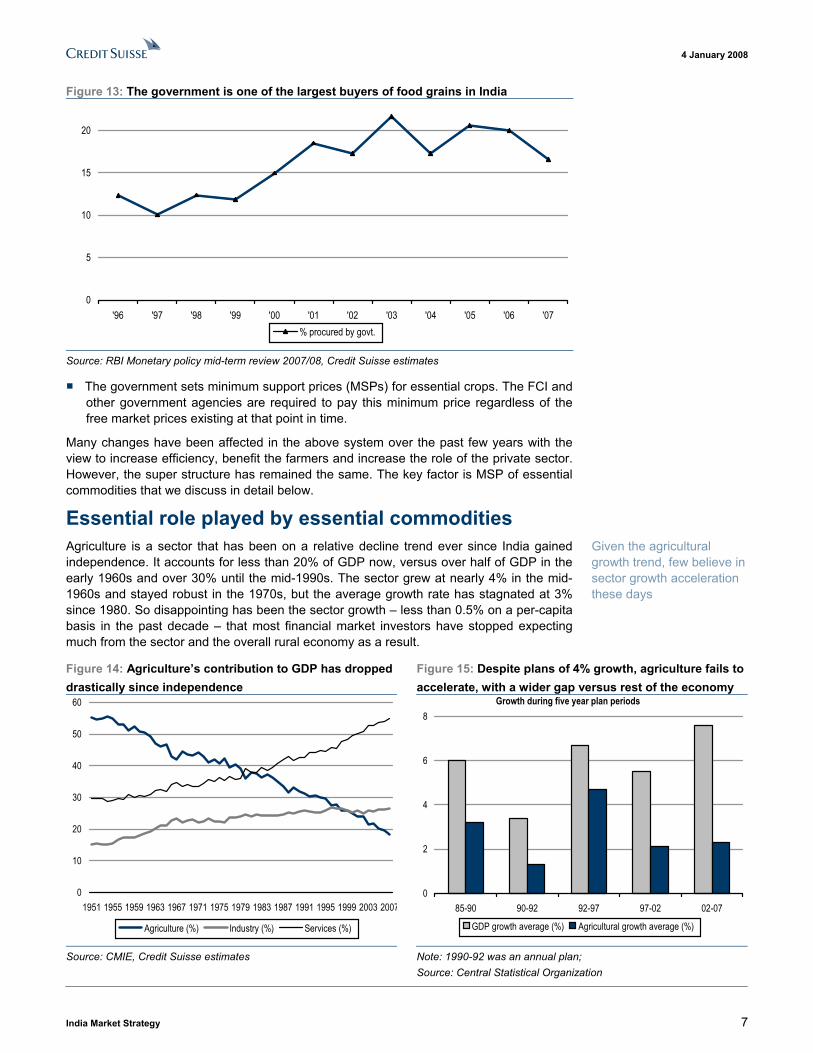
■ Although in theory the produce can be sold to any approved trader or private sector buyer, in practice the biggest farm product buyers are government-run agencies. The Food Corporation of India (FCI) is the largest, procuring 15-20% of total key crops in the country. While the number appears small, it is important to note that farmers retain around 40% of the wheat and rice produce for themselves for seed, animal feed and their own consumption. Adjusted for this, government agencies procure nearly a third of surplus crops brought to and sold at these markets.
Farmers were subsidised historically most of the time � market forces have caused procurement prices of wheat and rice to rise over 30% this year
Fast-rising demand, stagnant supply and low buffer stocks mean potential secular shift in agriculture sector growth in the mediumterm and good income growth in rural India in the near term
A complicated procurement system that needs understanding
Essential and non-essential commodities � both sold by farmers at mandis
Government-controlled agencies, led by the FCI, are major buyers
4 January 2008
India Market Strategy 7
Figure 13: The government is one of the largest buyers of food grains in India
0
5
10
15
20
'96 '97 '98 '99 '00 '01 '02 '03 '04 '05 '06 '07% procured by govt.
Source: RBI Monetary policy mid-term review 2007/08, Credit Suisse estimates
■ The government sets minimum support prices (MSPs) for essential crops. The FCI and other government agencies are required to pay this minimum price regardless of the free market prices existing at that point in time.
Many changes have been affected in the above system over the past few years with the view to increase efficiency, benefit the farmers and increase the role of the private sector. However, the super structure has remained the same. The key factor is MSP of essential commodities that we discuss in detail below.
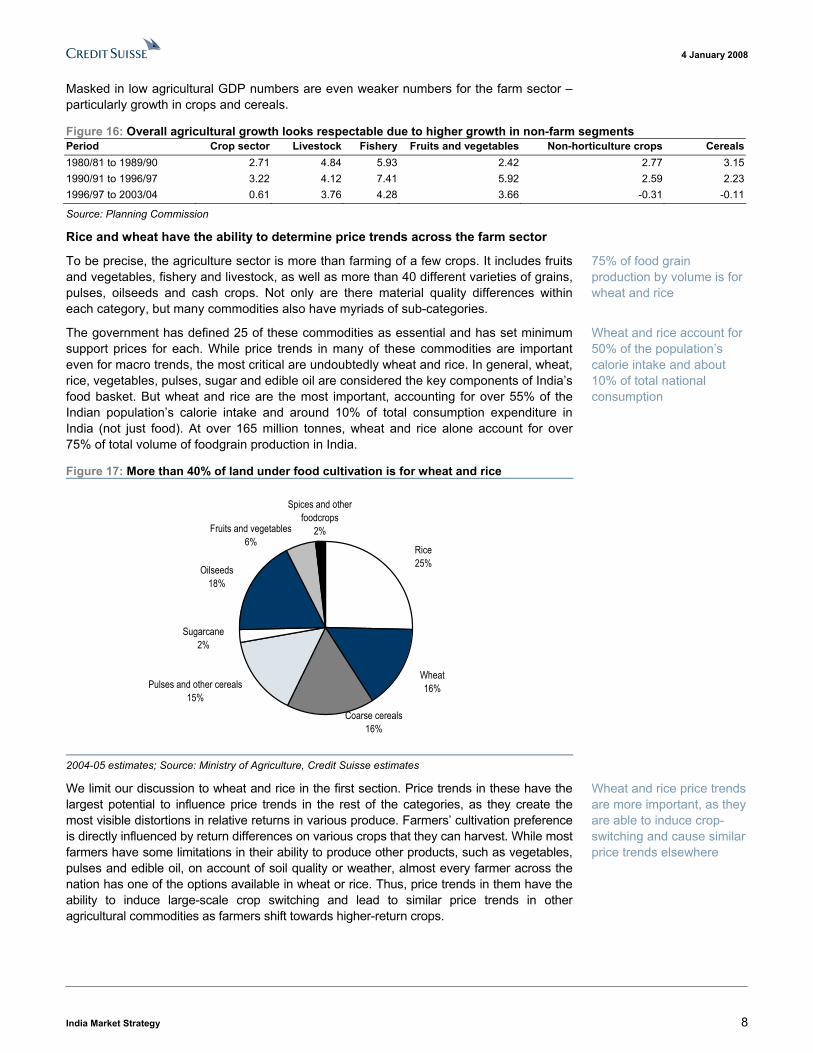
Essential role played by essential commodities Agriculture is a sector that has been on a relative decline trend ever since India gained independence. It accounts for less than 20% of GDP now, versus over half of GDP in the early 1960s and over 30% until the mid-1990s. The sector grew at nearly 4% in the mid-1960s and stayed robust in the 1970s, but the average growth rate has stagnated at 3% since 1980. So disappointing has been the sector growth � less than 0.5% on a per-capita basis in the past decade � that most financial market investors have stopped expecting much from the sector and the overall rural economy as a result.
Figure 14: Agriculture�s contribution to GDP has dropped drastically since independence
Figure 15: Despite plans of 4% growth, agriculture fails to accelerate, with a wider gap versus rest of the economy
0
10
20
30
40
50
60
1951 1955 1959 1963 1967 1971 1975 1979 1983 1987 1991 1995 1999 2003 2007
Agriculture (%) Industry (%) Services (%)
0
2
4
6
8
85-90 90-92 92-97 97-02 02-07
GDP growth average (%) Agricultural growth average (%)
Growth during five year plan periods
Source: CMIE, Credit Suisse estimates Note: 1990-92 was an annual plan; Source: Central Statistical Organization
Given the agricultural growth trend, few believe in sector growth acceleration these days
4 January 2008
India Market Strategy 8
Masked in low agricultural GDP numbers are even weaker numbers for the farm sector � particularly growth in crops and cereals.
Figure 16: Overall agricultural growth looks respectable due to higher growth in non-farm segments Period Crop sector Livestock Fishery Fruits and vegetables Non-horticulture crops Cereals1980/81 to 1989/90 2.71 4.84 5.93 2.42 2.77 3.151990/91 to 1996/97 3.22 4.12 7.41 5.92 2.59 2.231996/97 to 2003/04 0.61 3.76 4.28 3.66 -0.31 -0.11
Source: Planning Commission
Rice and wheat have the ability to determine price trends across the farm sector
To be precise, the agriculture sector is more than farming of a few crops. It includes fruits and vegetables, fishery and livestock, as well as more than 40 different varieties of grains, pulses, oilseeds and cash crops. Not only are there material quality differences within each category, but many commodities also have myriads of sub-categories.
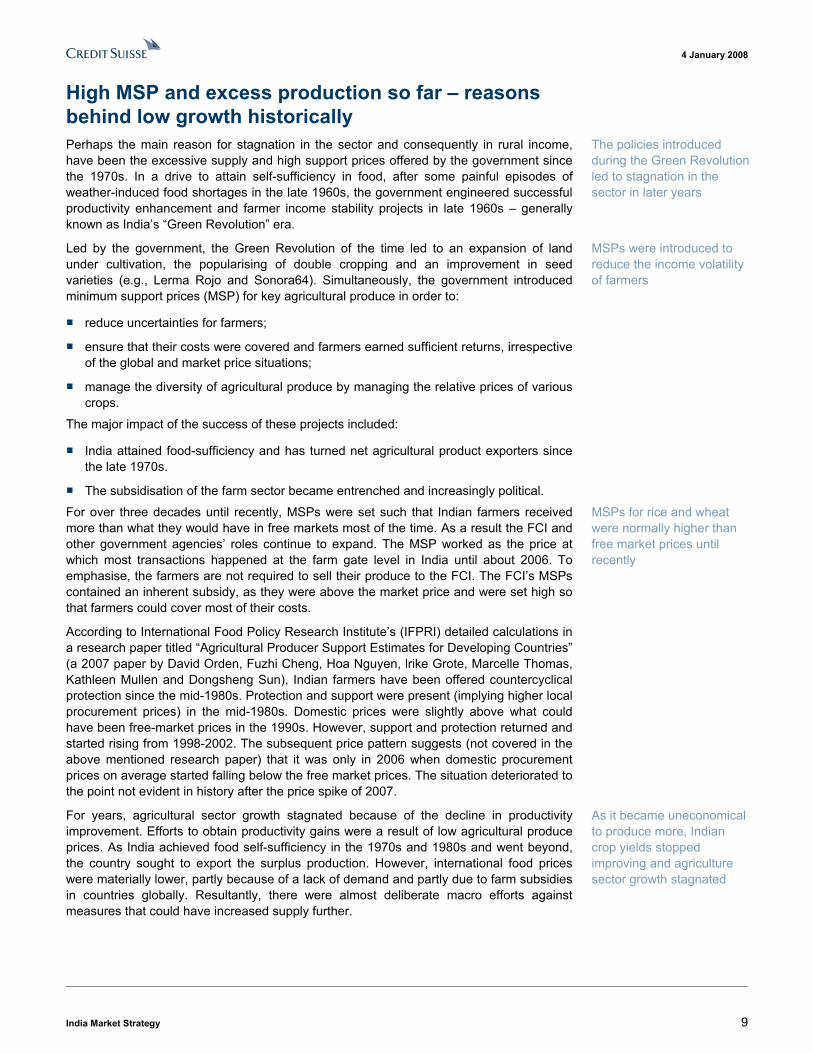
The government has defined 25 of these commodities as essential and has set minimum support prices for each. While price trends in many of these commodities are important even for macro trends, the most critical are undoubtedly wheat and rice. In general, wheat, rice, vegetables, pulses, sugar and edible oil are considered the key components of India�s food basket. But wheat and rice are the most important, accounting for over 55% of the Indian population�s calorie intake and around 10% of total consumption expenditure in India (not just food). At over 165 million tonnes, wheat and rice alone account for over 75% of total volume of foodgrain production in India.
Figure 17: More than 40% of land under food cultivation is for wheat and rice
Coarse cereals16%
Rice25%
Wheat16%
Spices and other foodcrops
2%Fruits and vegetables6%
Oilseeds18%
Sugarcane2%
Pulses and other cereals15%
2004-05 estimates; Source: Ministry of Agriculture, Credit Suisse estimates
We limit our discussion to wheat and rice in the first section. Price trends in these have the largest potential to influence price trends in the rest of the categories, as they create the most visible distortions in relative returns in various produce. Farmers� cultivation preference is directly influenced by return differences on various crops that they can harvest. While most farmers have some limitations in their ability to produce other products, such as vegetables, pulses and edible oil, on account of soil quality or weather, almost every farmer across the nation has one of the options available in wheat or rice. Thus, price trends in them have the ability to induce large-scale crop switching and lead to similar price trends in other agricultural commodities as farmers shift towards higher-return crops.
75% of food grain production by volume is for wheat and rice
Wheat and rice account for 50% of the population�s calorie intake and about 10% of total national consumption
Wheat and rice price trends are more important, as they are able to induce crop-switching and cause similar price trends elsewhere
4 January 2008
India Market Strategy 9
High MSP and excess production so far � reasons behind low growth historically Perhaps the main reason for stagnation in the sector and consequently in rural income, have been the excessive supply and high support prices offered by the government since the 1970s. In a drive to attain self-sufficiency in food, after some painful episodes of weather-induced food shortages in the late 1960s, the government engineered successful productivity enhancement and farmer income stability projects in late 1960s � generally known as India�s �Green Revolution� era.
Led by the government, the Green Revolution of the time led to an expansion of land under cultivation, the popularising of double cropping and an improvement in seed varieties (e.g., Lerma Rojo and Sonora64). Simultaneously, the government introduced minimum support prices (MSP) for key agricultural produce in order to:
■ reduce uncertainties for farmers;
■ ensure that their costs were covered and farmers earned sufficient returns, irrespective of the global and market price situations;
■ manage the diversity of agricultural produce by managing the relative prices of various crops.
The major impact of the success of these projects included:
■ India attained food-sufficiency and has turned net agricultural product exporters since the late 1970s.
■ The subsidisation of the farm sector became entrenched and increasingly political.
For over three decades until recently, MSPs were set such that Indian farmers received more than what they would have in free markets most of the time. As a result the FCI and other government agencies� roles continue to expand. The MSP worked as the price at which most transactions happened at the farm gate level in India until about 2006. To emphasise, the farmers are not required to sell their produce to the FCI. The FCI�s MSPs contained an inherent subsidy, as they were above the market price and were set high so that farmers could cover most of their costs.
According to International Food Policy Research Institute�s (IFPRI) detailed calculations in a research paper titled �Agricultural Producer Support Estimates for Developing Countries� (a 2007 paper by David Orden, Fuzhi Cheng, Hoa Nguyen, lrike Grote, Marcelle Thomas, Kathleen Mullen and Dongsheng Sun), Indian farmers have been offered countercyclical protection since the mid-1980s. Protection and support were present (implying higher local procurement prices) in the mid-1980s. Domestic prices were slightly above what could have been free-market prices in the 1990s. However, support and protection returned and started rising from 1998-2002. The subsequent price pattern suggests (not covered in the above mentioned research paper) that it was only in 2006 when domestic procurement prices on average started falling below the free market prices. The situation deteriorated to the point not evident in history after the price spike of 2007.
For years, agricultural sector growth stagnated because of the decline in productivity improvement. Efforts to obtain productivity gains were a result of low agricultural produce prices. As India achieved food self-sufficiency in the 1970s and 1980s and went beyond, the country sought to export the surplus production. However, international food prices were materially lower, partly because of a lack of demand and partly due to farm subsidies in countries globally. Resultantly, there were almost deliberate macro efforts against measures that could have increased supply further.
The policies introduced during the Green Revolution led to stagnation in the sector in later years
MSPs were introduced to reduce the income volatility of farmers
MSPs for rice and wheat were normally higher than free market prices until recently
As it became uneconomical to produce more, Indian crop yields stopped improving and agriculture sector growth stagnated
4 January 2008
India Market Strategy 10
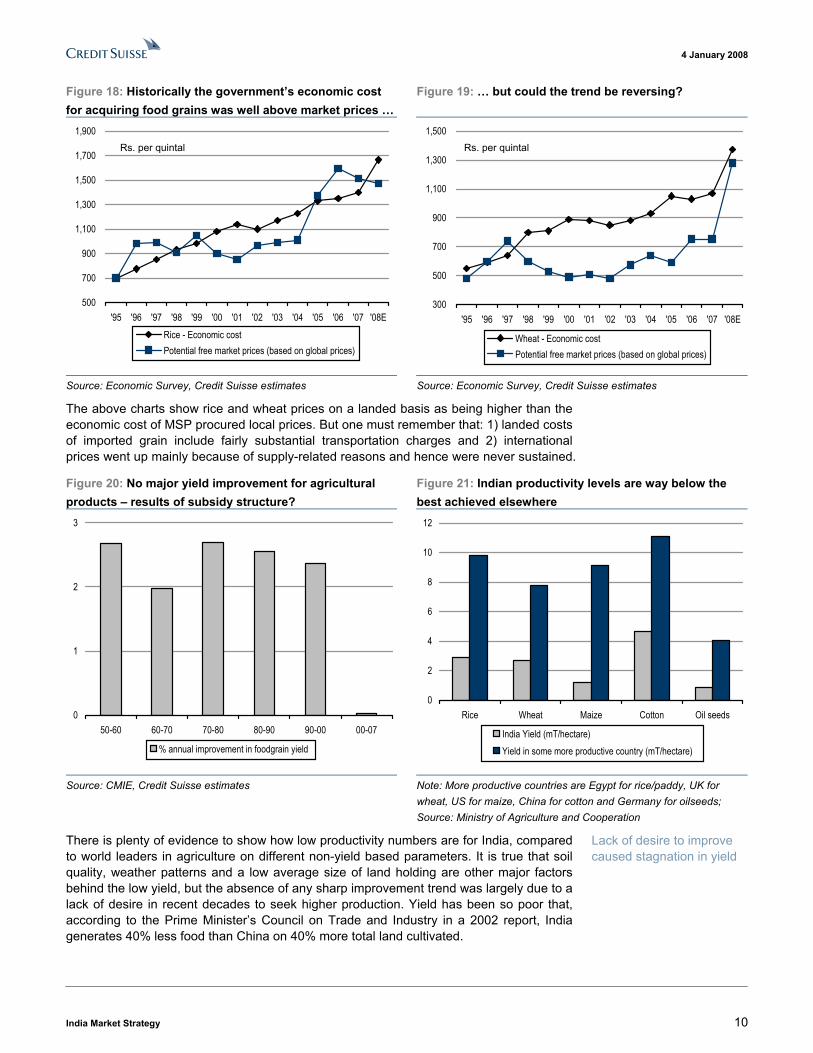
Figure 18: Historically the government�s economic cost for acquiring food grains was well above market prices �
Figure 19: � but could the trend be reversing?
500
700
900
1,100
1,300
1,500
1,700
1,900
'95 '96 '97 '98 '99 '00 '01 '02 '03 '04 '05 '06 '07 '08ERice - Economic costPotential free market prices (based on global prices)
Rs. per quintal
300
500
700
900
1,100
1,300
1,500
'95 '96 '97 '98 '99 '00 '01 '02 '03 '04 '05 '06 '07 '08E
Wheat - Economic costPotential free market prices (based on global prices)
Rs. per quintal
Source: Economic Survey, Credit Suisse estimates Source: Economic Survey, Credit Suisse estimates
The above charts show rice and wheat prices on a landed basis as being higher than the economic cost of MSP procured local prices. But one must remember that: 1) landed costs of imported grain include fairly substantial transportation charges and 2) international prices went up mainly because of supply-related reasons and hence were never sustained.
Figure 20: No major yield improvement for agricultural products � results of subsidy structure?
Figure 21: Indian productivity levels are way below the best achieved elsewhere
0
1
2
3
50-60 60-70 70-80 80-90 90-00 00-07
% annual improvement in foodgrain yield
0
2
4
6
8
10
12
Rice Wheat Maize Cotton Oil seeds
India Yield (mT/hectare)Yield in some more productive country (mT/hectare)
Source: CMIE, Credit Suisse estimates Note: More productive countries are Egypt for rice/paddy, UK for wheat, US for maize, China for cotton and Germany for oilseeds; Source: Ministry of Agriculture and Cooperation
There is plenty of evidence to show how low productivity numbers are for India, compared to world leaders in agriculture on different non-yield based parameters. It is true that soil quality, weather patterns and a low average size of land holding are other major factors behind the low yield, but the absence of any sharp improvement trend was largely due to a lack of desire in recent decades to seek higher production. Yield has been so poor that, according to the Prime Minister�s Council on Trade and Industry in a 2002 report, India generates 40% less food than China on 40% more total land cultivated.
Lack of desire to improve caused stagnation in yield
4 January 2008
India Market Strategy 11
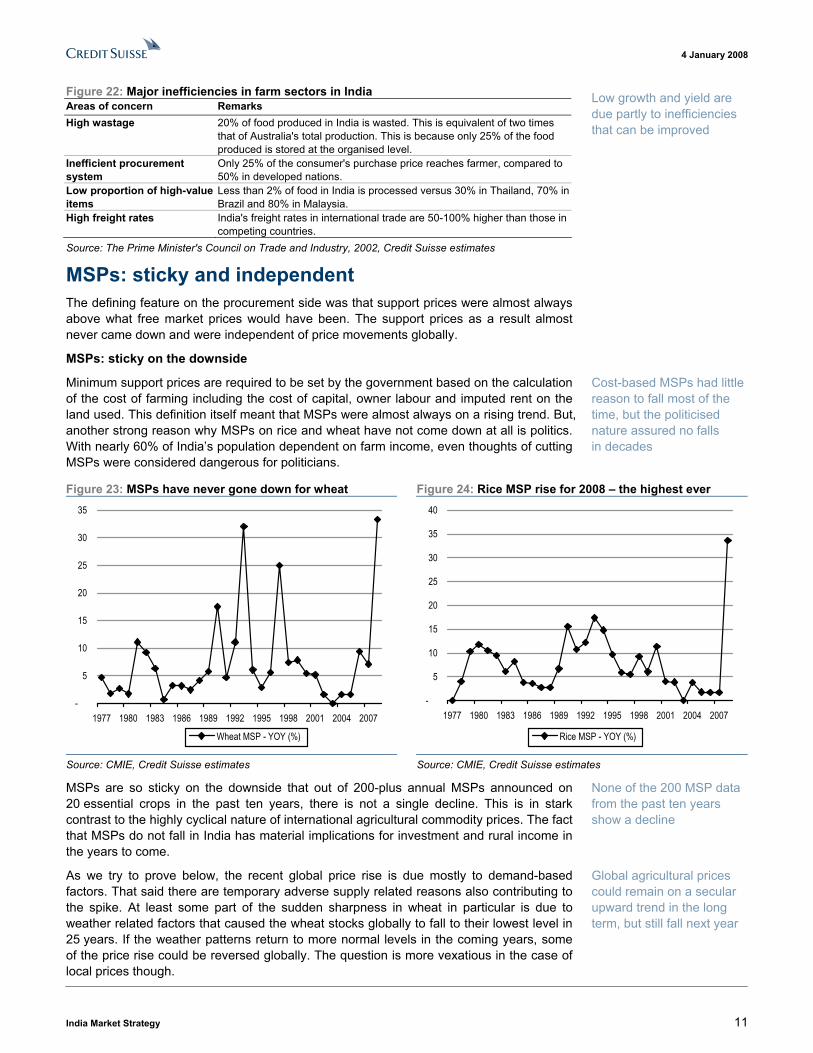
Figure 22: Major inefficiencies in farm sectors in India Areas of concern Remarks High wastage 20% of food produced in India is wasted. This is equivalent of two times
that of Australia's total production. This is because only 25% of the food produced is stored at the organised level.
Inefficient procurement system
Only 25% of the consumer's purchase price reaches farmer, compared to 50% in developed nations.
Low proportion of high-value items
Less than 2% of food in India is processed versus 30% in Thailand, 70% in Brazil and 80% in Malaysia.
High freight rates India's freight rates in international trade are 50-100% higher than those in competing countries.
Source: The Prime Minister's Council on Trade and Industry, 2002, Credit Suisse estimates
MSPs: sticky and independent The defining feature on the procurement side was that support prices were almost always above what free market prices would have been. The support prices as a result almost never came down and were independent of price movements globally.
MSPs: sticky on the downside
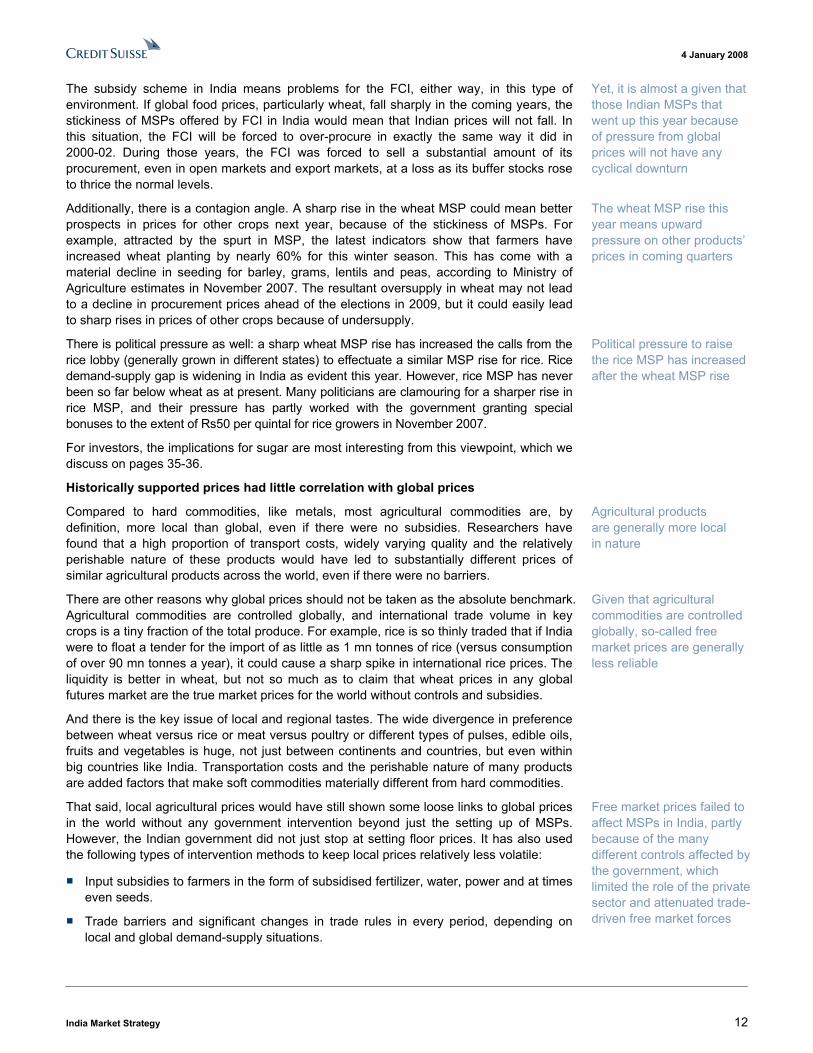
Minimum support prices are required to be set by the government based on the calculation of the cost of farming including the cost of capital, owner labour and imputed rent on the land used. This definition itself meant that MSPs were almost always on a rising trend. But, another strong reason why MSPs on rice and wheat have not come down at all is politics. With nearly 60% of India�s population dependent on farm income, even thoughts of cutting MSPs were considered dangerous for politicians.
Figure 23: MSPs have never gone down for wheat Figure 24: Rice MSP rise for 2008 � the highest ever
-
5
10
15
20
25
30
35
1977 1980 1983 1986 1989 1992 1995 1998 2001 2004 2007
Wheat MSP - YOY (%)
-
5
10
15
20
25
30
35
40
1977 1980 1983 1986 1989 1992 1995 1998 2001 2004 2007
Rice MSP - YOY (%)
Source: CMIE, Credit Suisse estimates Source: CMIE, Credit Suisse estimates
MSPs are so sticky on the downside that out of 200-plus annual MSPs announced on 20 essential crops in the past ten years, there is not a single decline. This is in stark contrast to the highly cyclical nature of international agricultural commodity prices. The fact that MSPs do not fall in India has material implications for investment and rural income in the years to come.
As we try to prove below, the recent global price rise is due mostly to demand-based factors. That said there are temporary adverse supply related reasons also contributing to the spike. At least some part of the sudden sharpness in wheat in particular is due to weather related factors that caused the wheat stocks globally to fall to their lowest level in 25 years. If the weather patterns return to more normal levels in the coming years, some of the price rise could be reversed globally. The question is more vexatious in the case of local prices though.
Low growth and yield are due partly to inefficiencies that can be improved
Cost-based MSPs had little reason to fall most of the time, but the politicised nature assured no falls in decades
None of the 200 MSP data from the past ten years show a decline
Global agricultural prices could remain on a secular upward trend in the long term, but still fall next year
4 January 2008
India Market Strategy 12
The subsidy scheme in India means problems for the FCI, either way, in this type of environment. If global food prices, particularly wheat, fall sharply in the coming years, the stickiness of MSPs offered by FCI in India would mean that Indian prices will not fall. In this situation, the FCI will be forced to over-procure in exactly the same way it did in 2000-02. During those years, the FCI was forced to sell a substantial amount of its procurement, even in open markets and export markets, at a loss as its buffer stocks rose to thrice the normal levels.
Additionally, there is a contagion angle. A sharp rise in the wheat MSP could mean better prospects in prices for other crops next year, because of the stickiness of MSPs. For example, attracted by the spurt in MSP, the latest indicators show that farmers have increased wheat planting by nearly 60% for this winter season. This has come with a material decline in seeding for barley, grams, lentils and peas, according to Ministry of Agriculture estimates in November 2007. The resultant oversupply in wheat may not lead to a decline in procurement prices ahead of the elections in 2009, but it could easily lead to sharp rises in prices of other crops because of undersupply.
There is political pressure as well: a sharp wheat MSP rise has increased the calls from the rice lobby (generally grown in different states) to effectuate a similar MSP rise for rice. Rice demand-supply gap is widening in India as evident this year. However, rice MSP has never been so far below wheat as at present. Many politicians are clamouring for a sharper rise in rice MSP, and their pressure has partly worked with the government granting special bonuses to the extent of Rs50 per quintal for rice growers in November 2007.
For investors, the implications for sugar are most interesting from this viewpoint, which we discuss on pages 35-36.
Historically supported prices had little correlation with global prices
Compared to hard commodities, like metals, most agricultural commodities are, by definition, more local than global, even if there were no subsidies. Researchers have found that a high proportion of transport costs, widely varying quality and the relatively perishable nature of these products would have led to substantially different prices of similar agricultural products across the world, even if there were no barriers.
There are other reasons why global prices should not be taken as the absolute benchmark. Agricultural commodities are controlled globally, and international trade volume in key crops is a tiny fraction of the total produce. For example, rice is so thinly traded that if India were to float a tender for the import of as little as 1 mn tonnes of rice (versus consumption of over 90 mn tonnes a year), it could cause a sharp spike in international rice prices. The liquidity is better in wheat, but not so much as to claim that wheat prices in any global futures market are the true market prices for the world without controls and subsidies.
And there is the key issue of local and regional tastes. The wide divergence in preference between wheat versus rice or meat versus poultry or different types of pulses, edible oils, fruits and vegetables is huge, not just between continents and countries, but even within big countries like India. Transportation costs and the perishable nature of many products are added factors that make soft commodities materially different from hard commodities.
That said, local agricultural prices would have still shown some loose links to global prices in the world without any government intervention beyond just the setting up of MSPs. However, the Indian government did not just stop at setting floor prices. It has also used the following types of intervention methods to keep local prices relatively less volatile:
■ Input subsidies to farmers in the form of subsidised fertilizer, water, power and at times even seeds.
■ Trade barriers and significant changes in trade rules in every period, depending on local and global demand-supply situations.
Yet, it is almost a given that those Indian MSPs that went up this year because of pressure from global prices will not have any cyclical downturn
The wheat MSP rise this year means upward pressure on other products� prices in coming quarters
Political pressure to raise the rice MSP has increased after the wheat MSP rise
Agricultural products are generally more local in nature
Given that agricultural commodities are controlled globally, so-called free market prices are generally less reliable
Free market prices failed to affect MSPs in India, partly because of the many different controls affected by the government, which limited the role of the private sector and attenuated trade-driven free market forces
4 January 2008
India Market Strategy 13
■ Rules controlling the role played by the private sector as well as substantial intervention by the state and state-controlled agencies in the cultivation, procurement, transportation and distribution of agricultural products.
■ Regulations on the use of agricultural land, encouragement or discouragement on the use of certain types of seeds, etc.
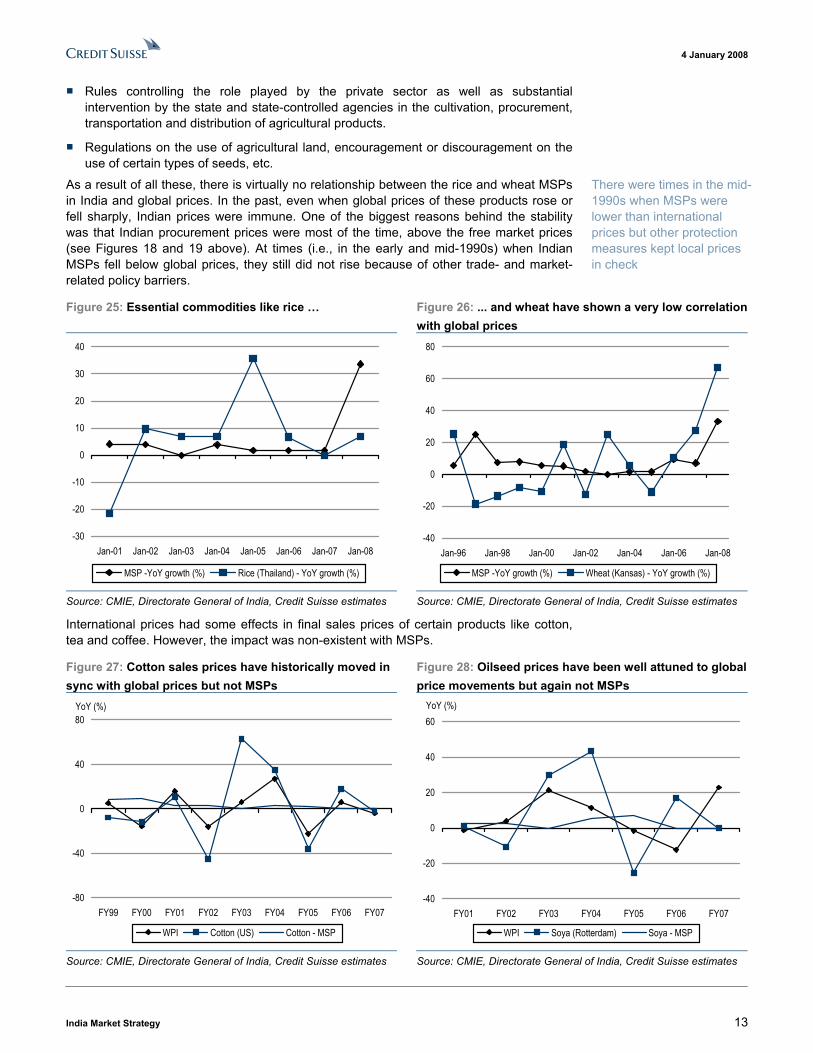
As a result of all these, there is virtually no relationship between the rice and wheat MSPs in India and global prices. In the past, even when global prices of these products rose or fell sharply, Indian prices were immune. One of the biggest reasons behind the stability was that Indian procurement prices were most of the time, above the free market prices (see Figures 18 and 19 above). At times (i.e., in the early and mid-1990s) when Indian MSPs fell below global prices, they still did not rise because of other trade- and market-related policy barriers.
Figure 25: Essential commodities like rice � Figure 26: ... and wheat have shown a very low correlation with global prices
-30
-20
-10
0
10
20
30
40
Jan-01 Jan-02 Jan-03 Jan-04 Jan-05 Jan-06 Jan-07 Jan-08
MSP -YoY growth (%) Rice (Thailand) - YoY growth (%)
-40
-20
0
20
40
60
80
Jan-96 Jan-98 Jan-00 Jan-02 Jan-04 Jan-06 Jan-08
MSP -YoY growth (%) Wheat (Kansas) - YoY growth (%)
Source: CMIE, Directorate General of India, Credit Suisse estimates Source: CMIE, Directorate General of India, Credit Suisse estimates
International prices had some effects in final sales prices of certain products like cotton, tea and coffee. However, the impact was non-existent with MSPs.
Figure 27: Cotton sales prices have historically moved in sync with global prices but not MSPs
Figure 28: Oilseed prices have been well attuned to global price movements but again not MSPs
-80
-40
0
40
80
FY99 FY00 FY01 FY02 FY03 FY04 FY05 FY06 FY07
WPI Cotton (US) Cotton - MSP
YoY (%)
-40
-20
0
20
40
60
FY01 FY02 FY03 FY04 FY05 FY06 FY07
WPI Soya (Rotterdam) Soya - MSP
YoY (%)
Source: CMIE, Directorate General of India, Credit Suisse estimates Source: CMIE, Directorate General of India, Credit Suisse estimates
There were times in the mid-1990s when MSPs were lower than international prices but other protection measures kept local prices in check
4 January 2008
India Market Strategy 14
New era: demand-driven free market price surges There are two reasons why the influence of global prices is likely to be higher in future:
■ Most of the sharp international and domestic price rises in the past were due to supply shocks, which proved temporary. As we explain below, this is no longer true. We believe that a part of the recent spike is due to weather-related reasons, and hence could be reversed. But the demand-supply balance is materially changing around the world and more so in India, due to income growth, changing food patterns, higher biofuel-related demand and less land availability.
■ The private sector is playing an increasing role in procurement, due to the many reform initiatives in the past decade. Even if its procurement share is small, it is instrumental in transmitting free market price signals to procurement markets.
Higher agricultural prices: a global phenomenon
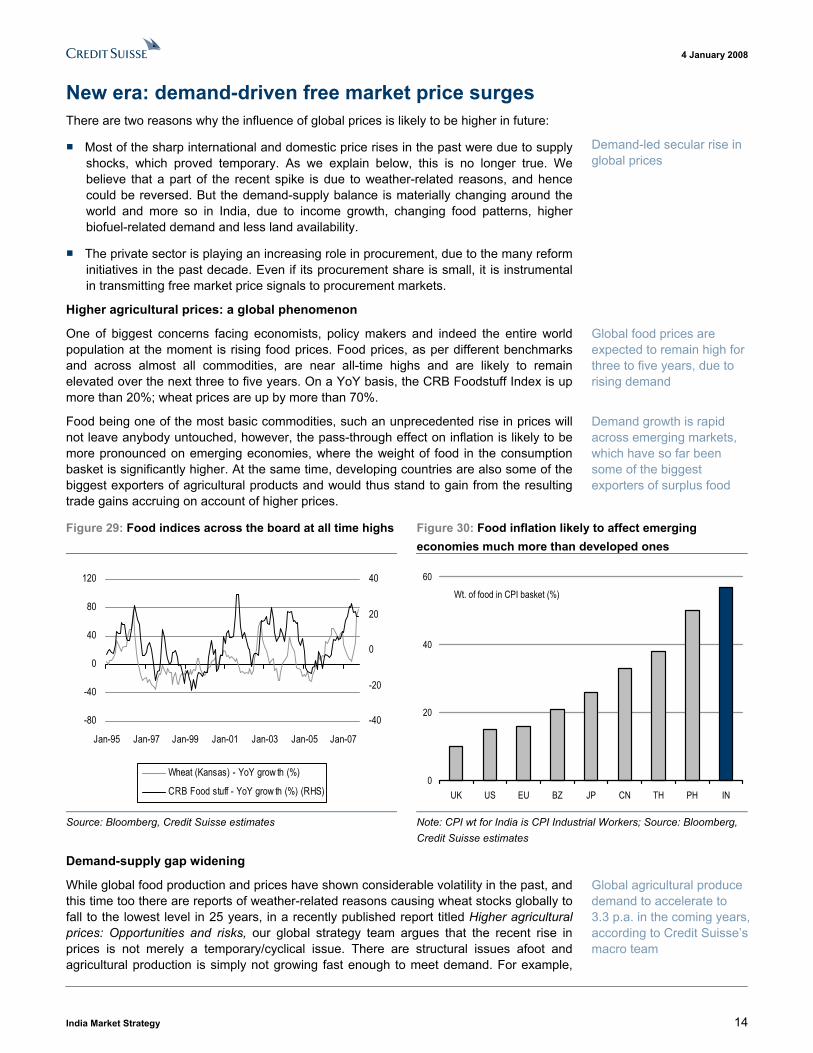
One of biggest concerns facing economists, policy makers and indeed the entire world population at the moment is rising food prices. Food prices, as per different benchmarks and across almost all commodities, are near all-time highs and are likely to remain elevated over the next three to five years. On a YoY basis, the CRB Foodstuff Index is up more than 20%; wheat prices are up by more than 70%.
Food being one of the most basic commodities, such an unprecedented rise in prices will not leave anybody untouched, however, the pass-through effect on inflation is likely to be more pronounced on emerging economies, where the weight of food in the consumption basket is significantly higher. At the same time, developing countries are also some of the biggest exporters of agricultural products and would thus stand to gain from the resulting trade gains accruing on account of higher prices.
Figure 29: Food indices across the board at all time highs Figure 30: Food inflation likely to affect emerging economies much more than developed ones
-80
-40
0
40
80
120
Jan-95 Jan-97 Jan-99 Jan-01 Jan-03 Jan-05 Jan-07
-40
-20
0
20
40
Wheat (Kansas) - YoY grow th (%)
CRB Food stuff - YoY grow th (%) (RHS)
0
20
40
60
UK US EU BZ JP CN TH PH IN
Wt. of food in CPI basket (%)
Source: Bloomberg, Credit Suisse estimates Note: CPI wt for India is CPI Industrial Workers; Source: Bloomberg, Credit Suisse estimates
Demand-supply gap widening
While global food production and prices have shown considerable volatility in the past, and this time too there are reports of weather-related reasons causing wheat stocks globally to fall to the lowest level in 25 years, in a recently published report titled Higher agricultural prices: Opportunities and risks, our global strategy team argues that the recent rise in prices is not merely a temporary/cyclical issue. There are structural issues afoot and agricultural production is simply not growing fast enough to meet demand. For example,
Demand-led secular rise in global prices
Global food prices are expected to remain high for three to five years, due to rising demand
Demand growth is rapid across emerging markets, which have so far been some of the biggest exporters of surplus food
Global agricultural produce demand to accelerate to 3.3 p.a. in the coming years, according to Credit Suisse�s macro team

4 January 2008
India Market Strategy 15
according to the International Grains Council, despite the much-flagged bad weather of 2007, the cereal crop globally is expected to hit a new record of 1.7 bn tonnes this year, about 5% higher than 2006�s record crop. And even this rise could not stop the prices from spiking up in one cereal after another throughout 2007.
The report goes on to estimate that global demand for agricultural products will grow at 3.3% p.a. and that supply will not be able to keep up, leading to high food price inflation in the medium term. The key demand drivers are as follows:
■ Population growth. Global population growth is expected to contribute 1.1% p.a. to the rise in food demand.
■ Higher calorie consumption and changing food patterns. With the rise in real income, particularly in developing countries, calories per capita also increase. This is reflected at least in part by a shift in dietary patterns toward higher meat consumption. Meat consumption in developing countries is increasing at an annualised rate of 4.8% versus only 0.5% in industrialised nations. The higher per-capita calorie intake is expected to contribute another 1.5% to global demand.
■ Biofuel demand shock. Crude prices have been close to the US$100 per barrel mark for some time. Rising oil prices have forced the world to take a fresh look at the use of alternative sources of energy in order to meet the ever-increasing demand. One of the options that has been gaining widespread acceptance is biofuel, such as bio-ethanol and biodiesel. Since biofuel also uses agricultural produce as input, the increasing demand for biofuel is expected to add 0.8% to overall demand.
The report assesses the supply-side dynamics under two headings:
■ Acreage expansion. Arable acreage is likely to see at best small net growth as contractions in some markets, such as China, are offset by expansion in South America and Indonesia. While the US and EU both theoretically have some ability to reflate, having a substantial forests area and idle land, respectively, pressure from various agents, such as farmers and environmental activists, amongst others, is likely to delay the process, if not stall it completely.
■ Increase in productivity. Over the past 20 years, global agricultural productivity has increased at an average of 1.3% p.a. Even if this were to increase to the long-term average of 2%, which looks difficult, the combined effect and the expected acreage expansion would not be sufficient to meet the projected growth in agricultural demand.
Having established that the widening of the demand-supply gap is likely to be a structural trend, at least in the medium term, the global report mentioned above goes on to examine the impact of higher food prices on aspects such as global inflation, trade dynamics and the like. For the purpose of this report, however, we take a different path. We accept that global food prices will remain elevated in the medium term for the reasons mentioned above, and examine the likely implications for India�s domestic economy and, in turn, for equity markets.
India � mirroring global demand-supply trends Is a widening demand-supply gap the trend in India as well? Or is India bucking the global trend to create a local surplus situation? As a start, we estimate India�s demand growth using a method similar to that which has been used to estimate the growth in global demand. Overall, if food demand is expected to grow at 3.3% globally, the growth numbers could be similar, if not higher, for India over the next few years.
Emerging countries� food patterns to shift towards higher-cost meat and poultry, which will add pressure on agricultural product demand
Higher fuel prices are encouraging the production of biofuel from grains and other agricultural produce
Area under cultivation may not grow much due to rapid urbanisation and rising land prices in countries such as China and India
Productivity cannot increase materially in a short period
Food demand could grow higher than 3% p.a. in India over the next few years
4 January 2008
India Market Strategy 16
3%-plus demand growth highly possible
■ Population growth. India�s population has been growing at about 1.6% annually.
■ Higher calorie consumption. India is also the second-fastest-growing major economy in the world, with real GDP growth of about 9% and a per capita rise in excess of 7% � way above the global average of 5% and 4%, respectively. Given rising real income levels and economic growth that is far higher than the global average, there is no reason to believe that India�s calories per capita should increase at a slower rate than the global average.
Facts, however, would paint a different story. The calorie intake numbers for the last two years may only be available later, but in the latest numbers available before FY05, calorie intake seems to have remained on a declining trend established in the last decade. According to the National Sample Survey, the average daily intake of calories by the rural population dropped nearly 5% to 2,047 Kcal in 2004-05 versus 1993-94 and by 2.5 % to 2,020 Kcal in urban areas. The population reporting a calorie intake level of �less than 100%� of the norm of 2,700 kcal formed 66% of the total in rural areas and 70% of the total in urban areas.
The global experience shows that income growth has a significant impact on calorie intake. According to the Food and Agriculture Organisation, the average calorie intake of developing countries was 2,110 kcal/person/day 30 years ago � higher than the Indian average at present. The average intake in emerging nations has now risen to 2,650 kcal.
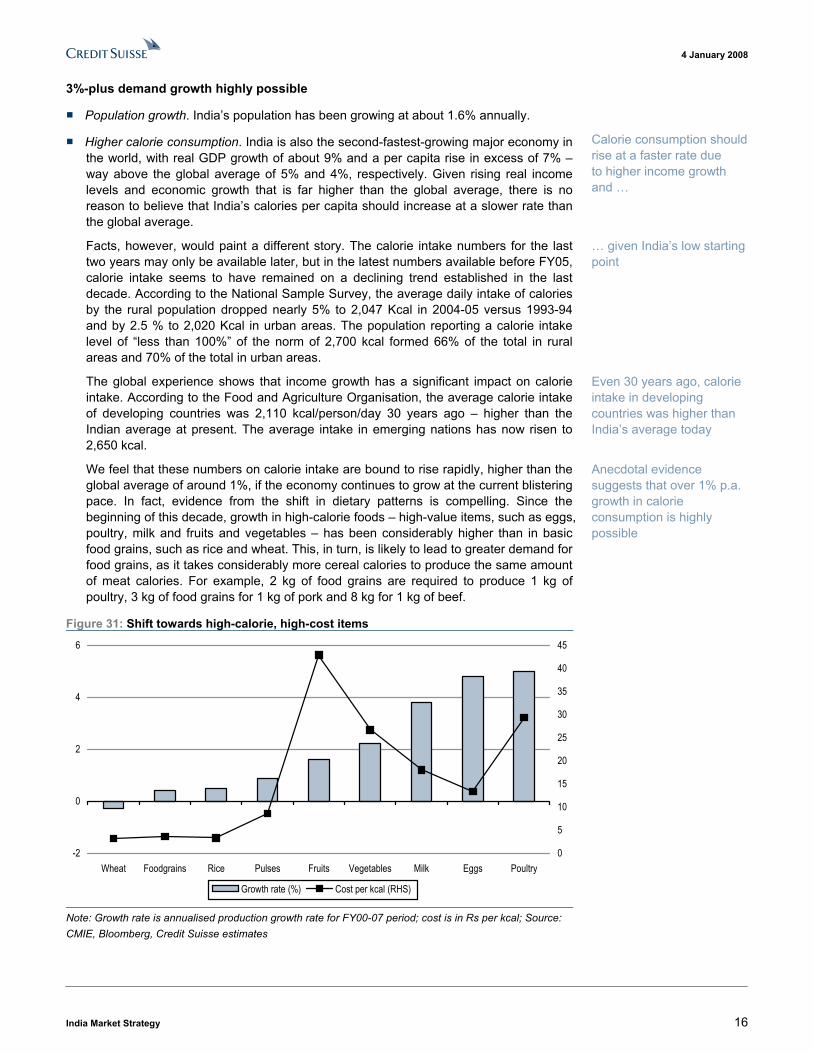
We feel that these numbers on calorie intake are bound to rise rapidly, higher than the global average of around 1%, if the economy continues to grow at the current blistering pace. In fact, evidence from the shift in dietary patterns is compelling. Since the beginning of this decade, growth in high-calorie foods � high-value items, such as eggs, poultry, milk and fruits and vegetables � has been considerably higher than in basic food grains, such as rice and wheat. This, in turn, is likely to lead to greater demand for food grains, as it takes considerably more cereal calories to produce the same amount of meat calories. For example, 2 kg of food grains are required to produce 1 kg of poultry, 3 kg of food grains for 1 kg of pork and 8 kg for 1 kg of beef.
Figure 31: Shift towards high-calorie, high-cost items
-2
0
2
4
6
Wheat Foodgrains Rice Pulses Fruits Vegetables Milk Eggs Poultry0
5
10
15
20
25
30
35
40
45
Growth rate (%) Cost per kcal (RHS)
Note: Growth rate is annualised production growth rate for FY00-07 period; cost is in Rs per kcal; Source: CMIE, Bloomberg, Credit Suisse estimates
Calorie consumption should rise at a faster rate due to higher income growth and �
� given India�s low starting point
Even 30 years ago, calorie intake in developing countries was higher than India�s average today
Anecdotal evidence suggests that over 1% p.a. growth in calorie consumption is highly possible
4 January 2008
India Market Strategy 17
■ Demand for biofuel. The major area of difference between India and the rest of the world, in terms of demand projections, could be in biofuel � not because India should be any less incentivised to look for alternative sources of energy, but because of the government controls preventing large-scale diversion of agricultural inputs towards energy generation. Currently, the only major biofuel producers in India are sugar companies. The government has recently increased the mandatory level of blending of ethanol in petroleum products from 5% to 10%. However, since ethanol in India is made as a by-product (from molasses) and not as the main product straight from sugar cane, as is the case in Brazil, this is unlikely to add substantially to domestic demand. While growth in this segment could be high, from a low base, we are conservative in our estimates and assume, for the purpose of this calculation, the additional demand from biofuel to be negligible.
Even with our relatively cautious approach, it is evident that India�s demand for food is likely to grow at over 3% for the next few years. With the near double-digit growth that the economy is expected to see, if supply is enhanced, demand growth could easily be much higher at 4-5% for a few years. Our top-down estimates are a tad below the 4% overall growth projections made by the Planning Commission for 2007-12.
Supply increases would be possible only after a while
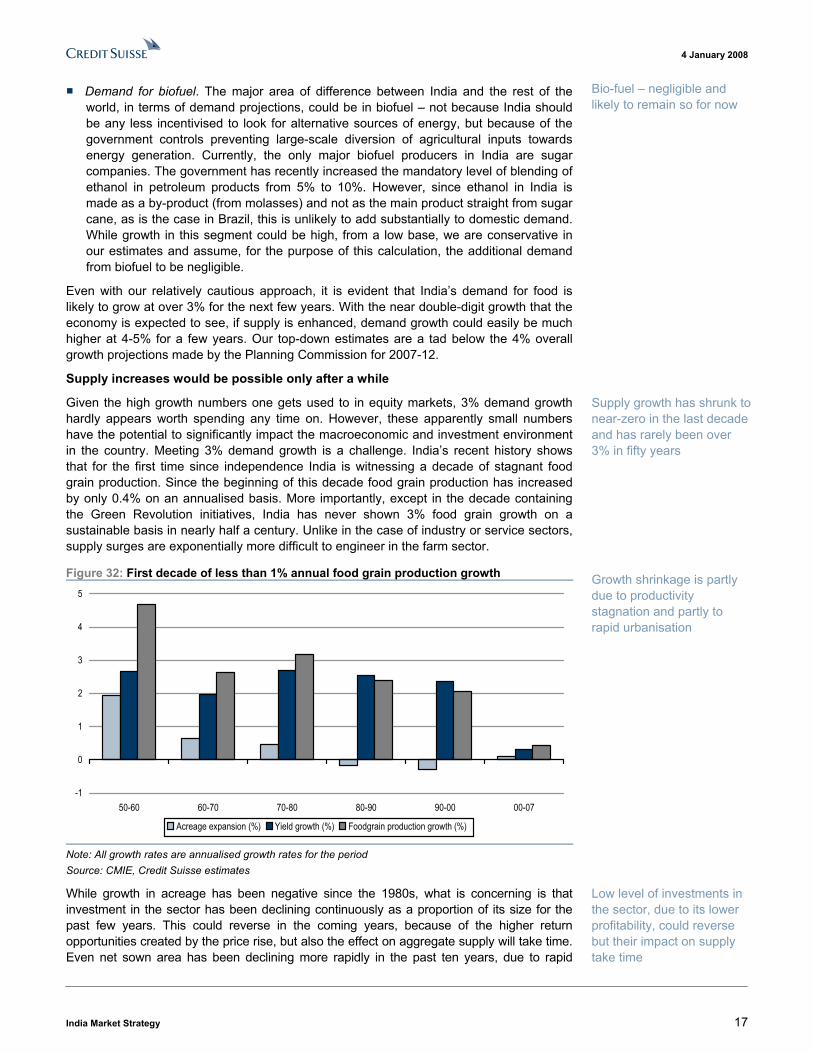
Given the high growth numbers one gets used to in equity markets, 3% demand growth hardly appears worth spending any time on. However, these apparently small numbers have the potential to significantly impact the macroeconomic and investment environment in the country. Meeting 3% demand growth is a challenge. India�s recent history shows that for the first time since independence India is witnessing a decade of stagnant food grain production. Since the beginning of this decade food grain production has increased by only 0.4% on an annualised basis. More importantly, except in the decade containing the Green Revolution initiatives, India has never shown 3% food grain growth on a sustainable basis in nearly half a century. Unlike in the case of industry or service sectors, supply surges are exponentially more difficult to engineer in the farm sector.
Figure 32: First decade of less than 1% annual food grain production growth
-1
0
1
2
3
4
5
50-60 60-70 70-80 80-90 90-00 00-07
Acreage expansion (%) Yield growth (%) Foodgrain production growth (%)
Note: All growth rates are annualised growth rates for the period Source: CMIE, Credit Suisse estimates
While growth in acreage has been negative since the 1980s, what is concerning is that investment in the sector has been declining continuously as a proportion of its size for the past few years. This could reverse in the coming years, because of the higher return opportunities created by the price rise, but also the effect on aggregate supply will take time. Even net sown area has been declining more rapidly in the past ten years, due to rapid
Bio-fuel � negligible and likely to remain so for now
Supply growth has shrunk to near-zero in the last decade and has rarely been over 3% in fifty years
Growth shrinkage is partly due to productivity stagnation and partly to rapid urbanisation
Low level of investments in the sector, due to its lower profitability, could reverse but their impact on supply take time

4 January 2008
India Market Strategy 18
urbanisation and a rise in land prices. The crop area has declined at a slower rate, due to multiple-cropping in a year. But the trend needs a reversal for robust overall supply growth.
Figure 33: Area under cultivation has been declining for a decade
Figure 34: Private investment could rise over time and even public investments could bottom given the price rise
-0.6
-0.4
-0.2
0
0.2
0.4
0.6
1980/81 to 1990-91 1990/91 to 1996/97 1996/97 to 2003/04
Total crop area growth (%) Net sown area growth (%)
1
2
3
4
5
'71-'75 '76-'80 '81-'85 '86-'90 '91-'95 '96-'00 '01-'03
Public sector investment as a % of agriculture GDPPrivate sector investment (%)
Source: Planning Commission Source: National Accounts Statistics
The availability of land is a larger issue. Based on the land classification by the government, unless there is a drive towards reducing forests, there is not much land available for agriculture in India. As a result, any supply increase would have to be driven by yield improvement, which would happen only over a few years and after more investment in technology.
Figure 35: Without cutting forests or reducing land available for grazing, it is impossible to increase area under cultivation
Fallow lands9%
Other culturable land10%
Forests26%
Net sown area55%
Total land in India that is not under non-agricultural use and barren
Source: Ministry of Agriculture, Credit Suisse estimates
In a populated country, the area under cultivation cannot rise much more
4 January 2008
India Market Strategy 19
A marked shift starting from now Most of the demand-supply factors discussed above are not new. They are long-term factors in play for at least a few quarters. Why should investors think about them more from 2008 onwards?
Crossing an inflexion point
As late as 2006, there was a widespread belief that India�s minimum support prices (MSPs) for almost all crops were substantially higher than free market prices. Free-market-favouring commentators were suggesting a reduction in MSPs by 10-20% and the introduction of direct subsidy payments to farmers. The concern was about over-stocking by the FCI, due to their higher-than-needed procurement, forced upon them by the FCI. Private sector traders were feeling continuously marginalised, as they could not match the government-set prices. A few also argued that consumers were paying higher prices as a result of artificially high MSP.
Additionally, the Indian government had rarely come under pressure to raise procurement prices, because of the global situation. The higher role played by the private sector in farm sector procurement and better information access at all levels has completely transformed the situation within a short time.
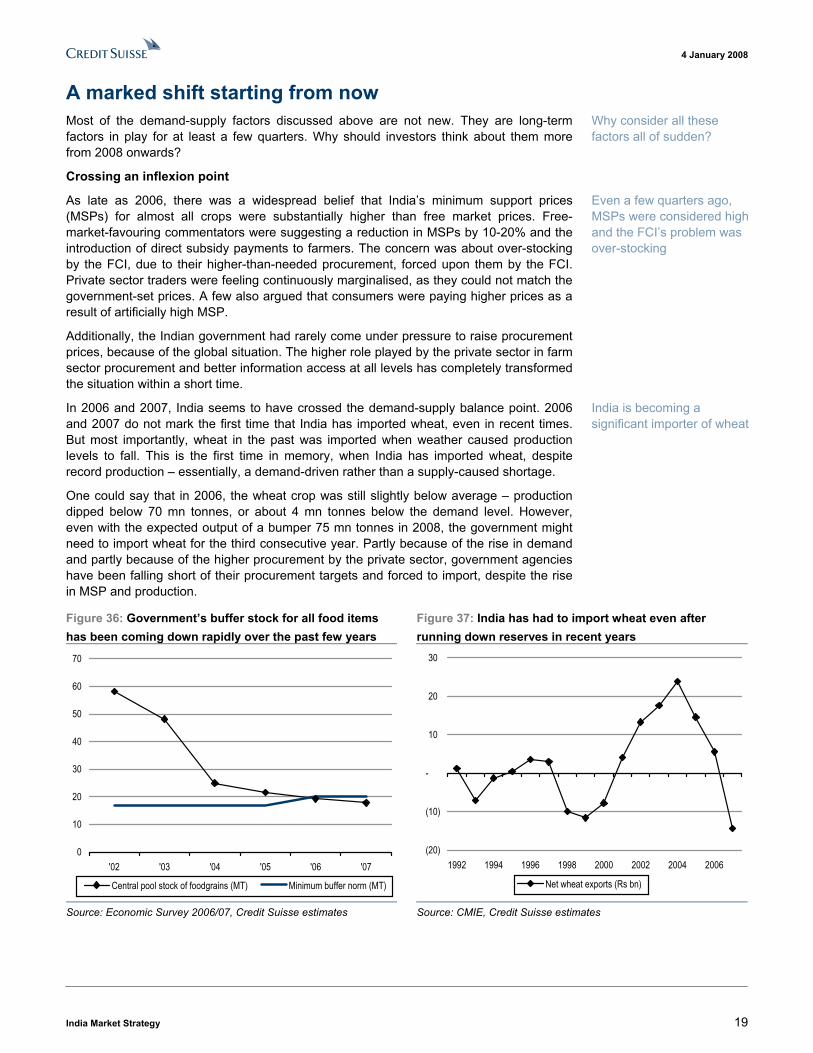
In 2006 and 2007, India seems to have crossed the demand-supply balance point. 2006 and 2007 do not mark the first time that India has imported wheat, even in recent times. But most importantly, wheat in the past was imported when weather caused production levels to fall. This is the first time in memory, when India has imported wheat, despite record production � essentially, a demand-driven rather than a supply-caused shortage.
One could say that in 2006, the wheat crop was still slightly below average � production dipped below 70 mn tonnes, or about 4 mn tonnes below the demand level. However, even with the expected output of a bumper 75 mn tonnes in 2008, the government might need to import wheat for the third consecutive year. Partly because of the rise in demand and partly because of the higher procurement by the private sector, government agencies have been falling short of their procurement targets and forced to import, despite the rise in MSP and production.
Figure 36: Government�s buffer stock for all food items has been coming down rapidly over the past few years
Figure 37: India has had to import wheat even after running down reserves in recent years
0
10
20
30
40
50
60
70
'02 '03 '04 '05 '06 '07
Central pool stock of foodgrains (MT) Minimum buffer norm (MT)
(20)
(10)
-
10
20
30
1992 1994 1996 1998 2000 2002 2004 2006
Net wheat exports (Rs bn)
Source: Economic Survey 2006/07, Credit Suisse estimates Source: CMIE, Credit Suisse estimates
Why consider all these factors all of sudden?
Even a few quarters ago, MSPs were considered high and the FCI�s problem was over-stocking
India is becoming a significant importer of wheat
4 January 2008
India Market Strategy 20
The situation deteriorated further in late 2007, when rice procurement seemed to begin suffering, similar to wheat. For example, free market rice retail prices are up 18% YoY, as per the latest statistics from Agriculture Marketing Information Network. Rice in India in 2007 provides a clear case of demand-led increase. On the supply side, production has been stagnant in the latest monsoon season, yet government procurement at MSP declined by 15% as a result of lower supply at the government-offered prices at the wholesale marts. This is despite the government�s raising procurement prices by almost 20%. The price rises in open or free markets were sharper for higher grade rice, such as basmati.
India is likely to remain a net exporter in the agriculture sector for some time, but unless yields are enhanced, the loss of its revered food self-sufficiency is only a question of time. Even the Ministry of Agriculture estimates that India could be short of 20 mn tonnes of wheat, rice and pulses in the next five years.
It is a similar shortage, as we wrote at the beginning of this section, which created a sense of urgency and led to the mega-growth cycle in India�s agriculture sector from the late 1960s/1970s under the banner of the Green Revolution. The seeds of another sector�s improvement programmes are not sown yet, but many in policymaking have begun to define the problem and give potential ideas. The long-term growth prospects are bright, as the issue is critical for policy-making, and it is going to cause calls for urgent action because of the increasingly evident demand-supply gap. In the near term, however, the benefits are more in the form of nominal income for rural India.
Income benefits with a little lag
While the demand-supply balance changed in most of 2006 and 2007, the MSPs were still held somewhat steady. The government worked on many other measures, like export controls, the FCI�s lower procurement locally, the ban on forward prices and adjustments in duties to contain the MSPs. This all seems to have failed, in our view. In 2H07, yielding to market pressure, the government raised rice and wheat MSPs to a level not seen before.
Partly due to politics, but also party to market pressure, arguments are being made to lift rice and wheat MSPs by a further 20-30% in the months ahead. The price rise pressure has begun to intensify for edible oils and pulses as well. Sugar is an exception, mainly due to 18-36 month cycle for this crop. Farmers can switch from sugar cane to more remunerative crops only at the end of the crop cycle. Overall, given that the sharpest of the MSP spikes are only a recent phenomenon, their impact on rural income is more likely to become visible in 2008.
Conclusion: higher farm income, with some risks Procurement prices for rice and wheat are rising at a pace rarely seen in the past few decades. Prices are rising for the right reason � better demand growth, rather than some sort of supply shock. The benefits are accruing more to farmers, than to middlemen, due to higher participation of the private sector and pressure from free market prices. All of these factors should lead to material change in the rural income trend in the years ahead.
We are not simply talking about nominal growth. We see a significant acceleration in real growth and farmers are now heavily incentivised at current price points to seek better productivity. The demand-supply gap is widening to the extent that the government too is likely to launch new plans for the first time in the past three decades in order to boost farm productivity. Private sector investments are likely to be another factor in the quarters to come. In the entire process, politics could play an important near-term role. In the run-up to the elections, procurement prices could rise faster than otherwise, providing a great catalyst for the rural economy.
As always, there are key weather-related risks for the sector. The food economy always comes under severe stress when weather surprises negatively and the situation for farmers is likely to be no less different in the following years.
Rice � going the way of wheat?
Loss of food self-sufficiency seems only a question of time without a material supply-side improvement
The government tried to contain MSP measures with other policies in 2006-07
Since sharpest MSP rise happened only in 2H07; its impact on rural income has yet to be seen
More and sustainable benefits for farmers from the current round of price rises
The growth is not just in nominal income, but also in real income
Weather is the key risk to the rural income theme
4 January 2008
India Market Strategy 21
� and consumer prices controlled At aggregate, the rural economy does not always benefit from rising food prices, as only 30-35% of rural India produces surplus food. Rising food prices at the consumer level could also have had rather negative implications for inflation and economic policies. But in the run-up to the elections, we show how food prices at the consumer level have remained stable and are likely to remain so. This has been facilitated through an historical expansion in the food deficit. While unsustainable longer term, with negative implications for 2009 inflation, the near-term outlook is that the rural economy has sizeable dual benefits from rising procurement and stagnant consumer prices to enjoy in 2008. All this is made possible by another arm of government control on the food sector � price-setting in the public distribution system.
Rural income: does it benefit from rising food prices? There are two sides to agricultural prices � producer prices and consumer prices. One would normally think that higher producer prices would automatically benefit farmers and rural India. While agriculture output is only 19% of the current GDP, more than 60% of the labour force is employed in farm-related activities. Nearly 72% of India�s population lives in rural areas, where the major industry is agriculture. Yet, despite all of this, rising food prices are not necessarily positive for rural income.
There are reasons why policymakers are wary of witnessing a surge in agricultural prices:
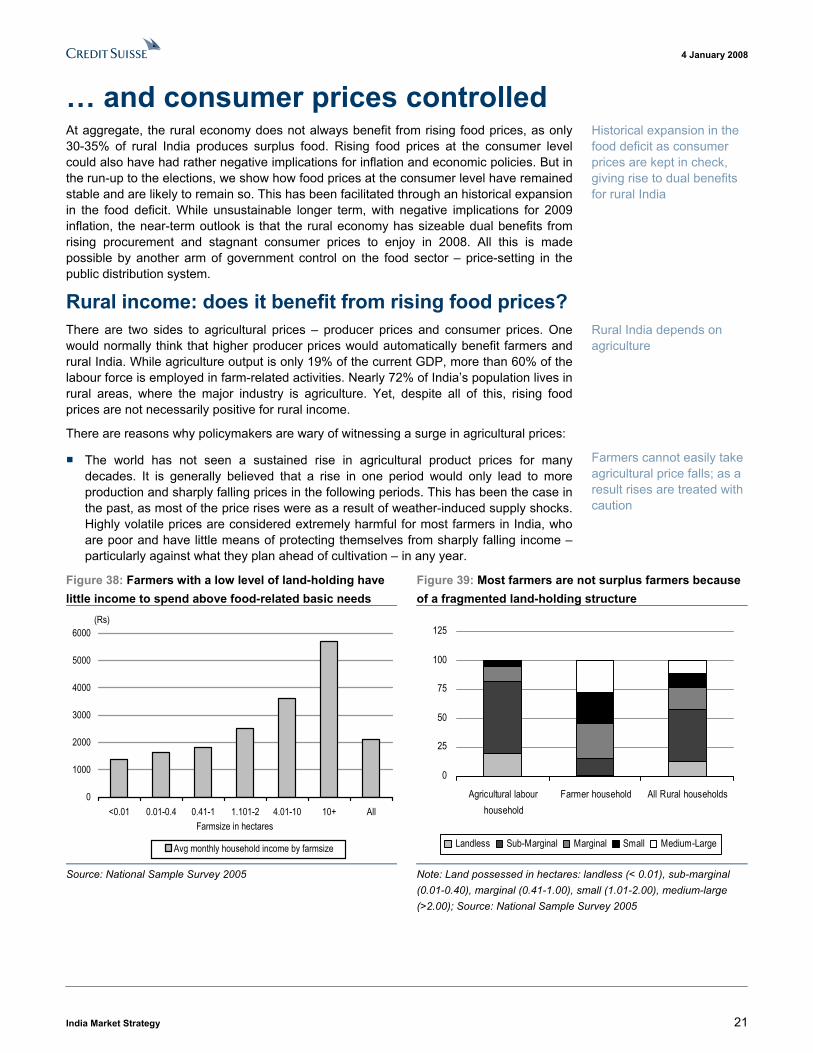
■ The world has not seen a sustained rise in agricultural product prices for many decades. It is generally believed that a rise in one period would only lead to more production and sharply falling prices in the following periods. This has been the case in the past, as most of the price rises were as a result of weather-induced supply shocks. Highly volatile prices are considered extremely harmful for most farmers in India, who are poor and have little means of protecting themselves from sharply falling income � particularly against what they plan ahead of cultivation � in any year.
Figure 38: Farmers with a low level of land-holding have little income to spend above food-related basic needs
Figure 39: Most farmers are not surplus farmers because of a fragmented land-holding structure
0
1000
2000
3000
4000
5000
6000
<0.01 0.01-0.4 0.41-1 1.101-2 4.01-10 10+ All
(Rs)
Avg monthly household income by farmsize
Farmsize in hectares
0
25
50
75
100
125
Agricultural labourhousehold
Farmer household All Rural households
Landless Sub-Marginal Marginal Small Medium-Large
Source: National Sample Survey 2005 Note: Land possessed in hectares: landless (< 0.01), sub-marginal (0.01-0.40), marginal (0.41-1.00), small (1.01-2.00), medium-large (>2.00); Source: National Sample Survey 2005
Historical expansion in the food deficit as consumer prices are kept in check, giving rise to dual benefits for rural India
Rural India depends on agriculture
Farmers cannot easily take agricultural price falls; as a result rises are treated with caution
4 January 2008
India Market Strategy 22
■ Anecdotally, only around 30-35% of farmers in India produce surplus agricultural output. The rest are in possession of so little land, as shown in the chart above, that they are negative beneficiaries of sharp rises in food prices. According to the Sengupta Committee report to the Prime Minister in August 2007, about 836 mn people, or 77% of the population live on less than Rs20 per day (i.e., an annual income of less than US$200). The proportion of people below the poverty line is greater in the farm sector and in rural India. For these farmers, any potential rise in income from higher farm income is unlikely to be sufficient if food prices at the consumption level rose as well as food as a major part of their consumption basket.
■ Inflation containment is always critical in an inflation-prone economy like India�s. For the middle and lower classes across the country, both in the rural and urban economy, food price stability is critical for rising prosperity. High food prices have led to soaring inflation, falling economic growth and declining government popularity in the past.
Muted impact on inflation so far
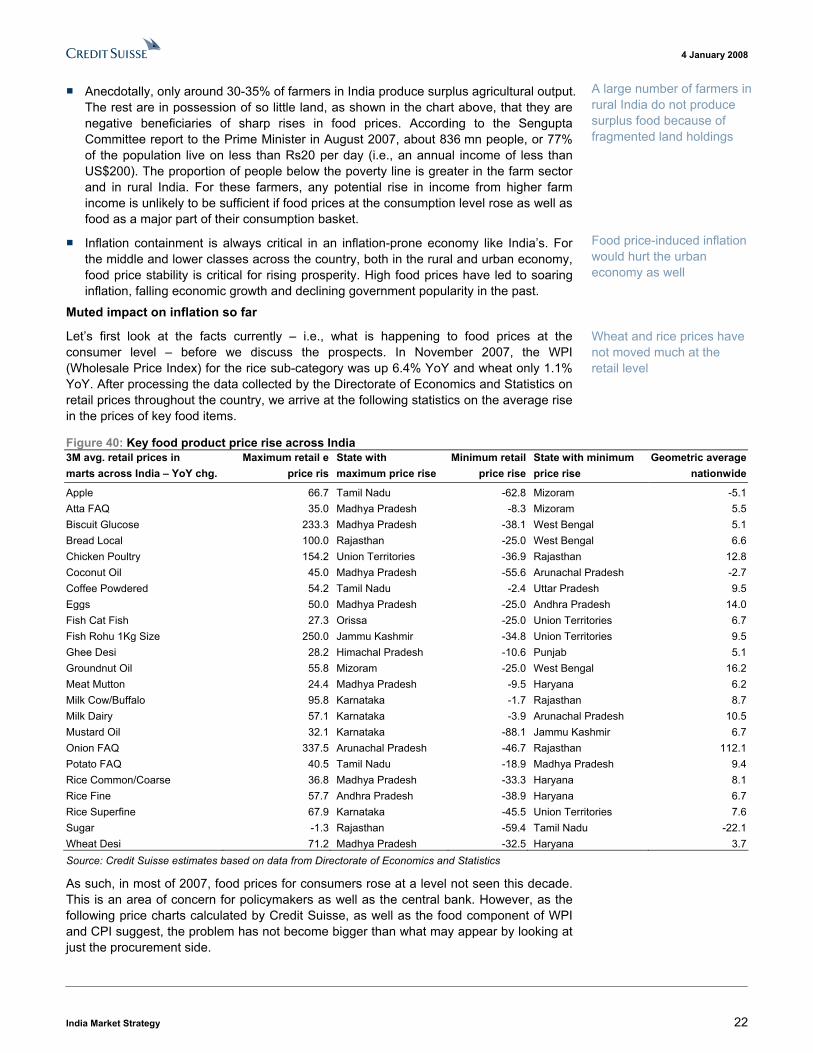
Let�s first look at the facts currently � i.e., what is happening to food prices at the consumer level � before we discuss the prospects. In November 2007, the WPI (Wholesale Price Index) for the rice sub-category was up 6.4% YoY and wheat only 1.1% YoY. After processing the data collected by the Directorate of Economics and Statistics on retail prices throughout the country, we arrive at the following statistics on the average rise in the prices of key food items.
Figure 40: Key food product price rise across India 3M avg. retail prices in Maximum retail e State with Minimum retail State with minimum Geometric averagemarts across India � YoY chg. price ris maximum price rise price rise price rise nationwide
Apple 66.7 Tamil Nadu -62.8 Mizoram -5.1Atta FAQ 35.0 Madhya Pradesh -8.3 Mizoram 5.5Biscuit Glucose 233.3 Madhya Pradesh -38.1 West Bengal 5.1Bread Local 100.0 Rajasthan -25.0 West Bengal 6.6Chicken Poultry 154.2 Union Territories -36.9 Rajasthan 12.8Coconut Oil 45.0 Madhya Pradesh -55.6 Arunachal Pradesh -2.7Coffee Powdered 54.2 Tamil Nadu -2.4 Uttar Pradesh 9.5Eggs 50.0 Madhya Pradesh -25.0 Andhra Pradesh 14.0Fish Cat Fish 27.3 Orissa -25.0 Union Territories 6.7Fish Rohu 1Kg Size 250.0 Jammu Kashmir -34.8 Union Territories 9.5Ghee Desi 28.2 Himachal Pradesh -10.6 Punjab 5.1Groundnut Oil 55.8 Mizoram -25.0 West Bengal 16.2Meat Mutton 24.4 Madhya Pradesh -9.5 Haryana 6.2Milk Cow/Buffalo 95.8 Karnataka -1.7 Rajasthan 8.7Milk Dairy 57.1 Karnataka -3.9 Arunachal Pradesh 10.5Mustard Oil 32.1 Karnataka -88.1 Jammu Kashmir 6.7Onion FAQ 337.5 Arunachal Pradesh -46.7 Rajasthan 112.1Potato FAQ 40.5 Tamil Nadu -18.9 Madhya Pradesh 9.4Rice Common/Coarse 36.8 Madhya Pradesh -33.3 Haryana 8.1Rice Fine 57.7 Andhra Pradesh -38.9 Haryana 6.7Rice Superfine 67.9 Karnataka -45.5 Union Territories 7.6Sugar -1.3 Rajasthan -59.4 Tamil Nadu -22.1Wheat Desi 71.2 Madhya Pradesh -32.5 Haryana 3.7Source: Credit Suisse estimates based on data from Directorate of Economics and Statistics
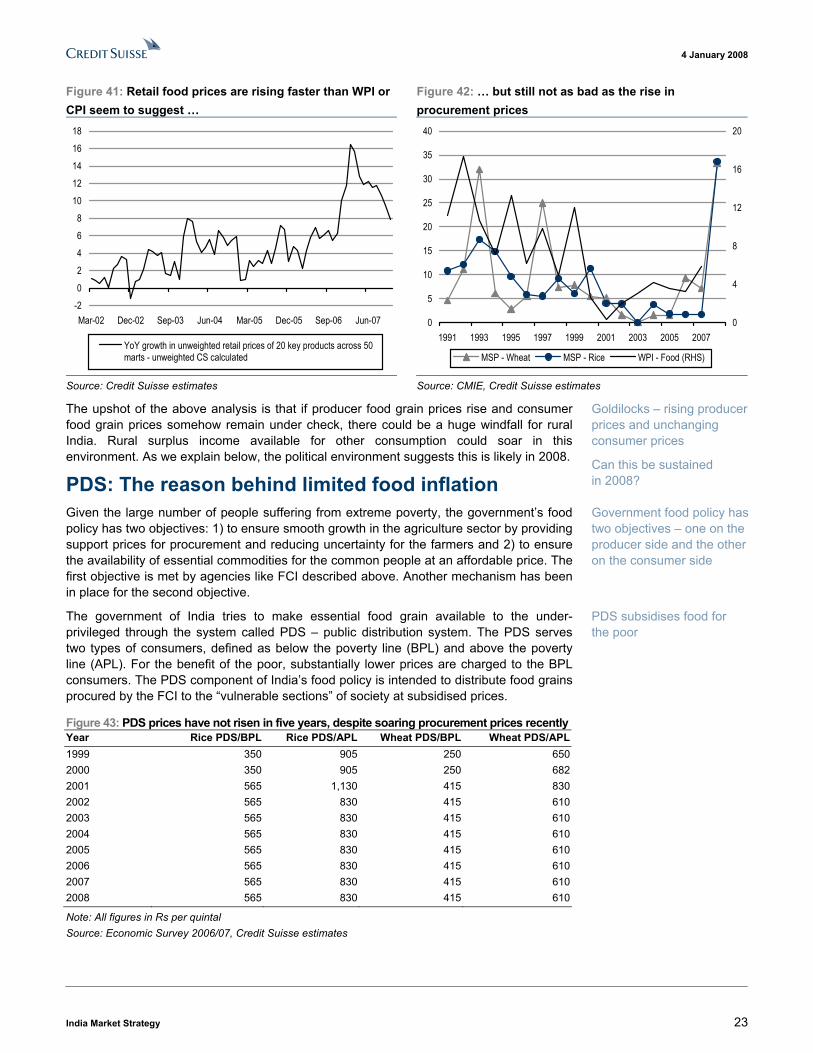
As such, in most of 2007, food prices for consumers rose at a level not seen this decade. This is an area of concern for policymakers as well as the central bank. However, as the following price charts calculated by Credit Suisse, as well as the food component of WPI and CPI suggest, the problem has not become bigger than what may appear by looking at just the procurement side.
A large number of farmers in rural India do not produce surplus food because of fragmented land holdings
Food price-induced inflation would hurt the urban economy as well
Wheat and rice prices have not moved much at the retail level
4 January 2008
India Market Strategy 23
Figure 41: Retail food prices are rising faster than WPI or CPI seem to suggest �
Figure 42: � but still not as bad as the rise in procurement prices
-202468
1012141618
Mar-02 Dec-02 Sep-03 Jun-04 Mar-05 Dec-05 Sep-06 Jun-07
YoY growth in unweighted retail prices of 20 key products across 50marts - unweighted CS calculated
0
5
10
15
20
25
30
35
40
1991 1993 1995 1997 1999 2001 2003 2005 20070
4
8
12
16
20
MSP - Wheat MSP - Rice WPI - Food (RHS)
Source: Credit Suisse estimates Source: CMIE, Credit Suisse estimates
The upshot of the above analysis is that if producer food grain prices rise and consumer food grain prices somehow remain under check, there could be a huge windfall for rural India. Rural surplus income available for other consumption could soar in this environment. As we explain below, the political environment suggests this is likely in 2008.
PDS: The reason behind limited food inflation Given the large number of people suffering from extreme poverty, the government�s food policy has two objectives: 1) to ensure smooth growth in the agriculture sector by providing support prices for procurement and reducing uncertainty for the farmers and 2) to ensure the availability of essential commodities for the common people at an affordable price. The first objective is met by agencies like FCI described above. Another mechanism has been in place for the second objective.
The government of India tries to make essential food grain available to the under-privileged through the system called PDS � public distribution system. The PDS serves two types of consumers, defined as below the poverty line (BPL) and above the poverty line (APL). For the benefit of the poor, substantially lower prices are charged to the BPL consumers. The PDS component of India�s food policy is intended to distribute food grains procured by the FCI to the �vulnerable sections� of society at subsidised prices.
Figure 43: PDS prices have not risen in five years, despite soaring procurement prices recently Year Rice PDS/BPL Rice PDS/APL Wheat PDS/BPL Wheat PDS/APL1999 350 905 250 6502000 350 905 250 6822001 565 1,130 415 8302002 565 830 415 6102003 565 830 415 6102004 565 830 415 6102005 565 830 415 6102006 565 830 415 6102007 565 830 415 6102008 565 830 415 610
Note: All figures in Rs per quintal Source: Economic Survey 2006/07, Credit Suisse estimates
Goldilocks � rising producer prices and unchanging consumer prices
Can this be sustained in 2008?
Government food policy has two objectives � one on the producer side and the other on the consumer side
PDS subsidises food for the poor
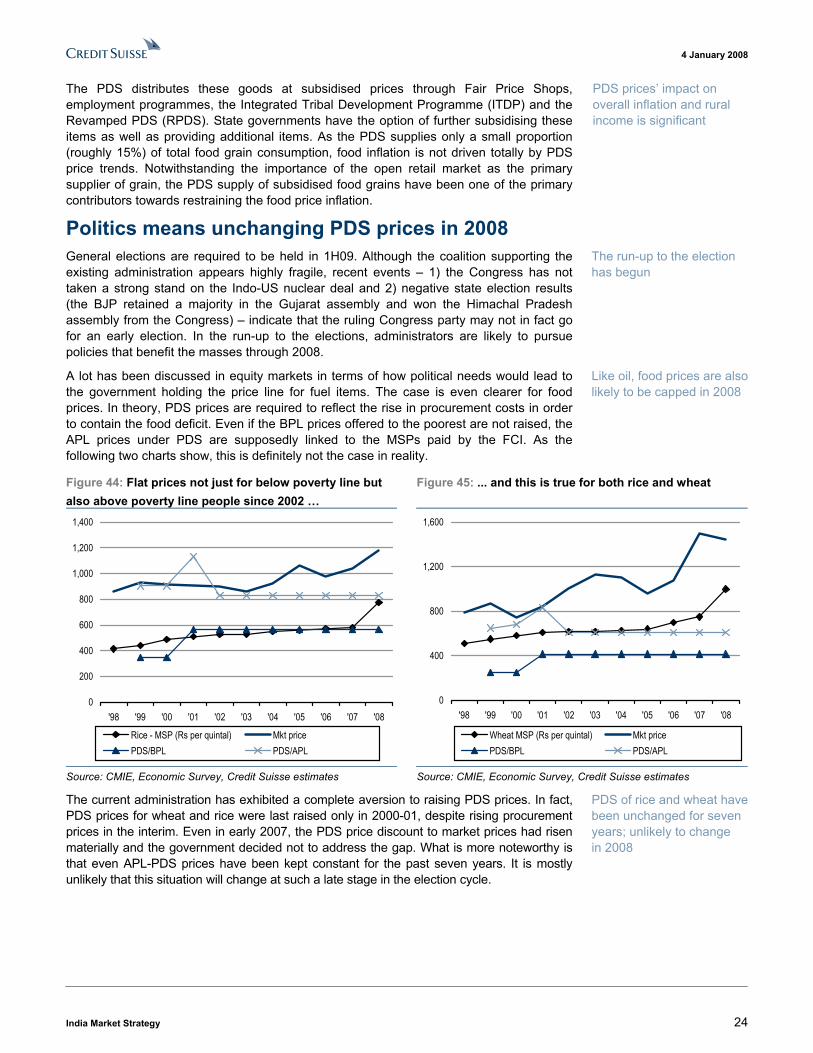
4 January 2008
India Market Strategy 24
The PDS distributes these goods at subsidised prices through Fair Price Shops, employment programmes, the Integrated Tribal Development Programme (ITDP) and the Revamped PDS (RPDS). State governments have the option of further subsidising these items as well as providing additional items. As the PDS supplies only a small proportion (roughly 15%) of total food grain consumption, food inflation is not driven totally by PDS price trends. Notwithstanding the importance of the open retail market as the primary supplier of grain, the PDS supply of subsidised food grains have been one of the primary contributors towards restraining the food price inflation.
Politics means unchanging PDS prices in 2008
General elections are required to be held in 1H09. Although the coalition supporting the existing administration appears highly fragile, recent events � 1) the Congress has not taken a strong stand on the Indo-US nuclear deal and 2) negative state election results (the BJP retained a majority in the Gujarat assembly and won the Himachal Pradesh assembly from the Congress) � indicate that the ruling Congress party may not in fact go for an early election. In the run-up to the elections, administrators are likely to pursue policies that benefit the masses through 2008.
A lot has been discussed in equity markets in terms of how political needs would lead to the government holding the price line for fuel items. The case is even clearer for food prices. In theory, PDS prices are required to reflect the rise in procurement costs in order to contain the food deficit. Even if the BPL prices offered to the poorest are not raised, the APL prices under PDS are supposedly linked to the MSPs paid by the FCI. As the following two charts show, this is definitely not the case in reality.
Figure 44: Flat prices not just for below poverty line but also above poverty line people since 2002 �
Figure 45: ... and this is true for both rice and wheat
0
200
400
600
800
1,000
1,200
1,400
'98 '99 '00 '01 '02 '03 '04 '05 '06 '07 '08
Rice - MSP (Rs per quintal) Mkt pricePDS/BPL PDS/APL
0
400
800
1,200
1,600
'98 '99 '00 '01 '02 '03 '04 '05 '06 '07 '08
Wheat MSP (Rs per quintal) Mkt pricePDS/BPL PDS/APL
Source: CMIE, Economic Survey, Credit Suisse estimates Source: CMIE, Economic Survey, Credit Suisse estimates
The current administration has exhibited a complete aversion to raising PDS prices. In fact, PDS prices for wheat and rice were last raised only in 2000-01, despite rising procurement prices in the interim. Even in early 2007, the PDS price discount to market prices had risen materially and the government decided not to address the gap. What is more noteworthy is that even APL-PDS prices have been kept constant for the past seven years. It is mostly unlikely that this situation will change at such a late stage in the election cycle.
PDS prices� impact on overall inflation and rural income is significant
The run-up to the election has begun
Like oil, food prices are also likely to be capped in 2008
PDS of rice and wheat have been unchanged for seven years; unlikely to change in 2008
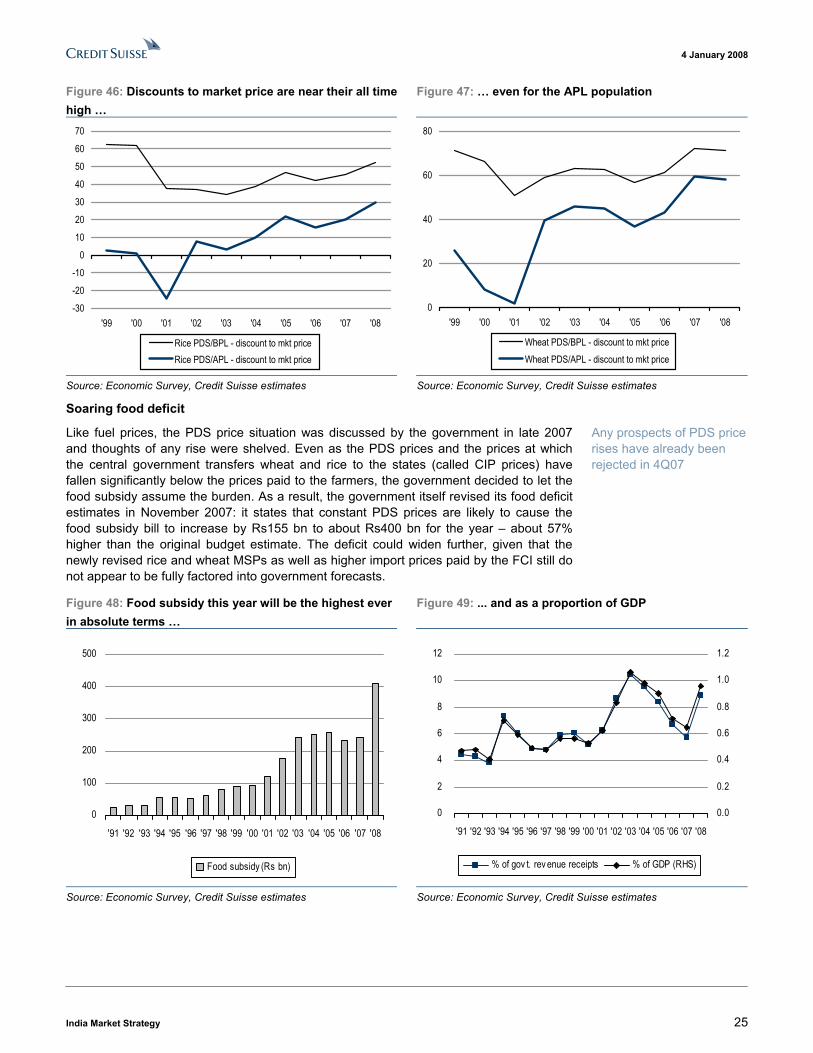
4 January 2008
India Market Strategy 25
Figure 46: Discounts to market price are near their all timehigh �
Figure 47: � even for the APL population
-30
-20
-10
0
10
20
30
40
50
60
70
'99 '00 '01 '02 '03 '04 '05 '06 '07 '08
Rice PDS/BPL - discount to mkt priceRice PDS/APL - discount to mkt price
0
20
40
60
80
'99 '00 '01 '02 '03 '04 '05 '06 '07 '08
Wheat PDS/BPL - discount to mkt priceWheat PDS/APL - discount to mkt price
Source: Economic Survey, Credit Suisse estimates Source: Economic Survey, Credit Suisse estimates
Soaring food deficit
Like fuel prices, the PDS price situation was discussed by the government in late 2007 and thoughts of any rise were shelved. Even as the PDS prices and the prices at which the central government transfers wheat and rice to the states (called CIP prices) have fallen significantly below the prices paid to the farmers, the government decided to let the food subsidy assume the burden. As a result, the government itself revised its food deficit estimates in November 2007: it states that constant PDS prices are likely to cause the food subsidy bill to increase by Rs155 bn to about Rs400 bn for the year � about 57% higher than the original budget estimate. The deficit could widen further, given that the newly revised rice and wheat MSPs as well as higher import prices paid by the FCI still do not appear to be fully factored into government forecasts.
Figure 48: Food subsidy this year will be the highest ever in absolute terms �
Figure 49: ... and as a proportion of GDP
0
100
200
300
400
500
'91 '92 '93 '94 '95 '96 '97 '98 '99 '00 '01 '02 '03 '04 '05 '06 '07 '08
Food subsidy (Rs bn)
0
2
4
6
8
10
12
'91 '92 '93 '94 '95 '96 '97 '98 '99 '00 '01 '02 '03 '04 '05 '06 '07 '08
0.0
0.2
0.4
0.6
0.8
1.0
1.2
% of gov t. rev enue receipts % of GDP (RHS)
Source: Economic Survey, Credit Suisse estimates Source: Economic Survey, Credit Suisse estimates
Any prospects of PDS price rises have already been rejected in 4Q07
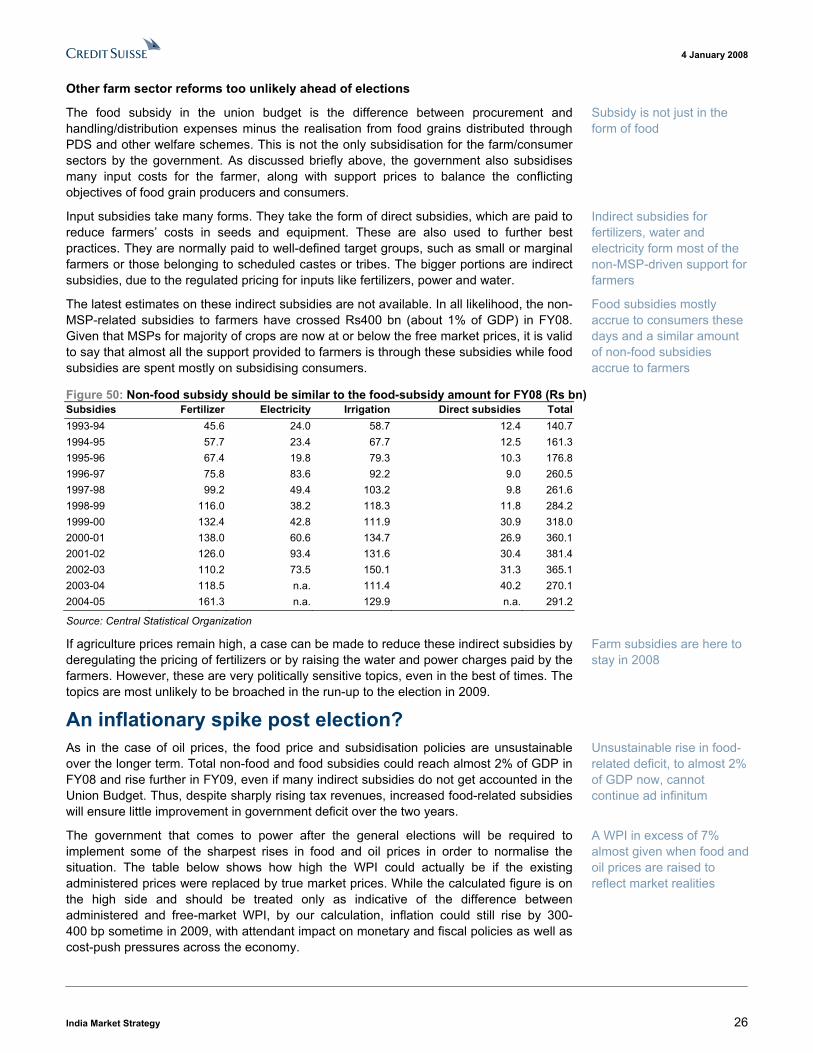
4 January 2008
India Market Strategy 26
Other farm sector reforms too unlikely ahead of elections
The food subsidy in the union budget is the difference between procurement and handling/distribution expenses minus the realisation from food grains distributed through PDS and other welfare schemes. This is not the only subsidisation for the farm/consumer sectors by the government. As discussed briefly above, the government also subsidises many input costs for the farmer, along with support prices to balance the conflicting objectives of food grain producers and consumers.
Input subsidies take many forms. They take the form of direct subsidies, which are paid to reduce farmers� costs in seeds and equipment. These are also used to further best practices. They are normally paid to well-defined target groups, such as small or marginal farmers or those belonging to scheduled castes or tribes. The bigger portions are indirect subsidies, due to the regulated pricing for inputs like fertilizers, power and water.
The latest estimates on these indirect subsidies are not available. In all likelihood, the non-MSP-related subsidies to farmers have crossed Rs400 bn (about 1% of GDP) in FY08. Given that MSPs for majority of crops are now at or below the free market prices, it is valid to say that almost all the support provided to farmers is through these subsidies while food subsidies are spent mostly on subsidising consumers.
Figure 50: Non-food subsidy should be similar to the food-subsidy amount for FY08 (Rs bn) Subsidies Fertilizer Electricity Irrigation Direct subsidies Total 1993-94 45.6 24.0 58.7 12.4 140.7 1994-95 57.7 23.4 67.7 12.5 161.3 1995-96 67.4 19.8 79.3 10.3 176.8 1996-97 75.8 83.6 92.2 9.0 260.5 1997-98 99.2 49.4 103.2 9.8 261.6 1998-99 116.0 38.2 118.3 11.8 284.2 1999-00 132.4 42.8 111.9 30.9 318.0 2000-01 138.0 60.6 134.7 26.9 360.1 2001-02 126.0 93.4 131.6 30.4 381.4 2002-03 110.2 73.5 150.1 31.3 365.1 2003-04 118.5 n.a. 111.4 40.2 270.1 2004-05 161.3 n.a. 129.9 n.a. 291.2
Source: Central Statistical Organization
If agriculture prices remain high, a case can be made to reduce these indirect subsidies by deregulating the pricing of fertilizers or by raising the water and power charges paid by the farmers. However, these are very politically sensitive topics, even in the best of times. The topics are most unlikely to be broached in the run-up to the election in 2009.
An inflationary spike post election? As in the case of oil prices, the food price and subsidisation policies are unsustainable over the longer term. Total non-food and food subsidies could reach almost 2% of GDP in FY08 and rise further in FY09, even if many indirect subsidies do not get accounted in the Union Budget. Thus, despite sharply rising tax revenues, increased food-related subsidies will ensure little improvement in government deficit over the two years.
The government that comes to power after the general elections will be required to implement some of the sharpest rises in food and oil prices in order to normalise the situation. The table below shows how high the WPI could actually be if the existing administered prices were replaced by true market prices. While the calculated figure is on the high side and should be treated only as indicative of the difference between administered and free-market WPI, by our calculation, inflation could still rise by 300-400 bp sometime in 2009, with attendant impact on monetary and fiscal policies as well as cost-push pressures across the economy.
Subsidy is not just in the form of food
Indirect subsidies for fertilizers, water and electricity form most of the non-MSP-driven support for farmers
Food subsidies mostly accrue to consumers these days and a similar amount of non-food subsidies accrue to farmers
Farm subsidies are here to stay in 2008
Unsustainable rise in food-related deficit, to almost 2% of GDP now, cannot continue ad infinitum
A WPI in excess of 7% almost given when food and oil prices are raised to reflect market realities
4 January 2008
India Market Strategy 27
Figure 51: Calculation of WPI adjusting administered items to reflect true market prices Parameter ValueActual WPI (YoY) 3.01WPI ex administered items at present (YoY) 4.38Difference with actual WPI at present (bp) 137WPI if administered prices were to be adjusted for the last year free market price rises (YoY) 9.70Difference with actual WPI (bps) 669
Note: Available global free-market prices of rice, wheat, mineral fuels and coal have been changed to reflect the rupee-dollar movement adjusted free-market rise in prices; Source: Credit Suisse estimates
Conclusion: best of both the worlds for rural income If food prices were rising both at the procurement and consumer levels, investment conclusions for India�s macro economy, monetary policies and rural income would all have been mixed at best, even if not outright negative. Politics assures that this will not be the case, at least in most of 2008. There is tremendous upside from rising procurement prices and stagnant consumer prices for rural India, as well as for the health of near-term economic indicators. The cost is clearly in deteriorating government finances over the near term and increasing bottled-up price pressure on the other side of the election, when the new government comes to power and takes a critical look at the state of the finances.
There is a substantial cost visible in government deficit, though they may not rise from last year due to increased tax revenue. Given that the government�s deficits were at decade-low levels to start with in FY07, we do not think markets are likely to worry much about the impact on deficit in the current year and even in FY09 caused by food-related items. A forward-looking market might correct in anticipation of policy implications post-election, as we draw nearer to the polls and the formation of the next government, but we expect the issue to remain below the surface at least until then. The situation is akin to the rising deficit level in the case of fuel.
Rising rural income, as we explained at the end of the first section, is still a risky theme. It continuously depends on the weather remaining good. The theme is likely to lose some of the lustre the medium term, when consumer prices start reflecting the already observed trends in procurement prices. Most importantly, unlike our favourite infrastructure development theme, this theme is slow to develop, less visible and has fewer stock-related conclusions. All that said, this is a theme worth investing in at the right valuation, which we think exists in some of the related sectors and stocks.
Short-term gains on all investment-related fronts from stagnant consumer food prices and rising procurement prices
The government deficit is not likely to concern markets until after the polls
A risky and relatively less long-term theme, but worth investing at right valuations
4 January 2008
India Market Strategy 28
Rural income ideas for equity investors Equity investors cannot really benefit directly from wheat or rice MSP rises. However, there are many investment themes from developments, such as:
■ Rural income growth and an increase in rural consumption. Potential beneficiaries are companies, such as Hero Honda, Hindustan Unilever, ITC, SBI, PNB, and mobile operators. We recommend an overweight position in all of these, except telecoms, where we remain underweight, due to other reasons.
■ Crop switching and a potential inflexion point for sugar prices in a few quarters.
■ An increase in margins for companies dealing in food segments, with fewer controls such as, basmati and edible oil.
■ An increase in farm sector investment and the impact it will have on businesses in seeding, pesticides, tractors and contract farming etc.
■ In the long term, if farm incomes rise rapidly, there could be: 1) deregulation of fertiliser companies� profitability, 2) a reduction in subsidies on power and rural lending, and 3) further reforms for private sector participation in procurement, contract farming, seeding and even directly in organised farming. The beneficiaries could be fertiliser and state power companies, amongst others, but we do not think the stock market will have reason to factor in the speculative gains from any of these potential reforms in 2008.
Apart from short comments on our top picks from our coverage list, we also provide introductory notes on six other non-rated companies that are linked to the sector.
1) Producers of low-end products C K Prahalad said in 2000 in an address to India�s CEOs: �the future lies with those companies that see the poor as their customers�. This statement may not have held true over the last four years, when India�s growth was led first by urban consumption and then by infrastructure. As we explain in this report, this could change with rising rural incomes.
Over 800 mn people live in rural India and about two-thirds of them depend on agriculture for income. The group is vast, but most of it is not middle-class or even emerging middle class by conventional standards. The farm sector�s per-capita income is likely to be below US$350 p.a. in the current year. The median annual expenditure for the group is around US$160-170 (based on adjusted national sample survey data in 2004). The factors discussed in the first two sections above could lead to a material rise in rural disposable income, but from meagre levels. Even our best-case assumptions on prices could lead to this group�s income rising by less than US$50 in per-capita terms for 2008. As a result, their higher spending power is likely to benefit the sub-sectors at the low end of the essential consumption products basket.
Rural India spends comparatively more on food, tobacco, clothing and health as a proportion of their income compared to urban Indians. Urban India spends materially more on rent, transport and non-essential items as well as on luxury goods and services.
Five ways for equity market investors to consider the impact of rising MSPs
HUL, ITC, Hero Honda and SBI are among the likely major beneficiaries
Rising farm income could lead to many long-term reforms, but this is not a theme for 2008
Rural income growth means rising income levels for the population with less than US$350 p.a. per capita
Rural India is spending a higher proportion on food, tobacco, clothing and health
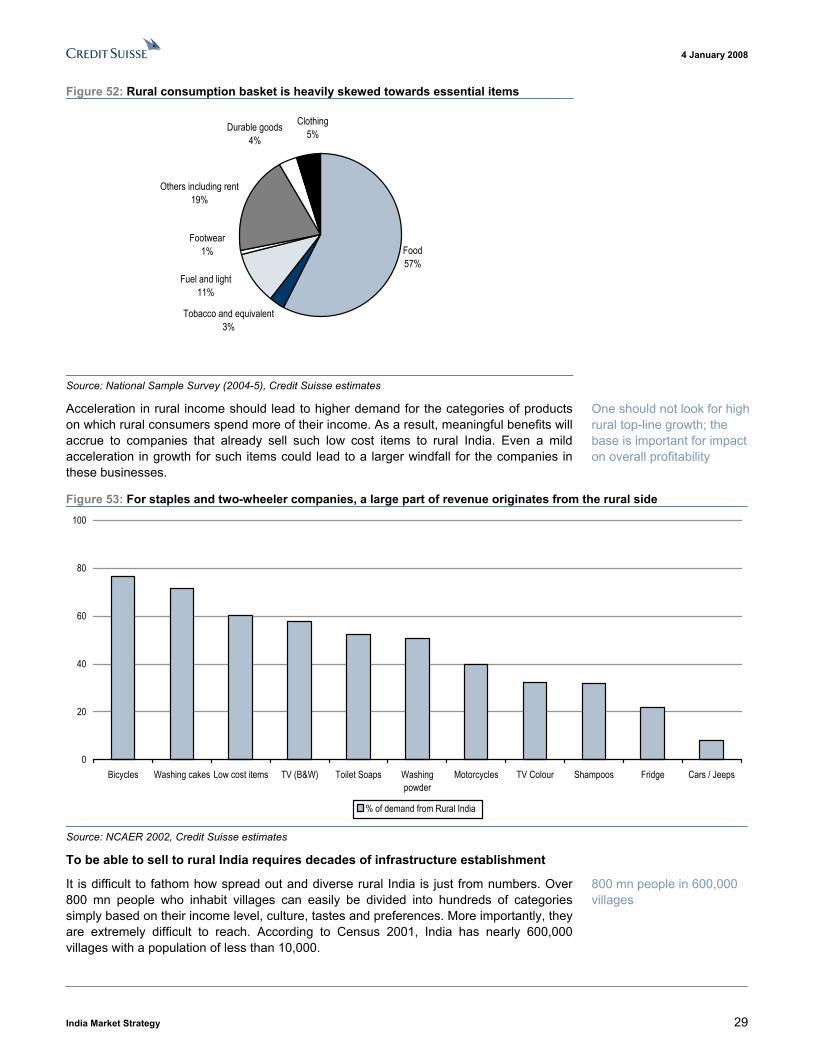
4 January 2008
India Market Strategy 29
Figure 52: Rural consumption basket is heavily skewed towards essential items
Food57%
Fuel and light11%
Tobacco and equivalent3%
Footwear1%
Others including rent19%
Durable goods4%
Clothing5%
Source: National Sample Survey (2004-5), Credit Suisse estimates
Acceleration in rural income should lead to higher demand for the categories of products on which rural consumers spend more of their income. As a result, meaningful benefits will accrue to companies that already sell such low cost items to rural India. Even a mild acceleration in growth for such items could lead to a larger windfall for the companies in these businesses.
Figure 53: For staples and two-wheeler companies, a large part of revenue originates from the rural side
0
20
40
60
80
100
Bicycles Washing cakes Low cost items TV (B&W) Toilet Soaps Washingpowder
Motorcycles TV Colour Shampoos Fridge Cars / Jeeps
% of demand from Rural India
Source: NCAER 2002, Credit Suisse estimates
To be able to sell to rural India requires decades of infrastructure establishment
It is difficult to fathom how spread out and diverse rural India is just from numbers. Over 800 mn people who inhabit villages can easily be divided into hundreds of categories simply based on their income level, culture, tastes and preferences. More importantly, they are extremely difficult to reach. According to Census 2001, India has nearly 600,000 villages with a population of less than 10,000.
One should not look for high rural top-line growth; the base is important for impact on overall profitability
800 mn people in 600,000 villages
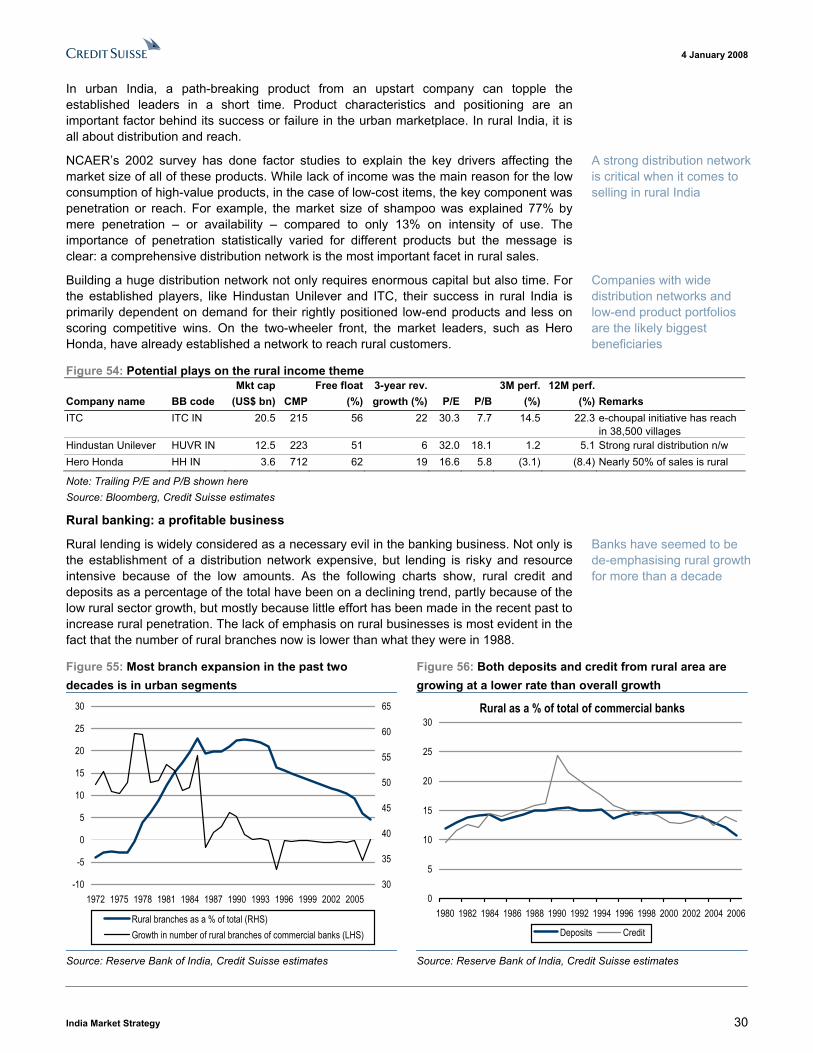
4 January 2008
India Market Strategy 30
In urban India, a path-breaking product from an upstart company can topple the established leaders in a short time. Product characteristics and positioning are an important factor behind its success or failure in the urban marketplace. In rural India, it is all about distribution and reach.
NCAER�s 2002 survey has done factor studies to explain the key drivers affecting the market size of all of these products. While lack of income was the main reason for the low consumption of high-value products, in the case of low-cost items, the key component was penetration or reach. For example, the market size of shampoo was explained 77% by mere penetration � or availability � compared to only 13% on intensity of use. The importance of penetration statistically varied for different products but the message is clear: a comprehensive distribution network is the most important facet in rural sales.
Building a huge distribution network not only requires enormous capital but also time. For the established players, like Hindustan Unilever and ITC, their success in rural India is primarily dependent on demand for their rightly positioned low-end products and less on scoring competitive wins. On the two-wheeler front, the market leaders, such as Hero Honda, have already established a network to reach rural customers.
Figure 54: Potential plays on the rural income theme Mkt cap Free float 3-year rev. 3M perf. 12M perf. Company name BB code (US$ bn) CMP (%) growth (%) P/E P/B (%) (%) Remarks ITC ITC IN 20.5 215 56 22 30.3 7.7 14.5 22.3 e-choupal initiative has reach
in 38,500 villages Hindustan Unilever HUVR IN 12.5 223 51 6 32.0 18.1 1.2 5.1 Strong rural distribution n/w Hero Honda HH IN 3.6 712 62 19 16.6 5.8 (3.1) (8.4) Nearly 50% of sales is rural
Note: Trailing P/E and P/B shown here Source: Bloomberg, Credit Suisse estimates
Rural banking: a profitable business
Rural lending is widely considered as a necessary evil in the banking business. Not only is the establishment of a distribution network expensive, but lending is risky and resource intensive because of the low amounts. As the following charts show, rural credit and deposits as a percentage of the total have been on a declining trend, partly because of the low rural sector growth, but mostly because little effort has been made in the recent past to increase rural penetration. The lack of emphasis on rural businesses is most evident in the fact that the number of rural branches now is lower than what they were in 1988.
Figure 55: Most branch expansion in the past two decades is in urban segments
Figure 56: Both deposits and credit from rural area are growing at a lower rate than overall growth
-10
-5
0
5
10
15
20
25
30
1972 1975 1978 1981 1984 1987 1990 1993 1996 1999 2002 200530
35
40
45
50
55
60
65
Rural branches as a % of total (RHS)Growth in number of rural branches of commercial banks (LHS)
Rural as a % of total of commercial banks
0
5
10
15
20
25
30
1980 1982 1984 1986 1988 1990 1992 1994 1996 1998 2000 2002 2004 2006
Deposits Credit
Source: Reserve Bank of India, Credit Suisse estimates Source: Reserve Bank of India, Credit Suisse estimates
A strong distribution network is critical when it comes to selling in rural India
Companies with wide distribution networks and low-end product portfolios are the likely biggest beneficiaries
Banks have seemed to be de-emphasising rural growth for more than a decade
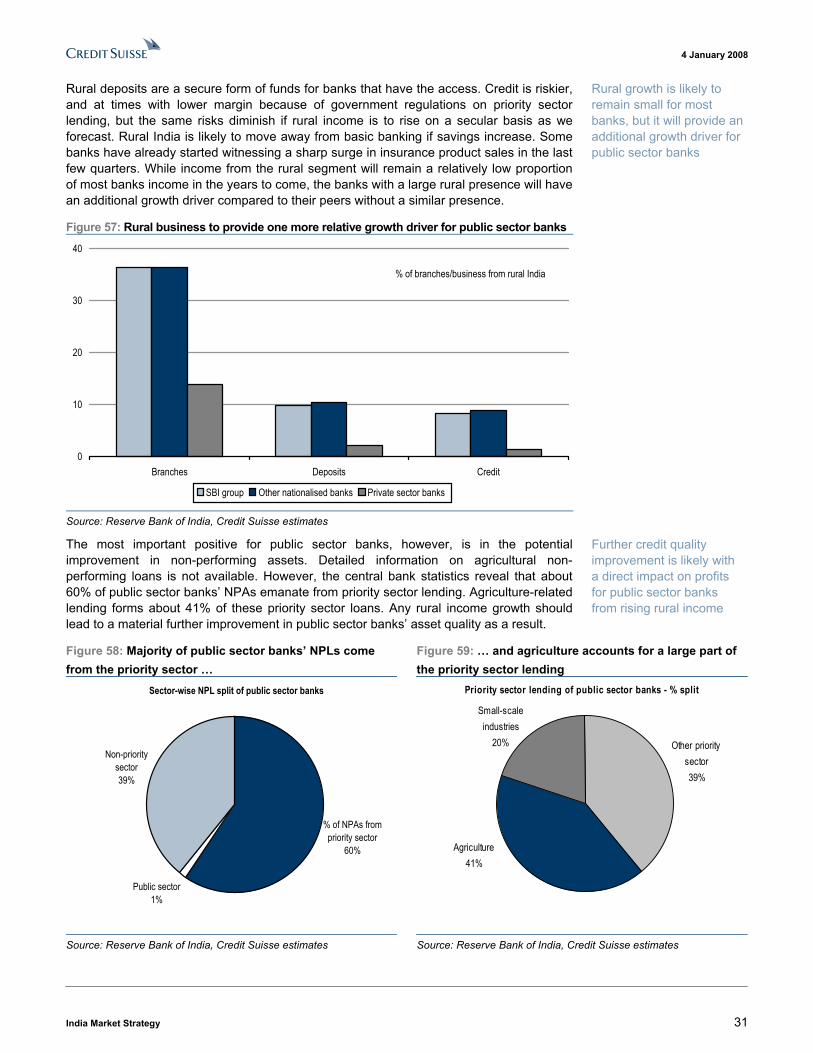
4 January 2008
India Market Strategy 31
Rural deposits are a secure form of funds for banks that have the access. Credit is riskier, and at times with lower margin because of government regulations on priority sector lending, but the same risks diminish if rural income is to rise on a secular basis as we forecast. Rural India is likely to move away from basic banking if savings increase. Some banks have already started witnessing a sharp surge in insurance product sales in the last few quarters. While income from the rural segment will remain a relatively low proportion of most banks income in the years to come, the banks with a large rural presence will have an additional growth driver compared to their peers without a similar presence.
Figure 57: Rural business to provide one more relative growth driver for public sector banks
0
10
20
30
40
Branches Deposits Credit
SBI group Other nationalised banks Private sector banks
% of branches/business from rural India
Source: Reserve Bank of India, Credit Suisse estimates
The most important positive for public sector banks, however, is in the potential improvement in non-performing assets. Detailed information on agricultural non-performing loans is not available. However, the central bank statistics reveal that about 60% of public sector banks� NPAs emanate from priority sector lending. Agriculture-related lending forms about 41% of these priority sector loans. Any rural income growth should lead to a material further improvement in public sector banks� asset quality as a result.
Figure 58: Majority of public sector banks� NPLs come from the priority sector �
Figure 59: � and agriculture accounts for a large part of the priority sector lending
Sector-wise NPL split of public sector banks
% of NPAs from priority sector
60%
Public sector1%
Non-priority sector39%
Other priority sector39%
Small-scale industries
20%
Agriculture41%
Priority sector lending of public sector banks - % split
Source: Reserve Bank of India, Credit Suisse estimates Source: Reserve Bank of India, Credit Suisse estimates
Rural growth is likely to remain small for most banks, but it will provide an additional growth driver for public sector banks
Further credit quality improvement is likely with a direct impact on profits for public sector banks from rising rural income
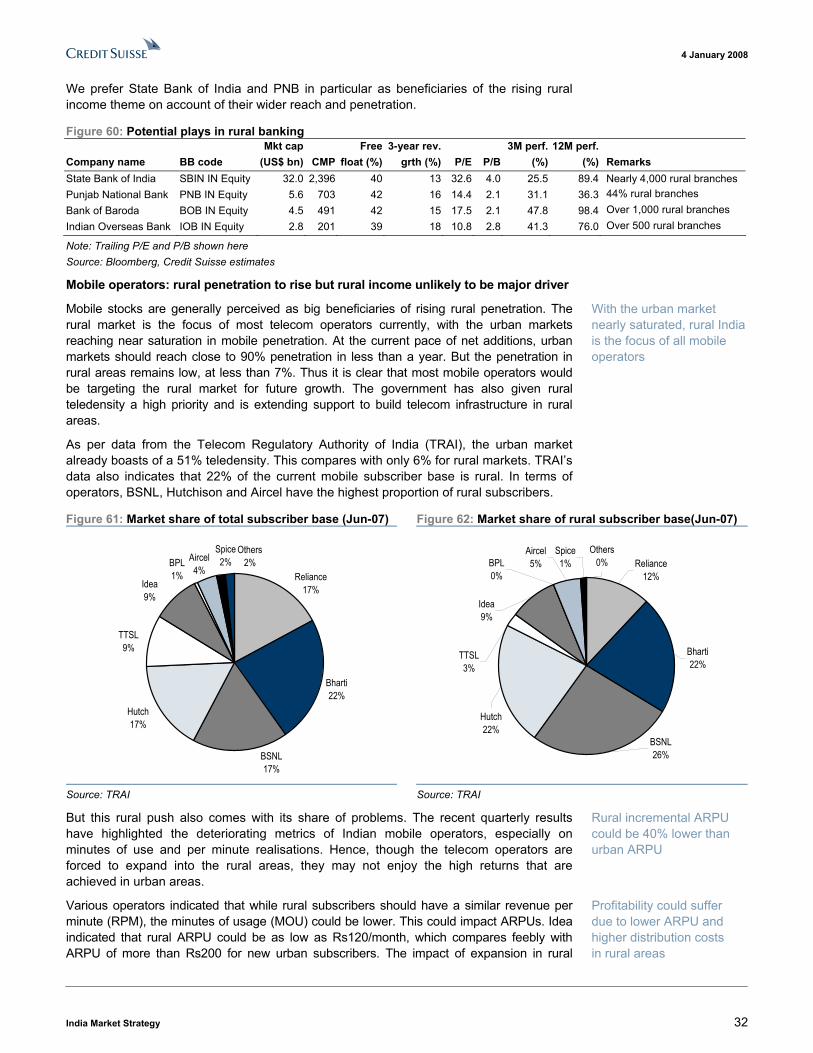
4 January 2008
India Market Strategy 32
We prefer State Bank of India and PNB in particular as beneficiaries of the rising rural income theme on account of their wider reach and penetration.
Figure 60: Potential plays in rural banking Mkt cap Free 3-year rev. 3M perf. 12M perf. Company name BB code (US$ bn) CMP float (%) grth (%) P/E P/B (%) (%) Remarks State Bank of India SBIN IN Equity 32.0 2,396 40 13 32.6 4.0 25.5 89.4 Nearly 4,000 rural branches Punjab National Bank PNB IN Equity 5.6 703 42 16 14.4 2.1 31.1 36.3 44% rural branches Bank of Baroda BOB IN Equity 4.5 491 42 15 17.5 2.1 47.8 98.4 Over 1,000 rural branches Indian Overseas Bank IOB IN Equity 2.8 201 39 18 10.8 2.8 41.3 76.0 Over 500 rural branches
Note: Trailing P/E and P/B shown here Source: Bloomberg, Credit Suisse estimates
Mobile operators: rural penetration to rise but rural income unlikely to be major driver
Mobile stocks are generally perceived as big beneficiaries of rising rural penetration. The rural market is the focus of most telecom operators currently, with the urban markets reaching near saturation in mobile penetration. At the current pace of net additions, urban markets should reach close to 90% penetration in less than a year. But the penetration in rural areas remains low, at less than 7%. Thus it is clear that most mobile operators would be targeting the rural market for future growth. The government has also given rural teledensity a high priority and is extending support to build telecom infrastructure in rural areas.
As per data from the Telecom Regulatory Authority of India (TRAI), the urban market already boasts of a 51% teledensity. This compares with only 6% for rural markets. TRAI�s data also indicates that 22% of the current mobile subscriber base is rural. In terms of operators, BSNL, Hutchison and Aircel have the highest proportion of rural subscribers.
Figure 61: Market share of total subscriber base (Jun-07) Figure 62: Market share of rural subscriber base(Jun-07)
Reliance17%
Bharti22%
BSNL17%
Hutch17%
TTSL9%
Idea9%
Others2%BPL
1%
Aircel4%
Spice2%
Spice1%
Bharti22%
BSNL26%
Hutch22%
TTSL3%
Idea9%
Reliance12%
Aircel5%BPL
0%
Others0%
Source: TRAI Source: TRAI
But this rural push also comes with its share of problems. The recent quarterly results have highlighted the deteriorating metrics of Indian mobile operators, especially on minutes of use and per minute realisations. Hence, though the telecom operators are forced to expand into the rural areas, they may not enjoy the high returns that are achieved in urban areas.
Various operators indicated that while rural subscribers should have a similar revenue per minute (RPM), the minutes of usage (MOU) could be lower. This could impact ARPUs. Idea indicated that rural ARPU could be as low as Rs120/month, which compares feebly with ARPU of more than Rs200 for new urban subscribers. The impact of expansion in rural
With the urban market nearly saturated, rural India is the focus of all mobile operators
Rural incremental ARPU could be 40% lower than urban ARPU
Profitability could suffer due to lower ARPU and higher distribution costs in rural areas
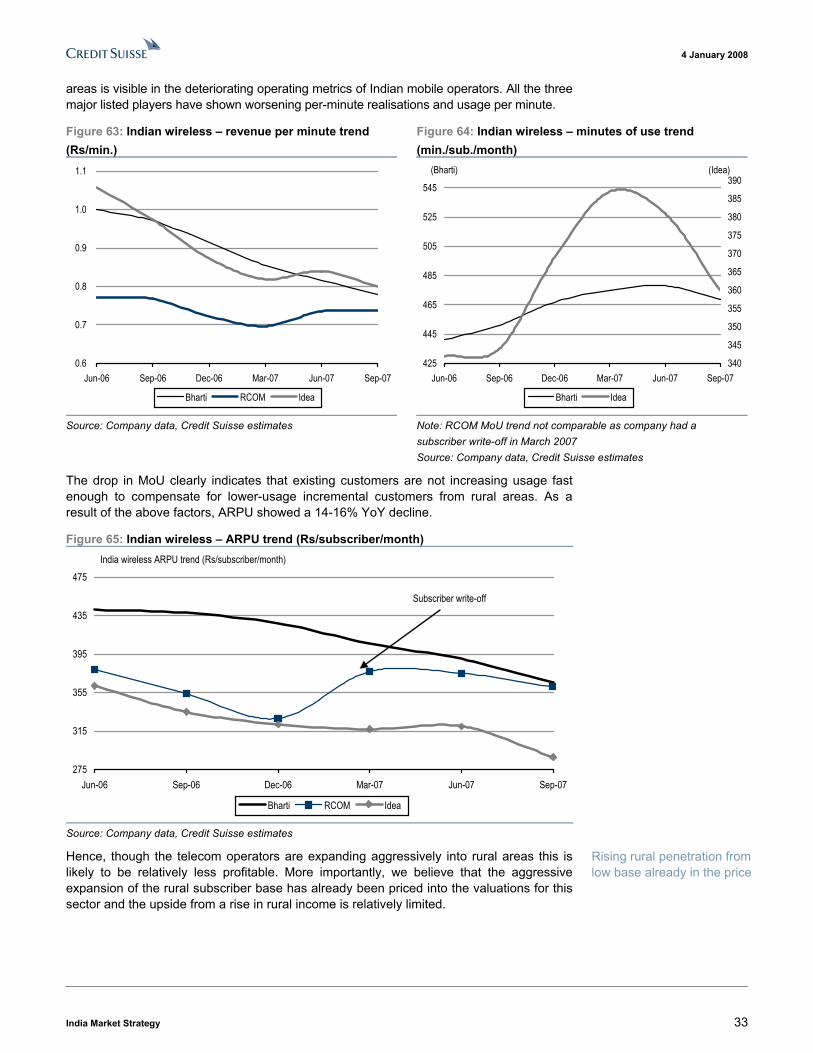
4 January 2008
India Market Strategy 33
areas is visible in the deteriorating operating metrics of Indian mobile operators. All the three major listed players have shown worsening per-minute realisations and usage per minute.
Figure 63: Indian wireless � revenue per minute trend (Rs/min.)
Figure 64: Indian wireless � minutes of use trend (min./sub./month)
0.6
0.7
0.8
0.9
1.0
1.1
Jun-06 Sep-06 Dec-06 Mar-07 Jun-07 Sep-07
Bharti RCOM Idea
425
445
465
485
505
525
545
Jun-06 Sep-06 Dec-06 Mar-07 Jun-07 Sep-07340
345
350
355
360
365
370
375
380
385
390
Bharti Idea
(Idea)(Bharti)
Source: Company data, Credit Suisse estimates Note: RCOM MoU trend not comparable as company had a subscriber write-off in March 2007 Source: Company data, Credit Suisse estimates
The drop in MoU clearly indicates that existing customers are not increasing usage fast enough to compensate for lower-usage incremental customers from rural areas. As a result of the above factors, ARPU showed a 14-16% YoY decline.
Figure 65: Indian wireless � ARPU trend (Rs/subscriber/month)
275
315
355
395
435
475
Jun-06 Sep-06 Dec-06 Mar-07 Jun-07 Sep-07
Bharti RCOM Idea
Subscriber write-off
India wireless ARPU trend (Rs/subscriber/month)
Source: Company data, Credit Suisse estimates
Hence, though the telecom operators are expanding aggressively into rural areas this is likely to be relatively less profitable. More importantly, we believe that the aggressive expansion of the rural subscriber base has already been priced into the valuations for this sector and the upside from a rise in rural income is relatively limited.
Rising rural penetration from low base already in the price
4 January 2008
India Market Strategy 34
2) Crop switching and long-term for sugar As we indicated before, the rise in MSPs of wheat and rice will have implications on cropping patterns, with more and more farmers switching towards these, given the better economics of cultivation. The latest economic survey talks of a potential 15.7% drop in oilseed production this year, driven by a sharp shift towards wheat. There are also reports of shifts towards basmati rice from non-basmati varieties as basmati prices have nearly doubled over the past 24 months.
However, the commodity that is likely to be the most impacted in the future is sugar cane � sugar prices have dropped by more than 40% over the past 18 months, due to a global as well as local oversupply situation. As a result, sugar cane farmers have suffered not just relatively compared to the high growth enjoyed by the other farmers who produced wheat or rice, but even in absolute terms through growing arrears in payments by the sugar producers to the cultivators. This should encourage a significant move towards wheat and rice in the future. We believe that a rise in the sugar price, on account of crop switching, can have major investment implications and merits a more in-depth understanding.
Global oversupply + government controls = a lose-lose situation for all
In the midst of rising food prices across geographies and across commodities, the glaring exception seems to be sugar. Sugar prices globally are down almost 40% since the beginning of last year. In India, retail prices are now hovering around the Rs13 per kg markdown from Rs18 in the first half of last year. The reason for the crash in sugar prices is well documented. Both Brazil and India � two of the world�s largest producers � are sitting on massive surpluses. In Brazil in 1H06 ethanol prices soared, prompting increased sugar cane cultivation in anticipation. However, the dual blow of softening ethanol prices as well as a reduction in the mandatory blending level from 25 to 20% resulted in a diversion of a substantial portion of this sugar cane towards making sugar (in Brazil, unlike in India, ethanol is made directly from sugar cane and not from molasses). This led to a huge oversupply of sugar globally, as Brazil is also the biggest exporter of sugar in the world.
In India too, the previous high global prices, prompted sugar-mills to buy cane from farmers at premiums to state-advised prices. This in turn led to a diversion of cane from artisan sugars like gur towards sugar where the farmer got better returns. Thus, while areas under cultivation and cane production increased at around 20%, sugar production increased by much more. At this point global and domestic sugar prices were still on an upwards trend and the Indian government, fearing an adverse effect on inflation, decided to ban exports. This worsened the supply-glut situation which was already in the making and sugar prices have been on a steady decline since.
Sugar � the three year cycle, when will it reverse?
However while retail prices of sugar have been declining, cane prices have moved in the opposite direction. Counter-intuitive as it may seem, this is explained by the fact that the sugar industry historically has been heavily controlled in India. Not only is there a centre determined MSP for the cane, as in the case of most agricultural commodities, but in the case of sugar there are also state-advised prices which can be substantially different from the MSP fixed by the central government. For instance while the centre has determined an MSP of Rs81.8 per quintal for sugar cane, the Uttar Pradesh (UP) state government, which already had a substantially higher SAP (state advised prices) of 110 per quintal, hiked this to Rs125 per quintal early this year (FY08). Since 2007 was the state election year in UP, the people in power have changed but the new government has shown little inclination to bring down the SAP. The matter is now in court and mills have been asked to start crushing at Rs110 per quintal in the interim.
Government controls have not just hurt the sugar mills � farmers too have been hurt. The troika of low market prices, higher SAP and overcapacity has led to losses for the companies, and in turn into a build-up of huge payment arrears to farmers.
The rise in MSPs of wheat and rice could see a significant shift away from other crops this year, leading to price rises in these segments
Global sugar stocks have risen by 20-25% over the past two years
In India sugar production has increased by 50% in the past two years
The Uttar Pradesh government has recommended a SAP of Rs125 per quintal, as opposed to a centrally decided MSP of Rs81.8 per quintal
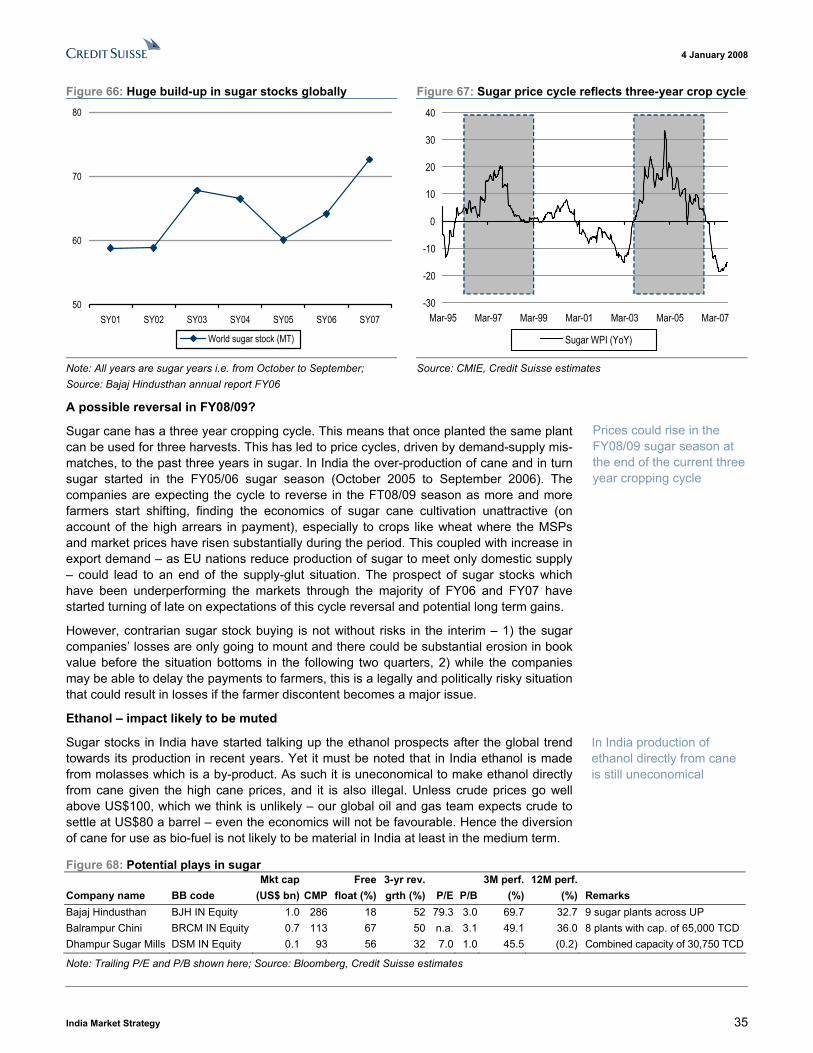
4 January 2008
India Market Strategy 35
Figure 66: Huge build-up in sugar stocks globally Figure 67: Sugar price cycle reflects three-year crop cycle
50
60
70
80
SY01 SY02 SY03 SY04 SY05 SY06 SY07
World sugar stock (MT)
-30
-20
-10
0
10
20
30
40
Mar-95 Mar-97 Mar-99 Mar-01 Mar-03 Mar-05 Mar-07
Sugar WPI (YoY)
Note: All years are sugar years i.e. from October to September; Source: Bajaj Hindusthan annual report FY06
Source: CMIE, Credit Suisse estimates
A possible reversal in FY08/09?
Sugar cane has a three year cropping cycle. This means that once planted the same plant can be used for three harvests. This has led to price cycles, driven by demand-supply mis-matches, to the past three years in sugar. In India the over-production of cane and in turn sugar started in the FY05/06 sugar season (October 2005 to September 2006). The companies are expecting the cycle to reverse in the FT08/09 season as more and more farmers start shifting, finding the economics of sugar cane cultivation unattractive (on account of the high arrears in payment), especially to crops like wheat where the MSPs and market prices have risen substantially during the period. This coupled with increase in export demand � as EU nations reduce production of sugar to meet only domestic supply � could lead to an end of the supply-glut situation. The prospect of sugar stocks which have been underperforming the markets through the majority of FY06 and FY07 have started turning of late on expectations of this cycle reversal and potential long term gains.
However, contrarian sugar stock buying is not without risks in the interim � 1) the sugar companies� losses are only going to mount and there could be substantial erosion in book value before the situation bottoms in the following two quarters, 2) while the companies may be able to delay the payments to farmers, this is a legally and politically risky situation that could result in losses if the farmer discontent becomes a major issue.
Ethanol � impact likely to be muted
Sugar stocks in India have started talking up the ethanol prospects after the global trend towards its production in recent years. Yet it must be noted that in India ethanol is made from molasses which is a by-product. As such it is uneconomical to make ethanol directly from cane given the high cane prices, and it is also illegal. Unless crude prices go well above US$100, which we think is unlikely � our global oil and gas team expects crude to settle at US$80 a barrel � even the economics will not be favourable. Hence the diversion of cane for use as bio-fuel is not likely to be material in India at least in the medium term.
Figure 68: Potential plays in sugar Mkt cap Free 3-yr rev. 3M perf. 12M perf. Company name BB code (US$ bn) CMP float (%) grth (%) P/E P/B (%) (%) Remarks Bajaj Hindusthan BJH IN Equity 1.0 286 18 52 79.3 3.0 69.7 32.7 9 sugar plants across UP Balrampur Chini BRCM IN Equity 0.7 113 67 50 n.a. 3.1 49.1 36.0 8 plants with cap. of 65,000 TCD Dhampur Sugar Mills DSM IN Equity 0.1 93 56 32 7.0 1.0 45.5 (0.2) Combined capacity of 30,750 TCD
Note: Trailing P/E and P/B shown here; Source: Bloomberg, Credit Suisse estimates
Prices could rise in the FY08/09 sugar season at the end of the current three year cropping cycle
In India production of ethanol directly from cane is still uneconomical
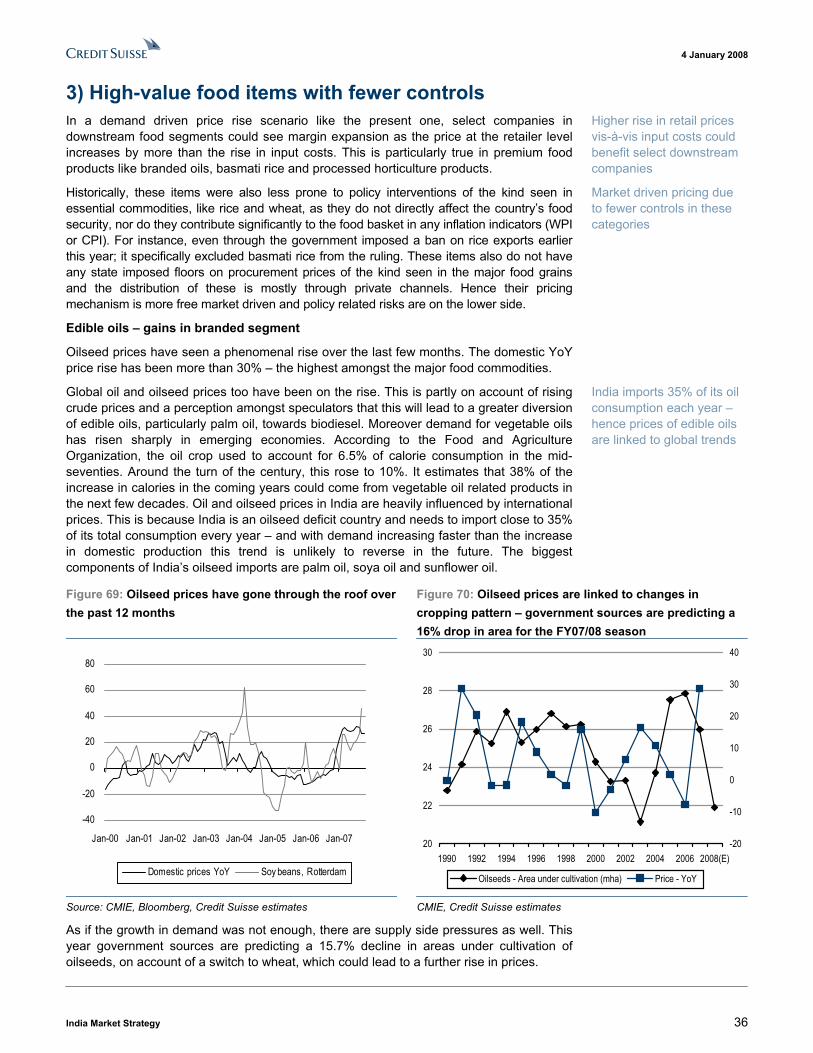
4 January 2008
India Market Strategy 36
3) High-value food items with fewer controls In a demand driven price rise scenario like the present one, select companies in downstream food segments could see margin expansion as the price at the retailer level increases by more than the rise in input costs. This is particularly true in premium food products like branded oils, basmati rice and processed horticulture products.
Historically, these items were also less prone to policy interventions of the kind seen in essential commodities, like rice and wheat, as they do not directly affect the country�s food security, nor do they contribute significantly to the food basket in any inflation indicators (WPI or CPI). For instance, even through the government imposed a ban on rice exports earlier this year; it specifically excluded basmati rice from the ruling. These items also do not have any state imposed floors on procurement prices of the kind seen in the major food grains and the distribution of these is mostly through private channels. Hence their pricing mechanism is more free market driven and policy related risks are on the lower side.
Edible oils � gains in branded segment
Oilseed prices have seen a phenomenal rise over the last few months. The domestic YoY price rise has been more than 30% � the highest amongst the major food commodities.
Global oil and oilseed prices too have been on the rise. This is partly on account of rising crude prices and a perception amongst speculators that this will lead to a greater diversion of edible oils, particularly palm oil, towards biodiesel. Moreover demand for vegetable oils has risen sharply in emerging economies. According to the Food and Agriculture Organization, the oil crop used to account for 6.5% of calorie consumption in the mid-seventies. Around the turn of the century, this rose to 10%. It estimates that 38% of the increase in calories in the coming years could come from vegetable oil related products in the next few decades. Oil and oilseed prices in India are heavily influenced by international prices. This is because India is an oilseed deficit country and needs to import close to 35% of its total consumption every year � and with demand increasing faster than the increase in domestic production this trend is unlikely to reverse in the future. The biggest components of India�s oilseed imports are palm oil, soya oil and sunflower oil.
Figure 69: Oilseed prices have gone through the roof over the past 12 months
Figure 70: Oilseed prices are linked to changes in cropping pattern � government sources are predicting a 16% drop in area for the FY07/08 season
-40
-20
0
20
40
60
80
Jan-00 Jan-01 Jan-02 Jan-03 Jan-04 Jan-05 Jan-06 Jan-07
Domestic prices YoY Soy beans, Rotterdam
20
22
24
26
28
30
1990 1992 1994 1996 1998 2000 2002 2004 2006 2008(E)-20
-10
0
10
20
30
40
Oilseeds - Area under cultivation (mha) Price - YoY
Source: CMIE, Bloomberg, Credit Suisse estimates CMIE, Credit Suisse estimates
As if the growth in demand was not enough, there are supply side pressures as well. This year government sources are predicting a 15.7% decline in areas under cultivation of oilseeds, on account of a switch to wheat, which could lead to a further rise in prices.
Higher rise in retail prices vis-à-vis input costs could benefit select downstream companies
Market driven pricing due to fewer controls in these categories
India imports 35% of its oil consumption each year � hence prices of edible oils are linked to global trends
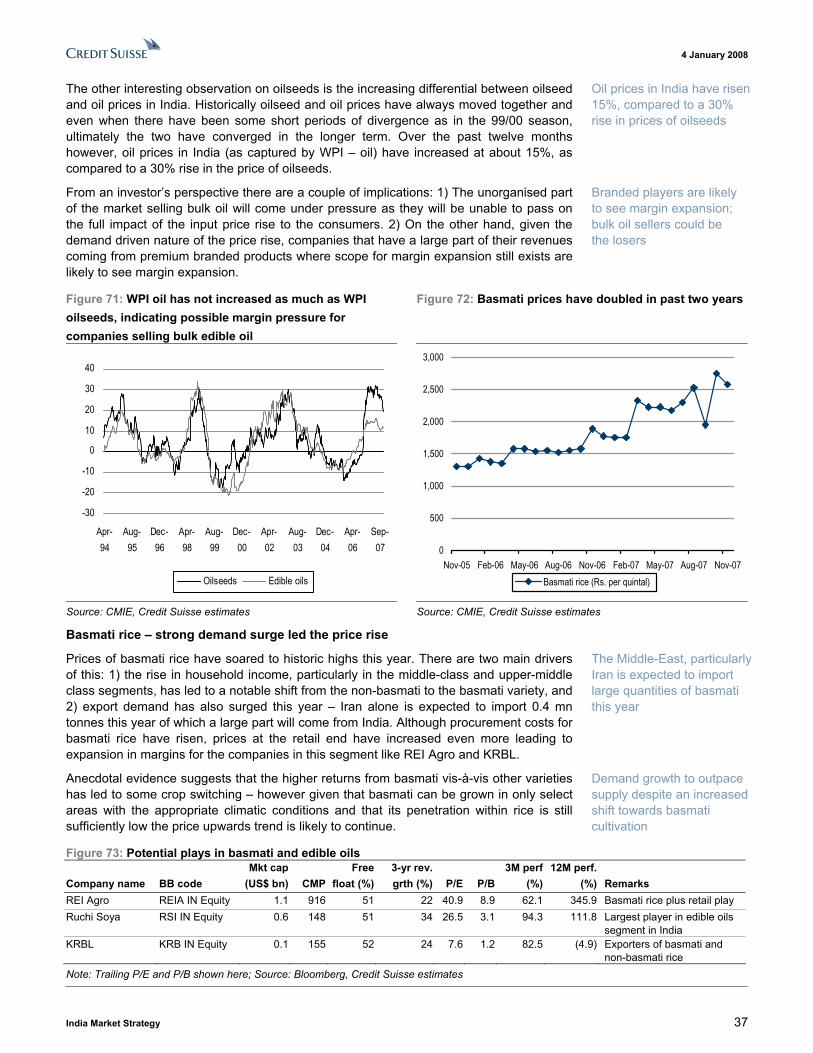
4 January 2008
India Market Strategy 37
The other interesting observation on oilseeds is the increasing differential between oilseed and oil prices in India. Historically oilseed and oil prices have always moved together and even when there have been some short periods of divergence as in the 99/00 season, ultimately the two have converged in the longer term. Over the past twelve months however, oil prices in India (as captured by WPI � oil) have increased at about 15%, as compared to a 30% rise in the price of oilseeds.
From an investor�s perspective there are a couple of implications: 1) The unorganised part of the market selling bulk oil will come under pressure as they will be unable to pass on the full impact of the input price rise to the consumers. 2) On the other hand, given the demand driven nature of the price rise, companies that have a large part of their revenues coming from premium branded products where scope for margin expansion still exists are likely to see margin expansion.
Figure 71: WPI oil has not increased as much as WPI oilseeds, indicating possible margin pressure for companies selling bulk edible oil
Figure 72: Basmati prices have doubled in past two years
-30
-20
-10
0
10
20
30
40
Apr-94
Aug-95
Dec-96
Apr-98
Aug-99
Dec-00
Apr-02
Aug-03
Dec-04
Apr-06
Sep-07
Oilseeds Edible oils
0
500
1,000
1,500
2,000
2,500
3,000
Nov-05 Feb-06 May-06 Aug-06 Nov-06 Feb-07 May-07 Aug-07 Nov-07Basmati rice (Rs. per quintal)
Source: CMIE, Credit Suisse estimates Source: CMIE, Credit Suisse estimates
Basmati rice � strong demand surge led the price rise
Prices of basmati rice have soared to historic highs this year. There are two main drivers of this: 1) the rise in household income, particularly in the middle-class and upper-middle class segments, has led to a notable shift from the non-basmati to the basmati variety, and 2) export demand has also surged this year � Iran alone is expected to import 0.4 mn tonnes this year of which a large part will come from India. Although procurement costs for basmati rice have risen, prices at the retail end have increased even more leading to expansion in margins for the companies in this segment like REI Agro and KRBL.
Anecdotal evidence suggests that the higher returns from basmati vis-à-vis other varieties has led to some crop switching � however given that basmati can be grown in only select areas with the appropriate climatic conditions and that its penetration within rice is still sufficiently low the price upwards trend is likely to continue.
Figure 73: Potential plays in basmati and edible oils Mkt cap Free 3-yr rev. 3M perf 12M perf. Company name BB code (US$ bn) CMP float (%) grth (%) P/E P/B (%) (%) Remarks REI Agro REIA IN Equity 1.1 916 51 22 40.9 8.9 62.1 345.9 Basmati rice plus retail play Ruchi Soya RSI IN Equity 0.6 148 51 34 26.5 3.1 94.3 111.8 Largest player in edible oils
segment in India KRBL KRB IN Equity 0.1 155 52 24 7.6 1.2 82.5 (4.9) Exporters of basmati and
non-basmati rice Note: Trailing P/E and P/B shown here; Source: Bloomberg, Credit Suisse estimates
Oil prices in India have risen 15%, compared to a 30% rise in prices of oilseeds
Branded players are likely to see margin expansion; bulk oil sellers could be the losers
The Middle-East, particularly Iran is expected to import large quantities of basmati this year
Demand growth to outpace supply despite an increased shift towards basmati cultivation

4 January 2008
India Market Strategy 38
4) Farm sector investment theme Farmers have a low savings rate. According to the NSSO survey in 2003, they spend about 10% of their income on the purchase of long-term productive assets � including ones needed in their household. The survey showed that farmers spend 80% of their capital expenditure in farm business-related assets. About 23% of this goes into the procurement of fertilisers. As a result, the listed fertiliser sector should be a direct beneficiary of rising farm income. Unfortunately, the returns for fertiliser companies are capped by regulation. Fertiliser prices are also completely regulated and attract heavy subsidies from the state. Fertiliser companies can increase their returns somewhat through higher volumes and productivity, but gains are muted from this route. We do not foresee any possibility of material deregulation or an increase in returns, top-down, for fertiliser companies in the foreseeable future as a result.
Figure 74:Farmers spend most of their expenditure in long-term assets as reinvestment in the farm business
Figure 75: 35% of spending on farm is on seeds, irrigation and pesticides
Farm business80%
Residential building
13%
Non-farm business
7%
Irrigation12%
Lease rent5%
Pesticides7%
Fertilizers23%
Other expenses15%
Labour22%
Seeds16%
Expenses on cultivation in rural India
0%
Source: National Sample Survey Organization, Credit Suisse estimates
Source: National Sample Survey Organization, Credit Suisse estimates
Among the listed businesses, the benefits should accrue to companies in unregulated seeds, pesticides and irrigation sectors where farmers spend over a third of their capital expenditure. United Phosphorus, Advanta India Ltd, Jain Irrigation and Monsanto India are some of the listed companies in these segments.
Figure 76: Potential plays in seeds and insecticides Mkt cap Free 3-yr rev. 3M perf. 12M perf. Company name BB code (US$ bn) CMP float (%) grth (%) P/E P/B (%) (%) Remarks United Phosphorus UNTP IN Equity 2.0 376 69 17 27.0 4.7 (4.3) 22.6 Crop protection products Jain Irrigation JI IN Equity 1.1 633 54 43 46.6 12.3 15.1 60.7 Micro-irrigation and agro-
products Advanta Limited ADV IN Equity 0.6 1,472 33 n.a. 32.6 10.9 40.7 n.a. Hybrid seeds Monsanto MCHM IN Equity 0.5 2,110 19 -3 25.8 4.9 49.4 42.9 GM modified seeds for cotton
Note: Trailing P/E and P/B shown here; Source: Bloomberg, Credit Suisse estimates
The other capital expense categories involve mostly investments in tools and machineries. Tractors is one of the listed sub-sectors that is directly linked to expenditure under this bracket. Historically, whenever the weather was good and farm crops abundant, a sign of good rural income, tractor sales grew rapidly and vice versa. We expect tractor sales to accelerate along with rural income in the coming years.
Rising farm investment should benefit fertiliser companies only in a limited manner
Direct benefits for companies in seeds, irrigation and pesticides
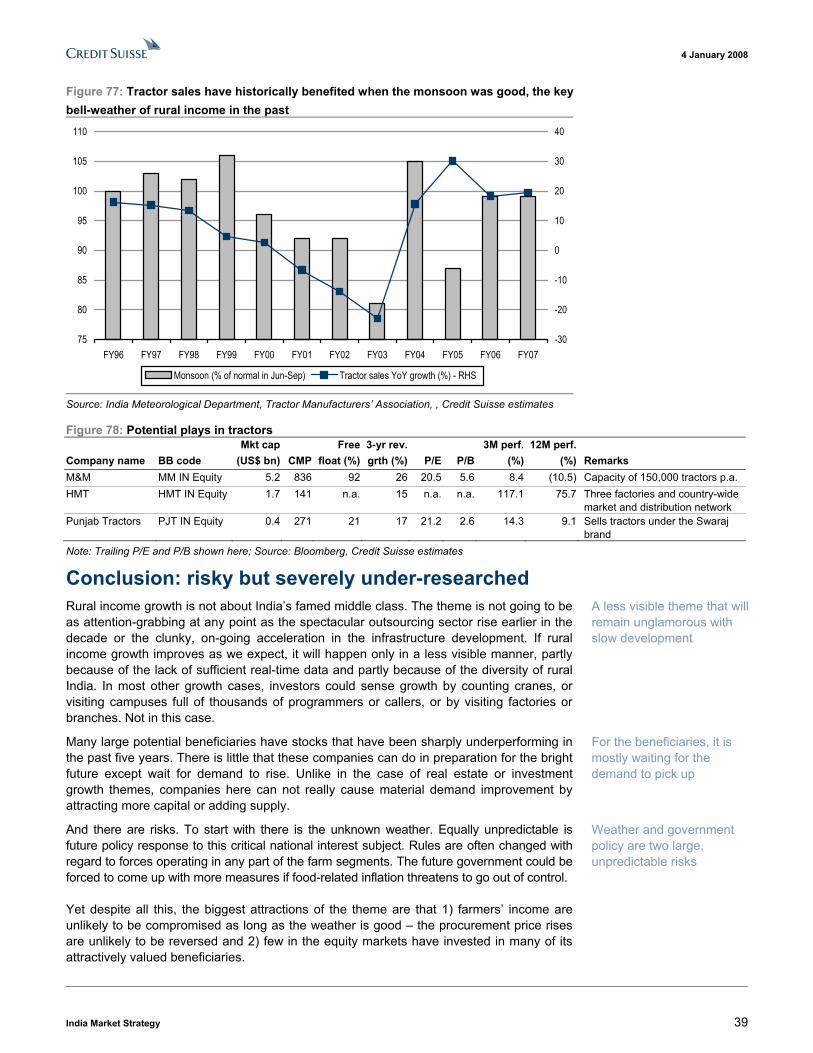
4 January 2008
India Market Strategy 39
Figure 77: Tractor sales have historically benefited when the monsoon was good, the key bell-weather of rural income in the past
75
80
85
90
95
100
105
110
FY96 FY97 FY98 FY99 FY00 FY01 FY02 FY03 FY04 FY05 FY06 FY07-30
-20
-10
0
10
20
30
40
Monsoon (% of normal in Jun-Sep) Tractor sales YoY growth (%) - RHS
Source: India Meteorological Department, Tractor Manufacturers� Association, , Credit Suisse estimates
Figure 78: Potential plays in tractors Mkt cap Free 3-yr rev. 3M perf. 12M perf. Company name BB code (US$ bn) CMP float (%) grth (%) P/E P/B (%) (%) Remarks M&M MM IN Equity 5.2 836 92 26 20.5 5.6 8.4 (10.5) Capacity of 150,000 tractors p.a. HMT HMT IN Equity 1.7 141 n.a. 15 n.a. n.a. 117.1 75.7 Three factories and country-wide
market and distribution network Punjab Tractors PJT IN Equity 0.4 271 21 17 21.2 2.6 14.3 9.1 Sells tractors under the Swaraj
brand Note: Trailing P/E and P/B shown here; Source: Bloomberg, Credit Suisse estimates
Conclusion: risky but severely under-researched Rural income growth is not about India�s famed middle class. The theme is not going to be as attention-grabbing at any point as the spectacular outsourcing sector rise earlier in the decade or the clunky, on-going acceleration in the infrastructure development. If rural income growth improves as we expect, it will happen only in a less visible manner, partly because of the lack of sufficient real-time data and partly because of the diversity of rural India. In most other growth cases, investors could sense growth by counting cranes, or visiting campuses full of thousands of programmers or callers, or by visiting factories or branches. Not in this case.
Many large potential beneficiaries have stocks that have been sharply underperforming in the past five years. There is little that these companies can do in preparation for the bright future except wait for demand to rise. Unlike in the case of real estate or investment growth themes, companies here can not really cause material demand improvement by attracting more capital or adding supply.
And there are risks. To start with there is the unknown weather. Equally unpredictable is future policy response to this critical national interest subject. Rules are often changed with regard to forces operating in any part of the farm segments. The future government could be forced to come up with more measures if food-related inflation threatens to go out of control.
Yet despite all this, the biggest attractions of the theme are that 1) farmers� income are unlikely to be compromised as long as the weather is good � the procurement price rises are unlikely to be reversed and 2) few in the equity markets have invested in many of its attractively valued beneficiaries.
A less visible theme that will remain unglamorous with slow development
For the beneficiaries, it is mostly waiting for the demand to pick up
Weather and government policy are two large, unpredictable risks
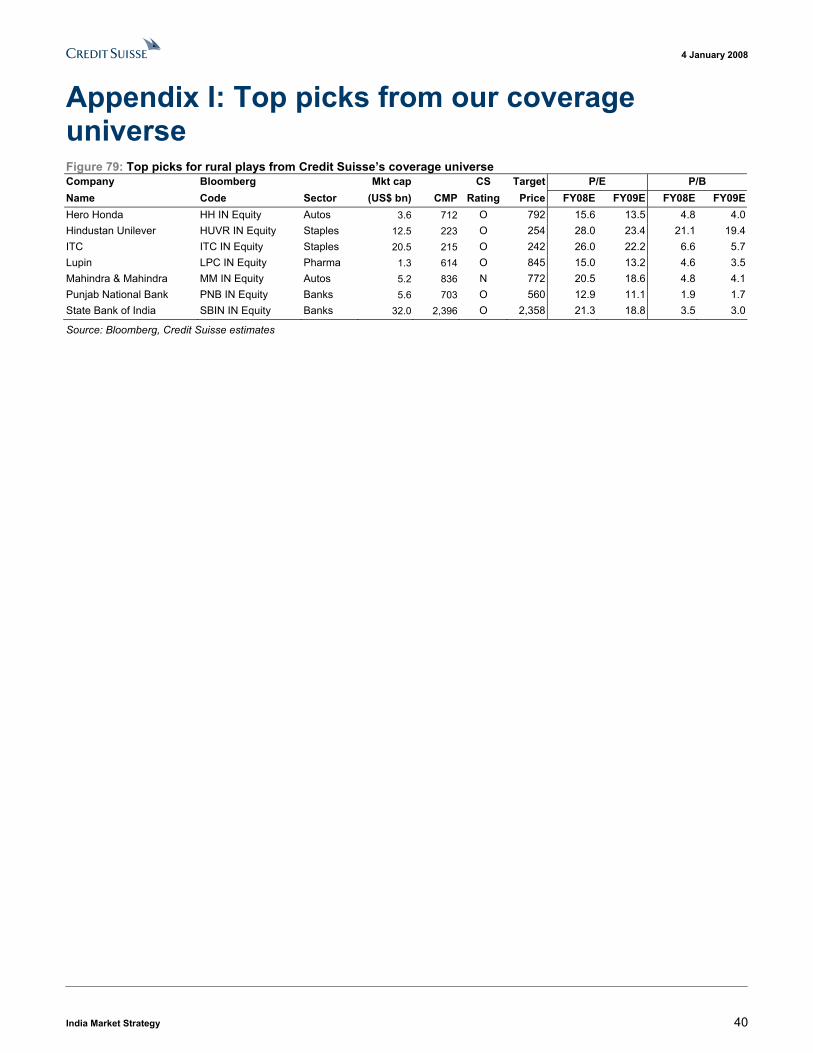
4 January 2008
India Market Strategy 40
Appendix I: Top picks from our coverage universe Figure 79: Top picks for rural plays from Credit Suisse�s coverage universe Company Bloomberg Mkt cap CS Target P/E P/B Name Code Sector (US$ bn) CMP Rating Price FY08E FY09E FY08E FY09EHero Honda HH IN Equity Autos 3.6 712 O 792 15.6 13.5 4.8 4.0Hindustan Unilever HUVR IN Equity Staples 12.5 223 O 254 28.0 23.4 21.1 19.4ITC ITC IN Equity Staples 20.5 215 O 242 26.0 22.2 6.6 5.7 Lupin LPC IN Equity Pharma 1.3 614 O 845 15.0 13.2 4.6 3.5Mahindra & Mahindra MM IN Equity Autos 5.2 836 N 772 20.5 18.6 4.8 4.1Punjab National Bank PNB IN Equity Banks 5.6 703 O 560 12.9 11.1 1.9 1.7State Bank of India SBIN IN Equity Banks 32.0 2,396 O 2,358 21.3 18.8 3.5 3.0
Source: Bloomberg, Credit Suisse estimates
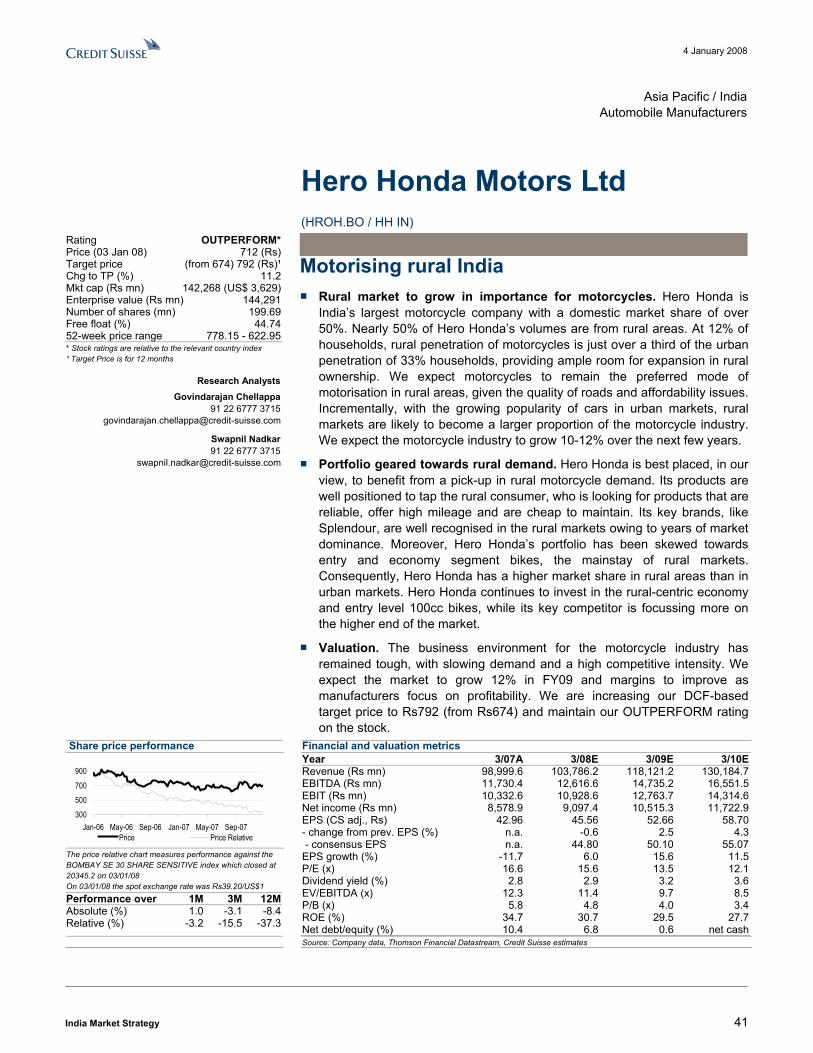
4 January 2008
India Market Strategy 41
Asia Pacific / IndiaAutomobile Manufacturers
Hero Honda Motors Ltd (HROH.BO / HH IN)
Motorising rural India ■ Rural market to grow in importance for motorcycles. Hero Honda is
India�s largest motorcycle company with a domestic market share of over 50%. Nearly 50% of Hero Honda�s volumes are from rural areas. At 12% of households, rural penetration of motorcycles is just over a third of the urban penetration of 33% households, providing ample room for expansion in rural ownership. We expect motorcycles to remain the preferred mode of motorisation in rural areas, given the quality of roads and affordability issues. Incrementally, with the growing popularity of cars in urban markets, rural markets are likely to become a larger proportion of the motorcycle industry. We expect the motorcycle industry to grow 10-12% over the next few years.
■ Portfolio geared towards rural demand. Hero Honda is best placed, in our view, to benefit from a pick-up in rural motorcycle demand. Its products are well positioned to tap the rural consumer, who is looking for products that are reliable, offer high mileage and are cheap to maintain. Its key brands, like Splendour, are well recognised in the rural markets owing to years of market dominance. Moreover, Hero Honda�s portfolio has been skewed towards entry and economy segment bikes, the mainstay of rural markets. Consequently, Hero Honda has a higher market share in rural areas than in urban markets. Hero Honda continues to invest in the rural-centric economy and entry level 100cc bikes, while its key competitor is focussing more on the higher end of the market.
■ Valuation. The business environment for the motorcycle industry has remained tough, with slowing demand and a high competitive intensity. We expect the market to grow 12% in FY09 and margins to improve as manufacturers focus on profitability. We are increasing our DCF-based target price to Rs792 (from Rs674) and maintain our OUTPERFORM rating on the stock.
Share price performance
300500700900
Jan-06 May-06 Sep-06 Jan-07 May-07 Sep-07Price Price Relative
The price relative chart measures performance against the BOMBAY SE 30 SHARE SENSITIVE index which closed at 20345.2 on 03/01/08 On 03/01/08 the spot exchange rate was Rs39.20/US$1
Performance over 1M 3M 12M Absolute (%) 1.0 -3.1 -8.4 Relative (%) -3.2 -15.5 -37.3
Financial and valuation metricsYear 3/07A 3/08E 3/09E 3/10ERevenue (Rs mn) 98,999.6 103,786.2 118,121.2 130,184.7EBITDA (Rs mn) 11,730.4 12,616.6 14,735.2 16,551.5EBIT (Rs mn) 10,332.6 10,928.6 12,763.7 14,314.6Net income (Rs mn) 8,578.9 9,097.4 10,515.3 11,722.9EPS (CS adj., Rs) 42.96 45.56 52.66 58.70- change from prev. EPS (%) n.a. -0.6 2.5 4.3 - consensus EPS n.a. 44.80 50.10 55.07EPS growth (%) -11.7 6.0 15.6 11.5P/E (x) 16.6 15.6 13.5 12.1Dividend yield (%) 2.8 2.9 3.2 3.6EV/EBITDA (x) 12.3 11.4 9.7 8.5P/B (x) 5.8 4.8 4.0 3.4ROE (%) 34.7 30.7 29.5 27.7Net debt/equity (%) 10.4 6.8 0.6 net cash
Source: Company data, Thomson Financial Datastream, Credit Suisse estimates
* Stock ratings are relative to the relevant country index ¹ Target Price is for 12 months
Research Analysts Govindarajan Chellappa
91 22 6777 3715 [email protected]
Swapnil Nadkar 91 22 6777 3715
Rating OUTPERFORM* Price (03 Jan 08) 712 (Rs) Target price (from 674) 792 (Rs)¹ Chg to TP (%) 11.2 Mkt cap (Rs mn) 142,268 (US$ 3,629) Enterprise value (Rs mn) 144,291 Number of shares (mn) 199.69 Free float (%) 44.74 52-week price range 778.15 - 622.95
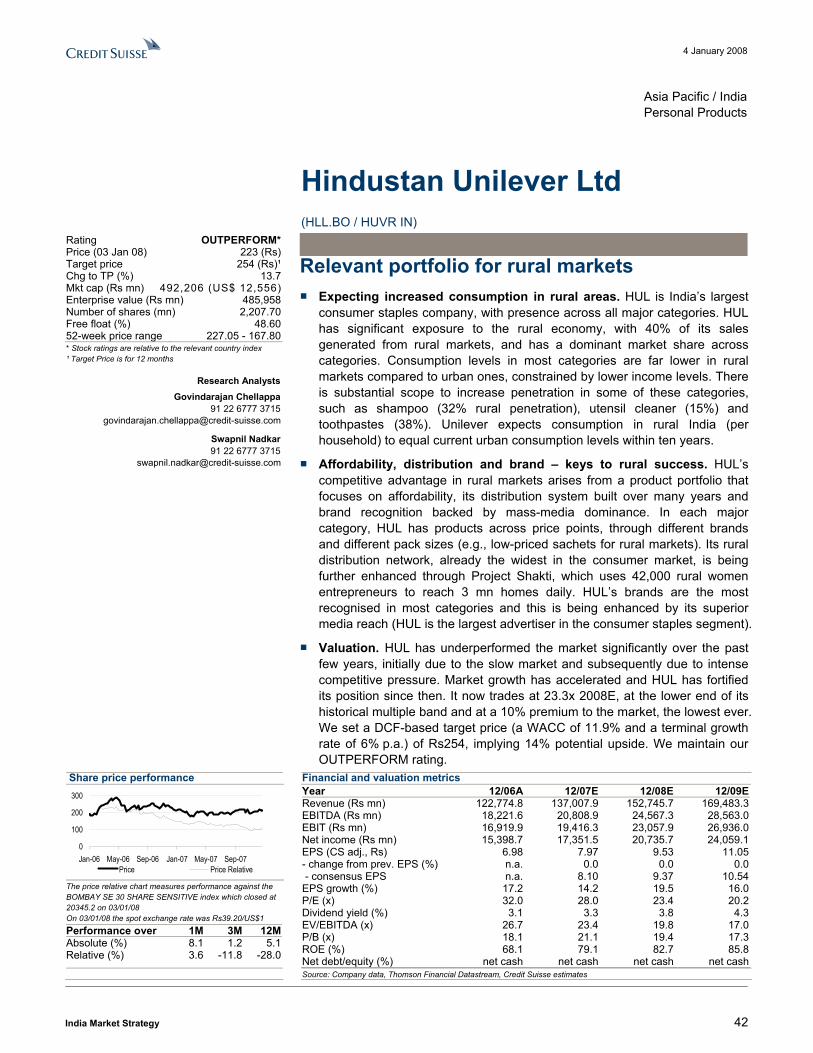
4 January 2008
India Market Strategy 42
Asia Pacific / IndiaPersonal Products
Hindustan Unilever Ltd (HLL.BO / HUVR IN)
Relevant portfolio for rural markets ■ Expecting increased consumption in rural areas. HUL is India�s largest
consumer staples company, with presence across all major categories. HUL has significant exposure to the rural economy, with 40% of its sales generated from rural markets, and has a dominant market share across categories. Consumption levels in most categories are far lower in rural markets compared to urban ones, constrained by lower income levels. There is substantial scope to increase penetration in some of these categories, such as shampoo (32% rural penetration), utensil cleaner (15%) and toothpastes (38%). Unilever expects consumption in rural India (per household) to equal current urban consumption levels within ten years.
■ Affordability, distribution and brand � keys to rural success. HUL�s competitive advantage in rural markets arises from a product portfolio that focuses on affordability, its distribution system built over many years and brand recognition backed by mass-media dominance. In each major category, HUL has products across price points, through different brands and different pack sizes (e.g., low-priced sachets for rural markets). Its rural distribution network, already the widest in the consumer market, is being further enhanced through Project Shakti, which uses 42,000 rural women entrepreneurs to reach 3 mn homes daily. HUL�s brands are the most recognised in most categories and this is being enhanced by its superior media reach (HUL is the largest advertiser in the consumer staples segment).
■ Valuation. HUL has underperformed the market significantly over the past few years, initially due to the slow market and subsequently due to intense competitive pressure. Market growth has accelerated and HUL has fortified its position since then. It now trades at 23.3x 2008E, at the lower end of its historical multiple band and at a 10% premium to the market, the lowest ever. We set a DCF-based target price (a WACC of 11.9% and a terminal growth rate of 6% p.a.) of Rs254, implying 14% potential upside. We maintain our OUTPERFORM rating.
Share price performance
0
100
200
300
Jan-06 May-06 Sep-06 Jan-07 May-07 Sep-07Price Price Relative
The price relative chart measures performance against the BOMBAY SE 30 SHARE SENSITIVE index which closed at 20345.2 on 03/01/08 On 03/01/08 the spot exchange rate was Rs39.20/US$1
Performance over 1M 3M 12M Absolute (%) 8.1 1.2 5.1 Relative (%) 3.6 -11.8 -28.0
Financial and valuation metricsYear 12/06A 12/07E 12/08E 12/09ERevenue (Rs mn) 122,774.8 137,007.9 152,745.7 169,483.3EBITDA (Rs mn) 18,221.6 20,808.9 24,567.3 28,563.0EBIT (Rs mn) 16,919.9 19,416.3 23,057.9 26,936.0Net income (Rs mn) 15,398.7 17,351.5 20,735.7 24,059.1EPS (CS adj., Rs) 6.98 7.97 9.53 11.05- change from prev. EPS (%) n.a. 0.0 0.0 0.0 - consensus EPS n.a. 8.10 9.37 10.54EPS growth (%) 17.2 14.2 19.5 16.0P/E (x) 32.0 28.0 23.4 20.2Dividend yield (%) 3.1 3.3 3.8 4.3EV/EBITDA (x) 26.7 23.4 19.8 17.0P/B (x) 18.1 21.1 19.4 17.3ROE (%) 68.1 79.1 82.7 85.8Net debt/equity (%) net cash net cash net cash net cash
Source: Company data, Thomson Financial Datastream, Credit Suisse estimates
* Stock ratings are relative to the relevant country index ¹ Target Price is for 12 months
Research Analysts Govindarajan Chellappa
91 22 6777 3715 [email protected]
Swapnil Nadkar 91 22 6777 3715
Rating OUTPERFORM* Price (03 Jan 08) 223 (Rs) Target price 254 (Rs)¹ Chg to TP (%) 13.7 Mkt cap (Rs mn) 492,206 (US$ 12,556) Enterprise value (Rs mn) 485,958 Number of shares (mn) 2,207.70 Free float (%) 48.60 52-week price range 227.05 - 167.80
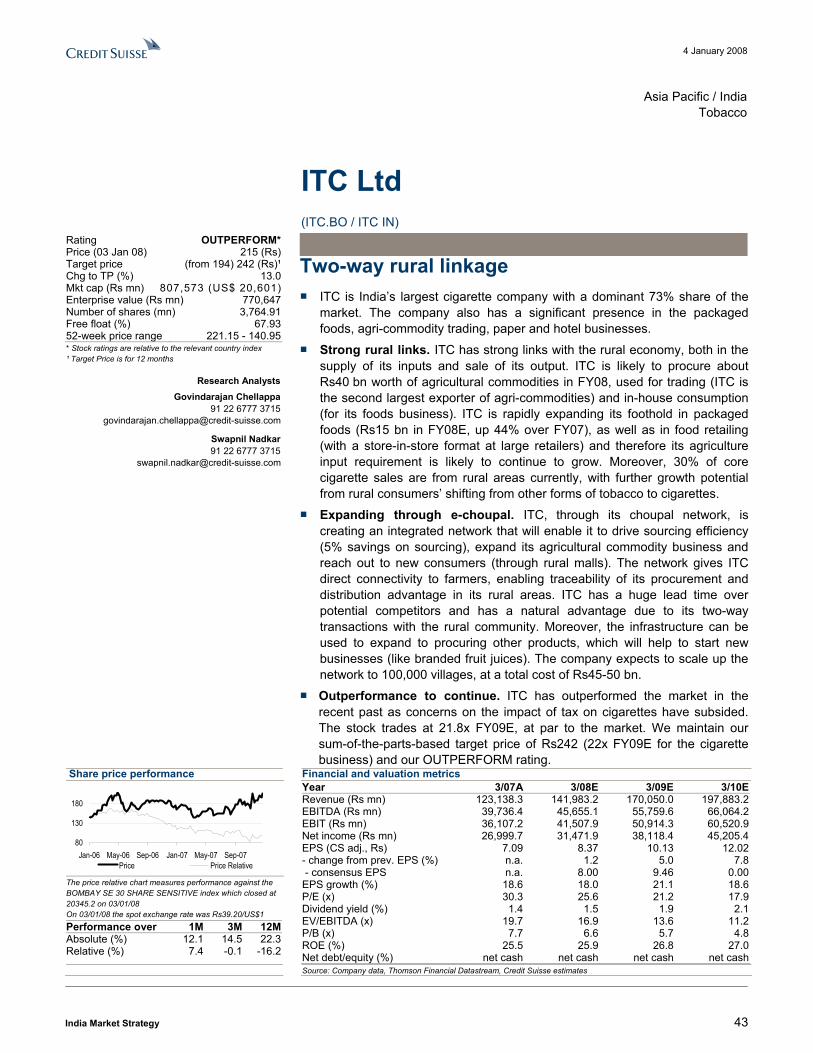
4 January 2008
India Market Strategy 43
Asia Pacific / IndiaTobacco
ITC Ltd (ITC.BO / ITC IN)
Two-way rural linkage ■ ITC is India�s largest cigarette company with a dominant 73% share of the
market. The company also has a significant presence in the packaged foods, agri-commodity trading, paper and hotel businesses.
■ Strong rural links. ITC has strong links with the rural economy, both in the supply of its inputs and sale of its output. ITC is likely to procure about Rs40 bn worth of agricultural commodities in FY08, used for trading (ITC is the second largest exporter of agri-commodities) and in-house consumption (for its foods business). ITC is rapidly expanding its foothold in packaged foods (Rs15 bn in FY08E, up 44% over FY07), as well as in food retailing (with a store-in-store format at large retailers) and therefore its agriculture input requirement is likely to continue to grow. Moreover, 30% of core cigarette sales are from rural areas currently, with further growth potential from rural consumers� shifting from other forms of tobacco to cigarettes.
■ Expanding through e-choupal. ITC, through its choupal network, is creating an integrated network that will enable it to drive sourcing efficiency (5% savings on sourcing), expand its agricultural commodity business and reach out to new consumers (through rural malls). The network gives ITC direct connectivity to farmers, enabling traceability of its procurement and distribution advantage in its rural areas. ITC has a huge lead time over potential competitors and has a natural advantage due to its two-way transactions with the rural community. Moreover, the infrastructure can be used to expand to procuring other products, which will help to start new businesses (like branded fruit juices). The company expects to scale up the network to 100,000 villages, at a total cost of Rs45-50 bn.
■ Outperformance to continue. ITC has outperformed the market in the recent past as concerns on the impact of tax on cigarettes have subsided. The stock trades at 21.8x FY09E, at par to the market. We maintain our sum-of-the-parts-based target price of Rs242 (22x FY09E for the cigarette business) and our OUTPERFORM rating.
Share price performance
80
130
180
Jan-06 May-06 Sep-06 Jan-07 May-07 Sep-07Price Price Relative
The price relative chart measures performance against the BOMBAY SE 30 SHARE SENSITIVE index which closed at 20345.2 on 03/01/08 On 03/01/08 the spot exchange rate was Rs39.20/US$1
Performance over 1M 3M 12M Absolute (%) 12.1 14.5 22.3 Relative (%) 7.4 -0.1 -16.2
Financial and valuation metricsYear 3/07A 3/08E 3/09E 3/10ERevenue (Rs mn) 123,138.3 141,983.2 170,050.0 197,883.2EBITDA (Rs mn) 39,736.4 45,655.1 55,759.6 66,064.2EBIT (Rs mn) 36,107.2 41,507.9 50,914.3 60,520.9Net income (Rs mn) 26,999.7 31,471.9 38,118.4 45,205.4EPS (CS adj., Rs) 7.09 8.37 10.13 12.02- change from prev. EPS (%) n.a. 1.2 5.0 7.8 - consensus EPS n.a. 8.00 9.46 0.00EPS growth (%) 18.6 18.0 21.1 18.6P/E (x) 30.3 25.6 21.2 17.9Dividend yield (%) 1.4 1.5 1.9 2.1EV/EBITDA (x) 19.7 16.9 13.6 11.2P/B (x) 7.7 6.6 5.7 4.8ROE (%) 25.5 25.9 26.8 27.0Net debt/equity (%) net cash net cash net cash net cash
Source: Company data, Thomson Financial Datastream, Credit Suisse estimates
* Stock ratings are relative to the relevant country index ¹ Target Price is for 12 months
Research Analysts Govindarajan Chellappa
91 22 6777 3715 [email protected]
Swapnil Nadkar 91 22 6777 3715
Rating OUTPERFORM* Price (03 Jan 08) 215 (Rs) Target price (from 194) 242 (Rs)¹ Chg to TP (%) 13.0 Mkt cap (Rs mn) 807,573 (US$ 20,601) Enterprise value (Rs mn) 770,647 Number of shares (mn) 3,764.91 Free float (%) 67.93 52-week price range 221.15 - 140.95
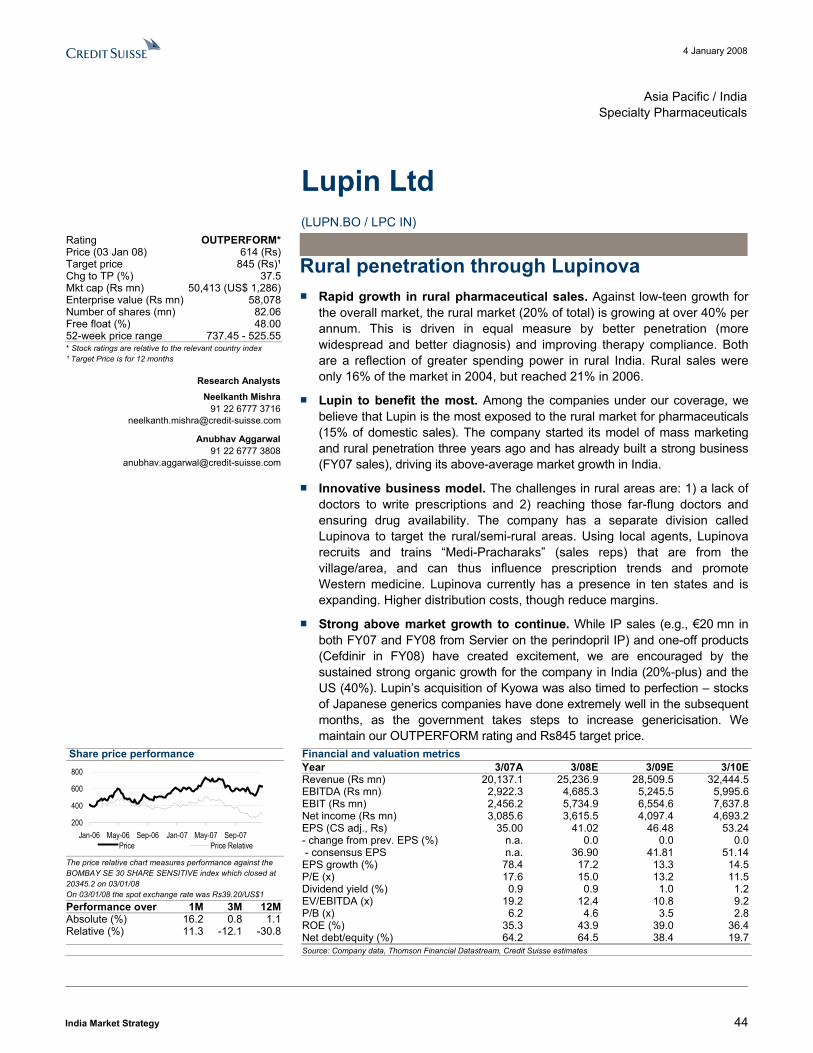
4 January 2008
India Market Strategy 44
Asia Pacific / IndiaSpecialty Pharmaceuticals
Lupin Ltd (LUPN.BO / LPC IN)
Rural penetration through Lupinova ■ Rapid growth in rural pharmaceutical sales. Against low-teen growth for
the overall market, the rural market (20% of total) is growing at over 40% per annum. This is driven in equal measure by better penetration (more widespread and better diagnosis) and improving therapy compliance. Both are a reflection of greater spending power in rural India. Rural sales were only 16% of the market in 2004, but reached 21% in 2006.
■ Lupin to benefit the most. Among the companies under our coverage, we believe that Lupin is the most exposed to the rural market for pharmaceuticals (15% of domestic sales). The company started its model of mass marketing and rural penetration three years ago and has already built a strong business (FY07 sales), driving its above-average market growth in India.
■ Innovative business model. The challenges in rural areas are: 1) a lack of doctors to write prescriptions and 2) reaching those far-flung doctors and ensuring drug availability. The company has a separate division called Lupinova to target the rural/semi-rural areas. Using local agents, Lupinova recruits and trains �Medi-Pracharaks� (sales reps) that are from the village/area, and can thus influence prescription trends and promote Western medicine. Lupinova currently has a presence in ten states and is expanding. Higher distribution costs, though reduce margins.
■ Strong above market growth to continue. While IP sales (e.g., �20 mn in both FY07 and FY08 from Servier on the perindopril IP) and one-off products (Cefdinir in FY08) have created excitement, we are encouraged by the sustained strong organic growth for the company in India (20%-plus) and the US (40%). Lupin�s acquisition of Kyowa was also timed to perfection � stocks of Japanese generics companies have done extremely well in the subsequent months, as the government takes steps to increase genericisation. We maintain our OUTPERFORM rating and Rs845 target price.
Share price performance
200
400
600
800
Jan-06 May-06 Sep-06 Jan-07 May-07 Sep-07Price Price Relative
The price relative chart measures performance against the BOMBAY SE 30 SHARE SENSITIVE index which closed at 20345.2 on 03/01/08 On 03/01/08 the spot exchange rate was Rs39.20/US$1
Performance over 1M 3M 12M Absolute (%) 16.2 0.8 1.1 Relative (%) 11.3 -12.1 -30.8
Financial and valuation metricsYear 3/07A 3/08E 3/09E 3/10ERevenue (Rs mn) 20,137.1 25,236.9 28,509.5 32,444.5EBITDA (Rs mn) 2,922.3 4,685.3 5,245.5 5,995.6EBIT (Rs mn) 2,456.2 5,734.9 6,554.6 7,637.8Net income (Rs mn) 3,085.6 3,615.5 4,097.4 4,693.2EPS (CS adj., Rs) 35.00 41.02 46.48 53.24- change from prev. EPS (%) n.a. 0.0 0.0 0.0 - consensus EPS n.a. 36.90 41.81 51.14EPS growth (%) 78.4 17.2 13.3 14.5P/E (x) 17.6 15.0 13.2 11.5Dividend yield (%) 0.9 0.9 1.0 1.2EV/EBITDA (x) 19.2 12.4 10.8 9.2P/B (x) 6.2 4.6 3.5 2.8ROE (%) 35.3 43.9 39.0 36.4Net debt/equity (%) 64.2 64.5 38.4 19.7
Source: Company data, Thomson Financial Datastream, Credit Suisse estimates
* Stock ratings are relative to the relevant country index ¹ Target Price is for 12 months
Research Analysts Neelkanth Mishra
91 22 6777 3716 [email protected]
Anubhav Aggarwal 91 22 6777 3808
Rating OUTPERFORM* Price (03 Jan 08) 614 (Rs) Target price 845 (Rs)¹ Chg to TP (%) 37.5 Mkt cap (Rs mn) 50,413 (US$ 1,286) Enterprise value (Rs mn) 58,078 Number of shares (mn) 82.06 Free float (%) 48.00 52-week price range 737.45 - 525.55
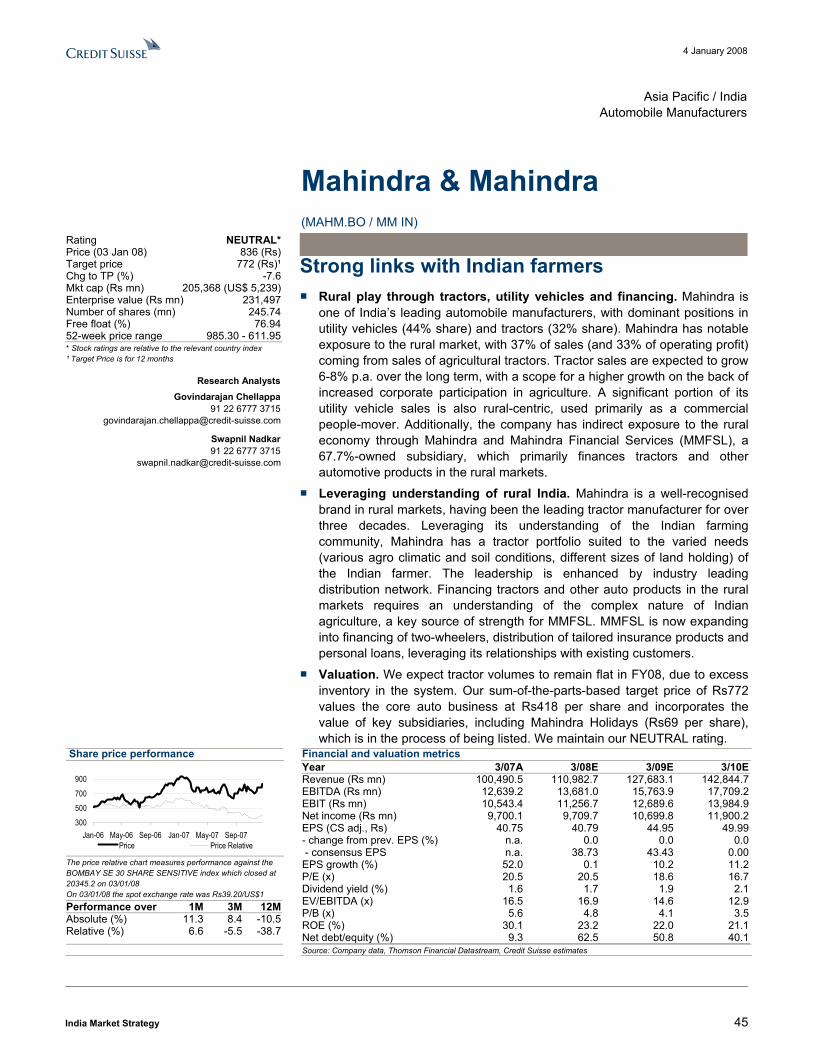
4 January 2008
India Market Strategy 45
Asia Pacific / IndiaAutomobile Manufacturers
Mahindra & Mahindra (MAHM.BO / MM IN)
Strong links with Indian farmers ■ Rural play through tractors, utility vehicles and financing. Mahindra is
one of India�s leading automobile manufacturers, with dominant positions in utility vehicles (44% share) and tractors (32% share). Mahindra has notable exposure to the rural market, with 37% of sales (and 33% of operating profit) coming from sales of agricultural tractors. Tractor sales are expected to grow 6-8% p.a. over the long term, with a scope for a higher growth on the back of increased corporate participation in agriculture. A significant portion of its utility vehicle sales is also rural-centric, used primarily as a commercial people-mover. Additionally, the company has indirect exposure to the rural economy through Mahindra and Mahindra Financial Services (MMFSL), a 67.7%-owned subsidiary, which primarily finances tractors and other automotive products in the rural markets.
■ Leveraging understanding of rural India. Mahindra is a well-recognised brand in rural markets, having been the leading tractor manufacturer for over three decades. Leveraging its understanding of the Indian farming community, Mahindra has a tractor portfolio suited to the varied needs (various agro climatic and soil conditions, different sizes of land holding) of the Indian farmer. The leadership is enhanced by industry leading distribution network. Financing tractors and other auto products in the rural markets requires an understanding of the complex nature of Indian agriculture, a key source of strength for MMFSL. MMFSL is now expanding into financing of two-wheelers, distribution of tailored insurance products and personal loans, leveraging its relationships with existing customers.
■ Valuation. We expect tractor volumes to remain flat in FY08, due to excess inventory in the system. Our sum-of-the-parts-based target price of Rs772 values the core auto business at Rs418 per share and incorporates the value of key subsidiaries, including Mahindra Holidays (Rs69 per share), which is in the process of being listed. We maintain our NEUTRAL rating.
Share price performance
300500700900
Jan-06 May-06 Sep-06 Jan-07 May-07 Sep-07Price Price Relative
The price relative chart measures performance against the BOMBAY SE 30 SHARE SENSITIVE index which closed at 20345.2 on 03/01/08 On 03/01/08 the spot exchange rate was Rs39.20/US$1
Performance over 1M 3M 12M Absolute (%) 11.3 8.4 -10.5 Relative (%) 6.6 -5.5 -38.7
Financial and valuation metricsYear 3/07A 3/08E 3/09E 3/10ERevenue (Rs mn) 100,490.5 110,982.7 127,683.1 142,844.7EBITDA (Rs mn) 12,639.2 13,681.0 15,763.9 17,709.2EBIT (Rs mn) 10,543.4 11,256.7 12,689.6 13,984.9Net income (Rs mn) 9,700.1 9,709.7 10,699.8 11,900.2EPS (CS adj., Rs) 40.75 40.79 44.95 49.99- change from prev. EPS (%) n.a. 0.0 0.0 0.0 - consensus EPS n.a. 38.73 43.43 0.00EPS growth (%) 52.0 0.1 10.2 11.2P/E (x) 20.5 20.5 18.6 16.7Dividend yield (%) 1.6 1.7 1.9 2.1EV/EBITDA (x) 16.5 16.9 14.6 12.9P/B (x) 5.6 4.8 4.1 3.5ROE (%) 30.1 23.2 22.0 21.1Net debt/equity (%) 9.3 62.5 50.8 40.1
Source: Company data, Thomson Financial Datastream, Credit Suisse estimates
* Stock ratings are relative to the relevant country index ¹ Target Price is for 12 months
Research Analysts Govindarajan Chellappa
91 22 6777 3715 [email protected]
Swapnil Nadkar 91 22 6777 3715
Rating NEUTRAL* Price (03 Jan 08) 836 (Rs) Target price 772 (Rs)¹ Chg to TP (%) -7.6 Mkt cap (Rs mn) 205,368 (US$ 5,239) Enterprise value (Rs mn) 231,497 Number of shares (mn) 245.74 Free float (%) 76.94 52-week price range 985.30 - 611.95
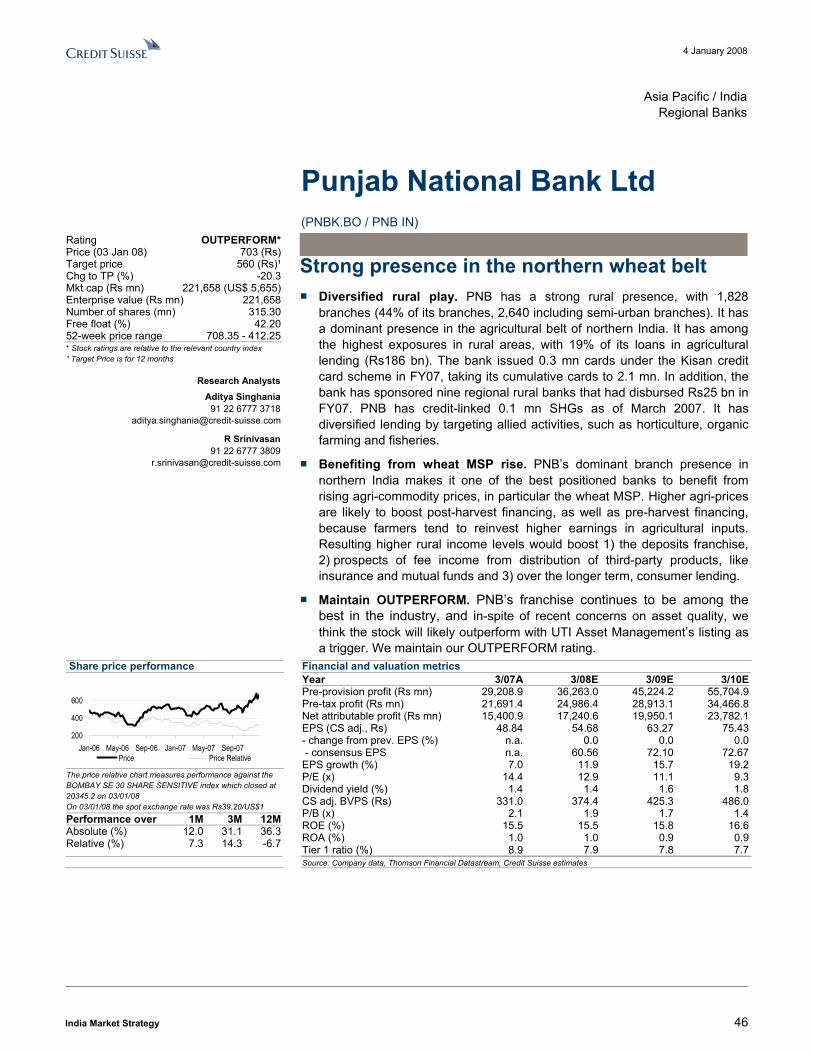
4 January 2008
India Market Strategy 46
Asia Pacific / IndiaRegional Banks
Punjab National Bank Ltd (PNBK.BO / PNB IN)
Strong presence in the northern wheat belt ■ Diversified rural play. PNB has a strong rural presence, with 1,828
branches (44% of its branches, 2,640 including semi-urban branches). It has a dominant presence in the agricultural belt of northern India. It has among the highest exposures in rural areas, with 19% of its loans in agricultural lending (Rs186 bn). The bank issued 0.3 mn cards under the Kisan credit card scheme in FY07, taking its cumulative cards to 2.1 mn. In addition, the bank has sponsored nine regional rural banks that had disbursed Rs25 bn in FY07. PNB has credit-linked 0.1 mn SHGs as of March 2007. It has diversified lending by targeting allied activities, such as horticulture, organic farming and fisheries.
■ Benefiting from wheat MSP rise. PNB�s dominant branch presence in northern India makes it one of the best positioned banks to benefit from rising agri-commodity prices, in particular the wheat MSP. Higher agri-prices are likely to boost post-harvest financing, as well as pre-harvest financing, because farmers tend to reinvest higher earnings in agricultural inputs. Resulting higher rural income levels would boost 1) the deposits franchise, 2) prospects of fee income from distribution of third-party products, like insurance and mutual funds and 3) over the longer term, consumer lending.
■ Maintain OUTPERFORM. PNB�s franchise continues to be among the best in the industry, and in-spite of recent concerns on asset quality, we think the stock will likely outperform with UTI Asset Management�s listing as a trigger. We maintain our OUTPERFORM rating.
Share price performance
200
400
600
Jan-06 May-06 Sep-06 Jan-07 May-07 Sep-07Price Price Relative
The price relative chart measures performance against the BOMBAY SE 30 SHARE SENSITIVE index which closed at 20345.2 on 03/01/08 On 03/01/08 the spot exchange rate was Rs39.20/US$1
Performance over 1M 3M 12M Absolute (%) 12.0 31.1 36.3 Relative (%) 7.3 14.3 -6.7
Financial and valuation metricsYear 3/07A 3/08E 3/09E 3/10EPre-provision profit (Rs mn) 29,208.9 36,263.0 45,224.2 55,704.9Pre-tax profit (Rs mn) 21,691.4 24,986.4 28,913.1 34,466.8Net attributable profit (Rs mn) 15,400.9 17,240.6 19,950.1 23,782.1EPS (CS adj., Rs) 48.84 54.68 63.27 75.43- change from prev. EPS (%) n.a. 0.0 0.0 0.0 - consensus EPS n.a. 60.56 72.10 72.67EPS growth (%) 7.0 11.9 15.7 19.2P/E (x) 14.4 12.9 11.1 9.3Dividend yield (%) 1.4 1.4 1.6 1.8CS adj. BVPS (Rs) 331.0 374.4 425.3 486.0P/B (x) 2.1 1.9 1.7 1.4ROE (%) 15.5 15.5 15.8 16.6ROA (%) 1.0 1.0 0.9 0.9Tier 1 ratio (%) 8.9 7.9 7.8 7.7
Source: Company data, Thomson Financial Datastream, Credit Suisse estimates
* Stock ratings are relative to the relevant country index ¹ Target Price is for 12 months
Research Analysts Aditya Singhania
91 22 6777 3718 [email protected]
R Srinivasan 91 22 6777 3809
Rating OUTPERFORM* Price (03 Jan 08) 703 (Rs) Target price 560 (Rs)¹ Chg to TP (%) -20.3 Mkt cap (Rs mn) 221,658 (US$ 5,655) Enterprise value (Rs mn) 221,658 Number of shares (mn) 315.30 Free float (%) 42.20 52-week price range 708.35 - 412.25
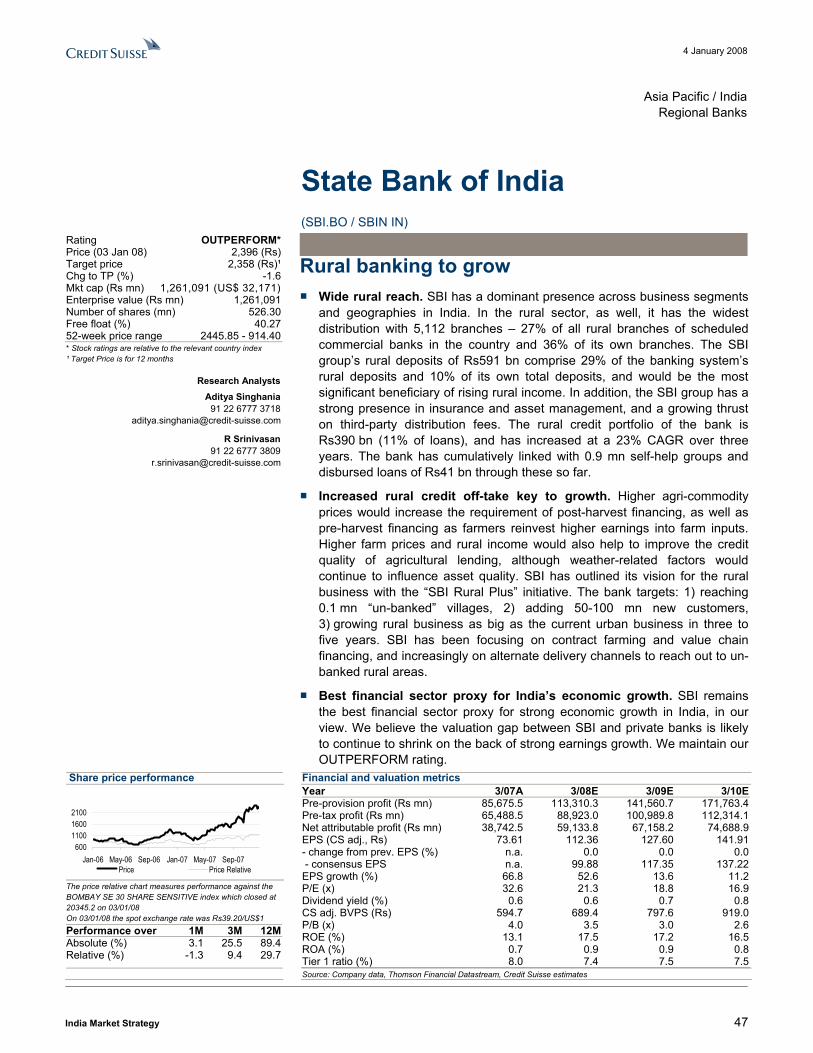
4 January 2008
India Market Strategy 47
Asia Pacific / IndiaRegional Banks
State Bank of India (SBI.BO / SBIN IN)
Rural banking to grow ■ Wide rural reach. SBI has a dominant presence across business segments
and geographies in India. In the rural sector, as well, it has the widest distribution with 5,112 branches � 27% of all rural branches of scheduled commercial banks in the country and 36% of its own branches. The SBI group�s rural deposits of Rs591 bn comprise 29% of the banking system�s rural deposits and 10% of its own total deposits, and would be the most significant beneficiary of rising rural income. In addition, the SBI group has a strong presence in insurance and asset management, and a growing thrust on third-party distribution fees. The rural credit portfolio of the bank is Rs390 bn (11% of loans), and has increased at a 23% CAGR over three years. The bank has cumulatively linked with 0.9 mn self-help groups and disbursed loans of Rs41 bn through these so far.
■ Increased rural credit off-take key to growth. Higher agri-commodity prices would increase the requirement of post-harvest financing, as well as pre-harvest financing as farmers reinvest higher earnings into farm inputs. Higher farm prices and rural income would also help to improve the credit quality of agricultural lending, although weather-related factors would continue to influence asset quality. SBI has outlined its vision for the rural business with the �SBI Rural Plus� initiative. The bank targets: 1) reaching 0.1 mn �un-banked� villages, 2) adding 50-100 mn new customers, 3) growing rural business as big as the current urban business in three to five years. SBI has been focusing on contract farming and value chain financing, and increasingly on alternate delivery channels to reach out to un-banked rural areas.
■ Best financial sector proxy for India�s economic growth. SBI remains the best financial sector proxy for strong economic growth in India, in our view. We believe the valuation gap between SBI and private banks is likely to continue to shrink on the back of strong earnings growth. We maintain our OUTPERFORM rating.
Share price performance
600110016002100
Jan-06 May-06 Sep-06 Jan-07 May-07 Sep-07Price Price Relative
The price relative chart measures performance against the BOMBAY SE 30 SHARE SENSITIVE index which closed at 20345.2 on 03/01/08 On 03/01/08 the spot exchange rate was Rs39.20/US$1
Performance over 1M 3M 12M Absolute (%) 3.1 25.5 89.4 Relative (%) -1.3 9.4 29.7
Financial and valuation metricsYear 3/07A 3/08E 3/09E 3/10EPre-provision profit (Rs mn) 85,675.5 113,310.3 141,560.7 171,763.4Pre-tax profit (Rs mn) 65,488.5 88,923.0 100,989.8 112,314.1Net attributable profit (Rs mn) 38,742.5 59,133.8 67,158.2 74,688.9EPS (CS adj., Rs) 73.61 112.36 127.60 141.91- change from prev. EPS (%) n.a. 0.0 0.0 0.0 - consensus EPS n.a. 99.88 117.35 137.22EPS growth (%) 66.8 52.6 13.6 11.2P/E (x) 32.6 21.3 18.8 16.9Dividend yield (%) 0.6 0.6 0.7 0.8CS adj. BVPS (Rs) 594.7 689.4 797.6 919.0P/B (x) 4.0 3.5 3.0 2.6ROE (%) 13.1 17.5 17.2 16.5ROA (%) 0.7 0.9 0.9 0.8Tier 1 ratio (%) 8.0 7.4 7.5 7.5
Source: Company data, Thomson Financial Datastream, Credit Suisse estimates
* Stock ratings are relative to the relevant country index ¹ Target Price is for 12 months
Research Analysts Aditya Singhania
91 22 6777 3718 [email protected]
R Srinivasan 91 22 6777 3809
Rating OUTPERFORM* Price (03 Jan 08) 2,396 (Rs) Target price 2,358 (Rs)¹ Chg to TP (%) -1.6 Mkt cap (Rs mn) 1,261,091 (US$ 32,171) Enterprise value (Rs mn) 1,261,091 Number of shares (mn) 526.30 Free float (%) 40.27 52-week price range 2445.85 - 914.40
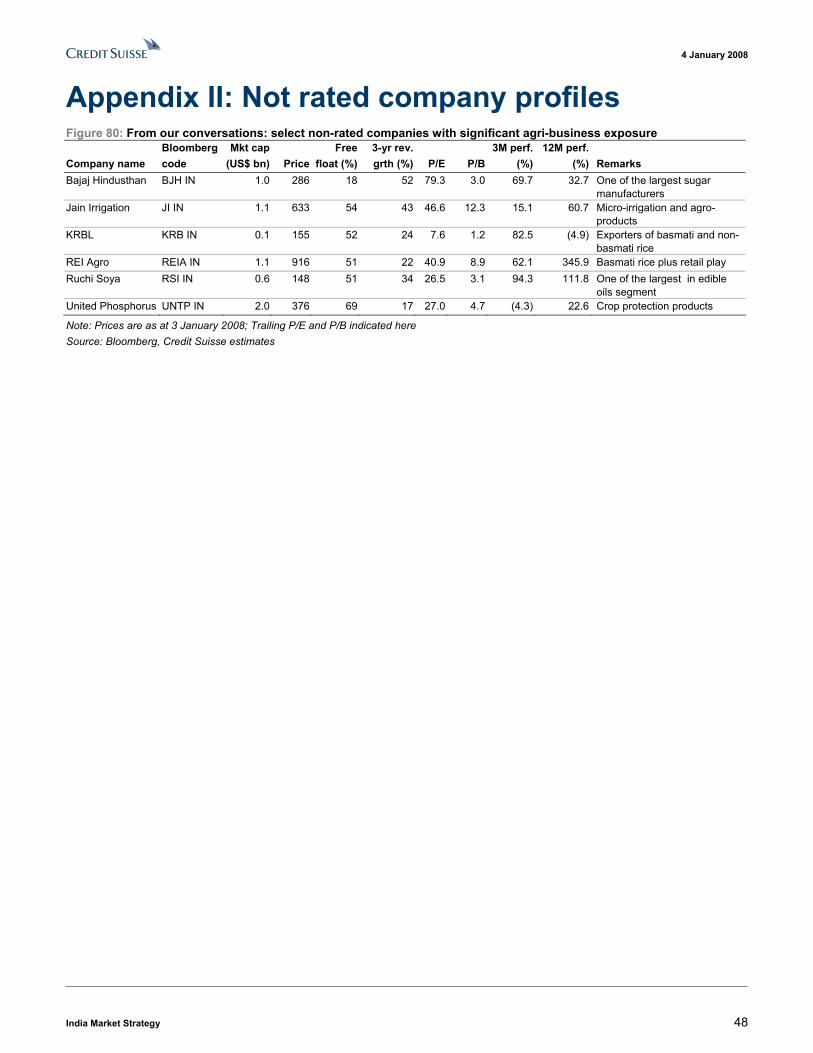
4 January 2008
India Market Strategy 48
Appendix II: Not rated company profiles Figure 80: From our conversations: select non-rated companies with significant agri-business exposure Bloomberg Mkt cap Free 3-yr rev. 3M perf. 12M perf. Company name code (US$ bn) Price float (%) grth (%) P/E P/B (%) (%) Remarks Bajaj Hindusthan BJH IN 1.0 286 18 52 79.3 3.0 69.7 32.7 One of the largest sugar
manufacturers Jain Irrigation JI IN 1.1 633 54 43 46.6 12.3 15.1 60.7 Micro-irrigation and agro-
products KRBL KRB IN 0.1 155 52 24 7.6 1.2 82.5 (4.9) Exporters of basmati and non-
basmati rice REI Agro REIA IN 1.1 916 51 22 40.9 8.9 62.1 345.9 Basmati rice plus retail play Ruchi Soya RSI IN 0.6 148 51 34 26.5 3.1 94.3 111.8 One of the largest in edible
oils segment United Phosphorus UNTP IN 2.0 376 69 17 27.0 4.7 (4.3) 22.6 Crop protection products
Note: Prices are as at 3 January 2008; Trailing P/E and P/B indicated here Source: Bloomberg, Credit Suisse estimates
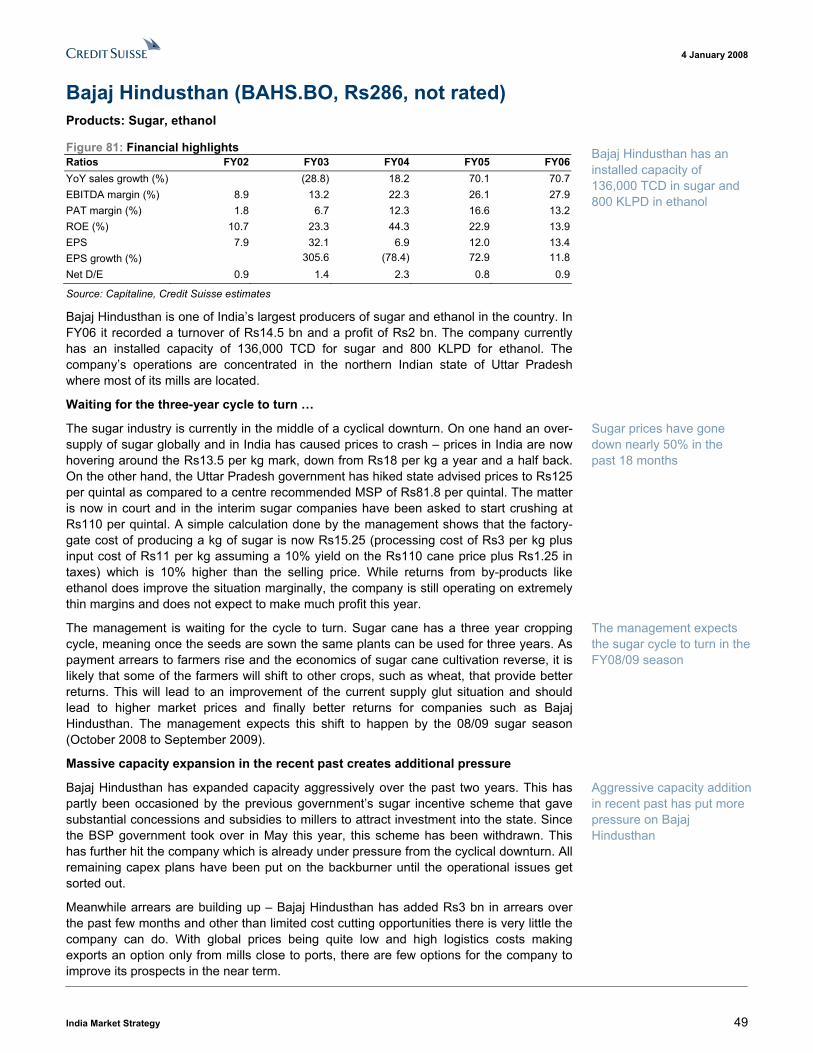
4 January 2008
India Market Strategy 49
Bajaj Hindusthan (BAHS.BO, Rs286, not rated) Products: Sugar, ethanol
Figure 81: Financial highlights Ratios FY02 FY03 FY04 FY05 FY06YoY sales growth (%) (28.8) 18.2 70.1 70.7EBITDA margin (%) 8.9 13.2 22.3 26.1 27.9PAT margin (%) 1.8 6.7 12.3 16.6 13.2ROE (%) 10.7 23.3 44.3 22.9 13.9EPS 7.9 32.1 6.9 12.0 13.4EPS growth (%) 305.6 (78.4) 72.9 11.8Net D/E 0.9 1.4 2.3 0.8 0.9
Source: Capitaline, Credit Suisse estimates
Bajaj Hindusthan is one of India�s largest producers of sugar and ethanol in the country. In FY06 it recorded a turnover of Rs14.5 bn and a profit of Rs2 bn. The company currently has an installed capacity of 136,000 TCD for sugar and 800 KLPD for ethanol. The company�s operations are concentrated in the northern Indian state of Uttar Pradesh where most of its mills are located.
Waiting for the three-year cycle to turn �
The sugar industry is currently in the middle of a cyclical downturn. On one hand an over-supply of sugar globally and in India has caused prices to crash � prices in India are now hovering around the Rs13.5 per kg mark, down from Rs18 per kg a year and a half back. On the other hand, the Uttar Pradesh government has hiked state advised prices to Rs125 per quintal as compared to a centre recommended MSP of Rs81.8 per quintal. The matter is now in court and in the interim sugar companies have been asked to start crushing at Rs110 per quintal. A simple calculation done by the management shows that the factory-gate cost of producing a kg of sugar is now Rs15.25 (processing cost of Rs3 per kg plus input cost of Rs11 per kg assuming a 10% yield on the Rs110 cane price plus Rs1.25 in taxes) which is 10% higher than the selling price. While returns from by-products like ethanol does improve the situation marginally, the company is still operating on extremely thin margins and does not expect to make much profit this year.
The management is waiting for the cycle to turn. Sugar cane has a three year cropping cycle, meaning once the seeds are sown the same plants can be used for three years. As payment arrears to farmers rise and the economics of sugar cane cultivation reverse, it is likely that some of the farmers will shift to other crops, such as wheat, that provide better returns. This will lead to an improvement of the current supply glut situation and should lead to higher market prices and finally better returns for companies such as Bajaj Hindusthan. The management expects this shift to happen by the 08/09 sugar season (October 2008 to September 2009).
Massive capacity expansion in the recent past creates additional pressure
Bajaj Hindusthan has expanded capacity aggressively over the past two years. This has partly been occasioned by the previous government�s sugar incentive scheme that gave substantial concessions and subsidies to millers to attract investment into the state. Since the BSP government took over in May this year, this scheme has been withdrawn. This has further hit the company which is already under pressure from the cyclical downturn. All remaining capex plans have been put on the backburner until the operational issues get sorted out.
Meanwhile arrears are building up � Bajaj Hindusthan has added Rs3 bn in arrears over the past few months and other than limited cost cutting opportunities there is very little the company can do. With global prices being quite low and high logistics costs making exports an option only from mills close to ports, there are few options for the company to improve its prospects in the near term.
Bajaj Hindusthan has an installed capacity of 136,000 TCD in sugar and 800 KLPD in ethanol
Sugar prices have gone down nearly 50% in the past 18 months
The management expects the sugar cycle to turn in the FY08/09 season
Aggressive capacity addition in recent past has put more pressure on Bajaj Hindusthan
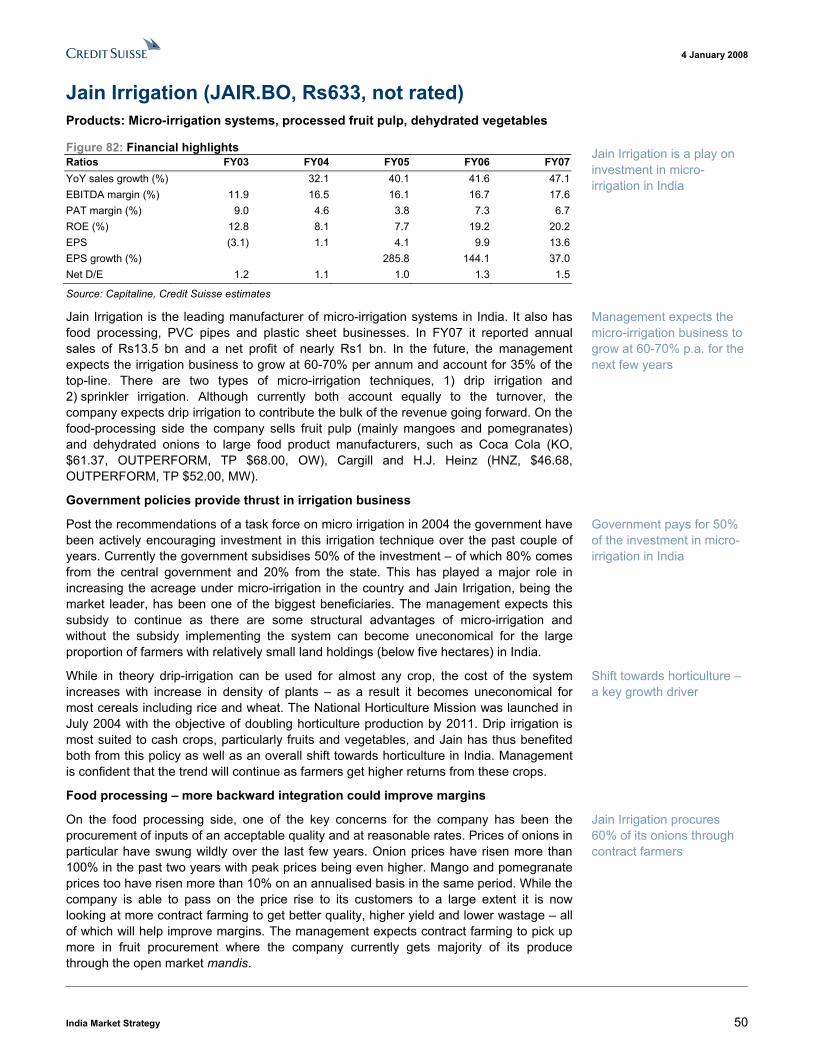
4 January 2008
India Market Strategy 50
Jain Irrigation (JAIR.BO, Rs633, not rated) Products: Micro-irrigation systems, processed fruit pulp, dehydrated vegetables
Figure 82: Financial highlights Ratios FY03 FY04 FY05 FY06 FY07YoY sales growth (%) 32.1 40.1 41.6 47.1EBITDA margin (%) 11.9 16.5 16.1 16.7 17.6PAT margin (%) 9.0 4.6 3.8 7.3 6.7ROE (%) 12.8 8.1 7.7 19.2 20.2EPS (3.1) 1.1 4.1 9.9 13.6EPS growth (%) 285.8 144.1 37.0Net D/E 1.2 1.1 1.0 1.3 1.5
Source: Capitaline, Credit Suisse estimates
Jain Irrigation is the leading manufacturer of micro-irrigation systems in India. It also has food processing, PVC pipes and plastic sheet businesses. In FY07 it reported annual sales of Rs13.5 bn and a net profit of nearly Rs1 bn. In the future, the management expects the irrigation business to grow at 60-70% per annum and account for 35% of the top-line. There are two types of micro-irrigation techniques, 1) drip irrigation and 2) sprinkler irrigation. Although currently both account equally to the turnover, the company expects drip irrigation to contribute the bulk of the revenue going forward. On the food-processing side the company sells fruit pulp (mainly mangoes and pomegranates) and dehydrated onions to large food product manufacturers, such as Coca Cola (KO, $61.37, OUTPERFORM, TP $68.00, OW), Cargill and H.J. Heinz (HNZ, $46.68, OUTPERFORM, TP $52.00, MW).
Government policies provide thrust in irrigation business
Post the recommendations of a task force on micro irrigation in 2004 the government have been actively encouraging investment in this irrigation technique over the past couple of years. Currently the government subsidises 50% of the investment � of which 80% comes from the central government and 20% from the state. This has played a major role in increasing the acreage under micro-irrigation in the country and Jain Irrigation, being the market leader, has been one of the biggest beneficiaries. The management expects this subsidy to continue as there are some structural advantages of micro-irrigation and without the subsidy implementing the system can become uneconomical for the large proportion of farmers with relatively small land holdings (below five hectares) in India.
While in theory drip-irrigation can be used for almost any crop, the cost of the system increases with increase in density of plants � as a result it becomes uneconomical for most cereals including rice and wheat. The National Horticulture Mission was launched in July 2004 with the objective of doubling horticulture production by 2011. Drip irrigation is most suited to cash crops, particularly fruits and vegetables, and Jain has thus benefited both from this policy as well as an overall shift towards horticulture in India. Management is confident that the trend will continue as farmers get higher returns from these crops.
Food processing � more backward integration could improve margins
On the food processing side, one of the key concerns for the company has been the procurement of inputs of an acceptable quality and at reasonable rates. Prices of onions in particular have swung wildly over the last few years. Onion prices have risen more than 100% in the past two years with peak prices being even higher. Mango and pomegranate prices too have risen more than 10% on an annualised basis in the same period. While the company is able to pass on the price rise to its customers to a large extent it is now looking at more contract farming to get better quality, higher yield and lower wastage � all of which will help improve margins. The management expects contract farming to pick up more in fruit procurement where the company currently gets majority of its produce through the open market mandis.
Jain Irrigation is a play on investment in micro-irrigation in India
Management expects the micro-irrigation business to grow at 60-70% p.a. for the next few years
Government pays for 50% of the investment in micro-irrigation in India
Shift towards horticulture � a key growth driver
Jain Irrigation procures 60% of its onions through contract farmers
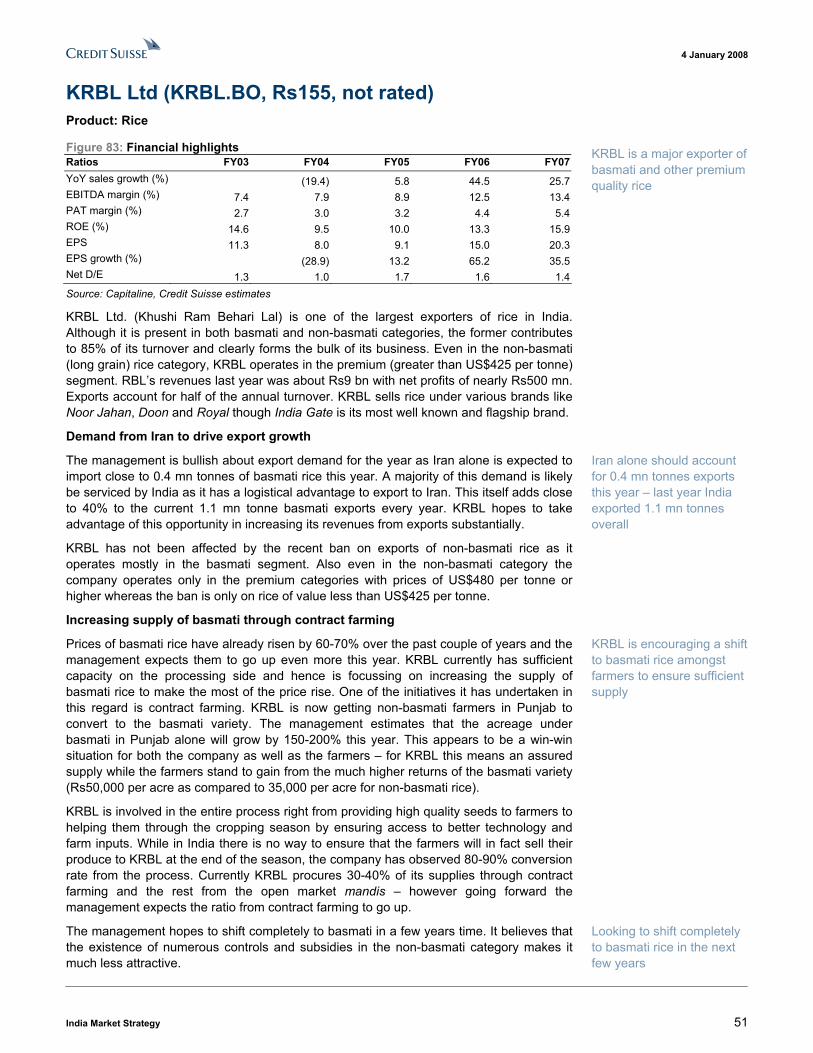
4 January 2008
India Market Strategy 51
KRBL Ltd (KRBL.BO, Rs155, not rated) Product: Rice
Figure 83: Financial highlights Ratios FY03 FY04 FY05 FY06 FY07YoY sales growth (%) (19.4) 5.8 44.5 25.7EBITDA margin (%) 7.4 7.9 8.9 12.5 13.4PAT margin (%) 2.7 3.0 3.2 4.4 5.4ROE (%) 14.6 9.5 10.0 13.3 15.9EPS 11.3 8.0 9.1 15.0 20.3EPS growth (%) (28.9) 13.2 65.2 35.5Net D/E 1.3 1.0 1.7 1.6 1.4Source: Capitaline, Credit Suisse estimates
KRBL Ltd. (Khushi Ram Behari Lal) is one of the largest exporters of rice in India. Although it is present in both basmati and non-basmati categories, the former contributes to 85% of its turnover and clearly forms the bulk of its business. Even in the non-basmati (long grain) rice category, KRBL operates in the premium (greater than US$425 per tonne) segment. RBL�s revenues last year was about Rs9 bn with net profits of nearly Rs500 mn. Exports account for half of the annual turnover. KRBL sells rice under various brands like Noor Jahan, Doon and Royal though India Gate is its most well known and flagship brand.
Demand from Iran to drive export growth
The management is bullish about export demand for the year as Iran alone is expected to import close to 0.4 mn tonnes of basmati rice this year. A majority of this demand is likely be serviced by India as it has a logistical advantage to export to Iran. This itself adds close to 40% to the current 1.1 mn tonne basmati exports every year. KRBL hopes to take advantage of this opportunity in increasing its revenues from exports substantially.
KRBL has not been affected by the recent ban on exports of non-basmati rice as it operates mostly in the basmati segment. Also even in the non-basmati category the company operates only in the premium categories with prices of US$480 per tonne or higher whereas the ban is only on rice of value less than US$425 per tonne.
Increasing supply of basmati through contract farming
Prices of basmati rice have already risen by 60-70% over the past couple of years and the management expects them to go up even more this year. KRBL currently has sufficient capacity on the processing side and hence is focussing on increasing the supply of basmati rice to make the most of the price rise. One of the initiatives it has undertaken in this regard is contract farming. KRBL is now getting non-basmati farmers in Punjab to convert to the basmati variety. The management estimates that the acreage under basmati in Punjab alone will grow by 150-200% this year. This appears to be a win-win situation for both the company as well as the farmers � for KRBL this means an assured supply while the farmers stand to gain from the much higher returns of the basmati variety (Rs50,000 per acre as compared to 35,000 per acre for non-basmati rice).
KRBL is involved in the entire process right from providing high quality seeds to farmers to helping them through the cropping season by ensuring access to better technology and farm inputs. While in India there is no way to ensure that the farmers will in fact sell their produce to KRBL at the end of the season, the company has observed 80-90% conversion rate from the process. Currently KRBL procures 30-40% of its supplies through contract farming and the rest from the open market mandis � however going forward the management expects the ratio from contract farming to go up.
The management hopes to shift completely to basmati in a few years time. It believes that the existence of numerous controls and subsidies in the non-basmati category makes it much less attractive.
KRBL is a major exporter of basmati and other premium quality rice
Iran alone should account for 0.4 mn tonnes exports this year � last year India exported 1.1 mn tonnes overall
KRBL is encouraging a shift to basmati rice amongst farmers to ensure sufficient supply
Looking to shift completely to basmati rice in the next few years
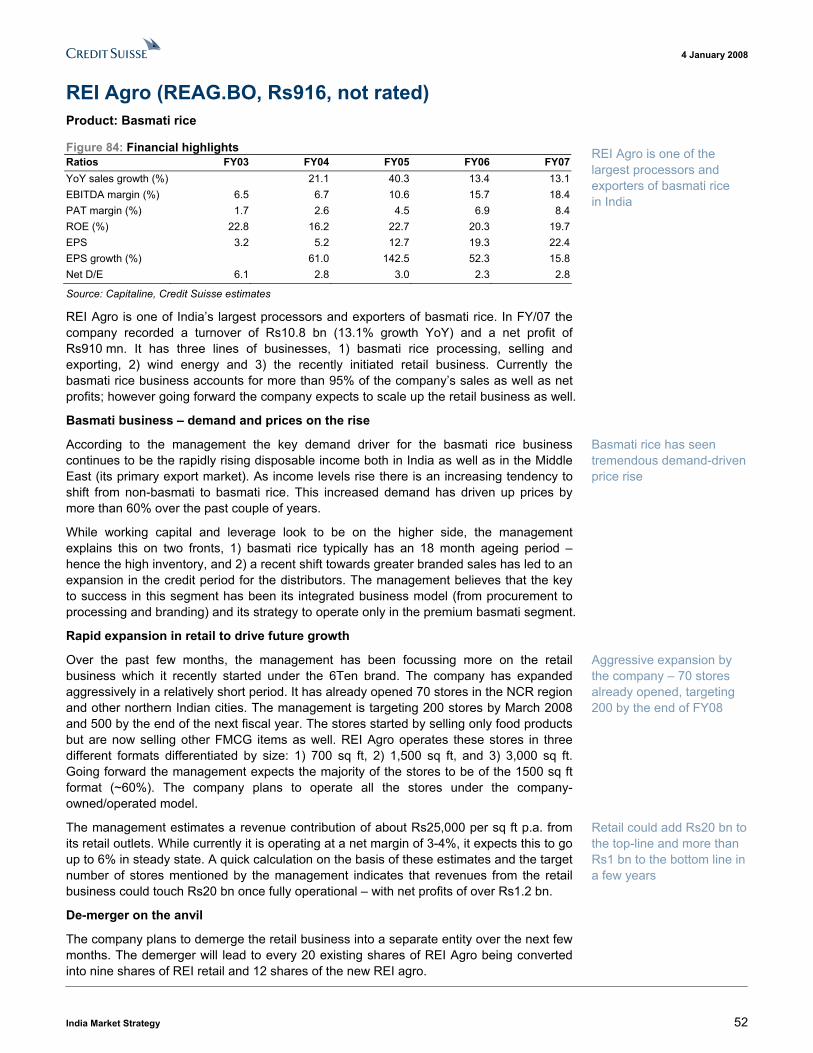
4 January 2008
India Market Strategy 52
REI Agro (REAG.BO, Rs916, not rated) Product: Basmati rice
Figure 84: Financial highlights Ratios FY03 FY04 FY05 FY06 FY07YoY sales growth (%) 21.1 40.3 13.4 13.1EBITDA margin (%) 6.5 6.7 10.6 15.7 18.4PAT margin (%) 1.7 2.6 4.5 6.9 8.4ROE (%) 22.8 16.2 22.7 20.3 19.7EPS 3.2 5.2 12.7 19.3 22.4EPS growth (%) 61.0 142.5 52.3 15.8Net D/E 6.1 2.8 3.0 2.3 2.8
Source: Capitaline, Credit Suisse estimates
REI Agro is one of India�s largest processors and exporters of basmati rice. In FY/07 the company recorded a turnover of Rs10.8 bn (13.1% growth YoY) and a net profit of Rs910 mn. It has three lines of businesses, 1) basmati rice processing, selling and exporting, 2) wind energy and 3) the recently initiated retail business. Currently the basmati rice business accounts for more than 95% of the company�s sales as well as net profits; however going forward the company expects to scale up the retail business as well.
Basmati business � demand and prices on the rise
According to the management the key demand driver for the basmati rice business continues to be the rapidly rising disposable income both in India as well as in the Middle East (its primary export market). As income levels rise there is an increasing tendency to shift from non-basmati to basmati rice. This increased demand has driven up prices by more than 60% over the past couple of years.
While working capital and leverage look to be on the higher side, the management explains this on two fronts, 1) basmati rice typically has an 18 month ageing period � hence the high inventory, and 2) a recent shift towards greater branded sales has led to an expansion in the credit period for the distributors. The management believes that the key to success in this segment has been its integrated business model (from procurement to processing and branding) and its strategy to operate only in the premium basmati segment.
Rapid expansion in retail to drive future growth
Over the past few months, the management has been focussing more on the retail business which it recently started under the 6Ten brand. The company has expanded aggressively in a relatively short period. It has already opened 70 stores in the NCR region and other northern Indian cities. The management is targeting 200 stores by March 2008 and 500 by the end of the next fiscal year. The stores started by selling only food products but are now selling other FMCG items as well. REI Agro operates these stores in three different formats differentiated by size: 1) 700 sq ft, 2) 1,500 sq ft, and 3) 3,000 sq ft. Going forward the management expects the majority of the stores to be of the 1500 sq ft format (~60%). The company plans to operate all the stores under the company-owned/operated model.
The management estimates a revenue contribution of about Rs25,000 per sq ft p.a. from its retail outlets. While currently it is operating at a net margin of 3-4%, it expects this to go up to 6% in steady state. A quick calculation on the basis of these estimates and the target number of stores mentioned by the management indicates that revenues from the retail business could touch Rs20 bn once fully operational � with net profits of over Rs1.2 bn.
De-merger on the anvil
The company plans to demerge the retail business into a separate entity over the next few months. The demerger will lead to every 20 existing shares of REI Agro being converted into nine shares of REI retail and 12 shares of the new REI agro.
REI Agro is one of the largest processors and exporters of basmati rice in India
Basmati rice has seen tremendous demand-driven price rise
Aggressive expansion by the company � 70 stores already opened, targeting 200 by the end of FY08
Retail could add Rs20 bn to the top-line and more than Rs1 bn to the bottom line in a few years
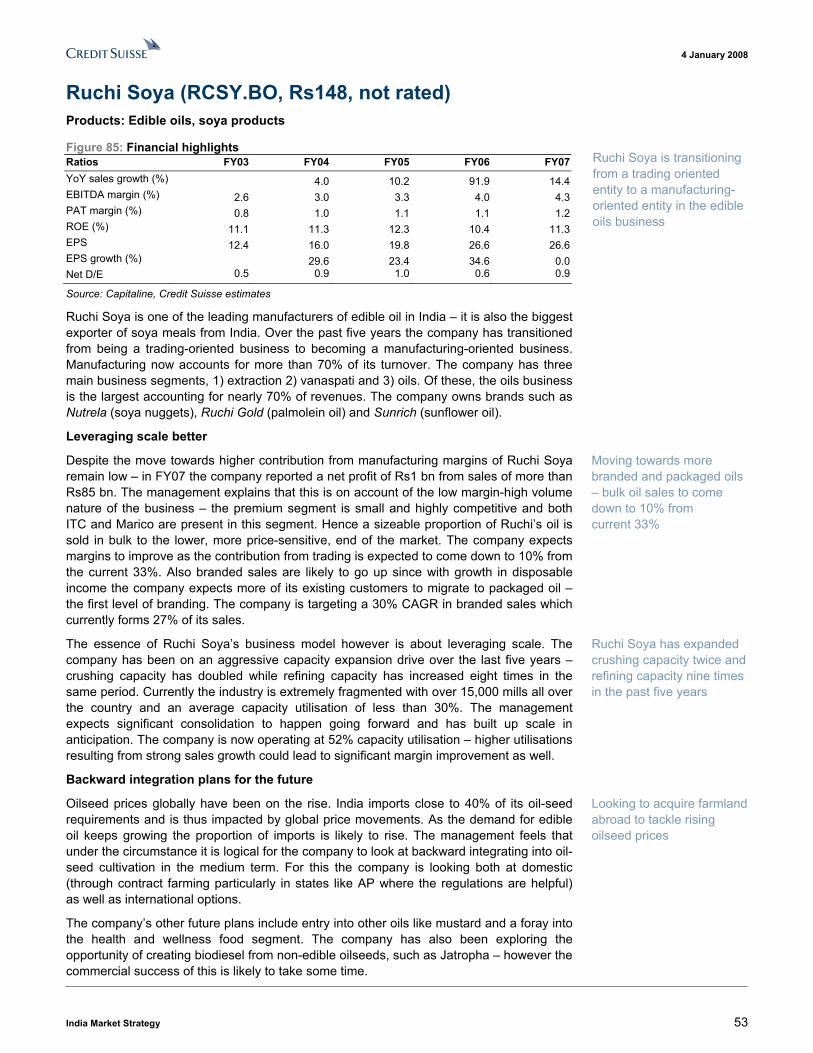
4 January 2008
India Market Strategy 53
Ruchi Soya (RCSY.BO, Rs148, not rated) Products: Edible oils, soya products
Figure 85: Financial highlights Ratios FY03 FY04 FY05 FY06 FY07YoY sales growth (%) 4.0 10.2 91.9 14.4EBITDA margin (%) 2.6 3.0 3.3 4.0 4.3PAT margin (%) 0.8 1.0 1.1 1.1 1.2ROE (%) 11.1 11.3 12.3 10.4 11.3EPS 12.4 16.0 19.8 26.6 26.6EPS growth (%) 29.6 23.4 34.6 0.0Net D/E 0.5 0.9 1.0 0.6 0.9
Source: Capitaline, Credit Suisse estimates
Ruchi Soya is one of the leading manufacturers of edible oil in India � it is also the biggest exporter of soya meals from India. Over the past five years the company has transitioned from being a trading-oriented business to becoming a manufacturing-oriented business. Manufacturing now accounts for more than 70% of its turnover. The company has three main business segments, 1) extraction 2) vanaspati and 3) oils. Of these, the oils business is the largest accounting for nearly 70% of revenues. The company owns brands such as Nutrela (soya nuggets), Ruchi Gold (palmolein oil) and Sunrich (sunflower oil).
Leveraging scale better
Despite the move towards higher contribution from manufacturing margins of Ruchi Soya remain low � in FY07 the company reported a net profit of Rs1 bn from sales of more than Rs85 bn. The management explains that this is on account of the low margin-high volume nature of the business � the premium segment is small and highly competitive and both ITC and Marico are present in this segment. Hence a sizeable proportion of Ruchi�s oil is sold in bulk to the lower, more price-sensitive, end of the market. The company expects margins to improve as the contribution from trading is expected to come down to 10% from the current 33%. Also branded sales are likely to go up since with growth in disposable income the company expects more of its existing customers to migrate to packaged oil � the first level of branding. The company is targeting a 30% CAGR in branded sales which currently forms 27% of its sales.
The essence of Ruchi Soya�s business model however is about leveraging scale. The company has been on an aggressive capacity expansion drive over the last five years � crushing capacity has doubled while refining capacity has increased eight times in the same period. Currently the industry is extremely fragmented with over 15,000 mills all over the country and an average capacity utilisation of less than 30%. The management expects significant consolidation to happen going forward and has built up scale in anticipation. The company is now operating at 52% capacity utilisation � higher utilisations resulting from strong sales growth could lead to significant margin improvement as well.
Backward integration plans for the future
Oilseed prices globally have been on the rise. India imports close to 40% of its oil-seed requirements and is thus impacted by global price movements. As the demand for edible oil keeps growing the proportion of imports is likely to rise. The management feels that under the circumstance it is logical for the company to look at backward integrating into oil-seed cultivation in the medium term. For this the company is looking both at domestic (through contract farming particularly in states like AP where the regulations are helpful) as well as international options.
The company�s other future plans include entry into other oils like mustard and a foray into the health and wellness food segment. The company has also been exploring the opportunity of creating biodiesel from non-edible oilseeds, such as Jatropha � however the commercial success of this is likely to take some time.
Ruchi Soya is transitioning from a trading oriented entity to a manufacturing-oriented entity in the edible oils business
Moving towards more branded and packaged oils � bulk oil sales to come down to 10% from current 33%
Ruchi Soya has expanded crushing capacity twice and refining capacity nine times in the past five years
Looking to acquire farmland abroad to tackle rising oilseed prices
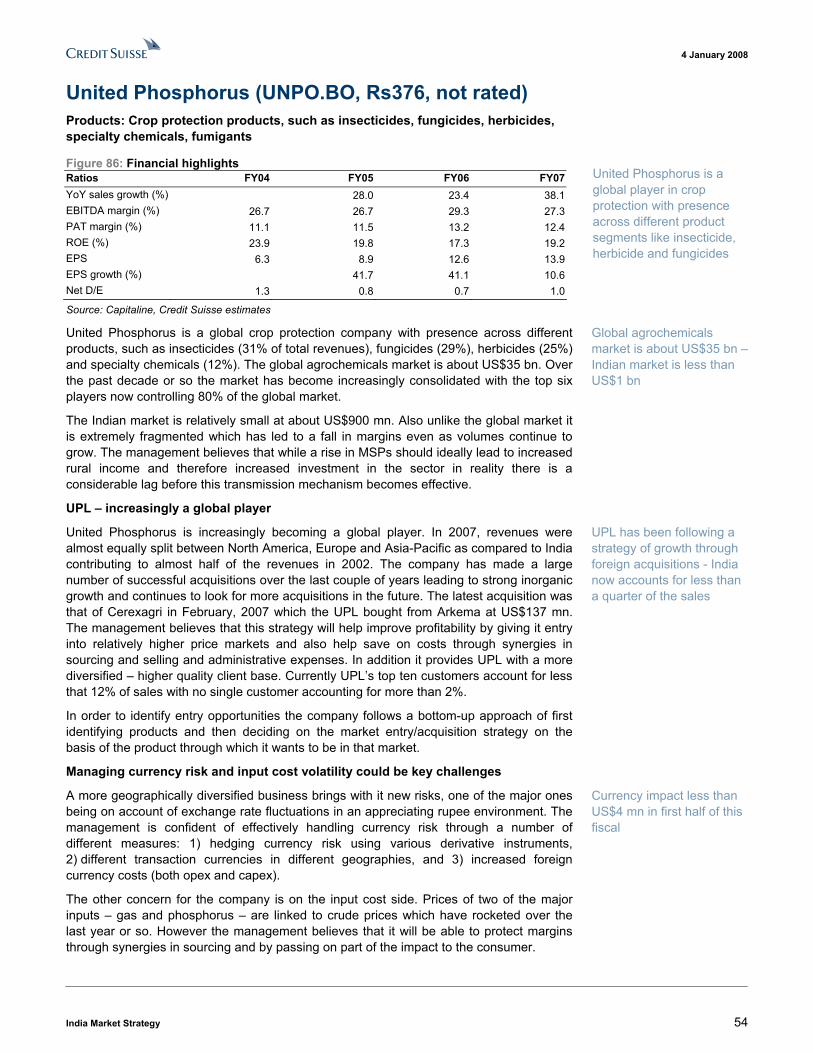
4 January 2008
India Market Strategy 54
United Phosphorus (UNPO.BO, Rs376, not rated) Products: Crop protection products, such as insecticides, fungicides, herbicides, specialty chemicals, fumigants
Figure 86: Financial highlights Ratios FY04 FY05 FY06 FY07YoY sales growth (%) 28.0 23.4 38.1EBITDA margin (%) 26.7 26.7 29.3 27.3PAT margin (%) 11.1 11.5 13.2 12.4ROE (%) 23.9 19.8 17.3 19.2EPS 6.3 8.9 12.6 13.9EPS growth (%) 41.7 41.1 10.6Net D/E 1.3 0.8 0.7 1.0
Source: Capitaline, Credit Suisse estimates
United Phosphorus is a global crop protection company with presence across different products, such as insecticides (31% of total revenues), fungicides (29%), herbicides (25%) and specialty chemicals (12%). The global agrochemicals market is about US$35 bn. Over the past decade or so the market has become increasingly consolidated with the top six players now controlling 80% of the global market.
The Indian market is relatively small at about US$900 mn. Also unlike the global market it is extremely fragmented which has led to a fall in margins even as volumes continue to grow. The management believes that while a rise in MSPs should ideally lead to increased rural income and therefore increased investment in the sector in reality there is a considerable lag before this transmission mechanism becomes effective.
UPL � increasingly a global player
United Phosphorus is increasingly becoming a global player. In 2007, revenues were almost equally split between North America, Europe and Asia-Pacific as compared to India contributing to almost half of the revenues in 2002. The company has made a large number of successful acquisitions over the last couple of years leading to strong inorganic growth and continues to look for more acquisitions in the future. The latest acquisition was that of Cerexagri in February, 2007 which the UPL bought from Arkema at US$137 mn. The management believes that this strategy will help improve profitability by giving it entry into relatively higher price markets and also help save on costs through synergies in sourcing and selling and administrative expenses. In addition it provides UPL with a more diversified � higher quality client base. Currently UPL�s top ten customers account for less that 12% of sales with no single customer accounting for more than 2%.
In order to identify entry opportunities the company follows a bottom-up approach of first identifying products and then deciding on the market entry/acquisition strategy on the basis of the product through which it wants to be in that market.
Managing currency risk and input cost volatility could be key challenges
A more geographically diversified business brings with it new risks, one of the major ones being on account of exchange rate fluctuations in an appreciating rupee environment. The management is confident of effectively handling currency risk through a number of different measures: 1) hedging currency risk using various derivative instruments, 2) different transaction currencies in different geographies, and 3) increased foreign currency costs (both opex and capex).
The other concern for the company is on the input cost side. Prices of two of the major inputs � gas and phosphorus � are linked to crude prices which have rocketed over the last year or so. However the management believes that it will be able to protect margins through synergies in sourcing and by passing on part of the impact to the consumer.
United Phosphorus is a global player in crop protection with presence across different product segments like insecticide, herbicide and fungicides
Global agrochemicals market is about US$35 bn � Indian market is less than US$1 bn
UPL has been following a strategy of growth through foreign acquisitions - India now accounts for less than a quarter of the sales
Currency impact less than US$4 mn in first half of this fiscal
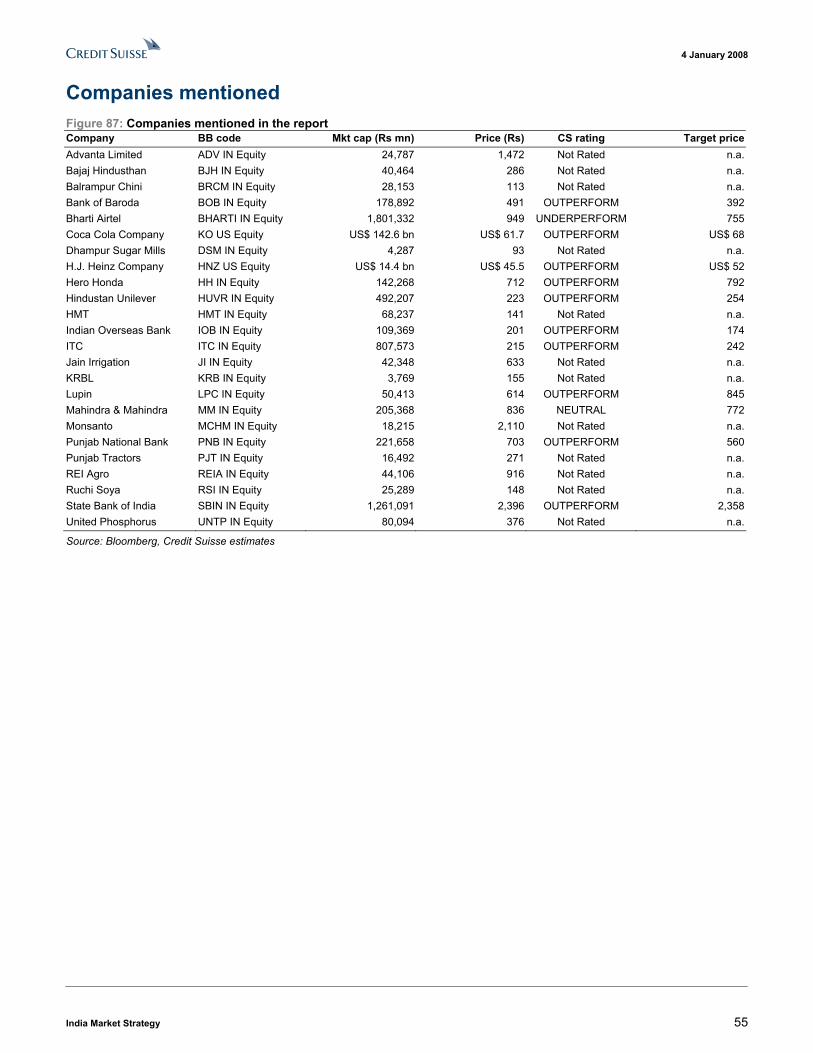
4 January 2008
India Market Strategy 55
Companies mentioned Figure 87: Companies mentioned in the report Company BB code Mkt cap (Rs mn) Price (Rs) CS rating Target priceAdvanta Limited ADV IN Equity 24,787 1,472 Not Rated n.a.Bajaj Hindusthan BJH IN Equity 40,464 286 Not Rated n.a.Balrampur Chini BRCM IN Equity 28,153 113 Not Rated n.a.Bank of Baroda BOB IN Equity 178,892 491 OUTPERFORM 392Bharti Airtel BHARTI IN Equity 1,801,332 949 UNDERPERFORM 755Coca Cola Company KO US Equity US$ 142.6 bn US$ 61.7 OUTPERFORM US$ 68Dhampur Sugar Mills DSM IN Equity 4,287 93 Not Rated n.a.H.J. Heinz Company HNZ US Equity US$ 14.4 bn US$ 45.5 OUTPERFORM US$ 52Hero Honda HH IN Equity 142,268 712 OUTPERFORM 792Hindustan Unilever HUVR IN Equity 492,207 223 OUTPERFORM 254HMT HMT IN Equity 68,237 141 Not Rated n.a.Indian Overseas Bank IOB IN Equity 109,369 201 OUTPERFORM 174ITC ITC IN Equity 807,573 215 OUTPERFORM 242Jain Irrigation JI IN Equity 42,348 633 Not Rated n.a.KRBL KRB IN Equity 3,769 155 Not Rated n.a.Lupin LPC IN Equity 50,413 614 OUTPERFORM 845Mahindra & Mahindra MM IN Equity 205,368 836 NEUTRAL 772Monsanto MCHM IN Equity 18,215 2,110 Not Rated n.a.Punjab National Bank PNB IN Equity 221,658 703 OUTPERFORM 560Punjab Tractors PJT IN Equity 16,492 271 Not Rated n.a.REI Agro REIA IN Equity 44,106 916 Not Rated n.a.Ruchi Soya RSI IN Equity 25,289 148 Not Rated n.a.State Bank of India SBIN IN Equity 1,261,091 2,396 OUTPERFORM 2,358United Phosphorus UNTP IN Equity 80,094 376 Not Rated n.a.
Source: Bloomberg, Credit Suisse estimates

4 January 2008
India Market Strategy 56

4 January 2008
India Market Strategy 57
4 January 2008
India Market Strategy 58
Disclosure Appendix Important Global Disclosures Nilesh Jasani & Arya Sen each certify, with respect to the companies or securities that he or she analyzes, that (1) the views expressed in this report accurately reflect his or her personal views about all of the subject companies and securities and (2) no part of his or her compensation was, is or will be directly or indirectly related to the specific recommendations or views expressed in this report. The analyst(s) responsible for preparing this research report received compensation that is based upon various factors including Credit Suisse's total revenues, a portion of which are generated by Credit Suisse's investment banking activities. Vinod Chari, the Research Analyst for Reliance Energy, holds one share of Reliance Energy (RLEN.BO). Analysts� stock ratings are defined as follows***: Outperform: The stock�s total return is expected to exceed the industry average* by at least 10-15% (or more, depending on perceived risk) over the next 12 months. Neutral: The stock�s total return is expected to be in line with the industry average* (range of ±10%) over the next 12 months. Underperform**: The stock�s total return is expected to underperform the industry average* by 10-15% or more over the next 12 months.
*The industry average refers to the average total return of the analyst's industry coverage universe (except with respect to Asia/Pacific, Latin America and Emerging Markets, where stock ratings are relative to the relevant country index. **In an effort to achieve a more balanced distribution of stock ratings, the Firm has requested that analysts maintain at least 15% of their rated coverage universe as Underperform. This guideline is subject to change depending on several factors, including general market conditions. ***For Australian and New Zealand stocks a 7.5% threshold replaces the 10% level in all three rating definitions, with a required equity return overlay applied.
Restricted: In certain circumstances, Credit Suisse policy and/or applicable law and regulations preclude certain types of communications, including an investment recommendation, during the course of Credit Suisse's engagement in an investment banking transaction and in certain other circumstances. Volatility Indicator [V]: A stock is defined as volatile if the stock price has moved up or down by 20% or more in a month in at least 8 of the past 24 months or the analyst expects significant volatility going forward.
Analysts� coverage universe weightings are distinct from analysts� stock ratings and are based on the expected performance of an analyst�s coverage universe* versus the relevant broad market benchmark**: Overweight: Industry expected to outperform the relevant broad market benchmark over the next 12 months. Market Weight: Industry expected to perform in-line with the relevant broad market benchmark over the next 12 months. Underweight: Industry expected to underperform the relevant broad market benchmark over the next 12 months. *An analyst�s coverage universe consists of all companies covered by the analyst within the relevant sector. **The broad market benchmark is based on the expected return of the local market index (e.g., the S&P 500 in the U.S.) over the next 12 months. Credit Suisse�s distribution of stock ratings (and banking clients) is:
Global Ratings Distribution Outperform/Buy* 46% (58% banking clients) Neutral/Hold* 40% (58% banking clients) Underperform/Sell* 12% (54% banking clients) Restricted 2%
*For purposes of the NYSE and NASD ratings distribution disclosure requirements, our stock ratings of Outperform, Neutral, and Underperform most closely correspond to Buy, Hold, and Sell, respectively; however, the meanings are not the same, as our stock ratings are determined on a relative basis. (Please refer to definitions above.) An investor's decision to buy or sell a security should be based on investment objectives, current holdings, and other individual factors.
Credit Suisse�s policy is to update research reports as it deems appropriate, based on developments with the subject company, the sector or the market that may have a material impact on the research views or opinions stated herein. Credit Suisse's policy is only to publish investment research that is impartial, independent, clear, fair and not misleading. For more detail please refer to Credit Suisse's Policies for Managing Conflicts of Interest in connection with Investment Research: http://www.csfb.com/research-and-analytics/disclaimer/managing_conflicts_disclaimer.html Credit Suisse does not provide any tax advice. Any statement herein regarding any US federal tax is not intended or written to be used, and cannot be used, by any taxpayer for the purposes of avoiding any penalties. Important Regional Disclosures Restrictions on certain Canadian securities are indicated by the following abbreviations: NVS--Non-Voting shares; RVS--Restricted Voting Shares; SVS--Subordinate Voting Shares. Individuals receiving this report from a Canadian investment dealer that is not affiliated with Credit Suisse should be advised that this report may not contain regulatory disclosures the non-affiliated Canadian investment dealer would be required to make if this were its own report. For Credit Suisse Securities (Canada), Inc.'s policies and procedures regarding the dissemination of equity research, please visit http://www.csfb.com/legal_terms/canada_research_policy.shtml. As of the date of this report, Credit Suisse acts as a market maker or liquidity provider in the equities securities that are the subject of this report. Principal is not guaranteed in the case of equities because equity prices are variable. Commission is the commission rate or the amount agreed with a customer when setting up an account or at anytime after that.
4 January 2008
India Market Strategy 59
For Credit Suisse disclosure information on other companies mentioned in this report, please visit the website at www.credit-suisse.com/researchdisclosures or call +1 (877) 291-2683. Disclaimers continue on next page.
4 January 2008Asia Pacific / IndiaEquity Research
IA0074.doc
This report is not directed to, or intended for distribution to or use by, any person or entity who is a citizen or resident of or located in any locality, state, country or other jurisdiction where such distribution, publication, availability or use would be contrary to law or regulation or which would subject Credit Suisse, the Swiss bank, or its subsidiaries or its affiliates (�CS�) to any registration or licensing requirement within such jurisdiction. All material presented in this report, unless specifically indicated otherwise, is under copyright to CS. None of the material, nor its content, nor any copy of it, may be altered in any way, transmitted to, copied or distributed to any other party, without the prior express written permission of CS. All trademarks, service marks and logos used in this report are trademarks or service marks or registered trademarks or service marks of CS or its affiliates. The information, tools and material presented in this report are provided to you for information purposes only and are not to be used or considered as an offer or the solicitation of an offer to sell or to buy or subscribe for securities or other financial instruments. CS may not have taken any steps to ensure that the securities referred to in this report are suitable for any particular investor. CS will not treat recipients as its customers by virtue of their receiving the report. The investments or services contained or referred to in this report may not be suitable for you and it is recommended that you consult an independent investment advisor if you are in doubt about such investments or investment services. Nothing in this report constitutes investment, legal, accounting or tax advice or a representation that any investment or strategy is suitable or appropriate to your individual circumstances or otherwise constitutes a personal recommendation to you. CS does not offer advice on the tax consequences of investment and you are advised to contact an independent tax adviser. Please note in particular that the bases and levels of taxation may change. CS believes the information and opinions in the Disclosure Appendix of this report are accurate and complete. Information and opinions presented in the other sections of the report were obtained or derived from sources CS believes are reliable, but CS makes no representations as to their accuracy or completeness. Additional information is available upon request. CS accepts no liability for loss arising from the use of the material presented in this report, except that this exclusion of liability does not apply to the extent that liability arises under specific statutes or regulations applicable to CS. This report is not to be relied upon in substitution for the exercise of independent judgment. CS may have issued, and may in the future issue, a trading call regarding this security. Trading calls are short term trading opportunities based on market events and catalysts, while stock ratings reflect investment recommendations based on expected total return over a 12-month period relative to the relevant coverage universe. Because trading calls and stock ratings reflect different assumptions and analytical methods, trading calls may differ directionally from the stock rating. In addition, CS may have issued, and may in the future issue, other reports that are inconsistent with, and reach different conclusions from, the information presented in this report. Those reports reflect the different assumptions, views and analytical methods of the analysts who prepared them and CS is under no obligation to ensure that such other reports are brought to the attention of any recipient of this report. CS is involved in many businesses that relate to companies mentioned in this report. These businesses include specialized trading, risk arbitrage, market making, and other proprietary trading. Past performance should not be taken as an indication or guarantee of future performance, and no representation or warranty, express or implied, is made regarding future performance. Information, opinions and estimates contained in this report reflect a judgement at its original date of publication by CS and are subject to change without notice. The price, value of and income from any of the securities or financial instruments mentioned in this report can fall as well as rise. The value of securities and financial instruments is subject to exchange rate fluctuation that may have a positive or adverse effect on the price or income of such securities or financial instruments. Investors in securities such as ADR�s, the values of which are influenced by currency volatility, effectively assume this risk. Structured securities are complex instruments, typically involve a high degree of risk and are intended for sale only to sophisticated investors who are capable of understanding and assuming the risks involved. The market value of any structured security may be affected by changes in economic, financial and political factors (including, but not limited to, spot and forward interest and exchange rates), time to maturity, market conditions and volatility, and the credit quality of any issuer or reference issuer. Any investor interested in purchasing a structured product should conduct their own investigation and analysis of the product and consult with their own professional advisers as to the risks involved in making such a purchase. Some investments discussed in this report have a high level of volatility. High volatility investments may experience sudden and large falls in their value causing losses when that investment is realised. Those losses may equal your original investment. Indeed, in the case of some investments the potential losses may exceed the amount of initial investment, in such circumstances you may be required to pay more money to support those losses. Income yields from investments may fluctuate and, in consequence, initial capital paid to make the investment may be used as part of that income yield. Some investments may not be readily realisable and it may be difficult to sell or realise those investments, similarly it may prove difficult for you to obtain reliable information about the value, or risks, to which such an investment is exposed. This report may provide the addresses of, or contain hyperlinks to, websites. Except to the extent to which the report refers to website material of CS, CS has not reviewed the linked site and takes no responsibility for the content contained therein. Such address or hyperlink (including addresses or hyperlinks to CS�s own website material) is provided solely for your convenience and information and the content of the linked site does not in any way form part of this document. Accessing such website or following such link through this report or CS�s website shall be at your own risk. This report is issued and distributed in Europe (except Switzerland) by Credit Suisse Securities (Europe) Limited, One Cabot Square, London E14 4QJ, England, which is regulated in the United Kingdom by The Financial Services Authority (�FSA�). This report is being distributed in Germany by Credit Suisse Securities (Europe) Limited Niederlassung Frankfurt am Main regulated by the Bundesanstalt fuer Finanzdienstleistungsaufsicht ("BaFin"). This report is being distributed in the United States by Credit Suisse Securities (USA) LLC ; in Switzerland by Credit Suisse; in Canada by Credit Suisse Securities (Canada), Inc..; in Brazil by Banco de Investimentos Credit Suisse (Brasil) S.A.; in Japan by Credit Suisse Securities (Japan) Limited, Financial Instrument Dealers, Director of Kanto Local Finance Bureau (Financial Instruments) Number 66, a member of Japan Securities Dealers Association, The Financial Futures Association of Japan; elsewhere in Asia/Pacific by whichever of the following is the appropriately authorised entity in the relevant jurisdiction: Credit Suisse (Hong Kong) Limited, Credit Suisse Equities (Australia) Limited , Credit Suisse Securities (Thailand) Limited, Credit Suisse Securities (Malaysia) Sdn Bhd, Credit Suisse Singapore Branch and elsewhere in the world by the relevant authorised affiliate of the above. Research on Taiwanese securities produced by Credit Suisse Taipei Branch has been prepared by a registered Senior Business Person. Research provided to residents of Malaysia is authorised by the Head of Research for Credit Suisse Securities (Malaysia) Sdn. Bhd., to whom they should direct any queries on +603 2723 2020. In jurisdictions where CS is not already registered or licensed to trade in securities, transactions will only be effected in accordance with applicable securities legislation, which will vary from jurisdiction to jurisdiction and may require that the trade be made in accordance with applicable exemptions from registration or licensing requirements. Non-U.S. customers wishing to effect a transaction should contact a CS entity in their local jurisdiction unless governing law permits otherwise. U.S. customers wishing to effect a transaction should do so only by contacting a representative at Credit Suisse Securities (USA) LLC in the U.S. Please note that this report was originally prepared and issued by CS for distribution to their market professional and institutional investor customers. Recipients who are not market professional or institutional investor customers of CS should seek the advice of their independent financial advisor prior to taking any investment decision based on this report or for any necessary explanation of its contents. This research may relate to investments or services of a person outside of the UK or to other matters which are not regulated by the FSA or in respect of which the protections of the FSA for private customers and/or the UK compensation scheme may not be available, and further details as to where this may be the case are available upon request in respect of this report. Any Nielsen Media Research material contained in this report represents Nielsen Media Research's estimates and does not represent facts. NMR has neither reviewed nor approved this report and/or any of the statements made herein. Copyright 2008 CREDIT SUISSE and/or its affiliates. All rights reserved.
CREDIT SUISSE (Hong Kong) Limited Asia/Pacific: +852 2101-6000