
Jack Henry & Associates, Inc. Dealing with Risks in the ...© 2016 Jack Henry & Associates, Inc.®...
39
© 2016 Jack Henry & Associates, Inc. ® 1 © 2016 Jack Henry & Associates, Inc. ® Dealing with Risks in the Financial Industry Tom Williams June 15, 2016 Jack Henry & Associates, Inc. ®
Transcript of Jack Henry & Associates, Inc. Dealing with Risks in the ...© 2016 Jack Henry & Associates, Inc.®...
© 2016 Jack Henry & Associates, Inc.®1 © 2016 Jack Henry & Associates, Inc.®
Dealing with Risks in the Financial IndustryTom Williams
June 15, 2016
Jack Henry & Associates, Inc.®

© 2016 Jack Henry & Associates, Inc.®2
Banking is a Risky Business
RISK
INTERNAL
EXTERNAL
© 2016 Jack Henry & Associates, Inc.®3
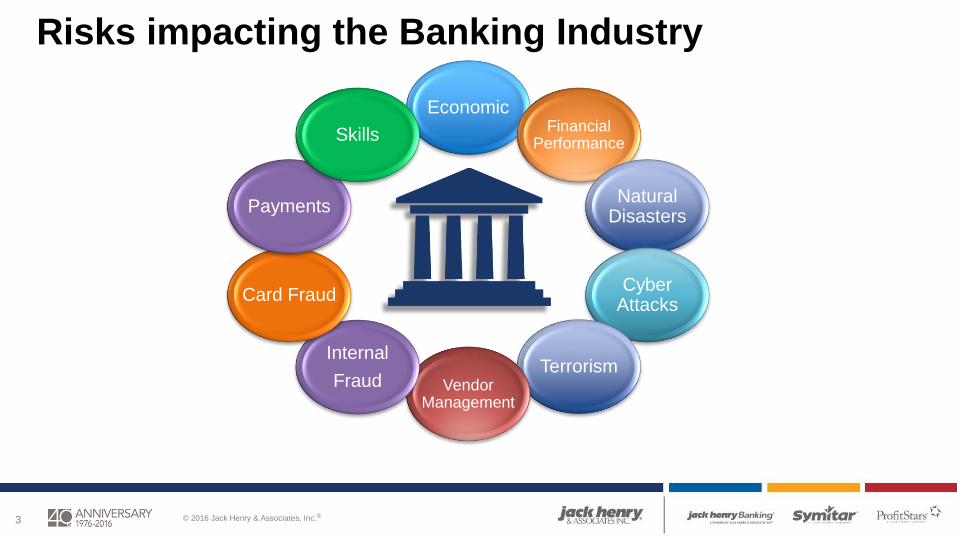
Risks impacting the Banking Industry
EconomicFinancial
Performance
Natural Disasters
Cyber Attacks
TerrorismVendor
Management
Internal
Fraud
Card Fraud
Payments
Skills
© 2016 Jack Henry & Associates, Inc.®4
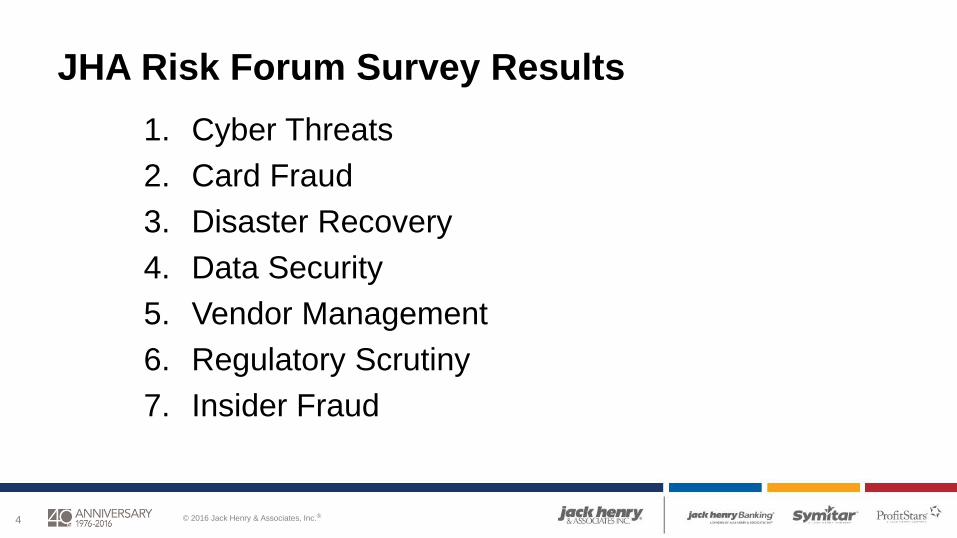
JHA Risk Forum Survey Results
1. Cyber Threats
2. Card Fraud
3. Disaster Recovery
4. Data Security
5. Vendor Management
6. Regulatory Scrutiny
7. Insider Fraud
© 2016 Jack Henry & Associates, Inc.®5
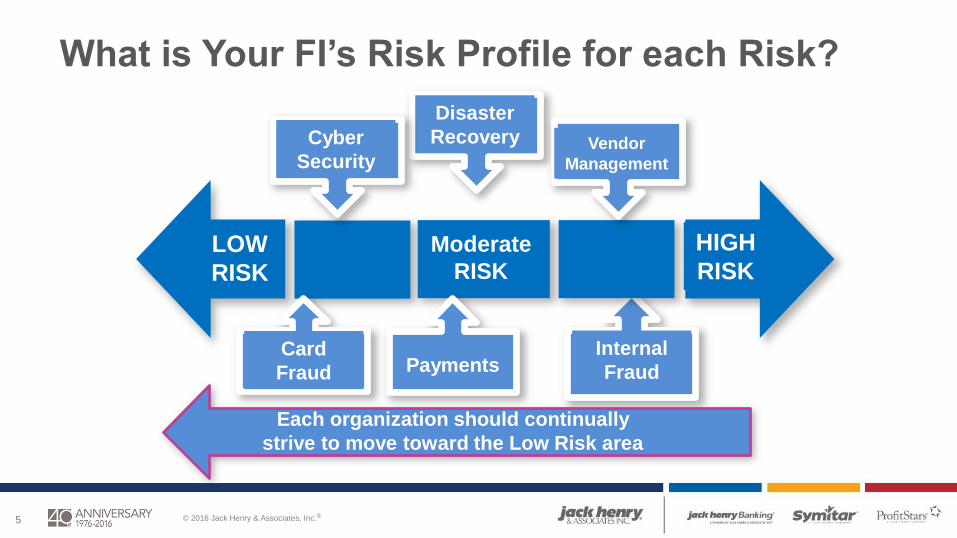
What is Your FI’s Risk Profile for each Risk?
Disaster
Recovery
Internal
Fraud
LOW
RISK
HIGH
RISK
Vendor
Management
Cyber
Security
PaymentsCard
Fraud
Moderate
RISK
Each organization should continually
strive to move toward the Low Risk area
© 2016 Jack Henry & Associates, Inc.®6
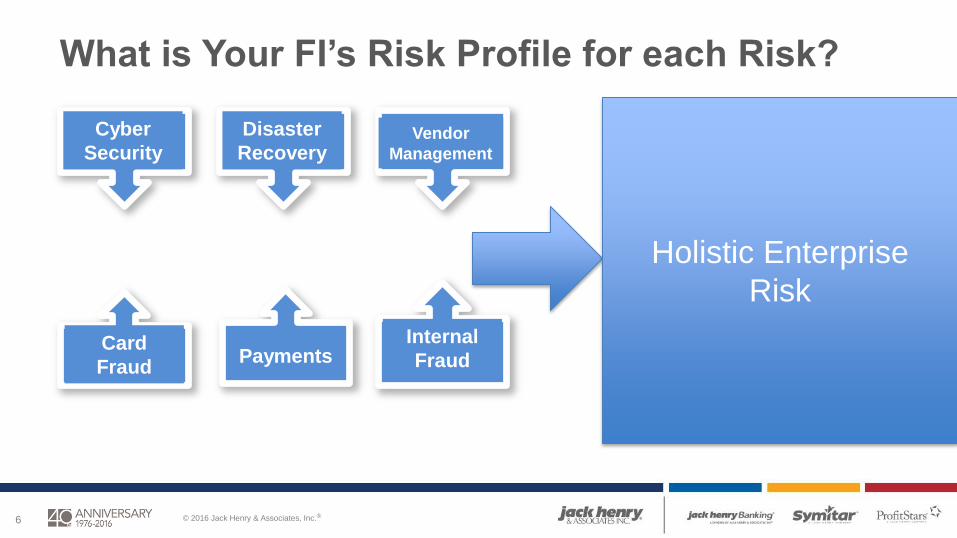
What is Your FI’s Risk Profile for each Risk?
Disaster
RecoveryVendor
Management
Cyber
Security
Internal
FraudPaymentsCard
Fraud
Holistic Enterprise
Risk
© 2016 Jack Henry & Associates, Inc.®7
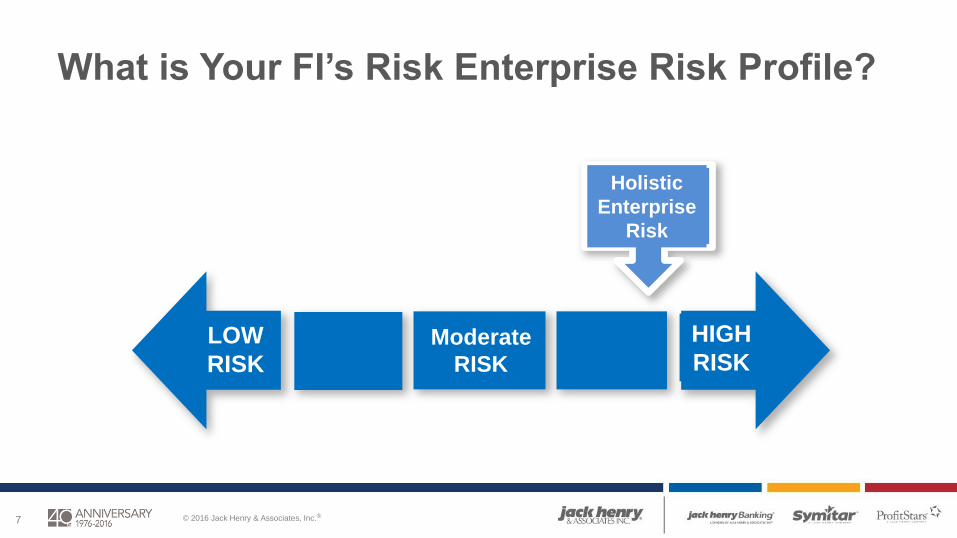
What is Your FI’s Risk Enterprise Risk Profile?
Internal
Fraud
Holistic
Enterprise
Risk
LOW
RISK
HIGH
RISKModerate
RISK
© 2016 Jack Henry & Associates, Inc.®8
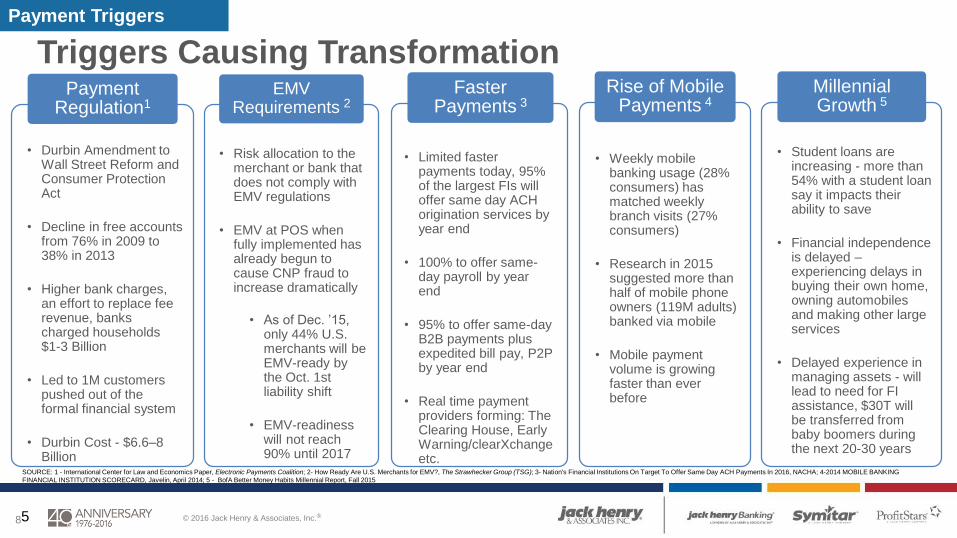
Triggers Causing TransformationPayment
Regulation1
• Durbin Amendment to Wall Street Reform and Consumer Protection Act
• Decline in free accounts from 76% in 2009 to 38% in 2013
• Higher bank charges, an effort to replace fee revenue, banks charged households $1-3 Billion
• Led to 1M customers pushed out of the formal financial system
• Durbin Cost - $6.6–8 Billion
Faster Payments 3
• Limited faster payments today, 95% of the largest FIs will offer same day ACH origination services by year end
• 100% to offer same-day payroll by year end
• 95% to offer same-day B2B payments plus expedited bill pay, P2P by year end
• Real time payment providers forming: The Clearing House, Early Warning/clearXchangeetc.
EMV Requirements 2
• Risk allocation to the merchant or bank that does not comply with EMV regulations
• EMV at POS when fully implemented has already begun to cause CNP fraud to increase dramatically
Rise of Mobile Payments 4
• Weekly mobile banking usage (28% consumers) has matched weekly branch visits (27% consumers)
• Research in 2015 suggested more than half of mobile phone owners (119M adults) banked via mobile
• Mobile payment volume is growing faster than ever before
Millennial Growth 5
• Student loans are increasing - more than 54% with a student loan say it impacts their ability to save
• Financial independence is delayed –experiencing delays in buying their own home, owning automobiles and making other large services
• Delayed experience in managing assets - will lead to need for FI assistance, $30T will be transferred from baby boomers during the next 20-30 years
SOURCE: 1 - International Center for Law and Economics Paper, Electronic Payments Coalition; 2- How Ready Are U.S. Merchants for EMV?, The Strawhecker Group (TSG); 3- Nation's Financial Institutions On Target To Offer Same Day ACH Payments In 2016, NACHA; 4-2014 MOBILE BANKING
FINANCIAL INSTITUTION SCORECARD, Javelin, April 2014; 5 - BofA Better Money Habits Millennial Report, Fall 2015
Payment Triggers
• As of Dec. ’15, only 44% U.S. merchants will be EMV-ready by the Oct. 1st liability shift
• EMV-readiness will not reach 90% until 2017
5

© 2016 Jack Henry & Associates, Inc.®9
What are the Risks or Issues
of Real-Time Payments for
Financial Institutions?
Less time to detect and react to possible fraud – manual detection is not viable
Authentication challenges in real-time payments
Increased potential for fraud
FI Actions
Real-time behavior analytics
Enrollment
Multi-factor authentication
Login
Service-use (pattern and velocity checks)
Device identity
Tokenization
Operating rules: prevent pull debit trans
Individual FI policies: transaction ceiling
Payment Innovations: Real Time Payments

© 2016 Jack Henry & Associates, Inc.®10
80% of U.S.
consumers would
prefer to use a
credit card with a
dynamic CVV
when shopping
online
Dynamic CVV Coming to Fruition
SOURCE: Report: Consumers Prefer Dynamic CVV, CardNotPresent.com, March 2016
Enhancements in Payment Services

© 2016 Jack Henry & Associates, Inc.®11© 2016 Jack Henry & Associates, Inc.®
Cyber Security

© 2016 Jack Henry & Associates, Inc.®12

© 2016 Jack Henry & Associates, Inc.®13
2014 2015 Difference
CARDS
Number of
breaches138 160 16%
Number of records 64M .8M 98%
SSNs
Number of
breaches325 338 4%
Number of records 16M 164M 148%
Data Breaches Continue - Fraud Behavior Shifts to
CNP and Application Fraud
SOURCE: 2015 DATA BREACH FRAUD IMPACT REPORT, Javelin Strategy & Research, February 2016
2. Payment Warnings

© 2016 Jack Henry & Associates, Inc.®14
Attack Vectors
Phone
Elicitation
Physical
Phishing Removable Drives
© 2016 Jack Henry & Associates, Inc.®15
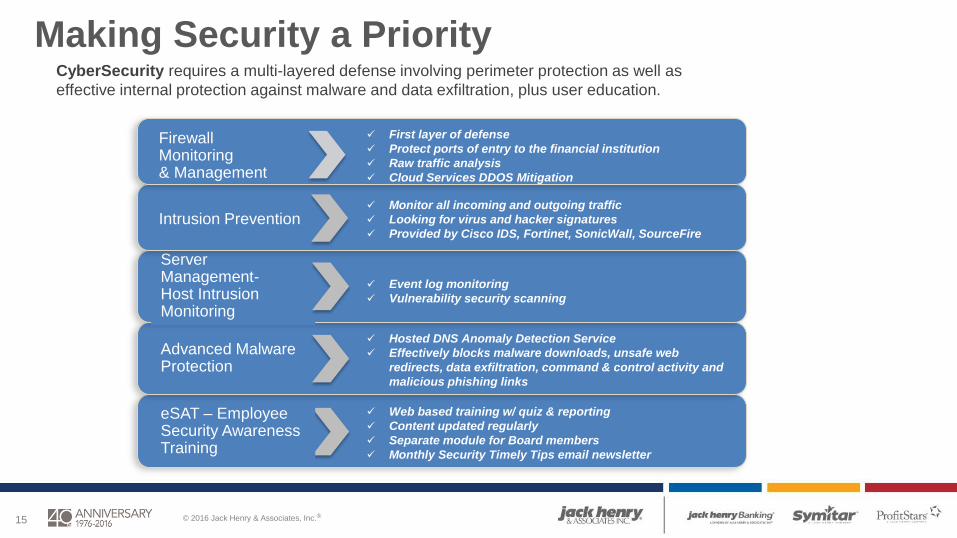
Making Security a PriorityCyberSecurity requires a multi-layered defense involving perimeter protection as well as
effective internal protection against malware and data exfiltration, plus user education.
Web based training w/ quiz & reporting
Content updated regularly
Separate module for Board members
Monthly Security Timely Tips email newsletter
eSAT – Employee Security AwarenessTraining
Advanced Malware Protection
Hosted DNS Anomaly Detection Service
Effectively blocks malware downloads, unsafe web
redirects, data exfiltration, command & control activity and
malicious phishing links
Server Management-Host Intrusion Monitoring
Event log monitoring
Vulnerability security scanning
Intrusion Prevention Monitor all incoming and outgoing traffic
Looking for virus and hacker signatures
Provided by Cisco IDS, Fortinet, SonicWall, SourceFire
Firewall Monitoring & Management
First layer of defense
Protect ports of entry to the financial institution
Raw traffic analysis
Cloud Services DDOS Mitigation

© 2016 Jack Henry & Associates, Inc.®16
Risk & Fraud Protection - Digital Channels Space• Login authentication
– (MFA, Tokens, Out-of-Band Challenges, Bio-Metrics/ Touch ID)
• High Risk Transaction monitoring
– (ACH, Wires, External Transfers, Bill Payments)
• Real-time activity alerts
– (TXT, Native Push, Email)
• Self-service Debit Card controls
– (turn on/off, report lost or stolen, limits, location and transaction
type rules)
• Malware & Phishing attack prevention
© 2016 Jack Henry & Associates, Inc.®17
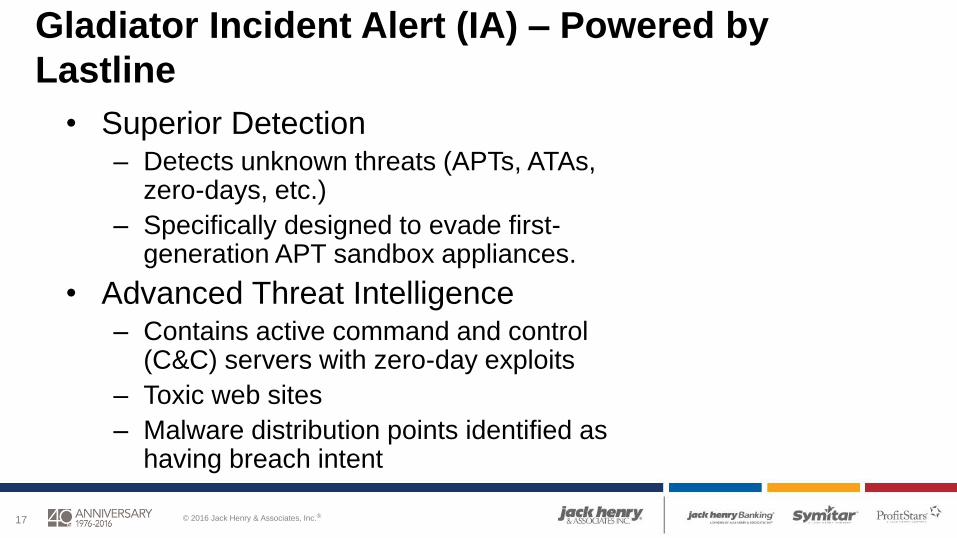
Gladiator Incident Alert (IA) – Powered by
Lastline
• Superior Detection– Detects unknown threats (APTs, ATAs,
zero-days, etc.)
– Specifically designed to evade first-generation APT sandbox appliances.
• Advanced Threat Intelligence– Contains active command and control
(C&C) servers with zero-day exploits
– Toxic web sites
– Malware distribution points identified as having breach intent

© 2016 Jack Henry & Associates, Inc.®18
Gladiator Incident Alert
© 2016 Jack Henry & Associates, Inc.®19
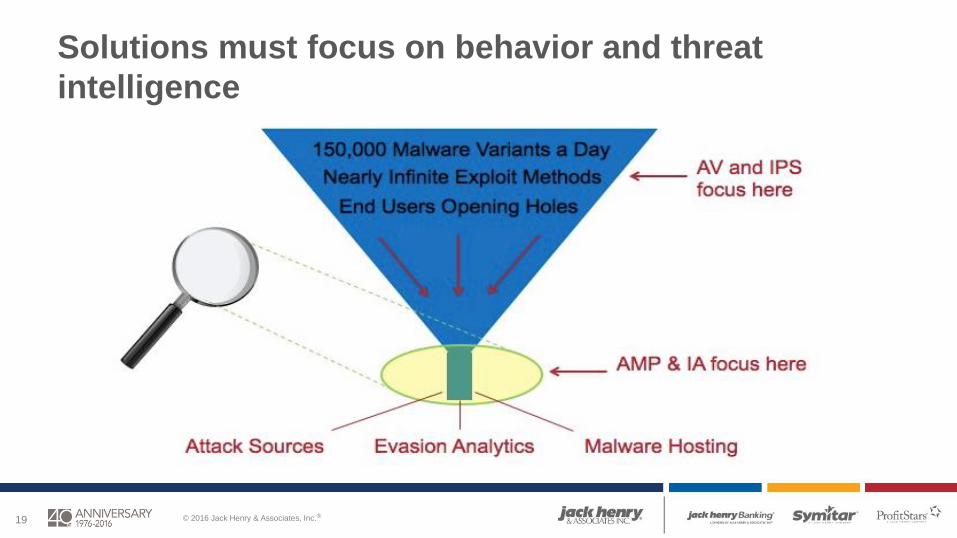
Solutions must focus on behavior and threat
intelligence

© 2016 Jack Henry & Associates, Inc.®20
Incident Response Procedures
Incident Documentation
Incident Recovery
Incident Eradication
Incident Response & Containment
Incident Assessment
Incident Notification
Incident Determination

© 2016 Jack Henry & Associates, Inc.®21
FFIEC Cybersecurity Assessment Tool

© 2016 Jack Henry & Associates, Inc.®22© 2016 Jack Henry & Associates, Inc.®
Business Continuity / Disaster Recovery
© 2016 Jack Henry & Associates, Inc.®23
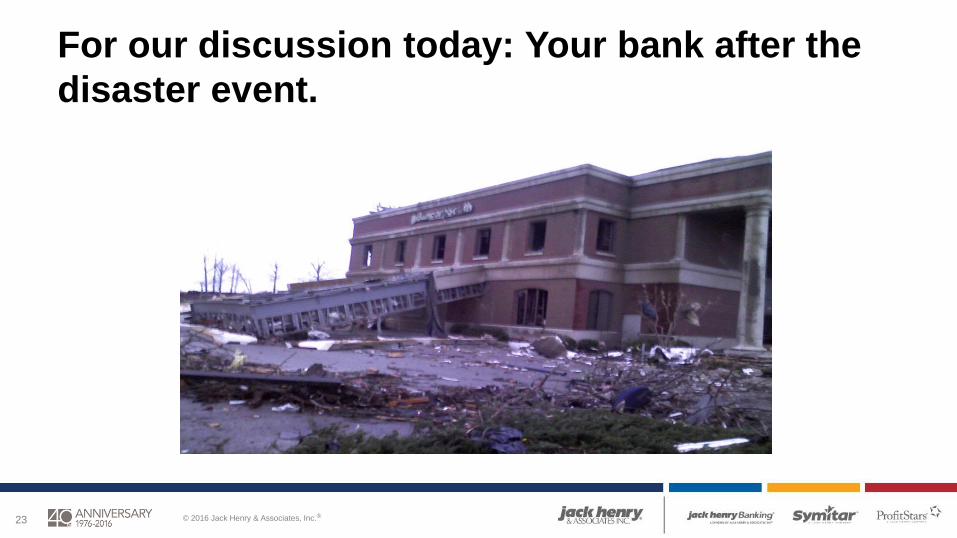
For our discussion today: Your bank after the
disaster event.
© 2016 Jack Henry & Associates, Inc.®24
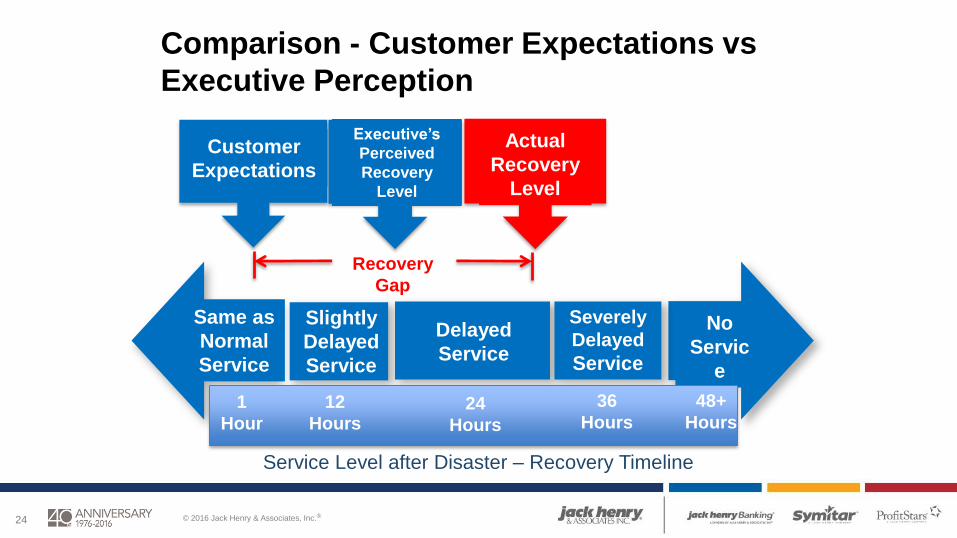
Comparison - Customer Expectations vs
Executive Perception
No
Servic
e
Same as
Normal
Service
Customer
Expectations
Delayed
Service
1
Hour24
Hours
48+
Hours12
Hours
36
Hours
Severely
Delayed
Service
Slightly
Delayed
Service
Actual
Recovery
Level
Recovery
Gap
Executive’s
Perceived
Recovery
Level
Service Level after Disaster – Recovery Timeline

© 2016 Jack Henry & Associates, Inc.®25
The Gap: Customer Expectations vs Actual Recovery Time?
• Lack of an Enterprise Wide Business Continuity Plan that
has been tested at multiple levels
• The technology recovery strategy for systems and
applications not adequate to meet shorter Recovery Time
Objectives (RTO) and Recovery Point Objectives (RPO).
• Key personnel not available.
• Availability of skilled personnel.
• Plan out of date.
• Alternate work locations not identified and equipped.
© 2016 Jack Henry & Associates, Inc.®26
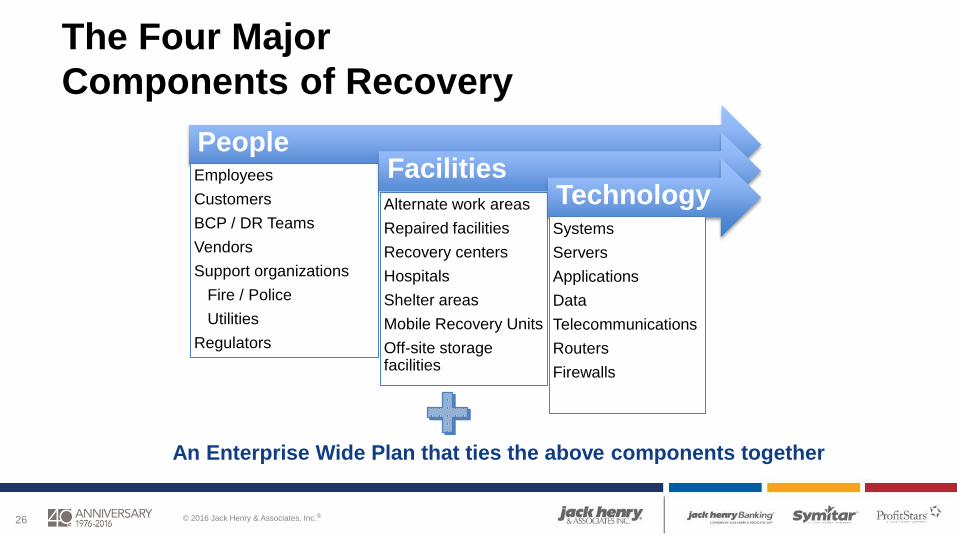
The Four Major
Components of Recovery
PeopleEmployees
Customers
BCP / DR Teams
Vendors
Support organizations
Fire / Police
Utilities
Regulators
FacilitiesAlternate work areas
Repaired facilities
Recovery centers
Hospitals
Shelter areas
Mobile Recovery Units
Off-site storage facilities
TechnologySystems
Servers
Applications
Data
Telecommunications
Routers
Firewalls
An Enterprise Wide Plan that ties the above components together
© 2016 Jack Henry & Associates, Inc.®27
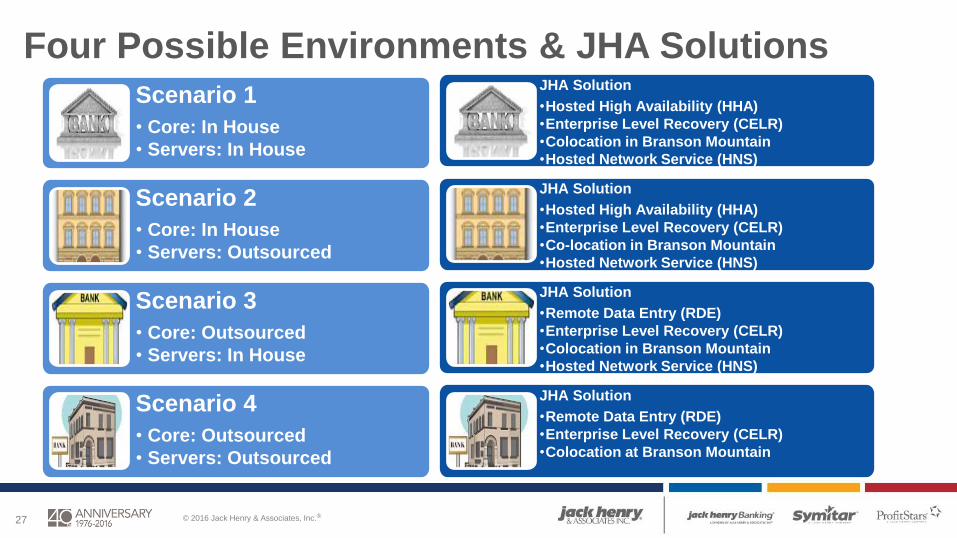
Four Possible Environments & JHA Solutions
Scenario 1
• Core: In House
• Servers: In House
Scenario 2
• Core: In House
• Servers: Outsourced
Scenario 3
• Core: Outsourced
• Servers: In House
Scenario 4
• Core: Outsourced
• Servers: Outsourced
JHA Solution
•Hosted High Availability (HHA)
•Enterprise Level Recovery (CELR)
•Colocation in Branson Mountain
•Hosted Network Service (HNS)
JHA Solution
•Hosted High Availability (HHA)
•Enterprise Level Recovery (CELR)
•Co-location in Branson Mountain
•Hosted Network Service (HNS)
JHA Solution
•Remote Data Entry (RDE)
•Enterprise Level Recovery (CELR)
•Colocation in Branson Mountain
•Hosted Network Service (HNS)
JHA Solution
•Remote Data Entry (RDE)
•Enterprise Level Recovery (CELR)
•Colocation at Branson Mountain

© 2016 Jack Henry & Associates, Inc.®28
In-House Processing Considerations
• Responsible for the restoration of the
following:– Recovery of Core System
– Recovery of Server / Network Recovery
• Exchange Servers - Domain Controllers
• JHA & 3rd Party Applications
– Telecommunications - Voice Recovery
– Equipment setup & Reconfiguration
– Facilities
© 2016 Jack Henry & Associates, Inc.®29
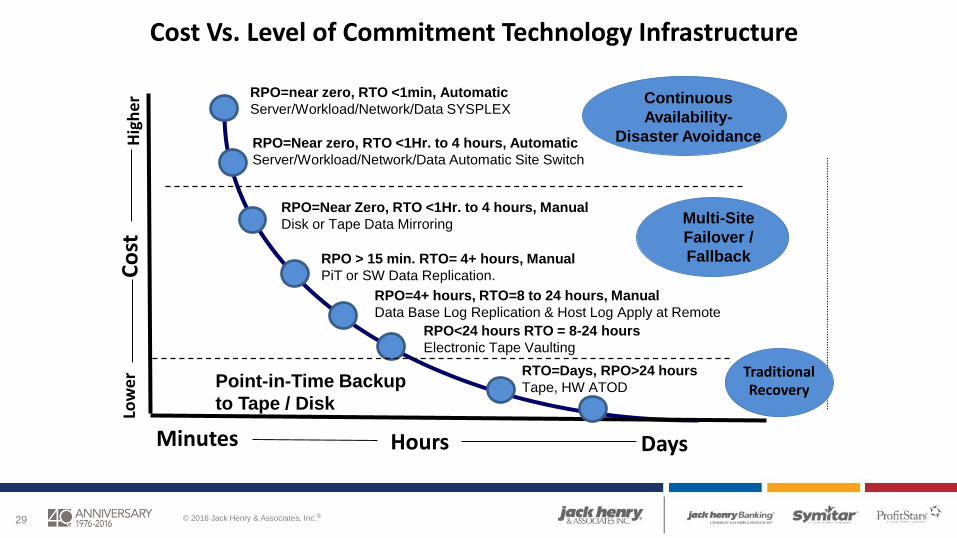
Cost Vs. Level of Commitment Technology Infrastructure
RPO=near zero, RTO <1min, Automatic
Server/Workload/Network/Data SYSPLEX
RPO=Near zero, RTO <1Hr. to 4 hours, Automatic
Server/Workload/Network/Data Automatic Site Switch
RPO=Near Zero, RTO <1Hr. to 4 hours, Manual
Disk or Tape Data Mirroring
RPO > 15 min. RTO= 4+ hours, Manual
PiT or SW Data Replication.
RPO=4+ hours, RTO=8 to 24 hours, Manual
Data Base Log Replication & Host Log Apply at Remote
RTO=Days, RPO>24 hours
Tape, HW ATODPoint-in-Time Backup
to Tape / Disk
RPO<24 hours RTO = 8-24 hours
Electronic Tape Vaulting
Co
st
Low
er
Hig
he
r
HoursMinutes Days
TraditionalRecovery
Multi-Site
Failover /
Fallback
Continuous
Availability-
Disaster Avoidance
© 2016 Jack Henry & Associates, Inc.®30
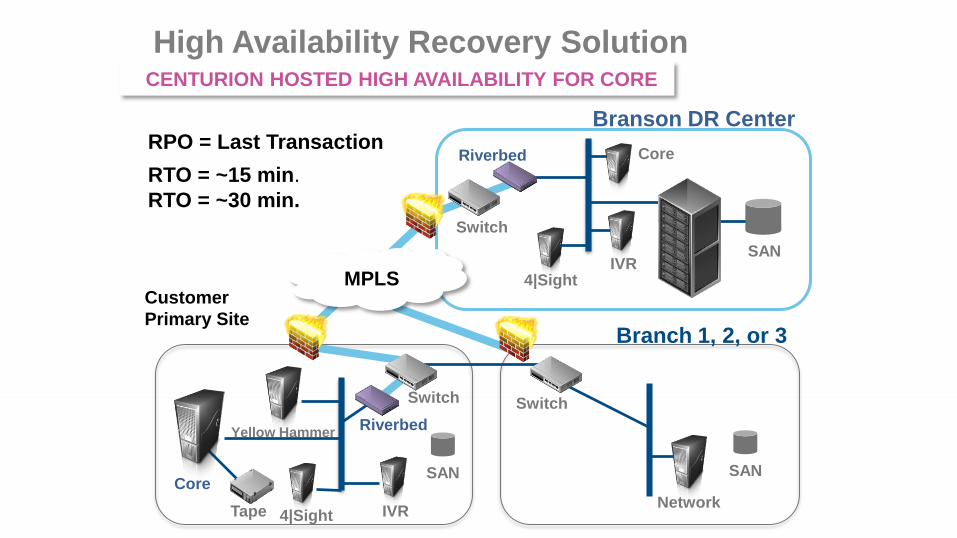
RPO = Last Transaction
RTO = ~15 min.
RTO = ~30 min.
Branson DR Center
High Availability Recovery Solution
Customer
Primary Site
Tape
Yellow Hammer
4|Sight
Core
IVR
SAN
Switch
Riverbed
Switch
4|Sight
SANIVR
Riverbed Core
CENTURION HOSTED HIGH AVAILABILITY FOR CORE
Switch
SAN
Network
Branch 1, 2, or 3
MPLS

© 2016 Jack Henry & Associates, Inc.®31
RPO = Last Transaction
RTO = ~15 min.
RTO = ~30 min.
Branson DR Site
High Availability Recovery Solution
Customer
Primary Site
Tape
Yellow Hammer
4|Sight
Core
IVR
SAN
Switch
Riverbed
Switch
4|Sight
SANIVR
Riverbed Core
Switch
SAN
Network
Branch 1, 2, or 3
MPLS
HIGHER AVAILABILITY FOR CORE
© 2016 Jack Henry & Associates, Inc.®32
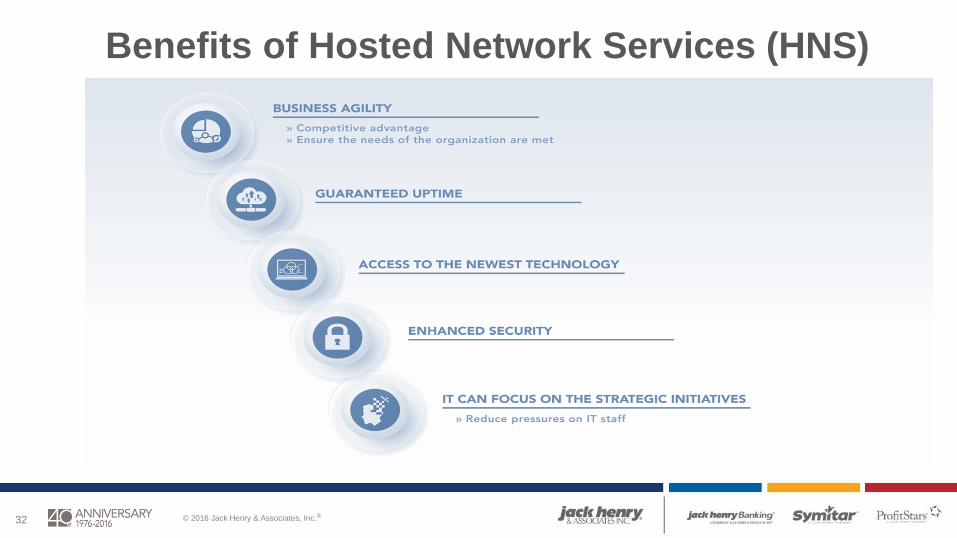
Benefits of Hosted Network Services (HNS)

© 2016 Jack Henry & Associates, Inc.®33
Out-Sourced Processing Considerations
• Responsible for the restoration of the
following:– Connectivity back to the Core Processing Site
• (jConnect Backup Router)
– Server / Network Recovery
• Exchange Servers - Domain Controllers
• JHA & 3rd Party Applications
– Telecommunications - Voice Recovery
– Equipment setup & Reconfiguration
– Facilities
• A plan to deal with a disaster that strikes the facility

© 2016 Jack Henry & Associates, Inc.®34
Branson, MO – Mountain Host Site
© 2016 Jack Henry & Associates, Inc.®35
The Disaster Avoidance Concept
© 2016 Jack Henry & Associates, Inc.®36
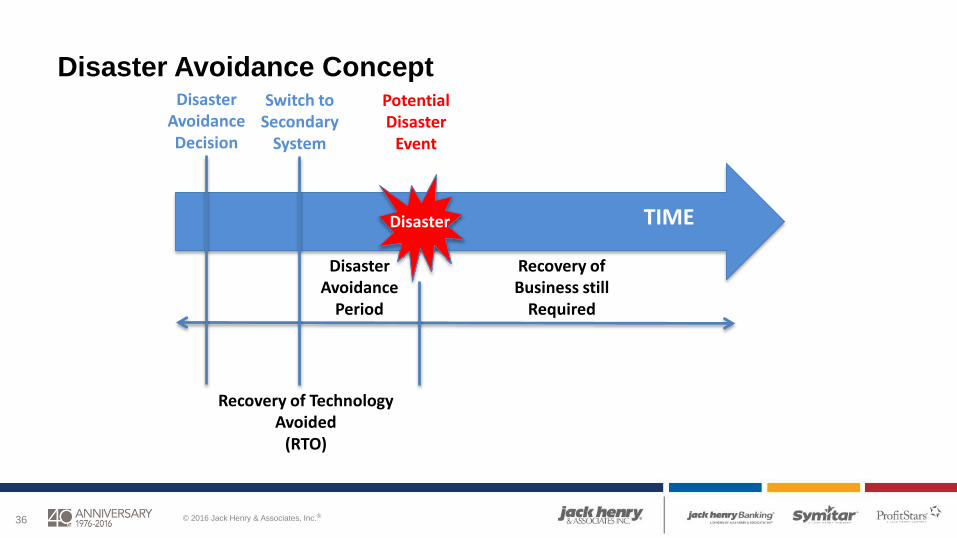
Disaster Avoidance Concept
TIME
Recovery of Business still
Required
Disaster Avoidance Decision
Disaster Avoidance
Period
Recovery of TechnologyAvoided
(RTO)
PotentialDisaster
Event
Disaster
Switch to Secondary
System
© 2016 Jack Henry & Associates, Inc.®37
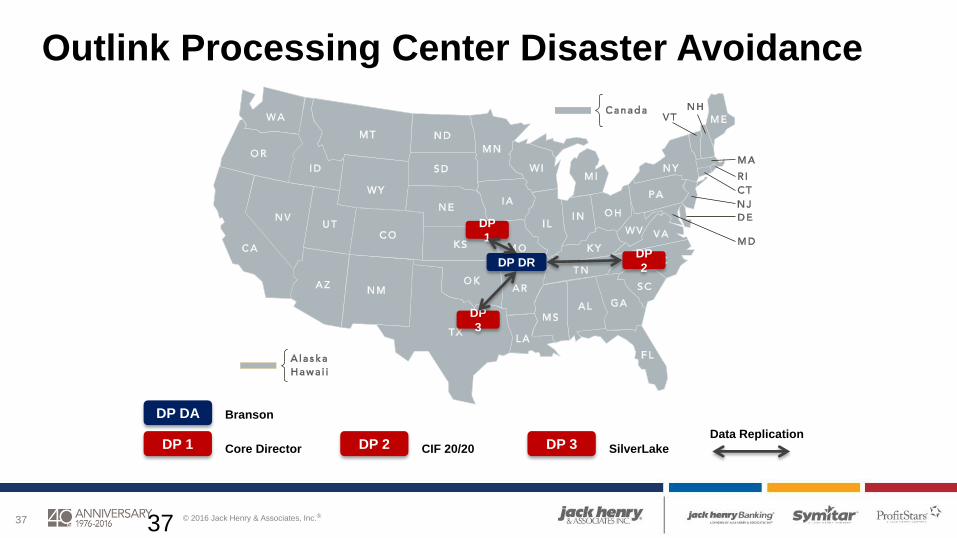
Data Replication
Outlink Processing Center Disaster Avoidance
DP DR
DP
1
DP
2
DP DA
DP 1
Branson
Core Director
DP
3
DP 2 CIF 20/20 DP 3 SilverLake
37

© 2016 Jack Henry & Associates, Inc.®38
Centurion Suite of Services

© 2016 Jack Henry & Associates, Inc.®39
Contact Information
• Tom Williams
– Business Continuity Strategy Manager
– Jack Henry & Associates
– Centurion Disaster Recovery®
Services
– 800-299-4411