IWA/AWWA Standard Water Balance · 2018-04-01 · IWA/AWWA Standard Water Balance. 5/12/2015 2...
14
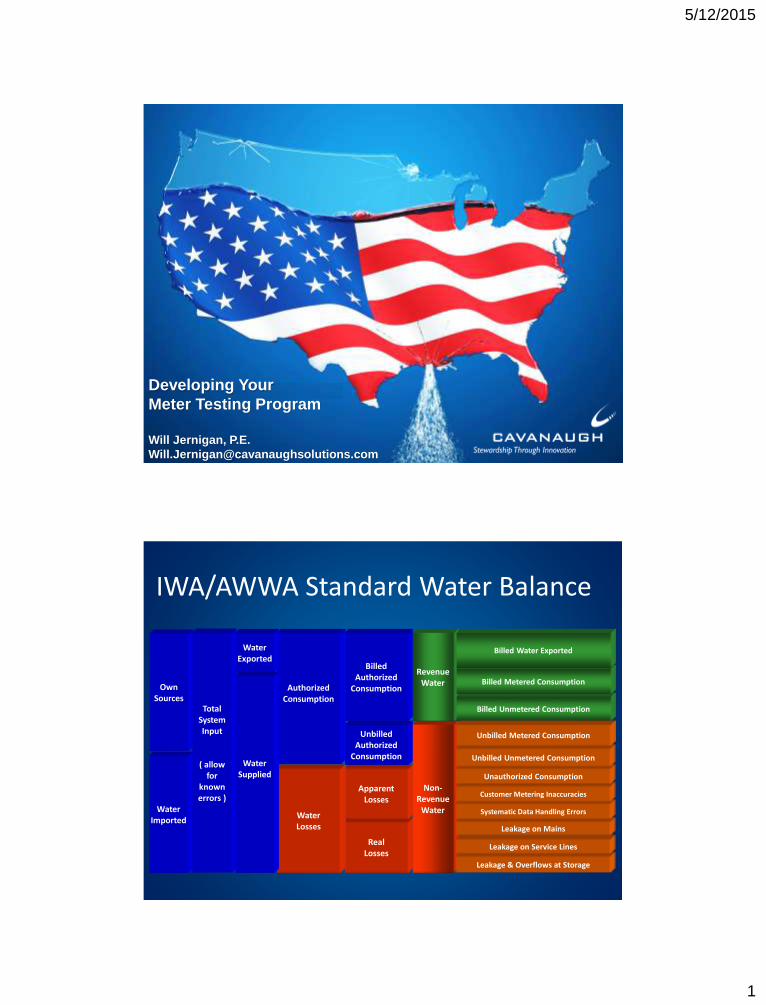
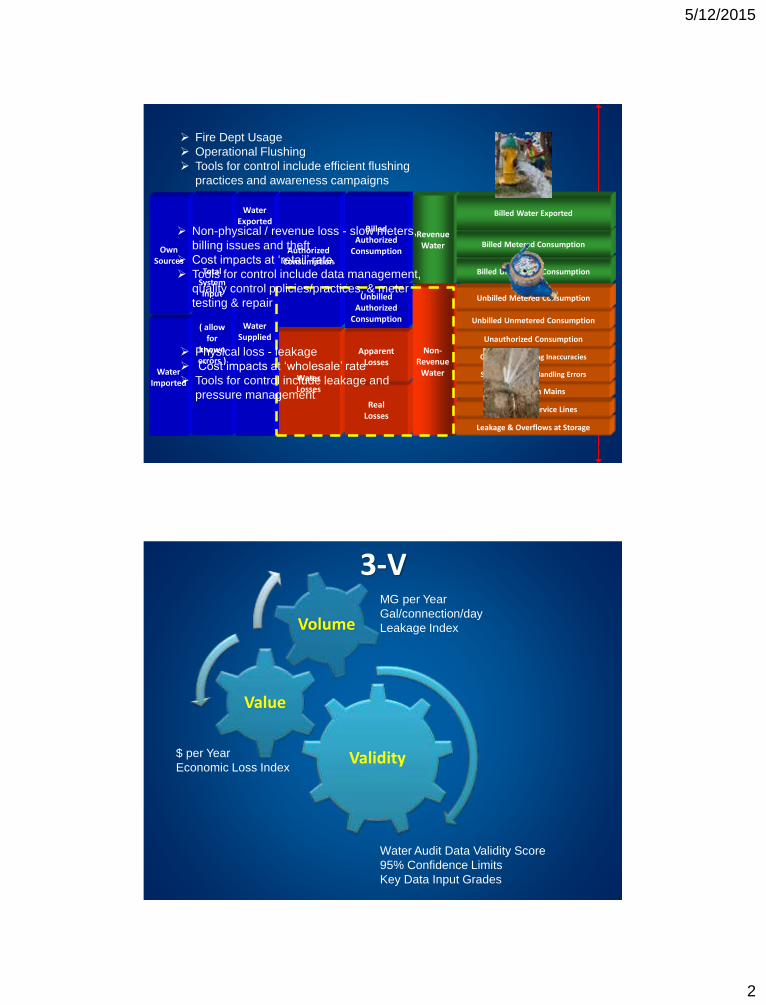
5/12/2015 1 Developing Your Meter Testing Program Will Jernigan, P.E. [email protected] Real Losses Apparent Losses Unbilled Authorized Consumption Billed Authorized Consumption Non- Revenue Water Revenue Water Leakage & Overflows at Storage Billed Unmetered Consumption Billed Metered Consumption Billed Water Exported Leakage on Service Lines Leakage on Mains Systematic Data Handling Errors Customer Metering Inaccuracies Unauthorized Consumption Unbilled Unmetered Consumption Unbilled Metered Consumption Water Imported Own Sources Total System Input ( allow for known errors ) Water Losses Authorized Consumption Water Exported Water Supplied IWA/AWWA Standard Water Balance
Transcript of IWA/AWWA Standard Water Balance · 2018-04-01 · IWA/AWWA Standard Water Balance. 5/12/2015 2...
5/12/2015
1
Developing Your
Meter Testing Program
Will Jernigan, P.E.
RealLosses
ApparentLosses
UnbilledAuthorized
Consumption
BilledAuthorized
Consumption
Non-Revenue
Water
RevenueWater
Leakage & Overflows at Storage
Billed Unmetered Consumption
Billed Metered Consumption
Billed Water Exported
Leakage on Service Lines
Leakage on Mains
Systematic Data Handling Errors
Customer Metering Inaccuracies
Unauthorized Consumption
Unbilled Unmetered Consumption
Unbilled Metered Consumption
WaterImported
OwnSources
TotalSystemInput
( allowfor
knownerrors )
WaterLosses
AuthorizedConsumption
WaterExported
WaterSupplied
IWA/AWWA Standard Water Balance
5/12/2015
2
AuthorizedConsumption
WaterLosses
RealLosses
ApparentLosses
UnbilledAuthorized
Consumption
BilledAuthorized
Consumption
Non-Revenue
Water
RevenueWater
Leakage & Overflows at Storage
Billed Unmetered Consumption
Billed Metered Consumption
Billed Water Exported
Leakage on Service Lines
Leakage on Mains
Systematic Data Handling Errors
Customer Metering Inaccuracies
Unauthorized Consumption
Unbilled Unmetered Consumption
Unbilled Metered Consumption
WaterImported
OwnSources
TotalSystemInput
( allowfor
knownerrors )
WaterExported
WaterSupplied
Physical loss - leakage
Cost impacts at ‘wholesale’ rate
Tools for control include leakage and
pressure management
Non-physical / revenue loss - slow meters,
billing issues and theft
Cost impacts at ‘retail’ rate.
Tools for control include data management,
quality control policies/practices, & meter
testing & repair
Fire Dept Usage
Operational Flushing
Tools for control include efficient flushing
practices and awareness campaigns
3-V
Validity
Value
Volume
MG per Year
Gal/connection/day
Leakage Index
$ per Year
Economic Loss Index
Water Audit Data Validity Score
95% Confidence Limits
Key Data Input Grades
5/12/2015
3
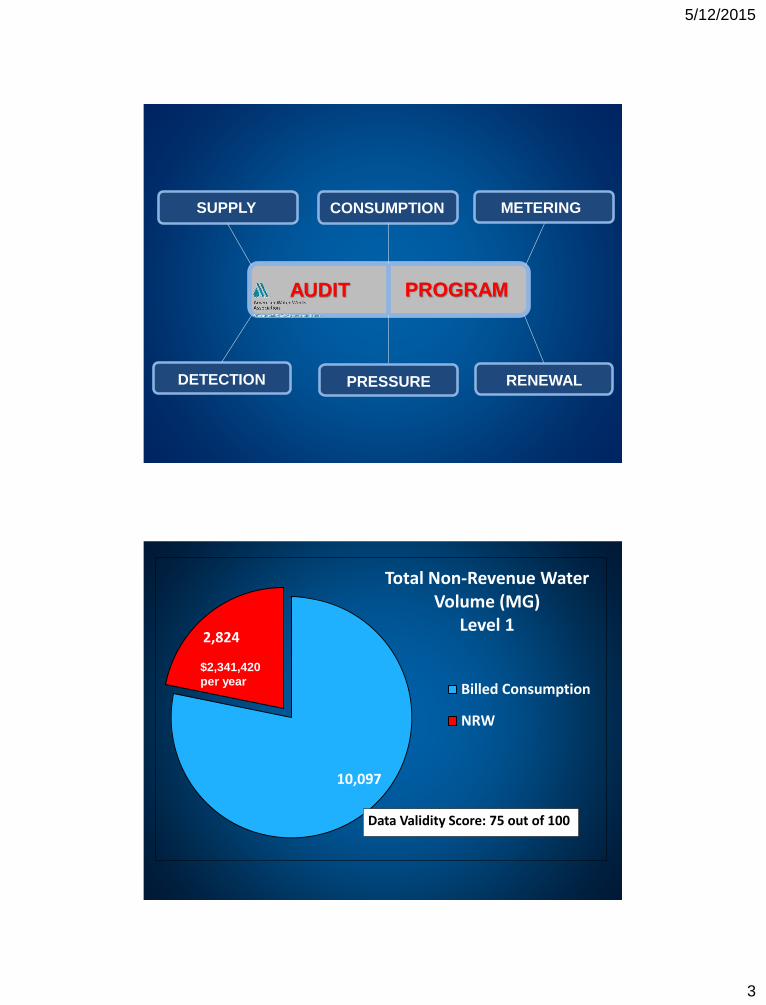
AUDIT PROGRAM
SUPPLY CONSUMPTION METERING
DETECTION PRESSURE RENEWAL
10,097
2,824
Total Non-Revenue WaterVolume (MG)
Level 1
Billed Consumption
NRW
Data Validity Score: 75 out of 100
$2,341,420
per year
5/12/2015
4
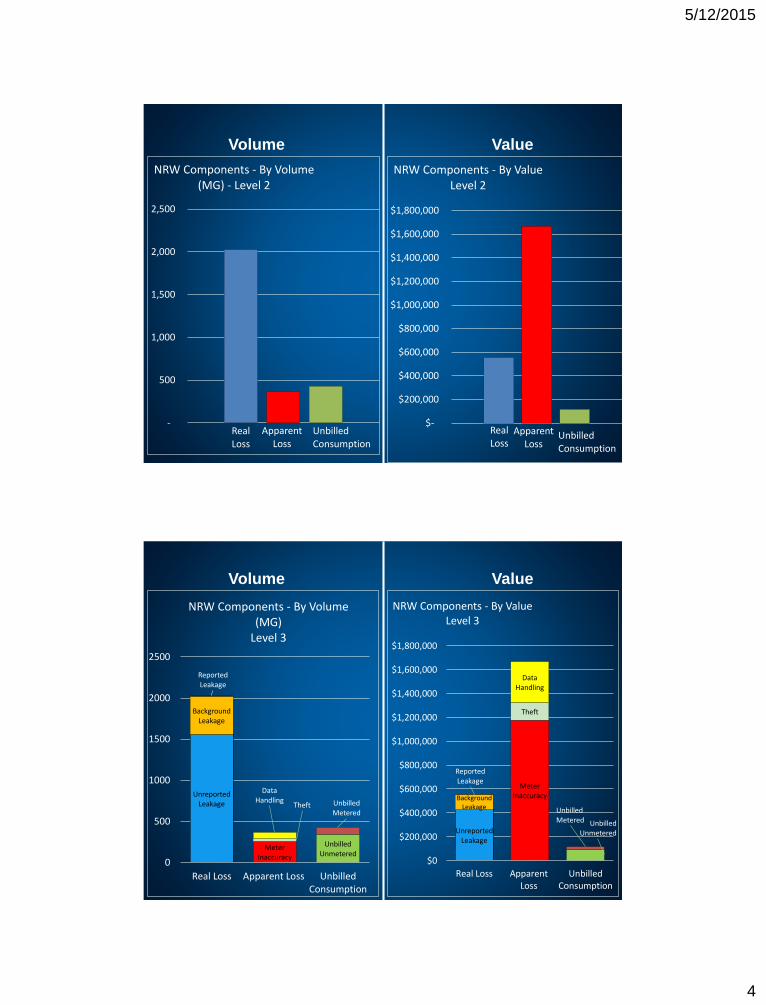
Volume Value
Real Loss
Apparent Loss
Unbilled Consumption
-
500
1,000
1,500
2,000
2,500
NRW Components - By Volume (MG) - Level 2
Real Loss
Apparent Loss
Unbilled Consumption
$-
$200,000
$400,000
$600,000
$800,000
$1,000,000
$1,200,000
$1,400,000
$1,600,000
$1,800,000
NRW Components - By ValueLevel 2
Volume Value
Unbilled Unmetered
Unbilled Metered
Meter Inaccuracy
Theft
Data Handling
Unreported Leakage
Background Leakage
Reported Leakage
0
500
1000
1500
2000
2500
Real Loss Apparent Loss UnbilledConsumption
NRW Components - By Volume (MG)
Level 3
Unbilled Unmetered
Unbilled Metered
Meter Inaccuracy
Theft
Data Handling
Unreported Leakage
Background Leakage
Reported Leakage
$0
$200,000
$400,000
$600,000
$800,000
$1,000,000
$1,200,000
$1,400,000
$1,600,000
$1,800,000
Real Loss ApparentLoss
UnbilledConsumption
NRW Components - By ValueLevel 3
5/12/2015
5
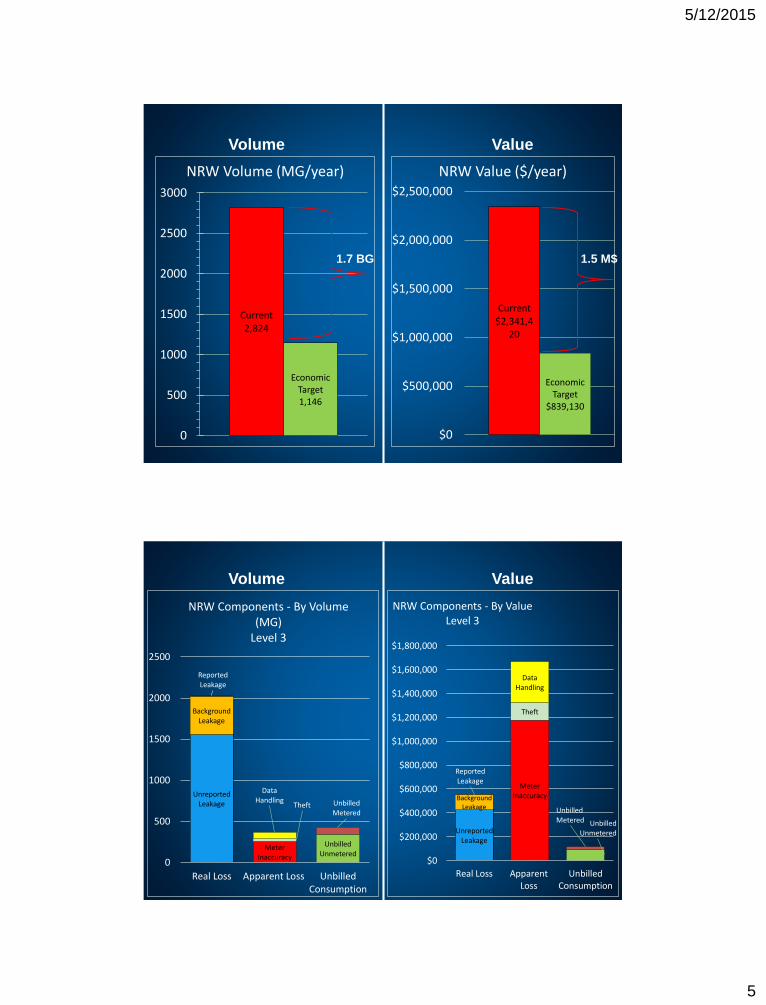
Volume Value
Current2,824
Economic Target1,146
0
500
1000
1500
2000
2500
3000
NRW Volume (MG/year)
Current$2,341,4
20
Economic Target
$839,130
$0
$500,000
$1,000,000
$1,500,000
$2,000,000
$2,500,000
NRW Value ($/year)
1.7 BG 1.5 M$
Volume Value
Unbilled Unmetered
Unbilled Metered
Meter Inaccuracy
Theft
Data Handling
Unreported Leakage
Background Leakage
Reported Leakage
0
500
1000
1500
2000
2500
Real Loss Apparent Loss UnbilledConsumption
NRW Components - By Volume (MG)
Level 3
Unbilled Unmetered
Unbilled Metered
Meter Inaccuracy
Theft
Data Handling
Unreported Leakage
Background Leakage
Reported Leakage
$0
$200,000
$400,000
$600,000
$800,000
$1,000,000
$1,200,000
$1,400,000
$1,600,000
$1,800,000
Real Loss ApparentLoss
UnbilledConsumption
NRW Components - By ValueLevel 3
5/12/2015
6
Water Audit Report for:
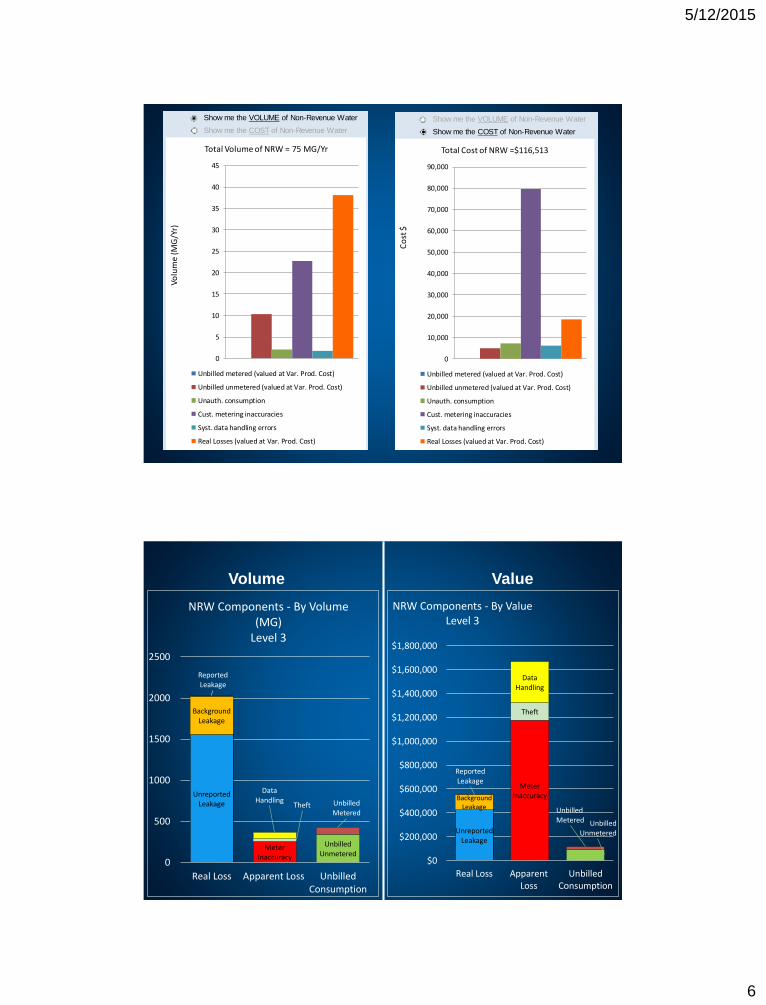
Reporting Year: 2013 Show me the VOLUME of Non-Revenue Water
Data Validity Score: 60 Show me the COST of Non-Revenue Water
AWWA Free Water Audit Software:
Dashboard
1/2013 - 12/2013
Northern San Leandro Combined Water Sewer Storm Utility District (0007900)
0
10,000
20,000
30,000
40,000
50,000
60,000
70,000
80,000
90,000
Co
st $
Total Cost of NRW =$116,513
Unbilled metered (valued at Var. Prod. Cost)
Unbilled unmetered (valued at Var. Prod. Cost)
Unauth. consumption
Cust. metering inaccuracies
Syst. data handling errors
Real Losses (valued at Var. Prod. Cost)
WAS v5.0
American Water Works Association.Copyright © 2014, All Rights Reserved.
Water Exported
Authorized Consumption
Water Losses
0%
10%
20%
30%
40%
50%
60%
70%
80%
90%
100%
Water Exported
Water Imported
Volume From OwnSources
Water Exported
Billed Auth. Cons.
Unbilled Auth. Cons.
Apparent Losses
Real Losses
Water Exported
Revenue Water
Non Revenue Water
The graphic below is a visual representation of the Water Balance with bar heights propotional to the
volume of the audit components
Water Exported
Water Supplied
Water Audit Report for:
Reporting Year: 2013 Show me the VOLUME of Non-Revenue Water
Data Validity Score: 60 Show me the COST of Non-Revenue Water
AWWA Free Water Audit Software:
Dashboard
1/2013 - 12/2013
Northern San Leandro Combined Water Sewer Storm Utility District (0007900)
0
5
10
15
20
25
30
35
40
45Vo
lum
e (M
G/Y
r)
Total Volume of NRW = 75 MG/Yr
Unbilled metered (valued at Var. Prod. Cost)
Unbilled unmetered (valued at Var. Prod. Cost)
Unauth. consumption
Cust. metering inaccuracies
Syst. data handling errors
Real Losses (valued at Var. Prod. Cost)
WAS v5.0
American Water Works Association.Copyright © 2014, All Rights Reserved.
Water Exported
Authorized Consumption
Water Losses
0%
10%
20%
30%
40%
50%
60%
70%
80%
90%
100%
Water Exported
Water Imported
Volume From OwnSources
Water Exported
Billed Auth. Cons.
Unbilled Auth. Cons.
Apparent Losses
Real Losses
Water Exported
Revenue Water
Non Revenue Water
The graphic below is a visual representation of the Water Balance with bar heights propotional to the
volume of the audit components
Water Exported
Water Supplied
Volume Value
Unbilled Unmetered
Unbilled Metered
Meter Inaccuracy
Theft
Data Handling
Unreported Leakage
Background Leakage
Reported Leakage
0
500
1000
1500
2000
2500
Real Loss Apparent Loss UnbilledConsumption
NRW Components - By Volume (MG)
Level 3
Unbilled Unmetered
Unbilled Metered
Meter Inaccuracy
Theft
Data Handling
Unreported Leakage
Background Leakage
Reported Leakage
$0
$200,000
$400,000
$600,000
$800,000
$1,000,000
$1,200,000
$1,400,000
$1,600,000
$1,800,000
Real Loss ApparentLoss
UnbilledConsumption
NRW Components - By ValueLevel 3
5/12/2015
7
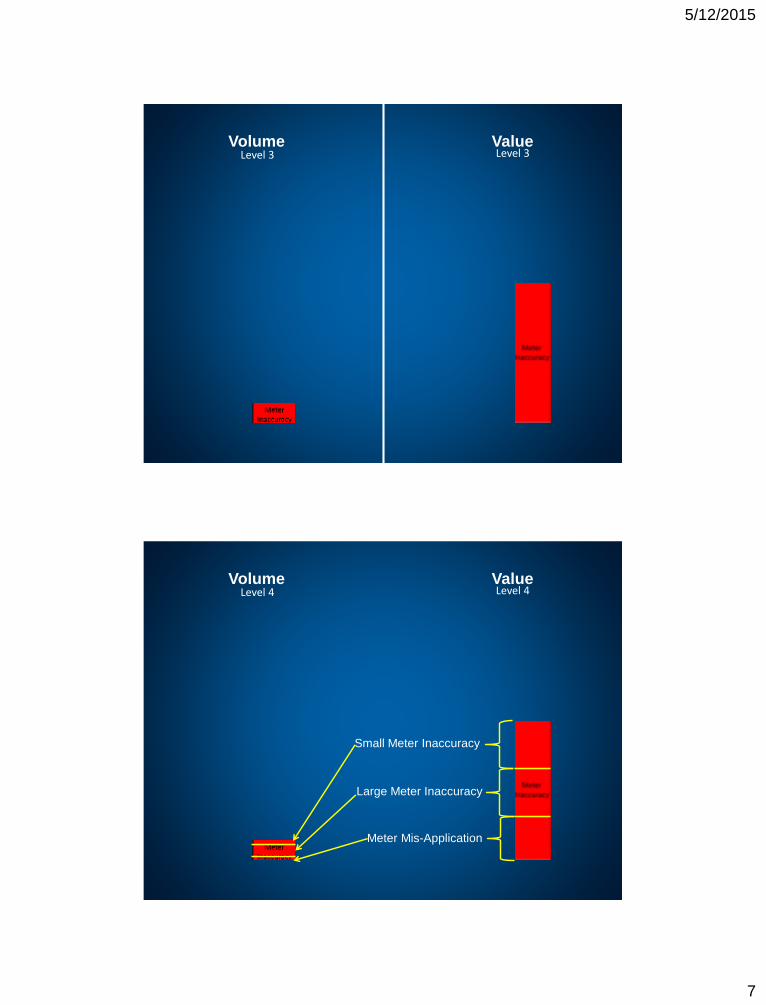
Volume ValueLevel 3 Level 3
Volume Value
Small Meter Inaccuracy
Large Meter Inaccuracy
Meter Mis-Application
Level 4 Level 4
5/12/2015
8
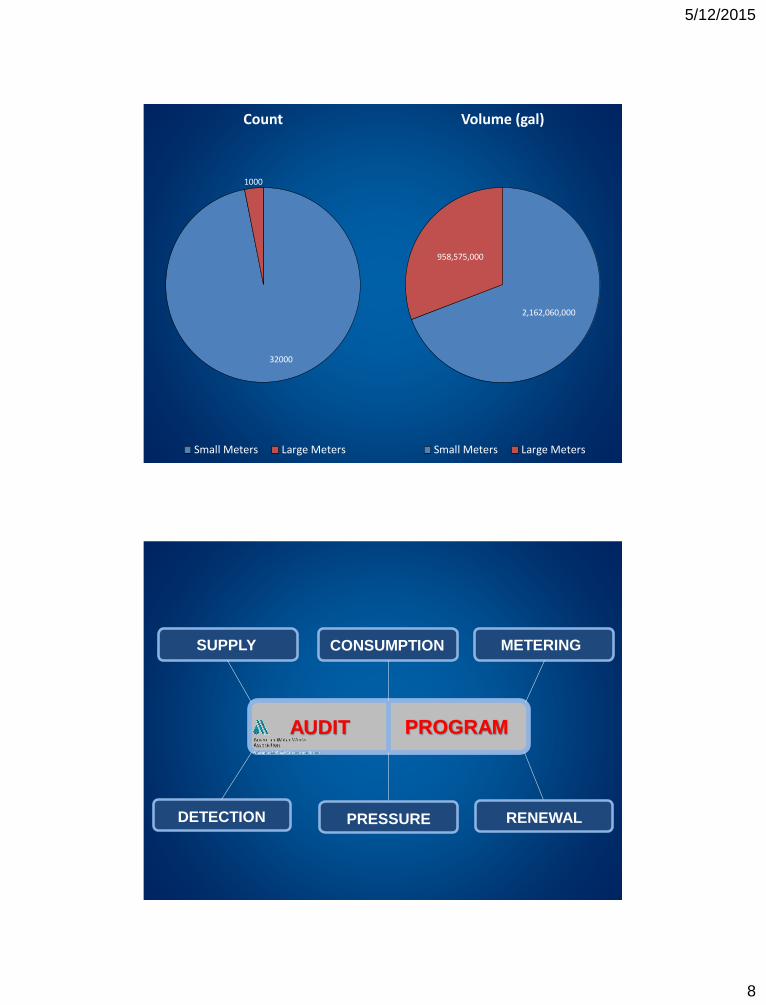
32000
1000
Count
Small Meters Large Meters
2,162,060,000
958,575,000
Volume (gal)
Small Meters Large Meters
AUDIT PROGRAM
SUPPLY CONSUMPTION METERING
DETECTION PRESSURE RENEWAL
5/12/2015
9
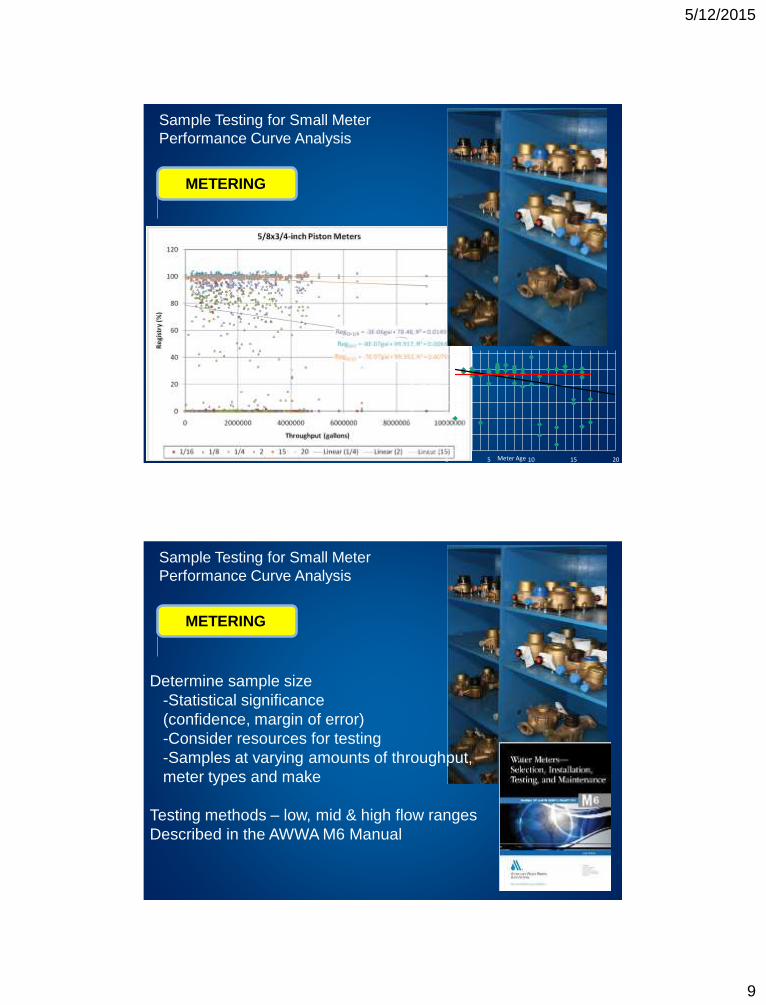
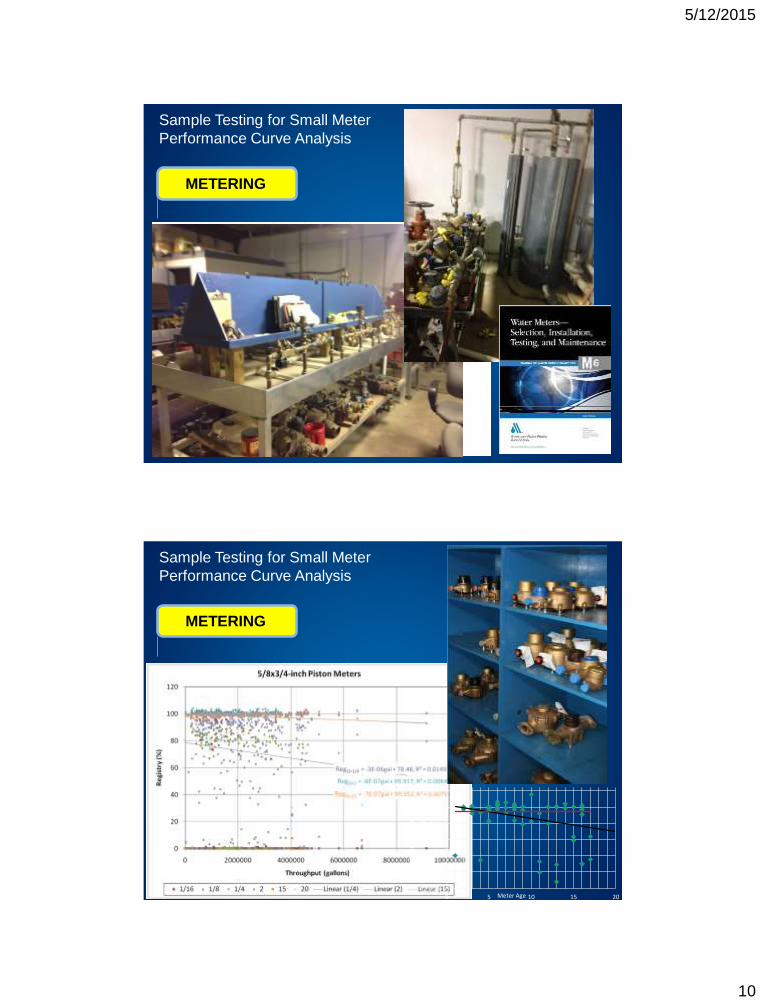
METERING
Sample Testing for Small Meter
Performance Curve Analysis
75.00%
80.00%
85.00%
90.00%
95.00%
100.00%
105.00%
0 5 10 15 20
Me
ter
Acc
ura
cy
Meter Age
METERING
Sample Testing for Small Meter
Performance Curve Analysis
Determine sample size
-Statistical significance
(confidence, margin of error)
-Consider resources for testing
-Samples at varying amounts of throughput,
meter types and make
Testing methods – low, mid & high flow ranges
Described in the AWWA M6 Manual
5/12/2015
10
METERING
Sample Testing for Small Meter
Performance Curve Analysis
METERING
Sample Testing for Small Meter
Performance Curve Analysis
75.00%
80.00%
85.00%
90.00%
95.00%
100.00%
105.00%
0 5 10 15 20
Met
er A
ccu
racy
Meter Age
5/12/2015
11
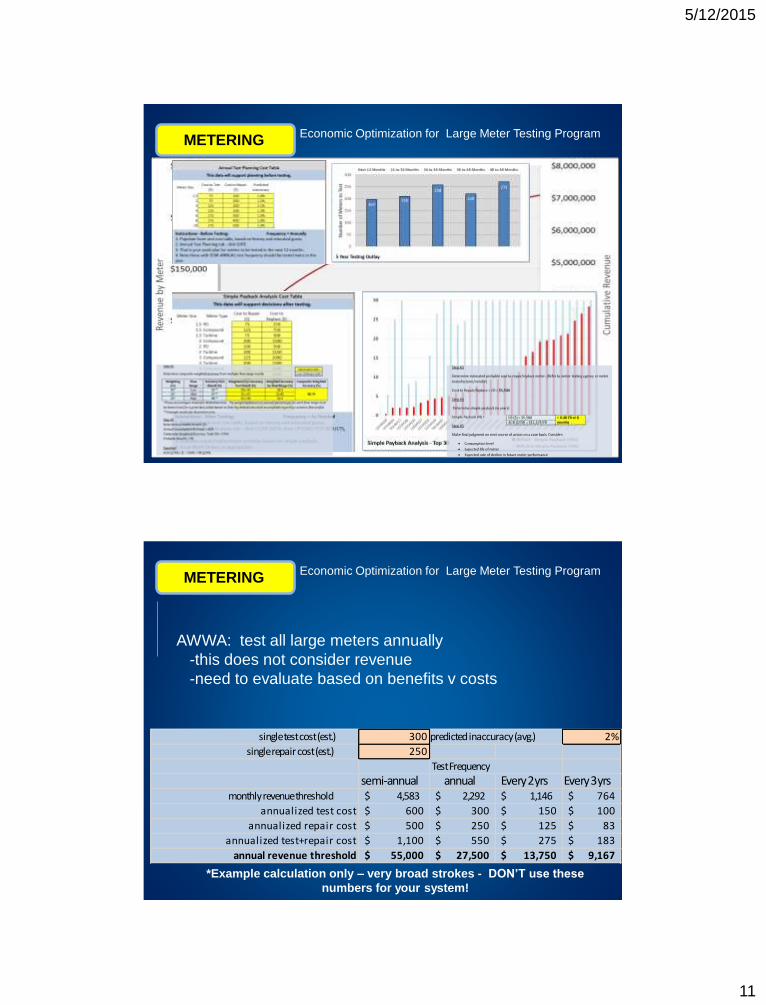
METERINGEconomic Optimization for Large Meter Testing Program
METERINGEconomic Optimization for Large Meter Testing Program
single test cost (est.) 300 predicted inaccuracy (avg.) 2%
single repair cost (est.) 250
Test Frequency
semi-annual annual Every 2 yrs Every 3 yrsmonthly revenue threshold 4,583$ 2,292$ 1,146$ 764$
annualized test cost 600$ 300$ 150$ 100$
annualized repair cost 500$ 250$ 125$ 83$
annualized test+repair cost 1,100$ 550$ 275$ 183$
annual revenue threshold 55,000$ 27,500$ 13,750$ 9,167$
AWWA: test all large meters annually
-this does not consider revenue
-need to evaluate based on benefits v costs
*Example calculation only – very broad strokes - DON’T use these
numbers for your system!
5/12/2015
12
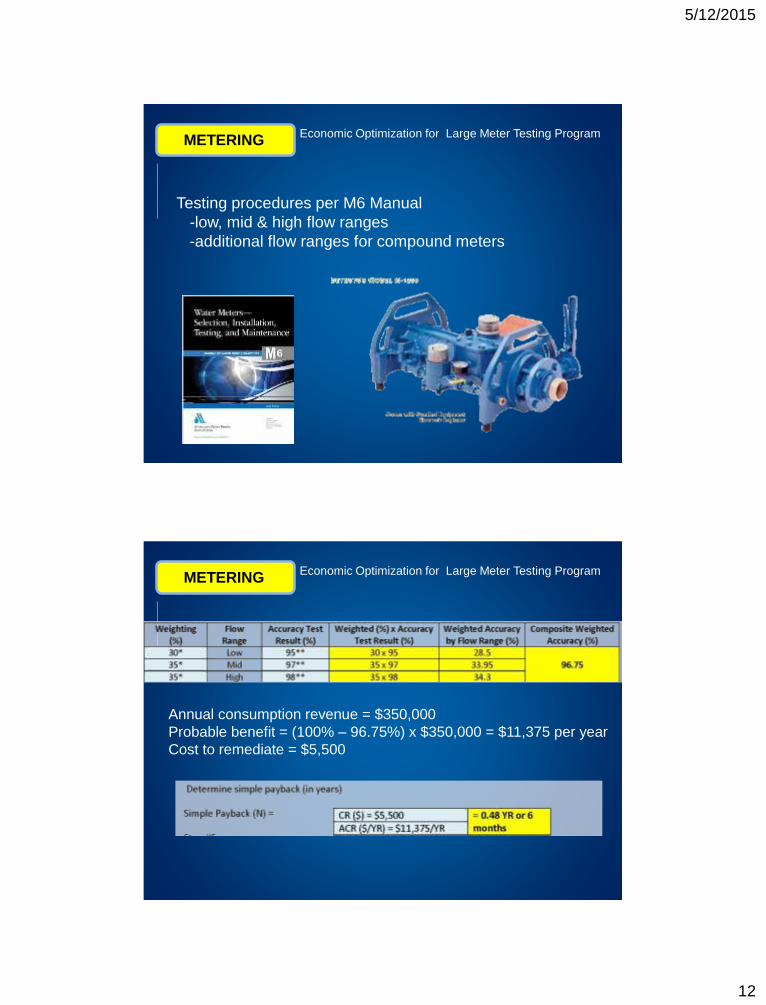
METERINGEconomic Optimization for Large Meter Testing Program
Testing procedures per M6 Manual
-low, mid & high flow ranges
-additional flow ranges for compound meters
METERINGEconomic Optimization for Large Meter Testing Program
Annual consumption revenue = $350,000
Probable benefit = (100% – 96.75%) x $350,000 = $11,375 per year
Cost to remediate = $5,500
5/12/2015
13
single test cost (est.) 300 predicted inaccuracy (avg.) 2%
single repair cost (est.) 250
Test Frequency
semi-annual annual Every 2 yrs Every 3 yrsmonthly revenue threshold 4,583$ 2,292$ 1,146$ 764$
annualized test cost 600$ 300$ 150$ 100$
annualized repair cost 500$ 250$ 125$ 83$
annualized test+repair cost 1,100$ 550$ 275$ 183$
annual revenue threshold 55,000$ 27,500$ 13,750$ 9,167$
75.00%
80.00%
85.00%
90.00%
95.00%
100.00%
105.00%
0 5 10 15 20
Me
ter
Acc
ura
cy