It’s Understanding and Application - NNOHA€™s Understanding and Application in the Dental...
62
It’s Understanding and Application in the Dental Practice Dr. James Patsis, MBA Master Black Belt Lean Six Sigma In Healthcare November 11, 2013
Transcript of It’s Understanding and Application - NNOHA€™s Understanding and Application in the Dental...

It’s Understanding and Application
in the Dental Practice
Dr. James Patsis, MBA Master Black Belt Lean Six Sigma
In Healthcare November 11, 2013

Process Management
Healthcare Management Engineering
Healthcare Innovation
Systems Engineering
Business Management
Information Technology
Healthcare Policy
Healthcare Management Engineer (HME)
Understanding, Managing, and Improving Complex Health Systems in through Many Disciplines
12 minutes
Existing Area
5 minutes
Redesigned Area Time Savings: Before: 12 Min After: 5 Min Total 7 Min Cost to Improve = $896 # of Films Taken/Yr =1,200 Overhead Cost/Hr = $156 Time Savings in Hrs =140 Time Cost Savings =$21,840 # of Patient Slots Now Available =187 Productivity Increase =$29,172 Total Cumulative Improvement =$51,012
Traditional Management Approach
- Resources • Brainstormed: For Patient Convenience and to
reduce wait times, the Centrally Located Clinic
will be Separated into 2 Clinics
- Results Based on Assumption: • Patients will chose the more conveniently
located clinic and patient arrival rate is equal
between the 2 clinics
-Outcome
• 54 Minute Wait Times!
Queueing Analytic Theory Application
- Resources • Applied Systems/Operations Management
Methodology to Evaluate Quantitatively the
Effect of Clinic Separation
- Results Based on Calculation: • Random Patient Arrival Based on Poisson
Statistical Process Analysis, Calculation of
Final Steady-State Probability and Little’s
Formula
-Outcome
• 25.5 Minute Wait Times!!!
Queue DentistClinic 14 Patient/ 2 Dentists
14 Patient/ 2 Dentists 28 Patient/ 4 Dentists
Outpatient Dental Clinic and 4 Dentists
Do We Separate or Centralize the Clinics?

Who are these guys?
Samuel Pierpont Langley Orville and Wilbur Wright
Systems Thinking and Engineering

Systems Thinking and Engineering
“The Winner” “The Loser”
$70,000 in Government Funding (1903) The Favored Guy to Win
50 hp Engine
$0 in Government Funding (1903) The Underdogs
12 hp Engine

Lecture Outline What is Quality Healthcare?
Defining the Meaning of Quality
The Cost of Poor Quality (COPQ) Conformance Costs
Non-Conformance Costs
Calculating the Cost of Poor Quality (COPQ)
Quantifying Practice Quality Improvement
Overview

Learning Objectives
Examine the Definition of Quality
Understanding the Cost of Poor Quality
Define How to Calculate the Cost of Poor Quality
Understand How to Use the Cost of Poor Quality Flow Chart
Understand How to Quantify Quality Practice Improvement

What is Quality Healthcare?
Policy Inputs Result in Programs that Stimulate Healthcare
Quality

What is Quality Healthcare?
“Quality is “fitness for use” - Juran
“Quality is “conformance to requirements” - Cosby
“Quality is “improvement of the process not inspections” - Deming

Safety Do We Over-Expose the Patient? Are Patients Provide Appropriate Shielding?
Effectiveness Are Significant Findings Placed into Treatment Plans? How Often are Films Retaken?
Patient Centeredness Do We Advise Patients Why Dental Films are Being Taken?
Timeliness Are the Correct Pre-Treatment Films Taken Prior to Treatment? Are Referral Films Provided to Specialists in a Timely Manner
Efficiency Are Periodic Films Done Correctly and Have the Quality Needed to Be Read
Equitable Do Un-insured Patients Receive the Same Radiographic Films as Insured Patients?
What is Quality Healthcare?
Institute of Medicine Applied to Dental Radiographs

Consumer Satisfaction and Use by People
Producer’s Perspective Consumer’s Perspective
Quality of Conformance
• Conformance to specifications
• Cost
Quality of Design
• Quality characteristics • Price
Marketing Production
Meaning of Quality
What is Quality Healthcare?
A Framework for Quality

Quality Defined
Quality of Design- refers to the features to characteristics of a product that differentiate functionally similar products.
Compare a Porsche to VW. The Porsche has many high-end features: speed, cutting-end engineering, advanced technology, luxury, and brand appeal.
Quality of Conformance is a measure of how well the product meets its requirements or specifications. How well it is built.
The VW is designed to drive and it does because quality exists within its requirements and specifications.
For example, if the care is designed to be economical, robust, and reliable as designed, the desired quality exists within the brand perception as seen by the consumer

Consumer’s Perspective
Quality of Design Designing quality characteristics
into a product or service
A Porsche and VW are equally “fit for use,” but with different design dimensions
Meaning of Quality

Quality of Conformance Making Sure a Product or
Service is Produced According to Its Use New tires do not conform to
specifications if they wobble
The hotel is not functioning according to specifications of its design if it is not clean when a guest checks in.
Meaning of Quality
Producer’s Perspective

What’s the Ultimate Measure of Quality?
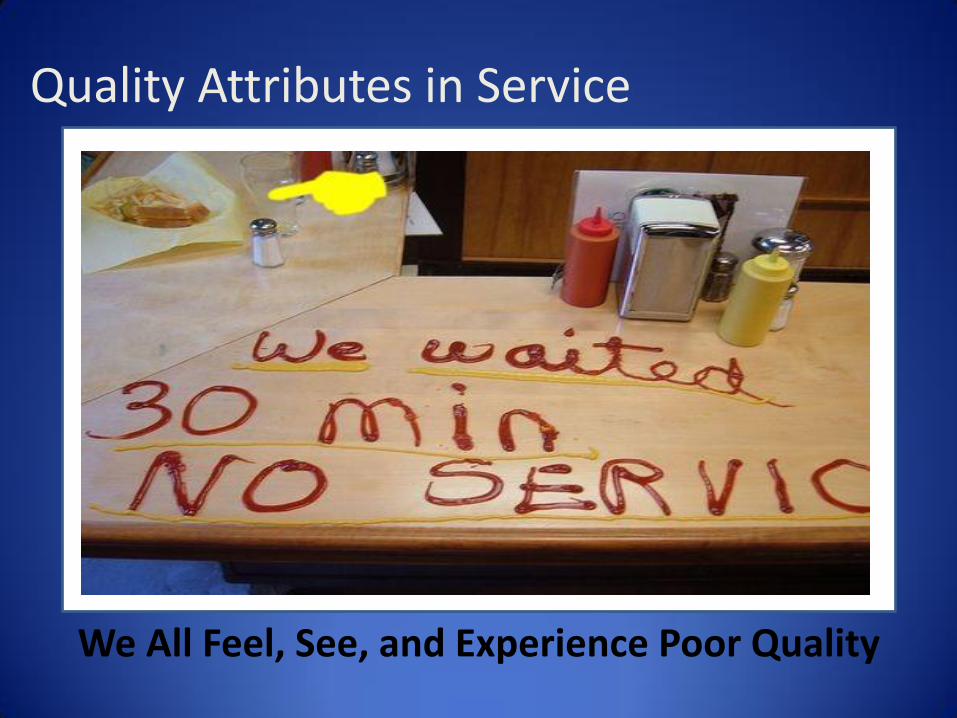
Quality Attributes in Service
Benchmark “Best” Level of Quality
Achievement One Company or Companies Seek to Achieve
Timeliness How Quickly a Service is Provided
“quickest, friendliest, most
accurate service
available.”
We All Feel, See, and Experience Poor Quality

Picture This!
• 40% of Dental Practice Waste is Internal and External Quality Cost • This Practice Waste Negatively Impacts Practice Delivery

… Most Non-Profitable Practices!
Poor Esthetic or General Appearance
Lack of Standard Practice Manuals or Work Responsibilities
No Provider Leadership
Poor Scheduling
Patient Not Being Told or Aware What Procedure Will Be Done
Poor, Incorrect and/or Non-Existent Chart Writing and Treatment Planning
Fees are Discussed Chair-side
Dentist Doing Hygiene
What I Observe in…

Seven Quality Tools
Check Sheet
Pareto Analysis and Graph
Histograms
Cause and Effect Diagrams
Scatter Diagram
Statistical Process Control (SPC) Chart

Copyright 2006 John Wiley & Sons, Inc.
3-19
A Check Sheet
Elements Missing from the Operatory June to July 2013
Chair Master Control Off ||||
No Saliva Injector |||| |||| |||| ||||
No High Speed Handpiece ||
Patient w/o Patient Bib |||| |||| ||
Extraction Setup Not Complete|||||
Consent Forms Not Signed |||| ||
No Slow-Speed |||
Topical Applied to Wrong Tooth

Quality Parameter Measured Count (in Numbers)
Percent Cumulative Percent
6-Month Recall 11 27.5 27.5%
Next Procedure Visit Written 9 22.5 50.0%
Patient Perio Chart Completed 8 20.% 70.0%
Radiographs in Order 7 17.5% 87.5%
Progress Notes Written 4 10.0% 97.5%
Documentation of Medical Conditions 1 2.5% 100%
Completed Patient Demographics 0 0.0% 100%
Patient Medical History 0 0.0% 100%
Super Bill Correlates with Progress Notes 0 0.0% 100%
Completed Tooth Charting 0 0.0% 100%
Total 40 100% 100%
Pareto Analysis

Histogram
0
5
10
15
20
1 2 6 13 10 16 19 17 12 16 2017 13 5 6 2 1

Mean =Target
Some Key Measure
Histogram
Mean =Target
Is ‘Our Practice Delivery’
Voice of the Process

3 s
+ / - 6 s
L S L U S L
Patient Expectations = Voice of the Customer
Mean
3-Sigma
Histogram
3-Sigma
Voice of the Process

Under Performing
Practice
`````
Methods *No Chart Reviews
*Incomplete Charts
*Poor Patient Scheduling
Measurements
* No Practice Standard Metrics
* Lacks Practice Metrics
Manpower
Milieu
Poorly Trained
Shortage of Dentists
Cramp Operatories
Aging Infrastructure
`````
Materials
Machines Old and Outdated Dental Chairs
Not the Right Equipment
Shortage of Small Equipment
Poor Quality
Outdate Materials
Need Small Instruments
Cause Effect Diagram
Fishbone or Ishikawa Chart

Scatter Diagram

Control Chart

$391,567 Salaries
$97,892 Fringe
Benefits
$64,200. Depreciation
$42,600.00 Supplies
$40,000 Lab
$33,000 Bad Debt
Salaries $391,567 50%
Fringe Benefits $97,892 12%
Depreciation $64,200 8%
Clinical Supplies $42,600 5%
Lab Fees $40,000 5%
Bad Debt $33,000 4%
Rent/Mortgage $28,200 4%
Contracts $20,800 3%
Insurance $17,500 2%
Equipment Maintenance $13,800 2%
Utilities $9,568 1%
Housekeeping $6,600 1%
Communications $5,500 1%
Staff Training $4,7000 1%
Laundry $3,7000 0.5%
Office Supplies $2,968 0.4%
Payroll Service $2,100 0.3%
Average Dental Practice Costs in $ and %
Total Expenses =$784,695
The Cost of Poor Quality

We See, Experience and Capture
only about 5% of Poor Quality
The More Complete Definition of Poor Quality is Defined as the Hidden Portion of the “Poor Quality” Iceberg
The Visual Portion is More Apparent because the Hidden
Portion is Unseen
Patient No-Show
Lab Rework Costs
Rework
Customer Returns
Re-Examination Visits Patient Treatment Plan Rejections
Patient Complaints and Recalls External Failures
Lawsuit Fines or License Suspension
The Cost of Poor Quality

Late Reporting High Office Costs Pricing or
Billing Errors Excessive Insurance
Telephone Contact Calls Incorrectly Completed Insurance
Forms and Applications
Lack of Follow-up
on Patient of Records Excessive Employee Turnover
Treatment Plan Delays
Excess Supply Inventory
Excessive Computer System
Costs
Overdue Receivables
Poor Complaintt Handling
Unused Practice Capacity
Dissatisfied Customer
And Stakeholders
Excess Time to
Complete Tasks
Patient No-Show
Lab Rework Costs
Rework
Customer Returns
Re-Examination Visits
Patient Treatment Rejections
Patient Complaints and Recalls
Development Cost
of Failed Programs
The Hidden and Seen Cost of Poor Quality (COPQ) are Non-Conformance
Components of No-or –Low Quality
Customer Allowances
External Failures
Internal Failures
Lawsuit Fines or License Suspension
The Cost of Poor Quality

Conformance
Non- Conformance
Total Cost Of Poor Quality
Prevention Costs to Prevent
Poor Quality (0-5%)
Appraisal Costs to Test, Measure, and Audit for Quality (10- 50%)
Internal Failures Occur Prior to Delivery (20-40%)
External Failures Occur Prior to Delivery (20-40%)
$
The Cost of Poor Quality
(Philip Crosby)
(Joseph Juran, 1951)
(Armand Feigenbaum, 1956)
(John Harrington, 1970)

Quality Measure Financial Measure Non-Financial Measure
Customer-Based
External failure cost.
Results of customer satisfaction survey. On-time delivery. Number of customer Complaints No-Shows
Internal Processes Within Your Practice
Appraisal cost. Internal failure cost. Prevention cost.
Defect rates Yields Lead times Idle capacity Unscheduled machine and/or Practice downtime
The Cost of Poor Quality

Total Quality Costs are the sum of prevention costs, appraisal costs, and internal and external failure costs.
The Cost of Poor Quality
Cost of Quality follows a 1: 10 :100 Rule Difference between Non-Conformance and Conformance Cost
Non-Conformance Cost- Doing Things Wrong Accounts for 20 to 35% of Practice Revenues and Conformance Cost-Doing Things Right Accounts for
3 to 4% of Practice Revenues

Quality Costs vs. Defect
Graph Quality
Cost
100
% Percent Defects 0%
High
Low
The Cost of Poor Quality

100%
Cost of Failures (Non-Conformance Quality)
Cost of Control (Conformance Quality)
0%
High
Low
Cost
Percent Defects
Costs of Quality
The Cost of Poor Quality

Cost of Appraisal plus Prevention
External and Internal Failure Costs
Total Quality Costs
Quality 0% 100%
Co
st p
er G
oo
d
Un
it o
f P
rod
uct
/Ser
vice
The Cost of Poor Quality
High
Low

Start Year 1 Year 2 Year 3 Year 4
Conformance Costs (Appraisal and Prevention)
Non-Conformance Costs (Internal and External Failure)
Total C
ost o
f Qu
ality
Year 5
Re
aliz
ed
Qu
alit
y Im
pro
vem
ent
Decrease Non-Conformance Costs
The Cost of Poor Quality

Staff Planning and Educational Training
Equipment Maintenance Training Office Training Manuals Radiography Training Preventive Maintenance Housekeeping OSHA and Infection Control
Training Computer Training Practice Manuals Implementing Practice Quality
Management Programs
Prevention costs are the costs
of trying to prevent poor-
quality products from occuring
and not escalating to thee
customer.
Prevention reflects the quality
philosophy of "do it right the
first time," the ultimate goal of
a quality management program.
Prevention Costs
The Cost of Poor Quality

It is the Cost Associated Catching or Preventing Defects from Occurring in the Dental Office.
It is a Proactive Approach and is About Prevention of Parts and Product Failure that Affects Dental Delivery.
Operator costs the time spent to gather data for testing product quality, equipment adjustments and to stop work to assess quality
Unfortunately Performing Appraisal Activities Doesn't keep Defects from Happening. (MURPHY’S LAW)
Inspection of Equipment, Supplies, and Office Space
Insurance Accounting Audits
Scheduling and Chart Audits
Dental Equipment License Fees
X-Ray Calibration and Fees
Dental Staff Inspection
CDC, OSHA, Joint Commission Accreditation
Testing of Equipment, Supplies, and Office Space
Staff Survey Audits
Product Expirations
Training of Quality Teams
Appraisal Costs
The Cost of Poor Quality

Internal Failure Costs are Incurred when Poor-Quality Products are Discovered before they are Delivered to the Customer.
Internal Failure Costs Result from Products or Services not Conforming to Patient Expectations
The Goal is to Identify all Internal Failures and Resultant Costs, and then Systematically Identify and Eliminate Root Courses.
Dental Procedures Redos and Rework
Incorrectly Ordered Supplies
Equipment Repair
Lost Sales (any cause)
Accounting and Dental Insurance Errors
Staff Accidents, Injuries
Absenteeism
No Shows
Payroll Errors
Supplier Problems
Abandoned Programs –
“Selling Merchandise from the Office”
Internal Failure Costs
The Cost of Poor Quality

External Failure Costs Represent a Category in the Total Cost of Quality where the Quality Costs are related to Defects Found after Delivery of the Product to the Customer.
External Failure Costs are Generally the Highest of the 4 Cost of Quality Categories Since the Full Value of Work and Processes had to be Performed to Get the Procedure Done by the Patient.
Patient Defections, Complaints and Dissatisfaction
Time and Cost Spent Resolving Insurance, Patient, or Supply Orders Problems
Lawsuits or Legal Fees
License Issues from the State Board
Late Fees, Interest and Penalties
Lawsuits
Patient Injury
Lost Market Share
Patient Product Returns
External Failure Costs
The Cost of Poor Quality

The Juran Trilogy
Something
Bad Always
Happens! Here
The Lab
Case is
not Here!
The Patient didn’t
Pre-Medicate Damn! We
took out the
Wrong Tooth…
Calculating the Cost of Poor Quality
Quality Planning, Improvement, and Control

Item Annual Amount
Restorative Rework $ 5,000
Equipment Repair $6,000
Returned Insurance Forms $3,200
Dental Supply Returns $8,000
Patient Refunds $48,000
Patient No-Shows $82,000
Insurance Audit Fees $1,000
Item Annual Amount
Staff Needle Stick/ Hospital Fees $48,000
OSHA Training $140
Customer Satisfaction Survey $100
Computer Training $1,000
Inspection of Equipment $500
Lost Visits due to Failed Equip $82,750
Returned Lab Work Before Visits $14,000
The Total Cost of Poor Quality is the Sum of all these Costs
Calculating Cost of Poor Quality

Item Annual Amount Category
OSHA Training $140 Prevention
Computer Training $1,000 Prevention
Customer Satisfaction Survey $100 Appraisal
Insurance and Accounting Audit $1,000 Appraisal
Inspection of Equipment $500 Appraisal
Staff Needle Stick and Hospital Fees $45,000 Internal Failure
Returned Lab Work Before Patient Visits $14,000 Internal Failure
Restorative Rework $5,000 Internal Failure
Equipment Repair $6,000 Internal Failure
Dental Supply Returns $8,000 Internal Failure
No-Show $82,000 Internal Failure
Patient Refunds $48,000 External Failure
Returned Insurance Forms Due Errors $3,200 External Failure
Lost Visits due to Equipment Failure $14,000 External Failure
Calculating Cost of Poor Quality

Look at the Costs by Category:
Category Total % of Total
Prevention $1,140 0.53%
Appraisal $1,600 0.75%
Internal Failure $145,900 68.29%
External Failure $65,000 30.42%
Total $213,640 100.00%
Clearly, Failure (Internal and External) Costs dominate the Cost of Poor Quality for this Practice. So, There are Lots of Opportunities to Drive
Quality Improvement by Addressing these Failure Costs
Calculating Cost of Poor Quality

Category Total % of Total
Prevention $1,140 0.53%
Appraisal $1,600 0.75%
Internal Failure $145,900 68.29%
External Failure $65,000 30.42%
Total $213,640 100.00%

External and Internal Failure equals Increased Practice Costs and Use of Dental Supplies
Failures
(Internal
and External)
Appraisal
Prevention
Failures
Appraisal
Prevention
Pre-Lean Six Sigma Improvement Process
Resultant-Lean Six Sigma Improvement Process
98.69%
0.53%
< 10%
< 20%
> 70% 0.75%
“An Ounce of Prevention is Worth a Pound of Cure”
Calculating the Cost of Poor Quality

Quality Costs % of Sales
Prevention costs:
Preventive Maintenance $35,000
Staff and Quality Training 80,000 $115,000 4.11%
Appraisal costs:
Materials Inspection $20,000
Equipment Inspection 10,000
Process Improvement 38,000 68,000 2.43%
Internal failure costs:
Insurance Claims Re-Submission $50,000
Expired Inventory 35,000 85,000 3.04 %
External failure costs:
Customer Complaints $25,000
Customer Defection 25,000
Customer Lab Repair 15,000 65,000 2.32%
Total quality costs $333,000 11.90% ======= =====
Calculating the Cost of Poor Quality

Yes
Evaluate External Failure data to
determine priority (Pareto, etc)
Increase Appraisal Activities in Targeted Areas (Temporarily)
Verify the Effectiveness of the Appraisal Activities by reducing Targeted External Failures and
Increase Internal Costs
Increase Prevention Activities- Initiate Process Improvement
Activities in Target Areas
Verify Improvement through Internal
Failure Data
Is the Quality Level for the
Targeted Problem
Acceptable?
Reduce Appraisal Activities on Targeted Areas
Evaluate Internal Failure data to
determine priority (Pareto, etc)
Yes
No
No
No
No
No
No
No
No
No
Are Your Appraisal Costs Acceptable?
Are Your Internal Failure Costs Acceptable?
No
Cost of Poor Quality Flow Chart
Unacceptable External Failure Costs Represent a Category in the Total Cost of Quality where
the Quality Costs are related to Defects Found after
Delivery of the Product to the Customer.

Quantifying Practice Quality Improvement
Quality Costs Revenue % of Practice Revenue
2001 $440,000 $2,200,000 20.0
2002 423,000 2,350,000 18.0
2003 412,500 2,750,000 15.0
2004 392,000 2,800,000 14.0
2005 280,000 2,800,000 10.0
Multiple Period Trends Graph

5
10
15
20
0 1 2 3 4
5
% of
Sale
s
Year
Total Quality Costs are Decreasing Over Time and As a % or Sales
Quantifying Practice Quality Improvement
Multiple Period Trends Graph

A Community-Based Dental Center (8-Chairs) A 3-Month Lean Six-Sigma Project
Practice Metrics Feb. ‘09 April ‘09 Results % Change
Monthly Revenues $87,000 $135,000 $48,000 55%
Monthly Collections $61,800 $73,300 $11,500 19%
Dental Patient Scheduled 907 1180 273 30%
Dental Patients Seen 550 865 315 57%
Cycle Time for 2-Surface Amalgam 60 min 40 min (20 min) (33%)
Patients Scheduled/Day/Dentist 8 12 4 50%
Chart Reviews (% Compliance) 30% 80% 50% 167%
Dental Patients Seen/Hour
0.8 1.2 0.4 50%
No-Show Rate 32% 27% (5%) (16%)
Quantifying Practice Quality Improvement
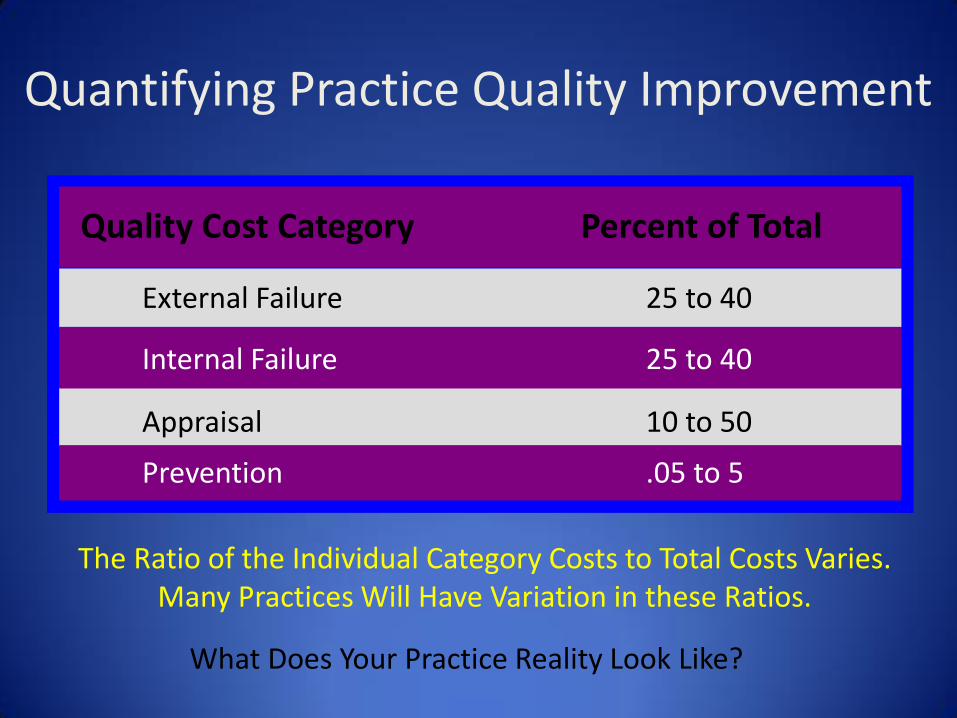
The Ratio of the Individual Category Costs to Total Costs Varies.
Many Practices Will Have Variation in these Ratios.
Quality Cost Category Percent of Total
External Failure 25 to 40
Internal Failure 25 to 40
Appraisal 10 to 50
Prevention .05 to 5
What Does Your Practice Reality Look Like?
Quantifying Practice Quality Improvement

COPQ Sigma Level DPMO Capability
< 10% of Revenue 6 sigma 3.4 World Class
10 to 15% of Revenues
5 sigma 230 Superior Class
15 to 20% of Revenues
4 sigma 6200 Above Industry Average
20 to 30% of Revenues
3 sigma 67,000 Industry Average
30 to 40% of Revenues
2 sigma 310,000 Below Average
40% to 50% of Revenues
1 sigma 700,000 Poor
“Determines How Well Your Practice is Performing”
Quantifying Practice Quality Improvement

Dental Department Totals as
Percent
Totals
1) Patient Demo 0 % 0
2) Med History 0% 0
3) Med Condition 2.5% 1
4) X-Rays in Order 17.5% 7
5) Progress Notes 10% 4
6) Written Orders for
Medicine Recorded
22.5% 9
7) 6 Month Recall 27.5% 11
8) Super Bill to Progress
Notes
- -
9) Tooth Charting 0 % 0
10) Periodontal
Charting
20% 8
Total Indicators in
Non-Compliance 100% 40
We Went from 1000 errors>110 Errors>40: Want 0 Errors
Patient Chart Review Defects Per Million Opportunity (DPMO)
Quantifying Practice Quality Improvement

Dental Department Totals as
Percent
Totals
1) Patient Demo 0 % 0
2) Med History 0% 0
3) Med Condition 2.5% 1
4) X-Rays in Order 17.5% 7
5) Progress Notes 10% 4
6) Written Orders for
Medicine Recorded
22.5% 9
7) 6 Month Recall 27.5% 11
8) Super Bill to Progress
Notes
- -
9) Tooth Charting 0 % 0
10) Periodontal
Charting
20% 8
Total Indicators in
Non-Compliance 100% 40
40 Errors = 20,000 DPMO = ~3.5 Six Sigma Level
Dental Patient Chart Review
2,000 Charts Reviewed 10 Unique Opportunities or 20,000 Opportunities to Create 40 Errors were Observed Defects per Opportunity (DPO) = # of defects observed on a unit # of opportunities on a unit Therefore, the DPO is 40/20,000 or 0.002
By Multiplying our DPO of 0.002 by 1,000,000 We Get Our Defects per Million Opportunities or (DPMO) of : 2,000. 40 errors out of 20,000 opportunities we get a Six Sigma Score of ~3.5 If 5 errors out of 20,000 opportunities were created we get a Six Sigma Score of ~5.0 1 error out of 20,000 opportunities were created we get a Six Sigma Score of ~5.4
Defects Per Million Opportunity (DPMO)
Quantifying Practice Quality Improvement

Measurement How are we doing?
“When We Don’t Speak from Data, Practice Improvement Fails”
Assessment
Are we meeting
expectations?
Improvement
What do we Need to
Improve
Performance?
Yes
No
Yes
Quantifying Practice Quality Improvement

Identify and Eliminate Practice Delivery Gaps
Measure As-Is Practice Delivery
Desired Measures of To-Be Process’s Performance
What does The Practice
Do Now
What does The Practice
Need for the Future
Existing or
As-Is
Situation
Redesigned
or To-Be
Situation
Performance Gap
Capabilities Gap
Dental Office Accessibility
Quantifying Practice Quality Improvement

Criteria Scale Practice Problem A
Practice Problem B
Practice Problem C
Practice Goal Points = 25
5 = Most Supportive 3 = Supportive 1 = Least Supportive
75 125 25
Return on Investment (ROI)
Points = 25
5 = Most Supportive 3 = Supportive 1 = Least Supportive
25 75 25
Frequency of Occurrence Points = 25
5 = Most Acute 3 = Acute 1 = Least Acute
25 75 25
State of Urgency Points = 15
5 = Most Urgent 3 = Urgent 1 = Least Urgent
45 45 15
Potential Improvement Impact Points = 10
5 = Most Impact 3 = Impact 1 = Least Impact
30 50 10
Risk Management Points = 5
5 = Least Risk 3 = Risk 1 = Most Risk
5 5 25
Project Size Points = 5
5 = Most Manageable 3 = Manageable 1 = Least Manageable
5 25 5
Change Management Points = 5
5 = Least Resistance 3 = Resistance 1 = Least Resistance
5 25 5
Total 215 425 135
Quantifying Practice Quality Improvement

COPQ can be Used in Pursuit of Quality Improvement, Customer Satisfaction and Basic Data for Continual Process Improvement
High Internal and External Costs Defines Inefficient and Ineffective Dental Practice Delivery
COPQ Defines Where the Need and Opportunities to Develop Quality Improvement Initiatives
COPQ provides a Means to Correctly Distribute Controllable Quality Cost for Maximum Profits and Promotes the Effective Use of Resources
Overview: Cost of Poor Quality

COPQ can Measure, Analyze and Monitor What Resource are Needed to Achieve Better Quality Products and Services and Customer Satisfaction
COPQ Costs are not Incurred or Allocated, but Rather Caused
COPQ Costs Information itself does not solve quality problems, nor does it suggest specific solutions. Problems are solved by tracing the cause of a quality deficiency
COPQ can Measure, Program, and Analyze What Budget are needed to Achieve Better Quality Products and Services and Customer Satisfaction
Reducing the cost of poor quality is one of the best ways to increase a company's profit.
Overview: Cost of Poor Quality

James Patsis DDS MBA p3Dental Solutions www.p3dental.com [email protected] 10533 Tuckerman Heights Circle North Bethesda, MD 20852 Resources: Excellent Review Article on Cost of Quality http://www.panasonicfa.com/pdfs/reducing_cost.pdf
Questions???