![1] Cover Page - FSU · Total liabilities increased by $14,534 (12.1%) as a result of a $133 increase in current liabilities and a $14,401 increase in noncurrent liabilities. Noncurrent](https://static.fdocuments.us/doc/165x107/5fd8dd2e6286e6103f06f1a9/1-cover-page-fsu-total-liabilities-increased-by-14534-121-as-a-result-of.jpg)
ITR Junho 2014 Inglês vs 29 09 14 - Copel · Other noncurrent receivables 11 95 ... NET INCOME...
108
COPEL Companhia Paranaense de Energia Corporate Taxpayer's ID (CNPJ/MF) 76.483.817/0001-20 State Registration - 10146326-50 Publicly-Held Company - CVM 1431-1 www.copel.com [email protected] Rua Coronel Dulcídio, 800, Batel - Curitiba - PR CEP 80420-170 Quarterly Financial Information June / 2014
Transcript of ITR Junho 2014 Inglês vs 29 09 14 - Copel · Other noncurrent receivables 11 95 ... NET INCOME...
COPEL
Companhia Paranaense de Energia
Corporate Taxpayer's ID (CNPJ/MF) 76.483.817/0001-20
State Registration - 10146326-50
Publicly-Held Company - CVM 1431-1
www.copel.com [email protected]
Rua Coronel Dulcídio, 800, Batel - Curitiba - PR
CEP 80420-170
Quarterly Financial Information
June / 2014

SUMMARY QUARTERLY FINANCIAL INFORMATION .................................................................................................................... 3
Statements of Financial Position ............................................................................................................................ 3
Statements of Income ............................................................................................................................................ 5
Statements of Income – Turnover for the second quarter ...................................................................................... 6
Statements of Comprehensive Income .................................................................................................................. 7
Statements of Comprehensive Income Turnover for the second quarter ................................................................ 8
Statements of Changes in Equity ........................................................................................................................... 9
Statements of Cash Flows ................................................................................................................................... 10
Statements of Added Value ................................................................................................................................. 12
NOTES TO THE QUARTELY FINANCIAL INFORMATION .......................................................................................... 14
1 General Information .............................................................................................................................. 14
2 Basis of Preparation .............................................................................................................................. 14
3 Significant Accounting Policies .............................................................................................................. 15
4 Cash and Cash Equivalents .................................................................................................................. 15
5 Bonds and Securities ............................................................................................................................ 16
6 Collaterals and Escrow Accounts .......................................................................................................... 17
7 Trade Accounts Receivable .................................................................................................................. 18
8 CRC Transferred to the State Government of Paraná ........................................................................... 19
9 Accounts receivable related to the concession ...................................................................................... 20
10 Accounts receivable related to the concession extension ...................................................................... 21
11 Other Receivables ................................................................................................................................ 21
12 Inventories ............................................................................................................................................ 22
13 Income Tax, Social Contribution and Other Taxes ................................................................................ 22
14 Judicial Deposits ................................................................................................................................... 26
15 Related parties ...................................................................................................................................... 27
16 Investments .......................................................................................................................................... 29
17 Property, Plant and Equipment.............................................................................................................. 36
18 Intangible Asset .................................................................................................................................... 39
19 Payroll, Social Charges and Accruals .................................................................................................... 41
20 Suppliers ............................................................................................................................................... 41
21 Loans and Financing ............................................................................................................................. 43
22 Debentures ........................................................................................................................................... 49
23 Post-Employment Benefits .................................................................................................................... 50
24 Customer Charges Due ........................................................................................................................ 52
25 Research and Development and Energy Efficiency ............................................................................... 52
26 Accounts Payable related to concession - Use of Public Property ......................................................... 53
27 Other Accounts Payable ....................................................................................................................... 54
28 Provision for Contingencies ................................................................................................................... 54
29 Equity… ................................................................................................................................................ 61
30 Operating Revenues ............................................................................................................................. 63
31 Operating Costs and Expenses ............................................................................................................. 67
32 Financial Results ................................................................................................................................... 74
33 Operating Segment ............................................................................................................................... 75
34 Financial Instruments ............................................................................................................................ 79
35 Related Party Transactions ................................................................................................................... 90
36 Insurance .............................................................................................................................................. 94
37 Regulatory Assets and Liabilities ........................................................................................................... 94
38 Law 12.973 of May 15, 2014 ................................................................................................................. 97
COMMENTS ON PERFORMANCE FOR THE PERIOD ................................................................................................ 98
INDEPENDENT AUDITORS’ REVIEW REPORT ........................................................................................................ 107

3
QUARTERLY FINANCIAL INFORMATION
Statements of Financial Position as of June 30, 2014 and December 31, 2013
All amounts expressed in thousands of Brazilian rea is, unless otherwise stated
ASSETS Note Parent Company Consolidated
06.30.2014 12.31.2013 06.30.2014 12.31.2013
CURRENT ASSETSCash and cash equivalents 4 535,830 10,410 2,063,537 1,741,632 Bonds and securities 5 147 186 429,447 389,222 Collaterals and escrow accounts 6 - - 21,235 1,976 Trade accounts receivable 7 - - 1,847,832 1,337,628 Dividends receivable 15.1 450,943 381,371 17,795 9,500 CRC transferred to the State Government of Paraná 8 89,184 85,448 89,184 85,448 Accounts receivable related to the concession 9 - - 6,258 4,396 Accounts receivable related to the concession extension 10 - - 385,264 352,161 Other current receivables 11 21,005 3,869 502,416 395,890 Inventories 12 - - 140,515 139,278 Income Tax and Social Contribution 13.1 20,532 42,494 65,506 133,158 Other current recoverable taxes 13.3 - - 117,882 70,013 Prepaid expenses - - - 17,652 19,982
1,117,641 523,778 5,704,523 4,680,284
NONCURRENT ASSETSLong Term Assets
Bonds and securities 5 - - 115,646 120,536 Collaterals and escrow accounts 6 - - 46,337 45,371 Trade accounts receivable 7 - - 71,239 132,686 CRC transferred to the State Government of Paraná 8 1,276,497 1,295,106 1,276,497 1,295,106 Judicial deposits 14 272,744 272,115 704,676 675,225 Accounts receivable related to the concession 9 - - 3,898,826 3,484,268 Accounts receivable related to the concession extension 10 - - 189,564 365,645 Other noncurrent receivables 11 95 - 23,448 29,435 Income Tax and Social Contribution 13.1 177,932 169,717 191,865 197,659 Other noncurrent recoverable taxes 13.3 - - 171,421 124,498 Deferred Income Tax and Social Contribution 13.2 108,850 91,205 887,087 753,413 Prepaid expenses - - - 197 399 Receivable from related parties 15.1 176,067 64,815 115,696 -
2,012,185 1,892,958 7,692,499 7,224,241
Investments 16 12,342,413 12,055,619 1,393,943 1,187,927
Property, Plant and Equipment, net 17 30,073 29 8,158,830 7,983,632
Intangible Assets 18 1,939 - 2,116,183 2,035,361
14,386,610 13,948,606 19,361,455 18,431,161
TOTAL ASSETS 15,504,251 14,472,384 25,065,978 23,111,445
Notes are an integral part of this quarterly inform ation

4
Statements of Financial Position as of June 30, 2014 and December 31, 2013 (continue d)
All amounts expressed in thousands of Brazilian rea is, unless otherwise stated
LIABILITIES Note Parent Company Consolidated
06.30.2014 12.31.2013 06.30.2014 12.31.2013
CURRENT LIABILITIESPayroll, social charges and accruals 19 18,935 4,946 185,585 239,685 Payable to subsidiary 15.2 - 468,317 - - Suppliers 20 3,316 3,211 1,235,215 1,092,239 Income Tax and Social Contribution Payable 13.1 - - 373,817 297,620 Other taxes due 13.3 747 25,481 210,818 300,731 Loans and financing 21 303,759 562,801 566,088 957,106 Debentures 22 10,491 - 399,769 57,462 Dividend payable - 3,372 3,047 4,579 18,713 Post employment benefits 23 14 2 31,041 29,983 Customer charges due 24 - - 24,897 37,994 Research and Development and Energy Efficiency 25 - - 126,537 127,860 Accounts payable related to concession - Use of Public Property 26 - - 52,532 51,481 Other accounts payable 27 27,010 16,432 162,883 137,011
367,644 1,084,237 3,373,761 3,347,885
NONCURRENT LIABILITIESSuppliers 20 - - 37,775 50,121 Other taxes due 13.3 497 40 77,499 68,402 Deferred Income Tax and Social Contribution 13.2 - - 343,794 420,501 Loans and financing 21 684,427 456,752 2,577,959 2,366,678 Debentures 22 994,216 - 2,167,473 1,150,483 Post employment benefits 23 17,754 2,169 971,926 937,249 Research and Development and Energy Efficiency 25 - - 194,905 154,721 Accounts payable related to concession - Use of Public Property 26 - - 430,146 420,293 Other accounts payable 27 - - 232 233 Provision for contingencies 28 278,579 277,847 1,370,415 1,266,127
1,975,473 736,808 8,172,124 6,834,808
EQUITYAttributable to controlling shareholder's 29.1
Capital 6,910,000 6,910,000 6,910,000 6,910,000 Equity valuation adjustments 929,459 983,159 929,459 983,159 Legal reserve 624,849 624,849 624,849 624,849 Profit retention reserve 3,897,833 3,897,833 3,897,833 3,897,833 Additional proposed dividends - 235,498 - 235,498 Accumulated Profit 798,993 - 798,993 -
13,161,134 12,651,339 13,161,134 12,651,339
Attributable to non-controlling interest 29.2 - - 358,959 277,413
13,161,134 12,651,339 13,520,093 12,928,752
TOTAL LIABILITIES & EQUITY 15,504,251 14,472,384 25,065,978 23,111,445
Notes are an integral part of this quarterly inform ation

5
Statements of Income for the six-month periods ended June 30, 2014 and 2 013
All amounts expressed in thousands of Brazilian rea is, unless otherwise stated
CONTINUING OPERATIONS Note Parent Company Consolidated
06.30.2014 06.30.2013 06.30.2014 06.30.2013
OPERATING REVENUES 30 - - 6,169,246 4,481,542
COST OF SALES AND SERVICES PROVIDED 31 - - (4,694,719) (3,225,213)
GROSS PROFIT - - 1,474,527 1,256,329
Operational expenses / incomeSelling expenses 31 - - (66,977) (44,647) General and administrative expenses 31 (59,860) (19,605) (263,163) (233,029) Other operational income (expenses) 31 (1,981) 14,350 (211,789) (199,224) Equity in earnings of investees 772,469 631,873 84,582 31,970
710,628 626,618 (457,347) (444,930)
PROFIT BEFORE FINANCIAL RESULTS AND TAXES 710,628 626,618 1,017,180 811,399
Financial resultsFinancial income 32 104,946 48,350 383,456 300,955 Financial expenses 32 (79,226) (37,389) (230,426) (151,999)
25,720 10,961 153,030 148,956
Profit Before Income Tax and Social Contribution 736 ,348 637,579 1,170,210 960,355
INCOME TAX AND SOCIAL CONTRIBUTION ON PROFITCurrent 13.4 - - (548,771) (438,740) Deferred 13.4 12,707 (5,118) 209,867 128,656
12,707 (5,118) (338,904) (310,084)
NET INCOME 749,055 632,461 831,306 650,271 Attributed to controlling shareholders - - 749,055 632,461 Attributed to non-controlling interest 29.2 - - 82,251 17,810
Basic and diluted net earning per share attributedTo parent company shareholders - in reais
Ordinary shares 29.1 2.61434 2.20741 2.61434 2.20741 Class "A" Preferred shares 29.1 2.87520 2.42814 2.87520 2.42814 Class "B" Preferred shares 29.1 2.87578 2.42814 2.87578 2.42814
Notes are an integral part of this quarterly inform ation

6
Statements of Income – Turnover for the second quar ter for the three-month and six-month periods ended Jun e 30, 2014 and 2013
All amounts expressed in thousands of Brazilian rea is, unless otherwise stated
CONTINUING OPERATIONS Parent Company
04.01.2014 01.01.2014 04.01.2013 01.01.2013
to 06.30.2014 to 06.30.2014 to 06.30.2013 to 06.30 .2013
OPERATING REVENUES - - - -
COST OF SALES AND SERVICES PROVIDED - - - -
GROSS PROFIT - - - -
Operational expenses / incomeGeneral and administrative expenses (32,928) (59,860) (14,283) (19,605) Other operational income (expenses) (1,494) (1,981) (8,617) 14,350 Equity in earnings of investees 243,283 772,469 254,712 631,873
208,861 710,628 231,812 626,618
PROFIT BEFORE FINANCIAL RESULTS AND TAXES 208,861 710,628 231,812 626,618
Financial resultsFinancial income 41,205 104,946 26,368 48,350 Financial expenses (53,374) (79,226) (19,972) (37,389)
(12,169) 25,720 6,396 10,961
Profit Before Income Tax and Social Contribution 196 ,692 736,348 238,208 637,579
INCOME TAX AND SOCIAL CONTRIBUTION ON PROFITCurrent 2,023 - - - Deferred 13,773 12,707 2,381 (5,118)
15,796 12,707 2,381 (5,118)
NET INCOME 212,488 749,055 240,589 632,461
Basic and diluted net earning per share attributedTo parent company shareholders - in reais
Ordinary shares 0.74162 2.61434 0.83970 2.20741 Class "A" Preferred shares 0.81512 2.87520 0.92463 2.42814 Class "B" Preferred shares 0.81579 2.87578 0.92366 2.42814
Notes are an integral part of this quarterly inform ation
CONTINUING OPERATIONS Consolidated
04.01.2014 01.01.2014 04.01.2013 01.01.2013
to 06.30.2014 to 06.30.2014 to 06.30.2013 to 06.30 .2013
OPERATING REVENUES 3,118,174 6,169,246 2,101,132 4,481,542
COST OF SALES AND SERVICES PROVIDED (2,534,747) (4,694,719) (1,518,632) (3,225,213)
GROSS PROFIT 583,427 1,474,527 582,500 1,256,329
Operational expenses / incomeSelling expenses (39,679) (66,977) (20,579) (44,647) General and administrative expenses (150,275) (263,163) (129,672) (233,029) Other operational income (expenses) (110,195) (211,789) (151,279) (199,224) Equity in earnings of investees 29,313 84,582 12,362 31,970
(270,836) (457,347) (289,168) (444,930)
PROFIT BEFORE FINANCIAL RESULTS AND TAXES 312,591 1,017,180 293,332 811,399
Financial resultsFinancial income 158,445 383,456 154,922 300,955 Financial expenses (116,382) (230,426) (79,865) (151,999)
42,063 153,030 75,057 148,956
Profit Before Income Tax and Social Contribution 354 ,654 1,170,210 368,389 960,355
INCOME TAX AND SOCIAL CONTRIBUTION ON PROFITCurrent (265,700) (548,771) (176,073) (438,740) Deferred 159,302 209,867 59,299 128,656
(106,398) (338,904) (116,774) (310,084)
NET INCOME 248,256 831,306 251,615 650,271 Attributed to controlling shareholders 212,488 749,055 240,589 632,461 Attributed to non-controlling interest 35,768 82,251 11,026 17,810
Notes are an integral part of this quarterly inform ation

7
Statements of Comprehensive Income for the six-month periods ended June 30, 2014 and 2 013
All amounts expressed in thousands of Brazilian rea is, unless otherwise stated
Note Parent Company Consolidated
06.30.2014 06.30.2013 06.30.2014 06.30.2013
NET INCOME FOR THE PERIOD 749,055 632,461 831,306 650,271 Other comprehensive income
Items that will never be reclassified to profit or loss
Losses on actuarial liabilities 29.1.2
Post employment benefits (14,429) - - -
Post employment benefits - equity 7,814 - (1,709) -
Taxes on other comprehensive income 29.1.2 4,906 - - -
Items that are or maybe reclassified to profit o r loss
Adjustments related to financial assets classified as available for sale: 29.1.2
Financial investments 899 (5,512) 1,362 (8,351)
Investments (95) (232) (95) (232)
Other adjustments - subsidiary (1,282) - (2,777) -
Taxes on other comprehensive income 29.1.2 32 79 514 2,918
Total comprehensive income for the period, net of t axes (2,155) (5,665) (2,705) (5,665)
TOTAL COMPREHENSIVE INCOME FOR THE PERIOD 746,900 626,796 828,601 644,606
Attributed to controlling shareholders 746,900 626,796
Attributed to non-controlling interest 81,701 17,810
Notes are an integral part of this quarterly inform ation
8
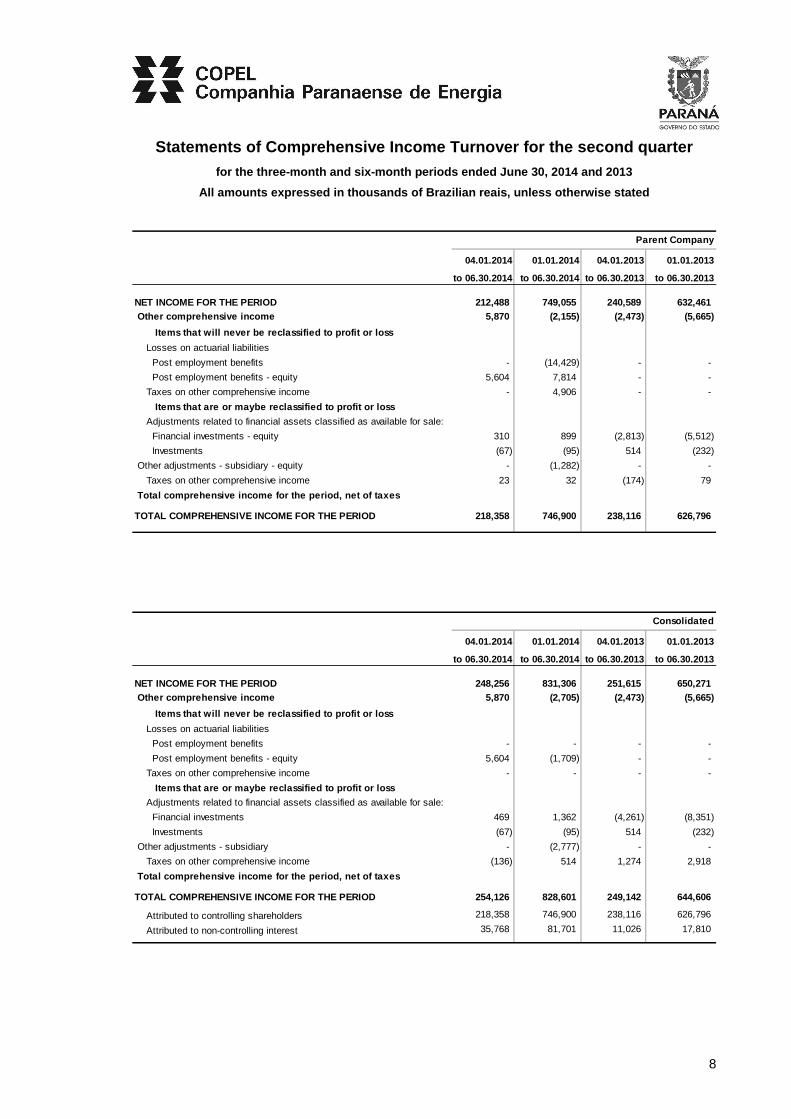
Statements of Comprehensive Income Turnover for the second quarter for the three-month and six-month periods ended Jun e 30, 2014 and 2013
All amounts expressed in thousands of Brazilian rea is, unless otherwise stated
Parent Company
04.01.2014 01.01.2014 04.01.2013 01.01.2013
to 06.30.2014 to 06.30.2014 to 06.30.2013 to 06.30 .2013
NET INCOME FOR THE PERIOD 212,488 749,055 240,589 632,461 Other comprehensive income 5,870 (2,155) (2,473) (5,665)
Items that will never be reclassified to profit or loss
Losses on actuarial liabilities
Post employment benefits - (14,429) - -
Post employment benefits - equity 5,604 7,814 - -
Taxes on other comprehensive income - 4,906 - -
Items that are or maybe reclassified to profit o r loss
Adjustments related to financial assets classified as available for sale:
Financial investments - equity 310 899 (2,813) (5,512)
Investments (67) (95) 514 (232)
Other adjustments - subsidiary - equity - (1,282) - -
Taxes on other comprehensive income 23 32 (174) 79
Total comprehensive income for the period, net of t axes
TOTAL COMPREHENSIVE INCOME FOR THE PERIOD 218,358 746,900 238,116 626,796
Consolidated
04.01.2014 01.01.2014 04.01.2013 01.01.2013
to 06.30.2014 to 06.30.2014 to 06.30.2013 to 06.30 .2013
NET INCOME FOR THE PERIOD 248,256 831,306 251,615 650,271 Other comprehensive income 5,870 (2,705) (2,473) (5,665)
Items that will never be reclassified to profit or loss
Losses on actuarial liabilities
Post employment benefits - - - -
Post employment benefits - equity 5,604 (1,709) - -
Taxes on other comprehensive income - - - -
Items that are or maybe reclassified to profit o r loss
Adjustments related to financial assets classified as available for sale:
Financial investments 469 1,362 (4,261) (8,351)
Investments (67) (95) 514 (232)
Other adjustments - subsidiary - (2,777) - -
Taxes on other comprehensive income (136) 514 1,274 2,918
Total comprehensive income for the period, net of t axes
TOTAL COMPREHENSIVE INCOME FOR THE PERIOD 254,126 828,601 249,142 644,606
Attributed to controlling shareholders 218,358 746,900 238,116 626,796
Attributed to non-controlling interest 35,768 81,701 11,026 17,810

9
Statements of Changes in Equity for the six-month periods ended June 30, 2014 and 2 013
All amounts expressed in thousands of Brazilian rea is, unless otherwise stated
Attributable
to
non
Other Profit Additional controlling
Cost comprehensive Legal retention proposed Accumulated Shareholders’ interests Equity
Capital assigned income reserve reserve dividends profit equity (Note 29.2) Consolidated
Balances as of January 1, 2014 6,910,000 1,238,955 (255,796) 624,849 3,897,833 235,498 - 12,651,339 277,413 12,928,752
Net Income for the period - - - - - - 749,055 749,055 82,251 831,306
Other comprehensive income
Losses on financial assets, net of taxes 29.1.2 - - (446) - - - - (446) (550) (996)
Losses on actuarial liabilities, net of taxes 29.1.2 - - (1,709) - - - - (1,709) - (1,709)
Total comprehensive income for the period - - (2,155) - - - 749,055 746,900 81,701 828,601
Deliberation of additional dividends proposed - - - - - (235,498) - (235,498) - (235,498)
Realization of equity valuation adjustments 29.1.2 - (51,545) - - - - 49,938 (1,607) - (1,607)
Allocation proposed to GSM:
Dividends - - - - - - - - (155) (155)
Balances as of June 30, 2014 6,910,000 1,187,410 (257,951) 624,849 3,897,833 - 798,993 13,161,134 358,959 13,520,093
Attributable to Parent Company
Equity valuation adjustments
Profit reserves
Note
Notes are an integral part of this quarterly inform ation
Attributable
to
non
Other Profit Additional controlling
Cost comprehensive Legal retention proposed Accumulated Shareholders’ interests Equity
Capital assigned income reserve reserve dividends profit equity (Note 29.2) Consolidated
Balances as of January 1, 2013 - Stated 6,910,000 1,341,098 8,904 571,221 3,337,295 64,474 - 12,232,992 264,506 12,497,498
Actuarial adjustments - CPC 33 (R1) / IAS 19 - - (135,608) - - - - (135,608) - (135,608)
Balances as of January 1, 2013 - Restated 6,910,000 1,341,098 (126,704) 571,221 3,337,295 64,474 - 12,097,384 264,506 12,361,890
Net Income for the period - - - - - - 632,461 632,461 17,810 650,271
Other comprehensive income
Losses on financial assets, net of taxes - - (5,665) - - - - (5,665) - (5,665)
Total comprehensive income for the period - - (5,665) - - - 632,461 626,796 17,810 644,606
Deliberation of additional dividends proposed - - - - - (64,474) - (64,474) - (64,474)
Realization of equity valuation adjustments - (49,241) - - - - 49,241 - - -
Balances as of June 30, 2013 6,910,000 1,291,857 (132,369) 571,221 3,337,295 - 681,702 12,659,706 282,316 12,942,022
Attributable to Parent Company
Equity valuation adjustments
Profit reserves
Note
Notes are an integral part of this quarterly inform ation

10
Statements of Cash Flows for the six-month periods ended June 30, 2014 and 2 013
All amounts expressed in thousands of Brazilian rea is, unless otherwise stated
Note
06.30.2014 06.30.2013 06.30.2014 06.30.2013
CASH FLOWS FROM OPERATIONAL ACTIVITIESNet income for the period 749,055 632,461 831,306 650,271
Adjustments to reconcile net income for the period with cash generated from operating activities
Depreciation 17.3 - - 182,182 177,142 Amortization of intangible assets - concessions 18.2 - - 122,066 111,575 Amortization of investments - concession right and authorization 18.2 - - 377 377 Amortization of intangible assets - others 18.2 - - 3,537 3,318 Unrealized monetary and exchange variations - net (10,339) (2,284) 88,801 8,612 Remuneration of accounts receivable related to concession 9.1 - - (26,529) (13,202) Equity in earnings of subsidiaries (772,469) (631,873) (84,582) (31,970) Income tax and social contribution 13.4 - - 548,771 438,740 Deferred income tax and social contribution 13.2.1 (12,707) 5,118 (209,867) (128,656) Provision for losses from accounts receivable 31.5 - - 39,907 22,147 Provisions (reversals) for losses on taxes recoverable 31.5 - - 817 (231) Provision (reversal) for legal claims 28.1 1,716 (12,151) 108,278 112,558 Provisions (reversals) for losses with depreciation of investments 16.2 (1,728) - (1,728) - Provision for post employment benefits 23.4 6,044 351 105,435 94,188 Provision for research and development and energy efficiency 25.2 - - 54,829 39,839 Write off of accounts receivable related to concession 9.1 - - 16,647 8,726 Write off of property, plant and equipment 17.3 - - 804 1,281 Write off of intangible assets 18.2 - - 2,951 10,988
Decrease (increase) in assets Trade accounts receivable - - (471,109) 191,223 Dividends and interest on own capital received 596,024 238,205 27,721 33,453 CRC transferred to the Government of the State of Paraná 8.1 86,039 - 86,039 81,539 Accounts receivable related to the concession extension 10.1 - - 176,813 233,895 Judicial deposits (629) (141) (29,451) (13,600) Other receivables (17,231) (16) (101,300) (447,618) Inventories - - (1,237) (10,336) Income tax and social contribution 13,747 22,357 73,453 25,104 Other current taxes recoverable - 11 (89,032) (8,507) Related Parties (115,696) - (115,696) - Prepaid expenses - - 2,532 (7,021)
Increase (decrease) in liabilitiesPayroll, social charges and accruals 13,989 (396) (54,101) (46,872) Suppliers 105 3,442 11,964 (49,785) Income tax and social contribution paid - (3,251) (472,574) (310,946) Other taxes (24,277) (21,165) (80,816) (103,934) Loans and financing - interest due and paid 21.9 (47,755) (34,717) (94,356) (67,369) Debentures - interest due and paid 22.1 (5,911) - (68,479) (38,674) Post employment benefits 23.4 (4,876) (355) (69,700) (72,759) Customer charges due - - (13,097) (2,673) Research and development and energy efficiency 25.2 - - (26,263) (29,781) Payable related to the concession - use of public property 26.1 - - (25,754) (24,238) Other accounts payable 7,183 (186) 25,871 145,843 Provisions for legal claims 28.1 (984) - (15,641) (18,878)
NET CASH GENERATED FROM OPERATING ACTIVITIES 459,300 195,410 459,789 963,769
(continued)
Parent Company Consolidated
11
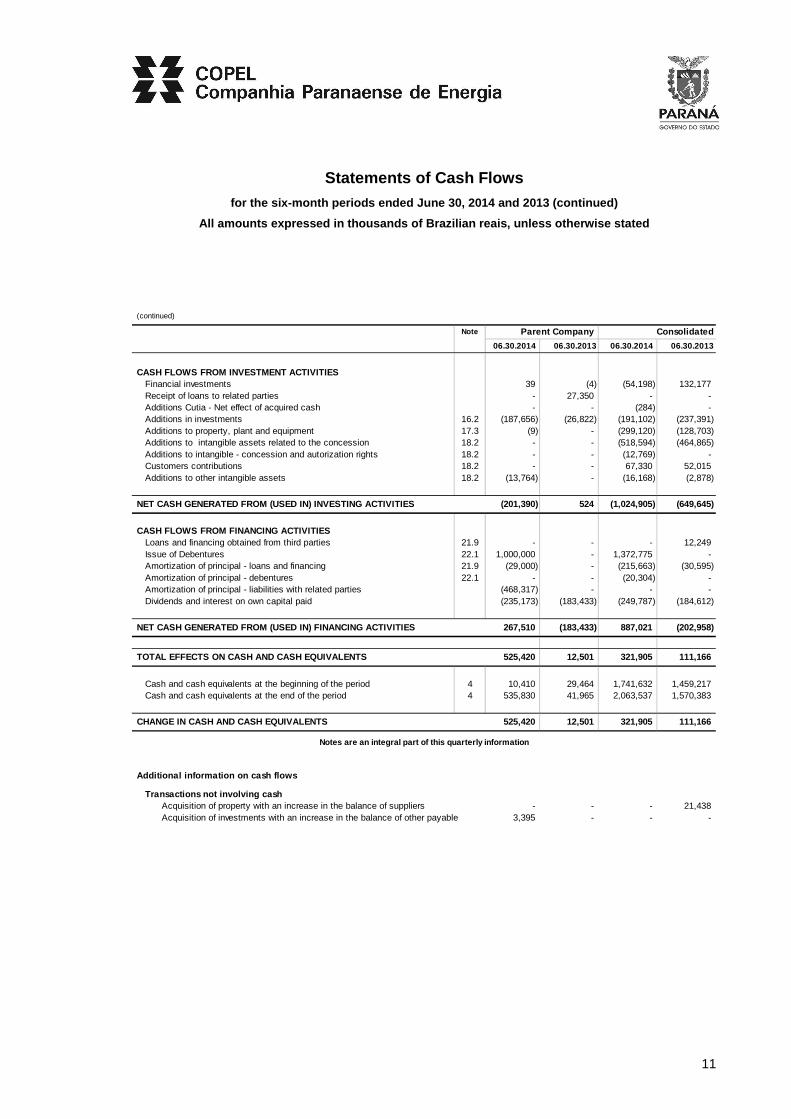
Statements of Cash Flows for the six-month periods ended June 30, 2014 and 2 013 (continued)
All amounts expressed in thousands of Brazilian rea is, unless otherwise stated
(continued)
Note
06.30.2014 06.30.2013 06.30.2014 06.30.2013
CASH FLOWS FROM INVESTMENT ACTIVITIES Financial investments 39 (4) (54,198) 132,177 Receipt of loans to related parties - 27,350 - - Additions Cutia - Net effect of acquired cash - - (284) - Additions in investments 16.2 (187,656) (26,822) (191,102) (237,391) Additions to property, plant and equipment 17.3 (9) - (299,120) (128,703) Additions to intangible assets related to the concession 18.2 - - (518,594) (464,865) Additions to intangible - concession and autorization rights 18.2 - - (12,769) - Customers contributions 18.2 - - 67,330 52,015 Additions to other intangible assets 18.2 (13,764) - (16,168) (2,878)
NET CASH GENERATED FROM (USED IN) INVESTING ACTIVIT IES (201,390) 524 (1,024,905) (649,645)
CASH FLOWS FROM FINANCING ACTIVITIES Loans and financing obtained from third parties 21.9 - - - 12,249 Issue of Debentures 22.1 1,000,000 - 1,372,775 - Amortization of principal - loans and financing 21.9 (29,000) - (215,663) (30,595) Amortization of principal - debentures 22.1 - - (20,304) - Amortization of principal - liabilities with related parties (468,317) - - - Dividends and interest on own capital paid (235,173) (183,433) (249,787) (184,612)
NET CASH GENERATED FROM (USED IN) FINANCING ACTIVIT IES 267,510 (183,433) 887,021 (202,958)
TOTAL EFFECTS ON CASH AND CASH EQUIVALENTS 525,42 0 12,501 321,905 111,166
Cash and cash equivalents at the beginning of the period 4 10,410 29,464 1,741,632 1,459,217 Cash and cash equivalents at the end of the period 4 535,830 41,965 2,063,537 1,570,383
CHANGE IN CASH AND CASH EQUIVALENTS 525,420 12,501 321,905 111,166
Additional information on cash flows
Transactions not involving cashAcquisition of property with an increase in the balance of suppliers - - - 21,438 Acquisition of investments with an increase in the balance of other payable 3,395 - - -
Notes are an integral part of this quarterly inform ation
Parent Company Consolidated

12
Statements of Added Value for the six-month periods ended June 30, 2014 and 2 013
All amounts expressed in thousands of Brazilian rea is, unless otherwise stated
VALUE ADDED TO DISTRIBUTE Parent Company Consolidated
06.30.2014 06.30.2013 06.30.2014 06.30.2013
IncomeSale of energy, services and other income - - 7,459,438 5,642,438 Construction income - - 813,364 673,248 Other income - - 387 5,245 Allowance for doubtful debts - - (39,907) (22,147)
- - 8,233,282 6,298,784
( - ) Supplies acquired from third partiesEnergy purchased for resale - - 2,377,200 1,676,131 Charges for use of the main transmission grid ( - ) ESS and ERR - - 244,850 218,228 Materials, supplies and third parties services 2,640 2,580 250,494 252,237 Natural gas and supplies for gas operations - - 890,523 178,352 Construction costs - - 680,341 587,665 Loss / Recovery of assets - - 21,955 19,236 Other supplies 6,227 (2,986) 138,859 149,171
8,867 (406) 4,604,222 3,081,020
( = ) GROSS ADDED VALUE (8,867) 406 3,629,060 3,217,764
( - ) Depreciation and amortization 377 377 308,162 292,412
( = ) NET ADDED VALUE (9,244) 29 3,320,898 2,925,352
( + ) Transferred added valueFinancial income 104,946 48,350 383,456 300,955 Results from investment interests 772,583 632,132 84,694 32,229 Other Income - - 48,999 108,051
877,529 680,482 517,149 441,235
868,285 680,511 3,838,047 3,366,587 (continued)

13
Statements of Added Value for the six-month periods ended June 30, 2014 and 2 013 (continued)
All amounts expressed in thousands of Brazilian rea is, unless otherwise stated
DISTRIBUTION OF ADDED VALUE Parent Company Consolidated
06.30.2014 % 06.30.2013 % 06.30.2014 % 06.30.2013 %
PersonnelRemuneration and fees 32,347 3,931 336,538 371,193 Private pension and health plans 6,044 351 105,435 94,188 Meal and education assistance 3,114 - 45,504 47,164 Social security charges - FGTS 2,598 449 27,447 30,142 Labor indemnities (reversals) 197 - 2,185 (528) Profit sharing 1,527 - 23,012 16,127 Transfers to property, plant and equipment in progress (2,140) - (12,007) (23,357)
43,687 5.0 4,731 0.7 528,114 13.8 534,929 15.9
GovernmentFederal (1,905) 7,664 1,081,838 923,739 State - - 1,088,629 1,066,528 Municipal - - 2,046 2,204
(1,905) (0.2) 7,664 1.1 2,172,513 56.6 1,992,471 59.2
Third PartiesInterest and fines 77,432 35,655 285,719 167,752 Leasing and rent 16 - 15,830 16,275 Donations, subsidies and contributions - - 4,565 4,889
77,448 8.9 35,655 5.2 306,114 8.0 188,916 5.6
ShareholdersNon controlling interests - - 82,251 17,810 Proposed dividends - - - - Retained profits 749,055 632,461 749,055 632,461
749,055 86.3 632,461 93.0 831,306 21.6 650,271 19.3
868,285 100.0 680,511 100.0 3,838,047 100.0 3,366,587 100.0
Notes are an integral part of this quarterly inform ation

14
NOTES TO THE QUARTELY FINANCIAL INFORMATION
for the six-month period ended June 30, 2014
All amounts expressed in thousands of Brazilian rea is, unless otherwise stated
1 General Information
Companhia Paranaense de Energia - Copel (Copel, the Company or the Parent Company), with
headquarters at Rua Coronel Dulcídio, 800, Batel, Curitiba, State of Paraná, is a public company
with shares traded on Corporate Governance Level 1 of BM&FBOVESPA’s Special Listings and on
stock exchanges in the United States of America and Spain. Copel is a mixed capital company,
controlled by the Government of the State of Paraná, engaged, through its subsidiaries, in
researching, studying, planning, building, and exploiting the production, transformation,
transportation, distribution, and sale of energy, in any form, but mainly electric energy. These
activities are regulated by the National Electric Energy Agency (Agência Nacional de Energia
Elétrica or Aneel), which reports to the Ministry of Mines and Energy (Ministério de Minas e Energia
or MME). Additionally, Copel takes part in consortiums, private enterprises, or mixed capital
companies in order to operate mostly in the areas of energy, telecommunications, natural gas and
water utility.
2 Basis of Preparation
2.1 Statement of compliance
The Company’s quarterly financial information includes:
i) The individual quarterly financial information of the parent company prepared in accordance
with accounting practices adopted in Brazil; and
ii) The consolidated quarterly financial information prepared in accordance with International
Financial Reporting Standards - IFRS issued by the International Accounting Standards Board
- IASB and also in accordance with accounting practices adopted in Brazil;
This quarterly information is presented considering the rulings included in CPC 21 (R1) and IAS 34
- Interim Information. Consequently, certain information disclosed in the notes to the financial
statements for the year ended December 31, 2013 which did not alter during the semester has not
been presented. Therefore, this quarterly information should be read together with the financial
statements as of and for the year ended December 31, 2013, available on the websites of the
Brazilian Securities and Exchange Commission - CVM and Copel.
Authorization for the publication of this quarterly financial information was granted at the Meeting of
the Board of Directors held on August 12, 2014.

15
2.2 Basis of measurement
The quarterly financial information was prepared based on historic cost, except for certain financial
instruments which were stated at fair values through profit or loss, financial assets available for
sale measured at their fair values, and the interests in subsidiaries and jointly-controlled entities
recognized in accordance with the equity accounting method.
2.3 Functional currency and presentation currency
The quarterly financial information is presented in Brazilian Reais, which is the functional currency
of the Company. All financial information present in Brazilian Reais was rounded to the nearest
thousand, except when otherwise indicated.
2.4 Use of estimates and judgment
The preparation of quarterly financial information requires that the Company’s senior management
make judgments, estimates and assumptions which affect the application of accounting policies
and assets, liabilities, income and expenses reported values. The actual results may divert from
these estimates.
Estimates and assumptions are reviewed in a continuous way. Reviews of accounting estimates
are recognized in the year that those estimates are reviewed and in any future fiscal years affected.
Information about critical judgment related to accounting policies adopted that present a significant
effect over the values recognized in the quarterly information, is the same as the one disclosed in
Note 2.4 to the financial statements as of December 31, 2013.
3 Significant Accounting Policies
Significant accounting policies used in preparing this quarterly information are consistent with those
presented in Note 3 of the financial statements at December 31, 2013, available on the websites of
CVM and Copel.
4 Cash and Cash Equivalents
Parent Company Consolidated 06.30.2014 12.31.2013 06.30.2014 12.31.2013
Cash and bank accounts 558 1,787 116,654 130,311
Financial investments w ith immediate liquidity 535,272 8,623 1,946,883 1,611,321
535,830 10,410 2,063,537 1,741,632
The investments comprise Bank Certificates of Deposit (CDBs) issued by official banks and also
financial investments in Government Bonds with repurchase agreements with the issuer banks, in
which the Bank has the obligation to repurchase these bonds from Copel on request. These
investments have yielded on average of the variation of the Interbank Deposit.
16
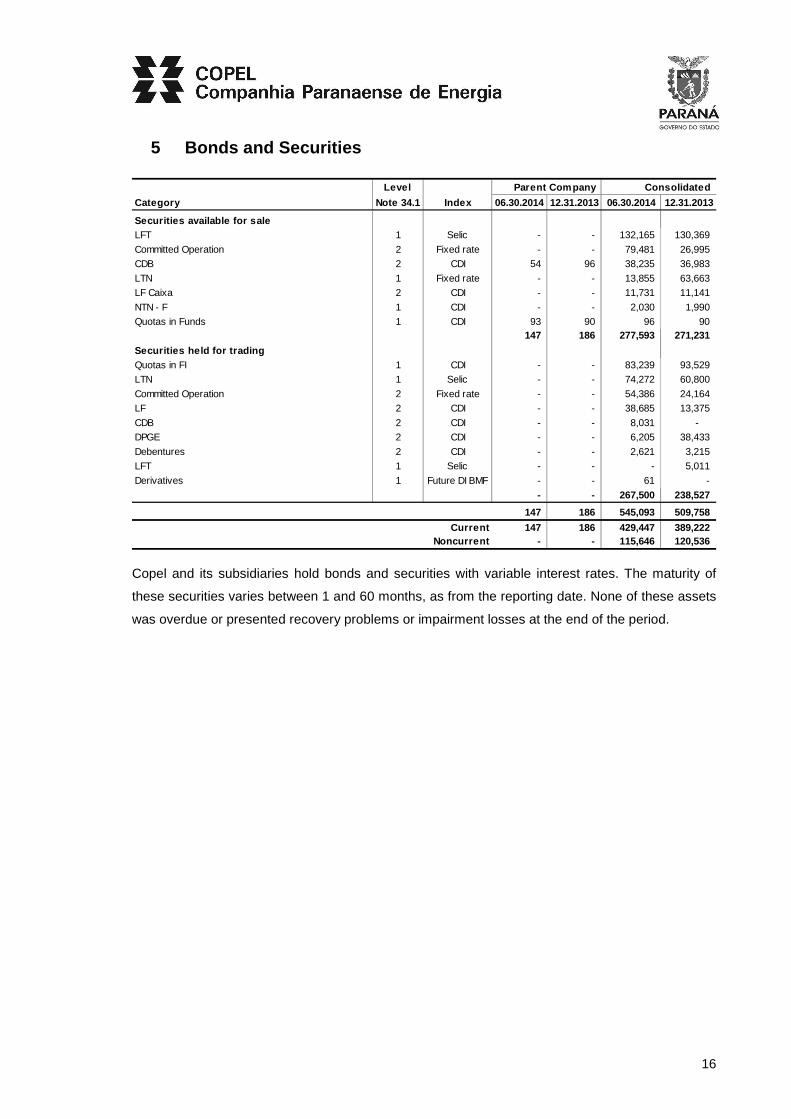
5 Bonds and Securities
Level Parent Company Consolidated
Category Note 34.1 Index 06.30.2014 12.31.2013 06.30.2014 12.31.2 013
Securities available for saleLFT 1 Selic - - 132,165 130,369
Committed Operation 2 Fixed rate - - 79,481 26,995
CDB 2 CDI 54 96 38,235 36,983
LTN 1 Fixed rate - - 13,855 63,663
LF Caixa 2 CDI - - 11,731 11,141
NTN - F 1 CDI - - 2,030 1,990
Quotas in Funds 1 CDI 93 90 96 90 147 186 277,593 271,231
Securities held for tradingQuotas in FI 1 CDI - - 83,239 93,529
LTN 1 Selic - - 74,272 60,800
Committed Operation 2 Fixed rate - - 54,386 24,164
LF 2 CDI - - 38,685 13,375
CDB 2 CDI - - 8,031 -
DPGE 2 CDI - - 6,205 38,433
Debentures 2 CDI - - 2,621 3,215
LFT 1 Selic - - - 5,011
Derivatives 1 Future DI BMF - - 61 -
- - 267,500 238,527
147 186 545,093 509,758
Current 147 186 429,447 389,222 Noncurrent - - 115,646 120,536
Copel and its subsidiaries hold bonds and securities with variable interest rates. The maturity of
these securities varies between 1 and 60 months, as from the reporting date. None of these assets
was overdue or presented recovery problems or impairment losses at the end of the period.

17
The main amounts invested include exclusive funds and guarantees deposits/investments:
Consolidated 06.30.2014 12.31.2013
Exclusive fundsExclusive funds of Copel Geração e Trasmissão at Banco do Brasil 62,396 99,843
Exclusive funds of Copel Distribuição at Banco do Brasil 3 3 Exclusive funds of UEG Araucária at Banco do Brasil 172,806 113,546
Exclusive funds of UEG Araucária at BNY Mellon Serviços Financeiros DTVM S.A. 91,133 124,946
326,338 338,338
GuaranteeGuarantee for the ANEEL auction 37,458 374 Guarantee for the Contracts for the Sale of Energy in the Regulated Environment – CCEARS 67,597 118,647
CBLC (Brazilian Company of Settlement and Custody) Guarantee (Mata de Santa Genebra Consortium - Renovation of Proposal) 8,110 -
Collaterals for financing facilities to build hydroelectric pow er plants HPPs and transmission lines - TLs 58,649 16,452 Guarantee for the compliance w ith article 17 of law 11,428/2006 and possible authorization by Environmental
Institute of Paraná (Instituto Ambiental do Paraná or IAP), by the Consórcio Energético Cruzeiro do Sul 34,731 33,849
206,545 169,322
6 Collaterals and Escrow Accounts
Consolidated 06.30.2014 12.31.2013
Collaterals and escrow accounts - STN (6.1) 46,337 45,371
Other 21,235 1,976
67,572 47,347
Current 21,235 1,976 Noncurrent 46,337 45,371
6.1 Collateral - National Treasury Department - S TN
Surety bonds and restricted deposits are offered to secure the repayment of the principal consisting
of discount bonds and par bounds when these payments are required on April 11, 2024 (Note
21.1). The amounts are adjusted by applying the weighted average of the percentage variations of
the prices of zero-coupon bonds issued by the U.S. Treasury, according to the participation of each
series of the instrument in the composition of the collateral portfolio made up to secure the
payment of the principal under the Brazilian Financing Plan – 1992.
18
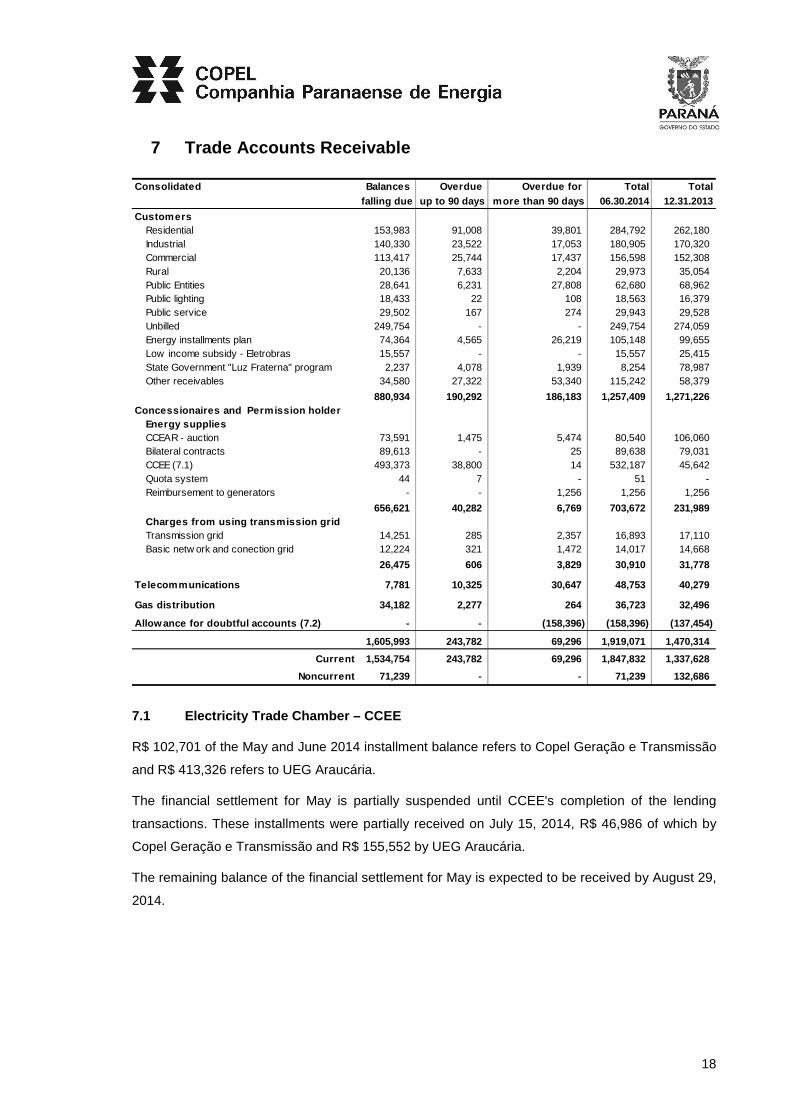
7 Trade Accounts Receivable
Consolidated Balances Overdue Overdue for Total Totalfalling due up to 90 days more than 90 days 06.30.2014 12.31.2013
CustomersResidential 153,983 91,008 39,801 284,792 262,180 Industrial 140,330 23,522 17,053 180,905 170,320 Commercial 113,417 25,744 17,437 156,598 152,308 Rural 20,136 7,633 2,204 29,973 35,054 Public Entities 28,641 6,231 27,808 62,680 68,962 Public lighting 18,433 22 108 18,563 16,379 Public service 29,502 167 274 29,943 29,528 Unbilled 249,754 - - 249,754 274,059 Energy installments plan 74,364 4,565 26,219 105,148 99,655 Low income subsidy - Eletrobras 15,557 - - 15,557 25,415 State Government "Luz Fraterna" program 2,237 4,078 1,939 8,254 78,987 Other receivables 34,580 27,322 53,340 115,242 58,379
880,934 190,292 186,183 1,257,409 1,271,226 Concessionaires and Permission holder
Energy suppliesCCEAR - auction 73,591 1,475 5,474 80,540 106,060 Bilateral contracts 89,613 - 25 89,638 79,031 CCEE (7.1) 493,373 38,800 14 532,187 45,642 Quota system 44 7 - 51 - Reimbursement to generators - - 1,256 1,256 1,256
656,621 40,282 6,769 703,672 231,989 Charges from using transmission grid Transmission grid 14,251 285 2,357 16,893 17,110 Basic netw ork and conection grid 12,224 321 1,472 14,017 14,668
26,475 606 3,829 30,910 31,778 .
Telecommunications 7,781 10,325 30,647 48,753 40,279 .
Gas distribution 34,182 2,277 264 36,723 32,496 .
Allow ance for doubtful accounts (7.2) - - (158,396) (158,396) (137,454)
1,605,993 243,782 69,296 1,919,071 1,470,314
Current 1,534,754 243,782 69,296 1,847,832 1,337,628
Noncurrent 71,239 - - 71,239 132,686
7.1 Electricity Trade Chamber – CCEE
R$ 102,701 of the May and June 2014 installment balance refers to Copel Geração e Transmissão
and R$ 413,326 refers to UEG Araucária.
The financial settlement for May is partially suspended until CCEE's completion of the lending
transactions. These installments were partially received on July 15, 2014, R$ 46,986 of which by
Copel Geração e Transmissão and R$ 155,552 by UEG Araucária.
The remaining balance of the financial settlement for May is expected to be received by August 29,
2014.
19
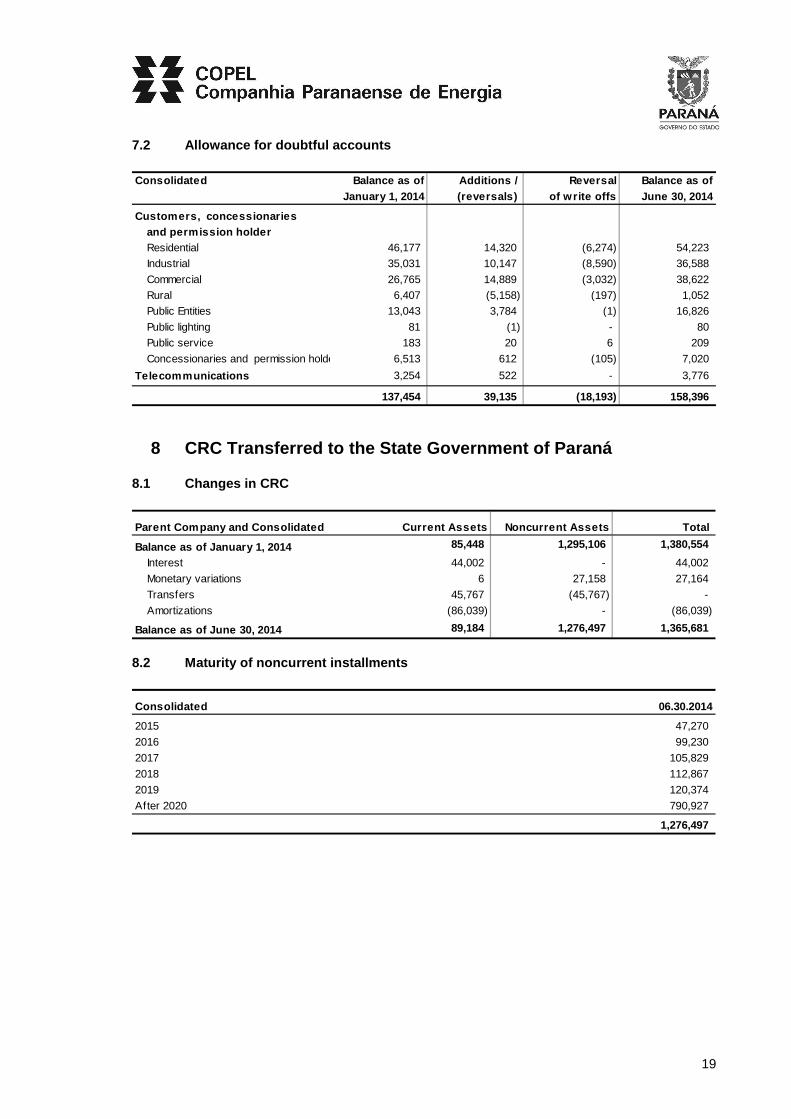
7.2 Allowance for doubtful accounts
Consolidated Balance as of Additions / Reversal Balanc e as ofJanuary 1, 2014 (reversals) of w rite offs June 30, 20 14
Customers, concessionaries and permission holder
Residential 46,177 14,320 (6,274) 54,223
Industrial 35,031 10,147 (8,590) 36,588
Commercial 26,765 14,889 (3,032) 38,622
Rural 6,407 (5,158) (197) 1,052
Public Entities 13,043 3,784 (1) 16,826
Public lighting 81 (1) - 80
Public service 183 20 6 209
Concessionaries and permission holder 6,513 612 (105) 7,020
Telecommunications 3,254 522 - 3,776
137,454 39,135 (18,193) 158,396
8 CRC Transferred to the State Government of Paraná
8.1 Changes in CRC
Parent Company and Consolidated Current Assets Noncur rent Assets Total
Balance as of January 1, 2014 85,448 1,295,106 1,380,554
Interest 44,002 - 44,002
Monetary variations 6 27,158 27,164
Transfers 45,767 (45,767) -
Amortizations (86,039) - (86,039)
Balance as of June 30, 2014 89,184 1,276,497 1,365,681
8.2 Maturity of noncurrent installments
Consolidated 06.30.2014
2015 47,270
2016 99,230
2017 105,829
2018 112,867
2019 120,374
After 2020 790,927
1,276,497

20
9 Accounts receivable related to the concession
9.1 Changes in accounts receivable related to the concession
Consolidated Noncurrent assetsCurrent Special assets Assets liabilities (a) Total
Balance as of January 1, 2014 4,396 5,577,735 (2,093,467) 3,488,664
Capitalization of intangible assets in progress - 306,847 (51,832) 255,015 Transfers from noncurrent to current 18,645 (18,645) - - Transfers to charges for use of main distributions and transmission grid - customers (16,783) - - (16,783) Transfer to property, plant and equipment - 18 - 18 Monetary variations - 99,170 (47,820) 51,350 Remuneration - 26,529 - 26,529 Construction income - 116,938 - 116,938 Write off - (16,656) 9 (16,647)
Balance as of June 30, 2014 6,258 6,091,936 (2,193,110) 3,905,084
9.2 Electricity Rate Adjustment for Copel Distrib uição
On June 24, 2013 Aneel (National Electric Energy Agency), issued Resolution 1,740, deciding on
the Annual Electricity Rate Adjustment for Copel Distribuição. The authorized average electricity
rate adjustment was 35.05%, of which 24.78% consists of an economic annual electricity rate
adjustment, 6.00% relates to the financial components of the current electricity rate adjustment
year and 4.27% consists of the withdrawal of financial components from the previous electricity rate
adjustment year and does not include the financial component arising from the partial deferral of
the 2013 rate adjustment index (R$ 275,910). If the prior cycle deferral were considered, according
to Aneel's Technical Note 193/14, the average effect on consumers would be 39.71%. On the
same date, the Company asked Aneel for a suspension of the electricity rate adjustment, expecting
for a deferral of the application of the authorized electricity rate adjustment index.
On July 22, 2014 Aneel granted the Company's request, approving a partial deferral of the average
adjustment of 35.05%, authorizing the retroactive application of an average adjustment of 24.86%
as from June 24, 2014 and a deferral of R$ 898,337 (including the partial deferral of the 2013 rate
adjustment index, in the amount of R$ 275,910) to be included in the subsequent rate adjustments
as a financial component, adjusted for inflation according to the General Market Price Index (IGP-
M).
Moreover, Aneel approved the monthly amount of R$ 28,697 (Resolution 1,763/14) to be passed
on to Copel Distribuição using funds from the CDE - Energy Development Account, in the period
from June 2014 to May 2015 to fund electricity rate discounts as established by Decree 7,891 of
January 23, 2013.
21
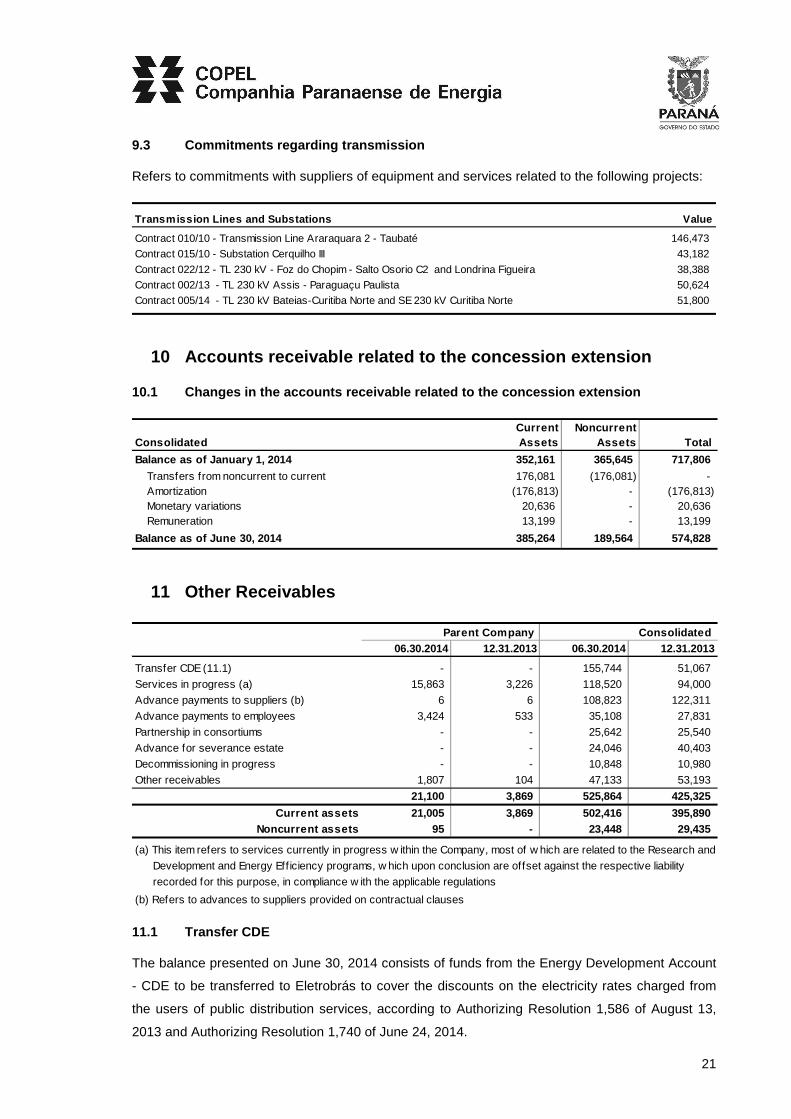
9.3 Commitments regarding transmission
Refers to commitments with suppliers of equipment and services related to the following projects:
Transmission Lines and Substations Value
Contract 010/10 - Transmission Line Araraquara 2 - Taubaté 146,473
Contract 015/10 - Substation Cerquilho III 43,182
Contract 022/12 - TL 230 kV - Foz do Chopim - Salto Osorio C2 and Londrina Figueira 38,388
Contract 002/13 - TL 230 kV Assis - Paraguaçu Paulista 50,624
Contract 005/14 - TL 230 kV Bateias-Curitiba Norte and SE 230 kV Curitiba Norte 51,800
10 Accounts receivable related to the concession ex tension
10.1 Changes in the accounts receivable related t o the concession extension
ConsolidatedCurrent Assets
Noncurrent Assets Total
Balance as of January 1, 2014 352,161 365,645 717,806
Transfers from noncurrent to current 176,081 (176,081) - Amortization (176,813) - (176,813) Monetary variations 20,636 - 20,636 Remuneration 13,199 - 13,199
Balance as of June 30, 2014 385,264 189,564 574,828
11 Other Receivables
. Parent Company Consolidated 06.30.2014 12.31.2013 06.30.2014 12.31.2013
Transfer CDE (11.1) - - 155,744 51,067
Services in progress (a) 15,863 3,226 118,520 94,000
Advance payments to suppliers (b) 6 6 108,823 122,311
Advance payments to employees 3,424 533 35,108 27,831
Partnership in consortiums - - 25,642 25,540
Advance for severance estate - - 24,046 40,403
Decommissioning in progress - - 10,848 10,980
Other receivables 1,807 104 47,133 53,193
21,100 3,869 525,864 425,325
Current assets 21,005 3,869 502,416 395,890 Noncurrent assets 95 - 23,448 29,435
(a) This item refers to services currently in progress w ithin the Company, most of w hich are related to the Research and
Development and Energy Eff iciency programs, w hich upon conclusion are offset against the respective liability
recorded for this purpose, in compliance w ith the applicable regulations
(b) Refers to advances to suppliers provided on contractual clauses
11.1 Transfer CDE
The balance presented on June 30, 2014 consists of funds from the Energy Development Account
- CDE to be transferred to Eletrobrás to cover the discounts on the electricity rates charged from
the users of public distribution services, according to Authorizing Resolution 1,586 of August 13,
2013 and Authorizing Resolution 1,740 of June 24, 2014.
22
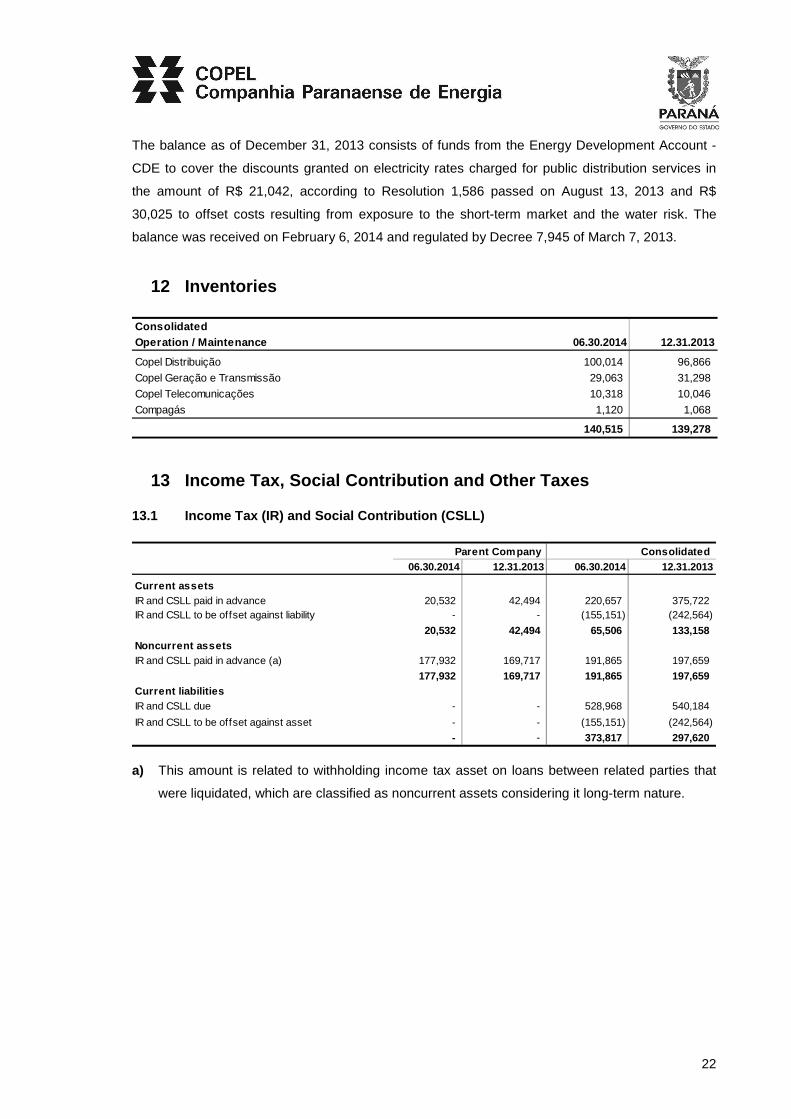
The balance as of December 31, 2013 consists of funds from the Energy Development Account -
CDE to cover the discounts granted on electricity rates charged for public distribution services in
the amount of R$ 21,042, according to Resolution 1,586 passed on August 13, 2013 and R$
30,025 to offset costs resulting from exposure to the short-term market and the water risk. The
balance was received on February 6, 2014 and regulated by Decree 7,945 of March 7, 2013.
12 Inventories
Consolidated Operation / Maintenance 06.30.2014 12.31.2013
Copel Distribuição 100,014 96,866
Copel Geração e Transmissão 29,063 31,298
Copel Telecomunicações 10,318 10,046
Compagás 1,120 1,068
140,515 139,278
13 Income Tax, Social Contribution and Other Taxes
13.1 Income Tax (IR) and Social Contribution (CSL L)
. Parent Company Consolidated 06.30.2014 12.31.2013 06.30.2014 12.31.2013
Current assetsIR and CSLL paid in advance 20,532 42,494 220,657 375,722 IR and CSLL to be offset against liability - - (155,151) (242,564)
20,532 42,494 65,506 133,158 Noncurrent assetsIR and CSLL paid in advance (a) 177,932 169,717 191,865 197,659
177,932 169,717 191,865 197,659 Current liabilitiesIR and CSLL due - - 528,968 540,184
IR and CSLL to be offset against asset - - (155,151) (242,564)
- - 373,817 297,620
a) This amount is related to withholding income tax asset on loans between related parties that
were liquidated, which are classified as noncurrent assets considering it long-term nature.

23
13.2 Deferred Income Tax and Social Contribution
13.2.1 Changes in Deferred Income Tax and Social Contribution
Parent Company Recognizedin other
Balance as of Recognized comprehensive Balance as ofJanuary 1, 2014 in income income June 30, 2014
Noncurrent assetsTax losses and negative tax basis 913 13,724 - 14,637
Private pension and health plans - 393 - 393 Effects of applying CPC 33 - R1 738 - 4,906 5,644
Provisions for legal claims 94,467 249 - 94,716
Provision for profit sharing 250 270 - 520 Allow ance for doubtful debts 1,478 - - 1,478
Amortization - concession 18,342 128 - 18,470
Provision for f inancing 4,085 (155) - 3,930 Social security contributions - injunction on judicial deposit 14 155 - 169
Others 595 (292) - 303
120,882 14,472 4,906 140,260 (-) Noncurrent liabilitiesEffects f rom applying CPC 38 - f inancial instruments 4,380 1,765 (32) 6,113
Provisions for negative goodw ill 25,297 - - 25,297
29,677 1,765 (32) 31,410
Net 91,205 12,707 4,938 108,850

24
.
Consolidated Recognizedin other
Balance as of Recognized comprehensive Balance as ofJanuary 1, 2014 in income income June 30, 2014
Noncurrent assetsTax losses and negative tax basis 9,713 76,585 - 86,298
Private pension and health plans 195,484 12,084 - 207,568
Effects from applying ICPC 01 69,582 (10,448) - 59,134 Effects from applying CPC 33 - R1 132,523 - - 132,523
Effects from applying CPC 38 579 - (475) 104 Provisions for legal claims 375,336 31,538 - 406,874
Voluntary termination Program/retirement 1,316 (1,039) - 277
Provision of Research and Development 66,766 12,078 - 78,844 Allow ance for doubtful debts 49,682 7,278 - 56,960
Amortization - concession 36,686 128 - 36,814 Provision for investment losses 355 - - 355
Provision for tax losses 14,940 278 - 15,218
Provision for impact of grid charges 6,922 - - 6,922 Provision for f inancing 4,085 (155) - 3,930
Provision for energy purchases 105,107 41,414 - 146,521 Provision for profit sharing 26,553 (19,293) - 7,260
Social security contributions - injunction on judicial deposit 23,256 3,087 - 26,343
Others 6,053 2,763 - 8,816
1,124,938 156,298 (475) 1,280,761 (-) Noncurrent liabilitiesEffects from applying CPC 27 636,541 (25,317) - 611,224
Effects from applying ICPC 01 115 - - 115 Effects from applying CPC 38 7,276 1,137 (44) 8,369
Capitalization of f inancial charges 5,357 - - 5,357
Deferment of capital gains 107,534 (33,958) - 73,576 Provisions for negative goodw ill 25,297 - - 25,297
Gas supply 1,790 (895) - 895 Others 8,116 5,464 (945) 12,635
792,026 (53,569) (989) 737,468
Net 332,912 209,867 514 543,293
Assets presented in the Statement of Financial Position 753,413 887,087
(-) Liabilities presented in the Statement of Financial Position (420,501) (343,794)
Net 332,912 543,293
13.2.2 Realization of deferred tax credits
Tax credits related to the pension and healthcare plans are realized according the movement of the
related accrual based on the actuarial valuation conducted annually by an independent actuary.
Deferred taxes on all other contingence provisions will be realized as judicial rulings are issued.

25
13.3 Other recoverable taxes and other taxes due
. Parent Company Consolidated 06.30.2014 12.31.2013 06.30.2014 12.31.2013
Current assetsRecoverable ICMS (VAT) - - 60,493 43,092
Recoverable PIS/Pasep and Cofins taxes - - 81,187 61,093
PIS/Pasep and Cofins to be offset against liabilities - - (24,623) (35,596)
Other recoverable taxes - - 825 1,424
- - 117,882 70,013 Noncurrent assetsRecoverable ICMS (VAT) - - 119,526 72,347
PIS/Pasep and Cofins taxes - - 51,804 51,653
Other recoverable taxes - 91 498 - - 171,421 124,498
Current liabilitiesICMS (VAT) payable - - 176,599 184,369
PIS/Pasep and Cofins payable 736 25,400 51,674 79,291
PIS/Pasep and Cofins to be offset against assets - - (24,623) (35,596)
IRRF on JSCP - - - 39,440
Other taxes 11 81 7,168 33,227
747 25,481 210,818 300,731 Noncurrent liabilities
Social security contributions - injunction on judicial deposit 497 40 77,499 68,402 497 40 77,499 68,402
13.4 Reconciliation of the provision for Income T ax (IRPJ) and Social Contribution
(CSLL)
. Parent Company Consolidated
06.30.2014 06.30.2013 06.30.2014 06.30.2013
Income before IRPJ and CSLL 736,348 637,579 1,170,210 960,355 IRPJ and CSLL (34%) (250,358) (216,777) (397,871) (326,521)
Tax effects on:Equity in income 262,640 211,607 28,758 7,639 Dividends 15 62 15 62 Finam 432 - 432 - Non deductible expenses (8) (10) (3,320) (1,777) Tax incentives (14) - 1,538 3,315
Income and social contribution tax loss carry-forw ards - - 32,474 7,668
Difference betw een the calculation bases of deemed profit and taxable profit - - (983) - Others - - 53 (470)
Current IRPJ and CSLL - - (548,771) (438,740)
Deferred IRPJ and CSLL 12,707 (5,118) 209,867 128,656 Effective rate - % -1.7% 0.8% 29.0% 32.3%
26
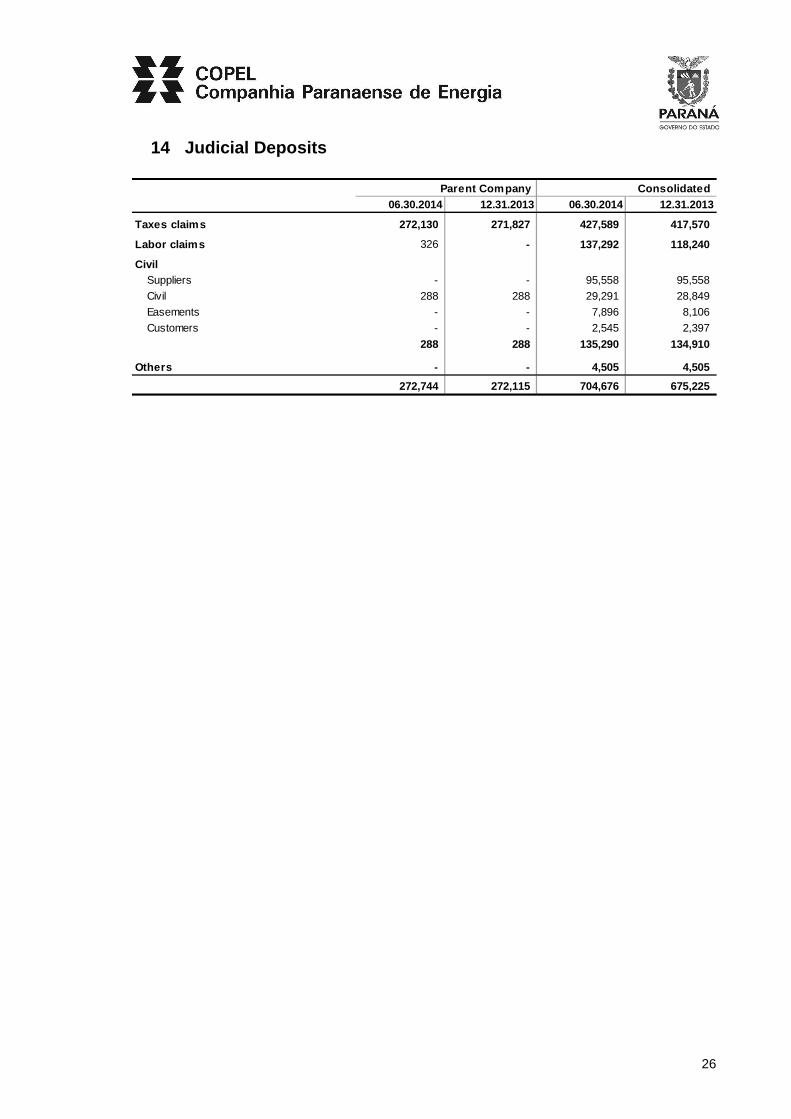
14 Judicial Deposits
. Parent Company Consolidated 06.30.2014 12.31.2013 06.30.2014 12.31.2013
Taxes claims 272,130 271,827 427,589 417,570
Labor claims 326 - 137,292 118,240 .
CivilSuppliers - - 95,558 95,558
Civil 288 288 29,291 28,849
Easements - - 7,896 8,106
Customers - - 2,545 2,397
288 288 135,290 134,910 .
Others - - 4,505 4,505
272,744 272,115 704,676 675,225
27
15 Related parties
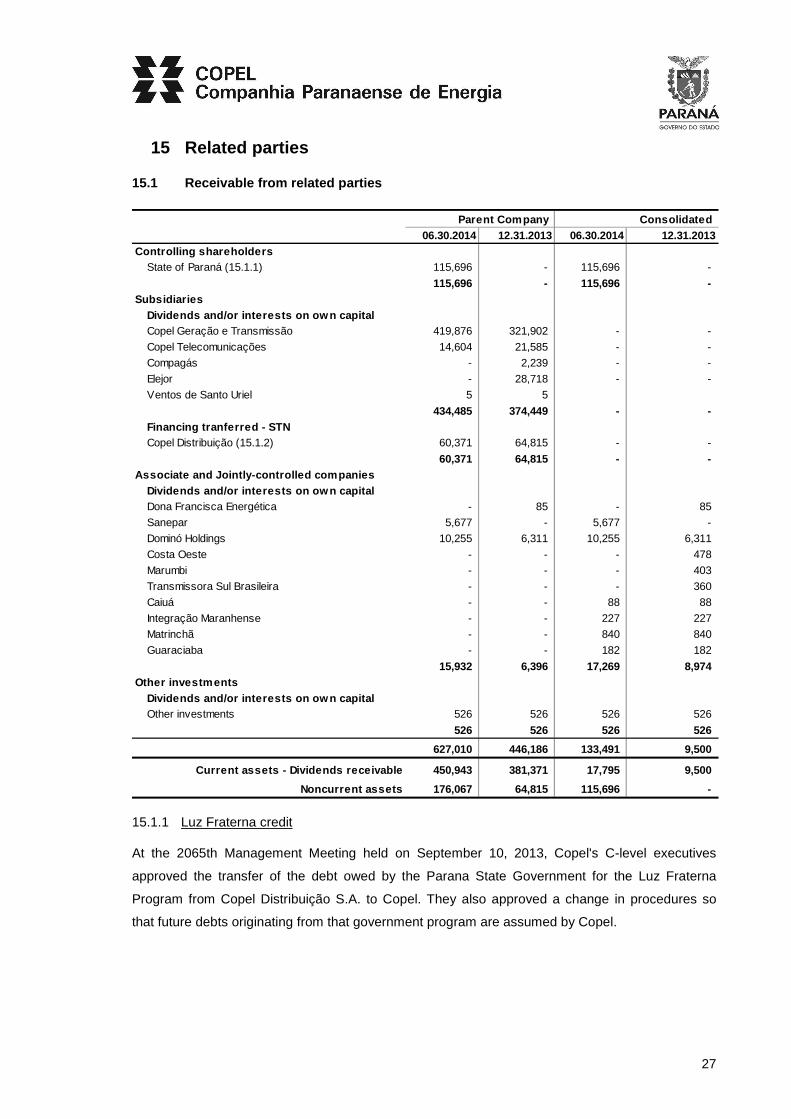
15.1 Receivable from related parties
. Parent Company Consolidated 06.30.2014 12.31.2013 06.30.2014 12.31.2013
Controlling shareholders State of Paraná (15.1.1) 115,696 - 115,696 -
115,696 - 115,696 - Subsidiaries
Dividends and/or interests on own capital Copel Geração e Transmissão 419,876 321,902 - -
Copel Telecomunicações 14,604 21,585 - -
Compagás - 2,239 - -
Elejor - 28,718 - -
Ventos de Santo Uriel 5 5
434,485 374,449 - - Financing tranferred - STNCopel Distribuição (15.1.2) 60,371 64,815 - -
60,371 64,815 - - Associate and Jointly-controlled companies
Dividends and/or interests on own capital Dona Francisca Energética - 85 - 85
Sanepar 5,677 - 5,677 -
Dominó Holdings 10,255 6,311 10,255 6,311
Costa Oeste - - - 478
Marumbi - - - 403
Transmissora Sul Brasileira - - - 360
Caiuá - - 88 88
Integração Maranhense - - 227 227
Matrinchã - - 840 840
Guaraciaba - - 182 182
. 15,932 6,396 17,269 8,974 Other investments
Dividends and/or interests on own capital Other investments 526 526 526 526
526 526 526 526
627,010 446,186 133,491 9,500
Current assets - Dividends receivable 450,943 381,371 17,795 9,500
Noncurrent assets 176,067 64,815 115,696 -
15.1.1 Luz Fraterna credit
At the 2065th Management Meeting held on September 10, 2013, Copel's C-level executives
approved the transfer of the debt owed by the Parana State Government for the Luz Fraterna
Program from Copel Distribuição S.A. to Copel. They also approved a change in procedures so
that future debts originating from that government program are assumed by Copel.
28
On May 13, 2014 Aneel approved the transaction by issuing decision number 1,560. On May 31,
2014 a Credit Assignment Agreement was entered into, whereby the receivables held by Copel
Distribuição from the Luz Fraterna account for the period from September 2010 to February 2014
were transferred to Copel. Late payment charges (fine of 2%, inflation adjustment using the IGP-M
and monthly interest of 1%) were also transferred, and the total amount reached R$ 115,696, with
maturity on May 31, 2014. Copel in turn passed the same amount on to Copel Distribuição to settle
overdue bills.
Under that agreement, Copel Distribuição will transfer receivables to Copel every six months,
consisting of subsequent revenues earned and related late payment charges (fine of 2%, inflation
adjustment using the IGP-M and monthly interest of 1%) referring to the Luz Fraterna Program
which were not settled as from March 1, 2014.
Copel in turn is due to pass the same amount on to Copel Distribuição to settle overdue bills. If
Copel defaults on its obligation to pass the funds on to Copel Distribuição, the amounts will be
adjusted for inflation using the IGP-M applicable until the actual transfer.
Under the Credit Assignment Agreement Copel will issue a debt note against Parana State
Government. An adjustment for inflation using the IGP-M and monthly interest of 1% will be applied
to the amount due from the date the debt note is issued until its actual payment by the Parana
State Government.
15.1.2 Financing transferred - STN
The Company transferred loans and financing to its wholly owned subsidiaries at the time of
constitution in 2001. However, since the contracts for the transfers to the respective subsidiaries
were not formalized with the financial institutions, they remain recognized in the parent company.
This financing was transferred bearing the same charges assumed by the Company and is
reported separately, as a receivable from the wholly owned subsidiaries, and as liabilities for loans
and financing in the subsidiaries (Note 21.1).
15.2 Payable to related parties
On December 31, 2013 the CRC payable balance, R$ 1,380,554, was transferred from Copel
Distribuição (consolidated entity) to Copel (parent Company), as approved by Aneel, Order 4,222
dated December 12, 2013, as settlement of the loan of R$ 912,237 and transfer of the remaining
financial balance payable of R$ 468,317.
The transfer financial balance was paid in three installments which have been paid on 05.12.2014.

29
16 Investments
16.1 Business Combinations
On March 11, 2014 the Company acquired from Galvão Participações S.A. 50.1% interest in Cutia
Empreendimentos Eólicos SPE S.A., in which the Company used to have a 49.9% stake.
The acquisition of these wind farming companies fulfills Copel's strategic purpose of increasing its
participation in the energy generation industry by adding renewable sources to its energy mix.
The wind farm projects were evaluated according to the market multiples method for investment
purposes.
The following data shows the breakdown of the consideration paid in exchange for a controlling
stake in Cutia:
Compensation
Advance for future investment (16.6.2) 5,327
Accounts payable 3,395
8,722
The amount classified as an authorization right was allocated to the group of Investments in the
individual balance of the parent company and to the group of intangibles in the consolidated
balance sheet. The authorization right will be amortized from the date the enterprise starts
operations until its maturity, on January 5, 2032.
Percentage of Percentage of share capital % share capital %
prior acquired03.11.2014 49.9% 50.1% 100.0%
Equity 5,258 5,280 10,538
Investments / Afac 536 539 1,075
Concession rights 5,809 2,903 8,712
11,603 8,722 20,325

30
The initial interest held immediately before the acquisition date and the breakdown of the acquired
assets and assumed liabilities, which correspond to their fair values, are shown below:
Percentage of Percentage of Percentage of share capital % share capital % share capital %
prior acquired actual
03.11.2014 49.90% 50.10% 100%
ASSETS 5,794 5,820 11,614
Current assets 113 113 226
Noncurrent assets 5,681 5,707 11,388
LIABILITIES 5,794 5,820 11,614
Current liabilities - 1 1
Noncurrent liabilities 536 539 1,075
Investments / Afac 536 539 1,075
Equity 5,258 5,280 10,538 .
The operating expenses incurred by the acquired company as from the acquisition date, were
included in the consolidated statement of profit or loss of June 2014.

31
16.2 Changes in investments
Parent Company Equity ProposedBalance as of valuation Investiment / Business dividen ds Balance as of
January 1, 2014 Equity adjustments Afac combinations Amo rtization and JCP Other June 30, 2014
Subsidiaries (16.3)
Copel Geração e Transmissão 6,796,817 821,317 4,637 - - - (628,180) - 6,994,591 Copel Distribuição 3,366,685 (228,897) 4,930 153,000 - - - - 3,295,718
Copel Telecomunicações 352,939 27,895 855 16,000 - - - - 397,689 Copel Renováveis 407 (2,395) - 1,988 - - - - -
Copel Participações 407 (1,883) - 1,476 - - - - - UEG Araucária 140,352 48,969 - - - - - - 189,321
Compagás 120,168 24,501 - - - - (159) - 144,510 Elejor 50,412 22,727 (1,282) - - - - - 71,857
Elejor - concession rights 16,779 - - - - (377) - - 16,402 Cutia - (339) - 315 11,613 - - - 11,589
Cutia - concession rights - - - - 8,712 - - - 8,712 Nova Asa Branca I 10,864 448 - - - - - - 11,312
Nova Asa Branca I - concession rights 51,659 - - 1,843 - - - - 53,502 Nova Asa Branca II 13,505 558 - - - - - - 14,063
Nova Asa Branca II - concession rights 51,745 - - 1,856 - - - - 53,601 Nova Asa Branca III 14,678 340 - - - - - - 15,018
Nova Asa Branca III - concession rights 49,948 - - 1,885 - - - - 51,833 Nova Eurus IV 10,857 536 - - - - - - 11,393
Nova Eurus IV - concession rights 53,154 - - 1,904 - - - - 55,058 Santa Maria 31,029 549 - - - - - - 31,578
Santa Maria - concession rights 26,813 - - 918 - - - - 27,731 Santa Helena 36,126 550 - - - - - - 36,676
Santa Helena - concession rights 28,955 - - 958 - - - - 29,913 Ventos de Santo Uriel 14,288 456 - - - - - - 14,744
Ventos de S. Uriel - concession rights 13,445 - - 502 - - - - 13,947
11,252,032 715,332 9,140 182,645 20,325 (377) (628,339) - 11,550,758
Joint ventures (16.4)Dominó Holdings 456,703 42,878 3,997 - - - (6,803) (279,116) (a) 217,659 Cutia 5,625 24 - 145 (5,794) - - - -
Cutia - concession rights 5,809 - - - (5,809) - - - -
468,137 42,902 3,997 145 (11,603) - (6,803) (279,116) 217,659
Associates (16.5)Sanepar - 500 - - - - (11,819) 279,116 (a) 267,797 Dona Francisca Energética 58,176 4,669 - - - - (13,271) - 49,574
Foz do Chopim Energética 15,788 4,992 - - - - (5,364) - 15,416 Sercomtel - (3,270) - 3,270 - - - - -
Carbocampel 1,407 (1) - - - - - - 1,406 Dois Saltos 720 - - - - - - - 720
Copel Amec 182 6 - - - - - - 188 Escoelectric - 26 - 234 - - - - 260
76,273 6,922 - 3,504 - - (30,454) 279,116 335,361
Other investmentsFinam 1,323 - 377 - - - - - 1,700 Finor 212 - - - - - - - 212
Investco S.A. 9,210 - 32 - - - - - 9,242 Nova Holanda Agropecuária S.A. 14,868 - - - - - - - 14,868
(-) provision for loss - Nova Holanda (6,981) - - - - - - 1,728 (b) (5,253) Advance w ith the purpose of future
investment (16.6) 233,469 - - 1,362 (5,327) - - (18,210) (c) 211,294 Other investments 7,076 - (504) - - - - - 6,572
259,177 - (95) 1,362 (5,327) - - (16,482) 238,635
12,055,619 765,156 13,042 187,656 3,395 (377) (665,596) (16,482) 12,342,413
(a) Corporate restructuring of Dominó Holdings - notes number 16.4.1 and number 16.5.1(b) Reversal of provision for loss
(c) Transfers of intangible (18.2)

32
Consolidated Equity ProposedBalance as of valuation Investiment / Business dividen ds Balance as of
January 1, 2014 Equity adjustments Afac combinations and JCP Other June 30, 2014
Joint ventures (16.4)Dominó Holdings 456,703 42,878 3,997 - - (6,803) (279,116) (a) 217,659
Cutia 5,625 24 - 145 (5,794) - - - Costa Oeste 18,700 3,100 - 3,742 - 478 - 26,020
Marumbi 21,797 3,432 - 26,446 - 403 - 52,078 Transmissora Sul Brasileira 63,797 1,444 - - - 360 - 65,601
Caiuá 40,318 948 - 2,910 - - - 44,176 Integração Maranhense 85,378 349 - 2,916 - - - 88,643
Matrinchã 97,999 12,437 - 111,036 - - - 221,472 Guaraciaba 38,828 5,358 - - - - - 44,186
Paranaíba 17,850 810 - 24,009 - - - 42,669 Mata de Santa Genebra - (433) - 15,029 - - - 14,596
846,995 70,347 3,997 186,233 (5,794) (5,562) (279,116) 817,100
Associates (16.5)Sanepar - 500 - - - (11,819) 279,116 (a) 267,797 Dona Francisca 58,176 4,669 - - - (13,271) - 49,574
Foz do Chopim 15,788 4,992 - - - (5,364) - 15,416 Sercomtel - (3,270) - 3,270 - - - -
Carbocampel 1,407 (1) - - - - - 1,406 Dois Saltos 720 - - - - - - 720
Copel Amec 182 6 - - - - - 188 Escoelectric - 26 - 234 - - - 260
76,273 6,922 - 3,504 - (30,454) 279,116 335,361
Other investmentsFinam 1,323 - 377 - - - - 1,700 Finor 212 - - - - - - 212
Investco S.A. 9,210 - 32 - - - - 9,242 Nova Holanda Agropecuária S.A. 14,868 - - - - - - 14,868
(-) provision for loss - Nova Holanda (6,981) - - - - - 1,728 (b) (5,253) Assets for future use 4,290 - - - - - (2,638) (c) 1,652
Advance w ith the purpose of future investment (16.6) 233,469 - - 1,362 (5,327) - (18,210) (c) 211,294
Other investments 8,268 - (504) 3 - - - 7,767
264,659 - (95) 1,365 (5,327) - (19,120) 241,482
1,187,927 77,269 3,902 191,102 (11,121) (36,016) (19,120) 1,393,943
(a) Corporate restructuring of Dominó Holdings - notes number 16.4.1 and number 16.5.1(b) Reversal of provision for loss(c) Transfers of intangible (18.2)
16.3 Parent Company
CopelCopel GeT
Noncontrolling shareholders
Copel Geração e Transmissão S.A. (Copel GeT) Curitiba/PR Production and transmission of electricity 100.00 - -
Copel Distribuição S.A. Curitiba/PR Distribution and marketing of electricity 100.00 - - Copel Telecomunicações S.A. Curitiba/PR Telecommunication and communication services 100.00 - -
Copel Renováveis S.A. Curitiba/PR Production of electricity from w ind sources 100.00 - - Copel Participações S.A. Curitiba/PR Holdings of non-financial institutions 100.00 - -
Nova Asa Branca I Energias Renováveis S.A. (a) S. Miguel do Gostoso/RN Production of electricity from w ind sources 100.00 - - Nova Asa Branca II Energias Renováveis S.A. (a) Parazinho/RN Production of electricity from w ind sources 100.00 - -
Nova Asa Branca III Energias Renováveis S.A. (a) Parazinho/RN Production of electricity from w ind sources 100.00 - - Nova Eurus IV Energias Renováveis S.A. (a) Touros/RN Production of electricity from w ind sources 100.00 - -
Santa Maria Energias Renováveis S.A. (a) Maracanaú/CE Production of electricity from w ind sources 100.00 - - Santa Helena Energias Renováveis S.A. (a) Maracanaú/CE Production of electricity from w ind sources 100.00 - -
Ventos de Santo Uriel S.A. (a) João Câmara/RN Production of electricity from w ind sources 100.00 - - Cutia Empreendimentos Eólicos SPE S.A. (a) (b) São Paulo/SP Production of electricity from w ind sources 100.00 - -
Companhia Paranaense de Gás - Compagás Curitiba/PR Distribution of pipeline gas 51.00 - 49.00 Elejor - Centrais Elétricas do Rio Jordão S.A. Curitiba/PR Production of electricity 70.00 - 30.00 UEG Araucária Ltda. Curitiba/PR Production of electricity from natural gas 20.00 60.00 20.00
(a) Pre-operating stage
(b) from March 11, 2014
Headquarters Main ActivityPercentage of share capital
Subsidiaries

33
16.3.1 Summarized financial statements of subsidiaries with non-controlling interest
06.30.2014
ASSETS 490,360 743,201 1,132,679 Current assets 199,148 60,024 725,433
Noncurrent assets 291,212 683,177 407,246
LIABILITIES 490,360 743,201 1,132,679 Current liabilities 160,866 111,655 181,882
Noncurrent liabilities 46,140 528,891 4,199
Equity 283,354 102,655 946,598
STATEMENT OF INCOMEOperating revenues 849,364 123,114 1,043,144
Operating costs and expenses (777,528) (32,724) (726,466)
Financial results 1,904 (41,206) 4,450
Income tax and social contribution (25,697) (16,716) (76,285)
Net income for the period 48,043 32,468 244,843 Total comprehensive income 48,043 32,468 244,843
STATEMENTS OF CASH FLOWSCash f low s from operational activities 9,670 51,615 17,313
Cash f low s from investiment activities (36,235) 390 (30,336)
Cash f low s from financing activities 38,070 (61,329) -
TOTAL EFFECTS ON CASH AND CASH EQUIVALENTS 11,505 (9,324) (13,023) Cash and cash equivalents at the beginning of the period 34,427 47,584 21,843
Cash and cash equivalents at the end of the period 45,932 38,260 8,820
CHANGE IN CASH AND CASH EQUIVALENTS 11,505 (9,324) (13,023)
Compagás Elejor UEG Araucária
16.4 Joint ventures
CopelCopel GeT
Dominó Holdings S.A. (16.4.1) Curitiba/PR Interest in sew age treatment company 444,202 49.00 - 217,659 Costa Oeste Transmissora de Energia S.A. (a) Curitiba/PR Transmission of electricity 51,020 - 51.00 26,020
Marumbi Transmissora de Energia S.A. (a) Curitiba/PR Transmission of electricity 65,098 - 80.00 52,078
Transmissora Sul Brasileira de Energia S.A. (a) Curitiba/PR Transmission of electricity 328,003 - 20.00 65,601 Caiuá Transmissora de Energia S.A. Curitiba/PR Transmission of electricity 90,155 - 49.00 44,176
Integração Maranhense Transmissora de Energia S.A. (a) Rio de Janeiro/RJ Transmission of electricity 180,905 - 49.00 88,643 Matrinchã Transmissora de Energia (TP NORTE) S.A. (a) Curitiba/PR Transmission of electricity 451,983 - 49.00 221,472
Guaraciaba Transmissora de Energia (TP SUL) S.A. (a) Curitiba/PR Transmission of electricity 90,176 - 49.00 44,186 Paranaíba Transmissora de Energia S.A. (a) Rio de Janeiro/RJ Transmission of electricity 174,161 - 24.50 42,669
Mata de Santa Genebra Transmissão S.A. (a) Rio de Janeiro/RJ Transmission of electricity 29,134 - 50.10 14,596
(a) Pre-operating stage
Jointly controlled Headquarters Main activityEquity +
Afac
Percentage of share capital %
Book value of share capital
16.4.1 Dominó Holdings S.A.
At the Extraordinary Meeting held on March 28, 2014 shareholders of Dominó Holdings approved
the redemption and cancellation of 150,431,809 common shares in the capital of Dominó Holdings.
The full redemption of the shares of one of the shareholders and the resizing of the other
shareholders' ownership interest caused Copel's share of the capital of Dominó Holdings to
increase from 45% to 49%.

34
16.4.2 Main groups of assets, liabilities and results of joint ventures
06.30.2014.
ASSETS 467,540 95,264 72,221 616,500 199,027 354,858 1,082,003 556,325 176,476 30,377
Current assets 39,709 6,642 7,481 29,803 19,044 29,279 45,832 121,470 56,248 15,052
Cash and cash equivalents 989 6,606 7,459 8,287 6,896 11,911 41,505 119,635 55,510 14,502
Other current assets 38,720 36 22 21,516 12,148 17,368 4,327 1,835 738 550
Noncurrent assets 427,831 88,622 64,740 586,697 179,983 325,579 1,036,171 434,855 120,228 15,325 .
LIABILITIES 467,540 95,264 72,221 616,500 199,027 354,858 1,082,003 556,325 176,476 30,377
Current liabilities 23,338 11,203 5,113 33,526 15,381 15,721 608,610 457,262 1,442 1,243
Financial liabilities - - - 16,414 6,285 11,374 597,066 441,964 - -
Other current liabilities 23,338 11,203 5,113 17,112 9,096 4,347 11,544 15,298 1,442 1,243
Noncurrent liabilities - 35,380 25,521 254,971 99,431 211,936 248,017 8,887 873 -
Financial liabilities - - - 249,654 74,744 122,268 - - - -
Advance for future capital increase - 2,339 23,511 - 5,940 53,704 226,607 - - -
Other noncurrent liabilities - 33,041 2,010 5,317 18,747 35,964 21,410 8,887 873 -
Equity 444,202 48,681 41,587 328,003 84,215 127,201 225,376 90,176 174,161 29,134
.
STATEMENT OF INCOME
Net operating income - 42,054 33,379 113,203 51,281 62,240 450,100 218,149 63,004 15,325
Operating costs and expenses (969) (34,390) (28,346) (97,356) (46,371) (54,684) (466,727) (226,338) (65,008) (16,182)
Financial results (2,990) (72) 415 (7,944) (2,016) (3,107) 42,006 19,122 5,306 (7)
Equity in income of subsidiaries 72,399 - - - - - - - - -
Income tax and social contribution - (1,515) (1,157) (678) (960) (3,736) - - - -
Profit (loss) for the year 68,440 6,077 4,291 7,225 1,934 713 25,379 10,933 3,302 (864)
Total comprehensive income for the period68,440 6,077 4,291 7,225 1,934 713 25,379 10,933 3,302 (864) .
(a) Balances adjusted to accounting practices
Matrinchã Guaraciaba ParanaíbaMata de
Santa Genebra
Dominó (a)
Costa Oeste
MarumbiTransmissora Sul Brasileira
Caiuá Integração
Maranhense
16.5 Associates
Cia. de Saneamento do Paraná - Sanepar (16.5.1) Curitiba/PR Basic sanitation 3,511,998 7.6252 267,797
Dona Francisca Energética S.A. Agudo/RS Electric Pow er 215,257 23.0303 49,574
Foz do Chopim Energética Ltda. Curitiba/PR Electric Pow er 43,097 35.77 15,416
Carbocampel S.A. Figueira/PR Coal exploration 2,869 49.00 1,406
Dois Saltos Empreendimentos de
Geração de Energia Elétrica Ltda. (a) Curitiba/PR Electric Pow er 2,400 30.00 720
Copel Amec S/C Ltda.- being settled Curitiba/PR Services 391 48.00 188
Escoelectric Ltda. Curitiba/PR Services 651 40.00 260
Sercomtel S.A. Telecomunicações (b) Londrina/PR Telecommunications - 45.00 - .(a) Pre-operating stage
(b) Investment reduced to zero in 2013 due to the impairment tests
Book value of share capital
06.30.2014 Headquarters Main activityEquity +
Afac
Percentage of share capital
16.5.1 Companhia de Saneamento do Paraná - Sanepar
On April 17, 2014, the Company became the holder of a direct ownership interest in Sanepar
consisting of 36,343,267 preferred registered shares, which account for 14.86% of preferred
registered shares and 7.6252% of total capital, according to an event approved at the Extraordinary
Meeting held by Dominó Holdings's shareholders on March 28, 2014. This direct participation in
Sanepar results from the following measures adopted by Dominó Holdings: (i) Sanepar common
shares were converted into preferred shares, at the rate of one new preferred share for each
common share converted; and (ii) reduction in share capital through the transfer of Sanepar
preferred registered shares to the shareholders of Dominó Holdings.
Sanepar shares were acquired by Copel to keep them as a permanent investment.

35
16.5.2 Main groups of assets, liabilities and results of associates
06.30.2014 Sanepar (a) Dona Francisca (a) Foz do Chopim.
ASSETS 7,042,790 241,622 45,813
Current assets 602,492 63,842 6,281
Noncurrent assets 6,440,298 177,780 39,532 .
LIABILITIES 7,042,790 241,622 45,813
Current liabilities 731,121 25,633 2,299
Noncurrent liabilities 2,799,671 732 417
Equity 3,511,998 215,257 43,097 .
STATEMENT OF INCOME
Net operating income 1,286,136 54,203 19,974
Operating costs and expenses (935,939) (26,794) (5,214)
Financial income (expense) (50,391) 3,300 (115)
Income tax and social contribution (73,168) (10,429) (686)
Profit (loss) for the perios 226,638 20,280 13,959
Total comprehensive income for the period 226,638 20,280 13,959 .
(a) Balances adjusted to accounting practices
16.6 Advance for future investment
16.6.1 São Bento Energia, Investimentos e Participações S.A
In November 2011, the contract for purchase and sale of 49.9% of the representative shares of
São Bento Energia, Investimentos e Participações S.A, which controls GE Olho D’Água S.A, GE
Boa Vista S.A, GE Farol S.A and GE São Bento do Norte S.A, which holds the concession rights of
Centrais Geradoras Eólicas Olho D’Água, Boa Vista, Farol and São Bento do Norte, respectively,
was signed. The contract will only be effective after approvals by Aneel, by the Economic Defense
Administrative Council – Cade and by the National Socio-Economic Development Bank – BNDES,
which is the bank financing the funds necessary for the investment, construction and operation of
the abovementioned wind power generation enterprises held by the subsidiaries.
If the purchase is not completed, the seller is obliged to return the funds provided, which amount to
R$ 77,886, adjusted by the variation of the National Prices Index – IGPM. The approvals by Aneel
and Cade were obtained, awaiting the completion of the procedure with BNDES.
In December 2013, the agreement of sale and purchase of 50.1% of the remaining shares of São
Bento Energia, in the amount of R$ 109,500, was signed. Until June 30, 2014, R$ 112,056 had
been paid referring to the adjusted value of the price negotiated, R$ 20,789 referring to
reimbursement of the balance of cash and R$ 563 referring to reimbursement of the cash from
additional revenue, as stipulated in the contract.
The contract can be terminated if the approvals from Aneel, Cade and BNDES are not obtained,
where seller is obliged to return the amounts contributed, adjusted by the variance of the Broad
Consumer Prices Index - IPCA. Approvals by Aneel and Cade have been obtained, pending the
consent from BNDES.

36
17 Property, Plant and Equipment
17.1 PP&E by company
Consolidated Accumulated AccumulatedCost depreciation 06.30.2014 Cost depreciation 12.31.201 3
In service
Copel 13 - 13 5 - 5
Copel Geração e Transmissão 12,483,378 (7,510,758) 4,972,620 12,483,418 (7,370,317) 5,113,101
Copel Telecomunicações 526,900 (323,505) 203,395 504,115 (312,251) 191,864
Elejor 594,999 (149,680) 445,319 594,856 (140,657) 454,199
UEG Araucária 686,094 (280,770) 405,324 685,801 (263,587) 422,214
Cutia 19 (16) 3 - - - 14,291,403 (8,264,729) 6,026,674 14,268,195 (8,086,812) 6,181,383
In progress
Copel 30,060 - 30,060 24 - 24
Copel Geração e Transmissão 1,639,693 - 1,639,693 1,475,079 - 1,475,079
Copel Telecomunicações 190,751 - 190,751 174,113 - 174,113
Elejor 13,411 - 13,411 13,292 - 13,292
UEG Araucária 1,536 - 1,536 478 - 478
Cutia 11,485 - 11,485 - - -
Nova Asa Branca I 24,900 - 24,900 14,184 - 14,184
Nova Asa Branca II 26,563 - 26,563 12,135 - 12,135
Nova Asa Branca III 44,872 - 44,872 13,124 - 13,124
Nova Eurus IV 24,482 - 24,482 12,496 - 12,496
Santa Maria 49,113 - 49,113 36,013 - 36,013
Santa Helena 57,676 - 57,676 39,432 - 39,432
Ventos de Santo Uriel 17,629 - 17,629 11,894 - 11,894
2,132,171 - 2,132,171 1,802,264 - 1,802,264 Special liabilities
Copel Geração e Transmissão (15) - (15) (15) - (15)
(15) - (15) (15) - (15)
16,423,559 (8,264,729) 8,158,830 16,070,444 (8,086,812) 7,983,632
17.2 Asset by type of account – in service and in progress
Consolidated Accumulated AccumulatedCost depreciation 06.30.2014 Cost depreciation 12.31.201 3
In serviceReservoirs, dams and aqueducts 7,618,902 (4,567,682) 3,051,220 7,618,902 (4,493,402) 3,125,500
Machinery and equipment 4,818,301 (2,637,288) 2,181,013 4,793,335 (2,551,632) 2,241,703
Buildings 1,520,068 (1,013,968) 506,100 1,519,516 (997,021) 522,495
Land 263,620 (3,848) 259,772 263,620 (2,481) 261,139
Vehicles 58,350 (33,350) 25,000 60,833 (33,884) 26,949
Furniture and tools 12,162 (8,593) 3,569 11,989 (8,392) 3,597
14,291,403 (8,264,729) 6,026,674 14,268,195 (8,086,812) 6,181,383
In progress 2,132,171 - 2,132,171 1,802,264 - 1,802,264
Special liabilities (15) - (15) (15) - (15)
16,423,559 (8,264,729) 8,158,830 16,070,444 (8,086,812) 7,983,632

37
17.3 Changes in Property, Plant and Equipment
Consolidated In service In progress Total
Balance as of January 1, 2014 6,181,383 1,802,249 7,983,632
1st consolidation effect - subsidiaries (Note 16.1) 3 - 3
Investment program paid - 299,120 299,120
Provision for contingences - 11,118 11,118
Financial charges transferred to w orks cost - 7,336 7,336
Fixed assets for projects 28,798 (28,798) -
Transfers to accounts receivable related to the concession (18) - (18)
Transfers of intangible assets (NE nº 18.2) - 41,302 41,302
Depreciation quotas to profit and loss (182,182) - (182,182)
Depreciation quotas - Pasep/Cofins credits (677) - (677)
Write off (633) (171) (804)
Balance as of June 30, 2014 6,026,674 2,132,156 8,158,830
17.4 Colíder Hydroelectric Power Plant (HPP)
On July 30, 2010, at the Aneel Auction of Power from New Projects 003/10, Copel Geração e
Transmissão won the rights to the concession of the Colíder Hydroelectric Power Plant, which will
feature 300 MW of installed capacity; the concession is valid for 35 years from the date of signature
of Concession Contract no. 001/11-MME-HPP Colíder, which took place on January 17, 2011.
This project is included in the Federal Government’s Growth Acceleration Program (PAC) and will
comprise a main powerhouse rated 300 MW, which is enough to supply approximately one million
people. The facility will take advantage of the hydroelectric potential discovered on the Teles Pires
River, between the towns of Nova Canaã do Norte and Itaúba, in the northern region of the State of
Mato Grosso.
The National Bank for Economic and Social Development (BNDES) approved the classification of
the HPP Colíder project for financial support feasibility analysis and the signed financing
agreement, amounted to R$ 1,041,155, in December 2013 was released the amount of R$ 840,106
as note 21.5.
Unit One is expected to start operations on December 30, 2015 and units two and three are
expected to start operations in February and April 2016, respectively.
The Colíder Hydroelectric Power Plant’s power output was sold at an Aneel auction at a final price
of R$ 103.40/MWh, as of July 1, 2010, adjusted according to the variation of the IPCA inflation
index to R$ 131.56/MWh as of June 30, 2014. A total of 125 averages MW were sold, for supply
starting in January 2015 for 30 years. The assured power of the project, established in its
concession agreement, was 179.6 averages MW, after full motorization.
The expenditures in this venture on June 30, 2014 totaled R$ 1,463,751.
Total commitments already assumed with suppliers of equipment and services in connection with
the Colíder Hydroelectric Power Plant amounted to R$ 256,491 as of June 30, 2014.

38
17.5 Consórcio Tapajós
Copel Geração e Transmissão has signed a Technical Cooperation Agreement with eight other
companies of the sector to conduct studies on the Tapajós and Jamanxim Rivers, in the North
Region of Brazil, comprising an integrated environmental assessment of the Tapajós River Basin
and viability and environmental studies of five hydroelectric projects, totaling 10,682 MW of
installed capacity.
The power stations that are currently under study are Jatobá, with 2,338 MW, and São Luiz do
Tapajós, the larger station, with 6,133 MW, both on the Tapajós River. In the future the Cachoeira
do Caí (802 MW), Cachoeira dos Patos (528 MW) and Jamanxim (881 MW) power stations on the
Jamanxim River will be studied.
The expenditures on this project on June 30, 2014 totaled R$ 11,990.
17.6 Consórcio Empreendedor Baixo Iguaçu
On August 27, 2013 Copel Geração e Transmissão entered into a consortium with Geração Céu
Azul S.A., with ownership percentage of 30% and 70%, respectively, to build and operate the Baixo
Iguaçu Hydroelectric Power Plant, with a minimum installed capacity of 350.20 MW, located in Rio
Iguaçu, between the municipalities of Capanema and Capitão Leônidas Marques, and between
UPP Governador José Richa and the Iguaçu National Park, in Paraná State, which runs on 3
Kaplan turbines. This consortium was named "Consórcio Empreendedor Baixo Iguaçu" - CEBI.
As of June 30, 2014 the expenses incurred on this venture amounted to R$ 1,070.

39
18 Intangible Asset
Consolidated Concession Concession Right to use and autorization rights contracts software
accumulated accumulated accumulatedcost amortization (a) cost amortization (a) cost amor tization (b) Other 06.30.2014
In serviceAssets w ith finite useful life Copel Geração e Transmissão - - 16,779 (1,322) 18,060 (7,418) 43 26,142 Copel Distribuição - - 3,634,635 (3,365,119) - - - 269,516
Copel Distribuição - Special liabilities - - (328,556) 280,567 - - - (47,989) Copel Telecomunicações - - - - 23,371 (11,234) - 12,137
Compagás - - 246,643 (109,773) 5,222 (3,537) - 138,555 Elejor - - 263,921 (73,531) - - 3,509 193,899
UEG Araucária - - - - 394 (237) - 157 Concession Right - Elejor 22,626 (6,224) - - - - - 16,402
Autorization Right - Cutia (18.1) 8,712 - - - - - - 8,712 Autorization Right - Nova Asa I 53,502 - - - - - - 53,502
Autorization Right - Nova Asa II 53,601 - - - - - - 53,601
Autorization Right - Nova Asa III 51,833 - - - - - - 51,833 Autorization Right - Nova Eurus IV 55,058 - - - - - - 55,058
Autorization Right - S. Maria 27,731 - - - - - - 27,731 Autorization Right - S. Helena 29,913 - - - - - - 29,913
Autorization Right - Ventos S. Uriel 13,947 - - - - - - 13,947
316,923 (6,224) 3,833,422 (3,269,178) 47,047 (22,426) 3,552 903,116 Assets w ith indefinite useful lifeCompagás - - - - - - 21 21
- - - - - - 21 21 316,923 (6,224) 3,833,422 (3,269,178) 47,047 (22,426) 3,573 903,137
In progressCopel - - - - - - 1,939 1,939 Copel Geração e Transmissão - - 18,627 - 2,476 - 2,444 23,547
Copel Distribuição - - 1,251,966 - - - - 1,251,966 Copel Distribuição- Special liabilities - (167,912) - - - - (167,912)
Copel Telecomunicações - - - - 2,739 - 85 2,824 Compagás - - 99,789 - - - - 99,789
Nova Asa Branca I - - - - - - 44 44 Nova Asa Branca II - - - - - - 46 46
Nova Asa Branca III - - - - - - 211 211 Nova Eurus IV - - - - - - 55 55
Santa Maria - - - - - - 443 443 Santa Helena - - - - - - 42 42
Ventos de Santo Uriel - - - - - - 52 52
- - 1,202,470 - 5,215 - 5,361 1,213,046
2,116,183
(a) Amortization over the concession period(b) Annual amortization rate: 20%

40
Consolidated Concession Concession Right to use and autorization rights contracts software
accumulated accumulated accumulatedcost amortization (a) cost amortization (a) cost amortization (b) Other 12.31.2013
In serviceAssets w ith finite useful life Copel Geração e Transmissão - - 15,884 (732) 17,734 (6,108) 43 26,821
Copel Distribuição - - 3,664,119 (3,269,508) - - - 394,611
Copel Distribuição - Special liabilities - - (326,007) 256,417 - - - (69,590)
Copel Telecomunicações - - - - 22,386 (9,280) - 13,106
Compagás - - 239,239 (101,937) 5,221 (3,296) - 139,227
Elejor - - 263,920 (69,141) - - 6,286 201,065
UEG Araucária - - - - 373 (206) - 167
Concession Right - Elejor 22,626 (5,847) - - - - - 16,779
Autorization Right - Cutia (18.1) 5,809 - - - - - - 5,809
Autorization Right - Nova Asa I 51,659 - - - - - - 51,659
Autorization Right - Nova Asa II 51,745 - - - - - - 51,745
Autorization Right - Nova Asa III 49,948 - - - - - - 49,948
Autorization Right - Nova Eurus IV 53,154 - - - - - - 53,154
Autorization Right - S. Maria 26,813 - - - - - - 26,813
Autorization Right - S. Helena 28,955 - - - - - - 28,955
Autorization Right - Ventos S. Uriel 13,445 - - - - - - 13,445
304,154 (5,847) 3,857,155 (3,184,901) 45,714 (18,890) 6,329 1,003,714 Assets w ith indefinite useful lifeCompagás - - - - - - 21 21
- - - - - - 21 21 304,154 (5,847) 3,857,155 (3,184,901) 45,714 (18,890) 6,350 1,003,735
In progressCopel Geração e Transmissão - - 17,209 - 1,940 - 2,531 21,680
Copel Distribuição - - 1,091,217 - - - - 1,091,217
Copel Distribuição- Special liabilities - (154,965) - - - - (154,965)
Copel Telecomunicações - - - - 2,032 - 85 2,117
Compagás - - 70,716 - - - - 70,716
Nova Asa Branca I - - - - - - 44 44
Nova Asa Branca II - - - - - - 44 44
Nova Asa Branca III - - - - - - 190 190
Nova Eurus IV - - - - - - 42 42
Santa Maria - - - - - - 447 447
Santa Helena - - - - - - 42 42
Ventos de Santo Uriel - - - - - - 52 52
- - 1,024,177 - 3,972 - 3,477 1,031,626
2,035,361
(a) Amortization over the concession period(b) Annual amortization rate: 20%
18.1 Changes in intangible assets
The acquisition in 2011 of 49.9% of Cutia's shares generated an authorization right of R$ 5,809
and the acquisition of 50.1% of the shares (in 2014, note 16.1) generated an authorization right of
R$ 2,903, totaling R$ 8,712, which will be amortized during the authorization period from the date
the enterprise starts its business operations, which is expected for January 1, 2015, according to
Aneel's authorizing resolutions. The wind farms are authorized for 30 years, as from the date that
the authorizing resolutions were published on the Federal Register, on January 5, 2012.
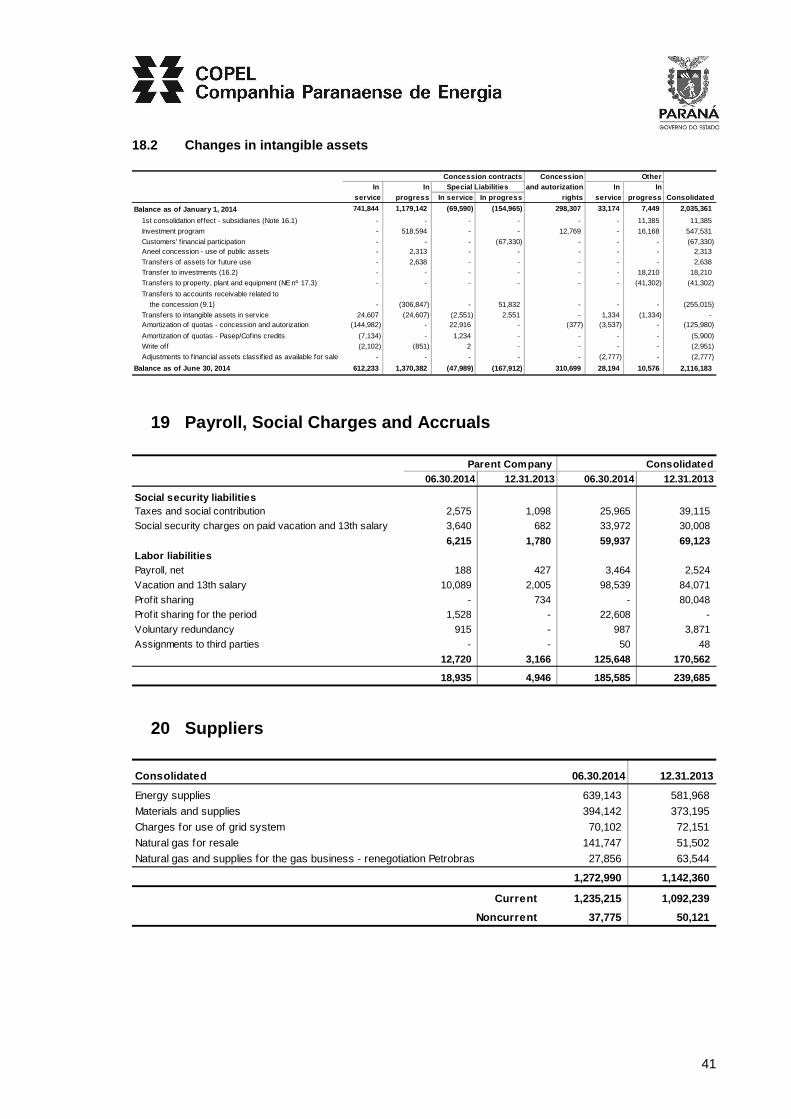
41
18.2 Changes in intangible assets .
Concession contracts Concession OtherIn In and autorization In In
service progress In service In progress rights service pr ogress Consolidated
Balance as of January 1, 2014 741,844 1,179,142 (69,590) (154,965) 298,307 33,174 7,449 2,035,361
1st consolidation effect - subsidiaries (Note 16.1) - - - - - - 11,385 11,385
Investment program - 518,594 - - 12,769 - 16,168 547,531
Customers' f inancial participation - - - (67,330) - - - (67,330) Aneel concession - use of public assets - 2,313 - - - - - 2,313
Transfers of assets for future use - 2,638 - - - - - 2,638 Transfer to investments (16.2) - - - - - - 18,210 18,210
Transfers to property, plant and equipment (NE nº 17.3) - - - - - - (41,302) (41,302)
Transfers to accounts receivable related to
the concession (9.1) - (306,847) - 51,832 - - - (255,015)
Transfers to intangible assets in service 24,607 (24,607) (2,551) 2,551 - 1,334 (1,334) - Amortization of quotas - concession and autorization (144,982) - 22,916 - (377) (3,537) - (125,980)
Amortization of quotas - Pasep/Cofins credits (7,134) - 1,234 - - - - (5,900) Write off (2,102) (851) 2 - - - - (2,951)
Adjustments to financial assets classified as available for sale - - - - - (2,777) - (2,777)
Balance as of June 30, 2014 612,233 1,370,382 (47,989) (167,912) 310,699 28,194 10,576 2,116,183
Special Liabilities
19 Payroll, Social Charges and Accruals
. Parent Company Consolidated06.30.2014 12.31.2013 06.30.2014 12.31.2013
Social security liabilitiesTaxes and social contribution 2,575 1,098 25,965 39,115 Social security charges on paid vacation and 13th salary 3,640 682 33,972 30,008
6,215 1,780 59,937 69,123 Labor liabilitiesPayroll, net 188 427 3,464 2,524
Vacation and 13th salary 10,089 2,005 98,539 84,071
Profit sharing - 734 - 80,048 Profit sharing for the period 1,528 - 22,608 -
Voluntary redundancy 915 - 987 3,871
Assignments to third parties - - 50 48
12,720 3,166 125,648 170,562
18,935 4,946 185,585 239,685
20 Suppliers
Consolidated 06.30.2014 12.31.2013
Energy supplies 639,143 581,968
Materials and supplies 394,142 373,195
Charges for use of grid system 70,102 72,151
Natural gas for resale 141,747 51,502
Natural gas and supplies for the gas business - renegotiation Petrobras 27,856 63,544
1,272,990 1,142,360
Current 1,235,215 1,092,239
Noncurrent 37,775 50,121

42
20.1 Main Power purchase agreements
The power purchase agreements signed in the regulated power trading environment, shown at
original value and adjusted annually according to the IPCA inflation index: C
. Supply Energy purchased Auction Average purchaseperiod (annual average MW) date price (R$/MWh)
Auction of power from existing facilities1st Auction - Product 2007 2007 to 2014 37.49 12.07.2004 75.46
2nd Auction - Product 2008 2008 to 2015 52.05 04.02.2005 83.13
4th Auction - Product 2009 2009 to 2016 45.01 10.11.2005 94.91
5th Auction - Product 2007 2007 to 2014 49.88 12.14.2006 104.74
8th Auction- Product 2010 Q5 2010 to 2014 0.01 11.30.2009 99.14
8th Auction- Product 2010 D5 2010 to 2014 0.01 11.30.2009 80.00
10th Auction- Product 2012 Q3 2012 to 2014 15.60 11.30.2011 79.99
12th Auction-Product 2014 12M 01/01/2014 to 12/31/2014 328.91 12.17.2013 191.41
12th Auction-Product 2014 18M 01/01/2014 to 06/30/2015 19.49 12.17.2013 165.20
12th Auction-Product 2014 36M 01/01/2014 to 12/31/2016 162.86 12.17.2013 149.99
13th Auction-Product 2014-DIS 05/01/2014 to 12/31/2019 73.18 04.30.2014 262.00
13th Auction-Product 2014-QTD 05/01/2014 to 12/31/2019 187.22 04.30.2014 271.00
971.71 Auction of power from new facilities1st Auction- Product 2008 Hidro 2008 to 2037 3.61 12.16.2005 106.95
1st Auction- Product 2008 Termo 2008 to 2022 25.10 12.16.2005 132.26
1st Auction- Product 2009 Hidro 2009 to 2038 3.54 12.16.2005 114.28
1st Auction- Product 2009 Termo 2009 to 2023 40.88 12.16.2005 129.26
1st Auction- Product 2010 Hidro 2010 to 2039 69.87 12.16.2005 115.04
1st Auction- Product 2010 Termo 2010 to 2024 65.01 12.16.2005 121.81
3rd Auction- Product 2011 Hidro 2011 to 2040 57.66 10.10.2006 120.86
3rd Auction- Product 2011 Termo 2011 to 2025 54.22 10.10.2006 137.44
4th Auction- Product 2010 Termo 2010 to 2024 15.44 07.26.2007 134.67
5th Auction- Product 2012 Hidro 2012 to 2041 53.24 10.16.2007 129.14
5th Auction- Product 2012 Termo 2012 to 2026 115.38 10.16.2007 128.37
6th Auction- Product 2011 Termo 2011 to 2025 9.89 09.17.2008 128.42
7th Auction- Product 2013 Hidro 2013 to 2042 - 09.30.2008 98.98
7th Auction- Product 2013 Termo 2013 to 2027 110.96 09.30.2008 145.23
8th Auction- Product 2012 Hidro 2012 to 2041 0.01 08.27.2009 144.00
8th Auction- Product 2012 Termo 2012 to 2026 0.15 08.27.2009 144.60
624.96 Structuring projects auctionSanto Antonio 2012 to 2041 97.10 12.10.2007 78.87
Jirau 2013 to 2042 210.42 05.19.2008 71.37 307.52

43
21 Loans and Financing
Consolidated Current liabilities Noncurrent liabilities
Principal Charges 06.30.2014 12.31.2013 06.30.2014 12.3 1.2013
Foreign currency STN (21.1) - 528 528 2,154 59,843 62,661
Eletrobrás 3 - 3 7 - -
3 528 531 2,161 59,843 62,661 Local currencyBanco do Brasil (21.2) 384,737 81,004 465,741 716,067 1,144,585 886,893
Eletrobrás (21.3) 49,486 45 49,531 49,329 105,982 130,427
Finep (21.4) 6,509 65 6,574 6,935 30,205 33,622
BNDES (21.5) 19,919 12,009 31,928 20,776 1,094,286 1,104,333
Banco do Brasil
Transfer BNDES (21.6) 11,369 414 11,783 11,838 143,058 148,742
Promissory notes - - - 150,000 - -
472,020 93,537 565,557 954,945 2,518,116 2,304,017
472,023 94,065 566,088 957,106 2,577,959 2,366,678
Parent Company Current liabilities Noncurrent liabilities
Principal Charges 06.30.2014 12.31.2013 06.30.2014 12.3 1.2013Foreign currency STN (21.1) - 528 528 2,154 59,843 62,661 .
Local currencyBanco do Brasil (21.2) 269,473 33,758 303,231 560,647 624,584 394,091
269,473 34,286 303,759 562,801 684,427 456,752
21.1 Department of the National Treasury - STN
Number of Final Annual rate p.y. Consolidated
Type of bonus installment maturity Amortization (intere st + commission) Principal 06.30.2014 12.31.2013
Capitalization Bond 21 04.10.2014 Semi Annual 8.0% + 0.20% 12,225 - 1,595
Par Bond 1 04.11.2024 Single installment 6.0% + 0.20% 17,315 35,704 37,385
Discount Bond 1 04.11.2024 Single installment Libor Semi Annual+0.8125%+0.20% 12,082 24,667 25,835
60,371 64,815
Current 528 2,154 Noncurrent 59,843 62,661
Company: Copel
Issue Date:05.20.1998
Collateral:Company’s centralized revenues account. For the Discount and Par Bonds, there are collateral deposits of R$ 19,086 and R$ 27,251
as of June 30, 2014 (R$ 18,700 and R$ 26,671 as of December 31, 2013), respectively (Note 6.1).
Note:
The restructuring of medium and long-term debt in connection w ith the f inancing received under Law nº 4,131/62.

44
21.2 Banco do Brasil S.A.
Issue Number of Final Annual rate p.y. Consolidated
Contracts Date installment maturity (interest + commiss ion) Principal 06.30.2014 12.31.2013
Law 8,727/93 (a) 03.30.1994 240 03.01.2014 TJLP and IGP-M + 5.098% 28,178 - 66
21/02155-4 (b) 09.10.2010 3 08.15.2015 98.5% of average rate of CDI 350,000 327,195 311,286
21/02248-8 (c) 06.22.2011 1 06.01.2015 99.5% of average rate of CDI 150,000 194,383 184,735
CCB 21/11062X (d) 08.26.2013 3 07.27.2018 106.0% of average rate of CDI 151,000 160,933 152,135
NC 330600129 (e) 01.31.2007 1 01.31.2014 106.5% of average rate of CDI 29,000 - 30,156
NC 330600132 (f) 02.28.2007 1 02.28.2019 107.8% of average rate of CDI 231,000 237,260 238,591
NC 330600151 (g) 07.31.2007 1 07.31.2014 106.5% of average rate of CDI 18,000 18,783 18,718
NC 330600156 (h) 08.28.2007 1 08.28.2014 106.5% of average rate of CDI 14,348 14,851 14,821
NC 330600157 (i) 08.31.2007 1 08.31.2014 106.5% of average rate of CDI 37,252 38,543 38,439
NC 330600609 (j) 08.19.2011 3 07.21.2016 109.41% of average rate of CDI 600,000 618,378 614,013
1,610,326 1,602,960
Current 465,741 716,067 Noncurrent 1,144,585 886,893
Company:Copel Distribuição: (a) (b) (c) (d)
Copel: (e) (f) (g) (h) (i) (j)
Annual installmentAlong w ith the interest in proportion to the installments, the f irst amount of R$ 116,666, maturing on 08.25.2013 and others of R$ 116,667, maturing on 07.11.2014 and 08.15.2015: (b)
Together w ith the data is the interest accrued on the installments, in the amount of R$ 50,333, falling due on July 27, 2016,
July 27, 2017 and July 27, 2018: (d)
The f irst amount of R$ 200,000, maturing on 07.21.2014 and other on 07.21.2015 and 07.21.2016: (j)
Destination:Private Credit Assignment Agreement w ith the Federal Government: (a)
Working capital: (b) (c) (d)
Only purpose of paying the debts: (e) (f) (g) (h) (i) (j)
Collateral:Copel’s accounts receivable: (a)
Pledge until 360 days: (b) (c)
Assignment of receivables: (d)
Note:On 02.28.2014, the additive correction and ratif ication of the NC 330600132 extended the maturity and changed the form of
payment and f inancial charges. (f)

45
21.3 Eletrobrás - Centrais Elétricas Brasileiras S.A.
Issue Number of Final Annual rate p.y. Consolidated
Contracts Date installment maturity (interest + commiss ion) Principal 06.30.2014 12.31.2013
1293/94 (a) 09.23.1994 180 06.30.2016 5.5% to 6.5% + 2.0% 307,713 67,053 83,362
980/95 (b) 12.22.1994 80 11.15.2018 8.0% 11 12 12
981/95 (c) 12.22.1994 80 08.15.2019 8.0% 1,169 344 376
982/95 (d) 12.22.1994 80 02.15.2020 8.0% 1,283 131 142
983/95 (e) 12.22.1994 80 11.15.2020 8.0% 11 167 179
984/95 (f) 12.22.1994 80 11.15.2020 8.0% 14 71 77
985/95 (g) 12.22.1994 80 08.15.2021 8.0% 61 44 47
002/04 (h) 06.07.2004 120 07.30.2016 8.0% 30,240 2,295 2,846
142/06 (i) 05.11.2006 120 09.30.2018 5.0% + 1.0% 74,340 15,466 17,286
206/07 (j) 03.03.2008 120 08.30.2020 5.0% + 1.0% 109,642 54,905 59,357
273/09 (k) 02.18.2010 120 12.30.2022 5.0% + 1.0% 63,944 13,976 14,798
2540/06 (l) 05.12.2009 60 10.30.2016 5.0% + 1.5% 2,844 1,049 1,274
155,513 179,756
Current 49,531 49,329 Noncurrent 105,982 130,427
Company:Copel Geração e Transmissão: (a)
Copel Distribuição: (b) (c) (d) (e) (f) (g) (h) (i) (j) (k) (l)
Destination:Financial cover up to 29.14% of the total project of HPP Governador José Richa Implementation and transmission system: (a)
National Program for Watering - Proni: (b) (c) (d) (e) (f) (g)
Rural Electricity Program - Luz para Todos: (h) (i) (j) (k)
National Program for Eff icient Public Lighting - ReLuz: cover 75% of the total cost of the Project for the City of Ponta Grossa:(l)
Collateral:The guarantee is represented by the income, supported by pow er of attorney granted by a public instrument,
and the issue of promissory notes equal to the number of installments falling due.
21.4 Finep
Issue Number of Final Annual rate p.y. Consolidated
Contracts Date installment maturity (interest + commiss ion) Principal 06.30.2014 12.31.2013
2070791-00 (a) 11.28.2007 49 12.15.2014 0.37% above TJLP 5,078 574 1,147 2070790-00 (b) 11.28.2007 49 12.15.2014 0.13% above TJLP 3,535 273 547 21120105-00 (c) 05.17.2012 81 10.15.2020 4.0% 35,095 19,914 21,223 21120105-00 (c) 05.17.2012 81 10.15.2020 3.5% + TR 17,103 16,018 17,640
36,779 40,557
Current 6,574 6,935 Noncurrent 30,205 33,622
Company:Copel Geração e Transmissão: (a) (b)
Copel Telecomunicações: (c)
Destination:Research and Development Project GER 2007: (a)Research and Development Project TRA 2007: (b)
BEL project - ultra w ide band intranet service (Ultra Wide Band - UWB): (c)
Collateral:Withhold the amounts from the checking account in w hich revenues are deposited: (a) (b) (c)

46
21.5 BNDES
Issue Number of Annual rate p.y. Consolidated
Contracts Date installment initial final (interest + com mission) Principal 06.30.2014 12.31.2013
820989.1 (a) 03.17.2009 179 02.15.2012 01.15.2028 1.63% above TJLP 169,500 154,843 160,572 1120952.1-A (b) 12.16.2011 168 05.15.2012 04.15.2026 1.82% above TJLP 42,433 35,958 37,484 1120952.1-B (c) 12.16.2011 168 05.15.2012 04.15.2026 1.42% above TJLP 2,290 1,940 2,022 1220768.1 (d) 09.28.2012 192 08.15.2013 07.15.2029 1.36% above TJLP 73,122 65,069 67,259 13211061 (e) 12.04.2013 192 11.15.2015 10.15.2031 1.49% above TJLP 1,041,155 850,615 840,106
13210331 (f) 12.03.2013 168 09.15.2014 08.15.2028 1.49% and 1.89% above TJLP 17,644 17,789 17,666
1,126,214 1,125,109
Current 31,928 20,776 Noncurrent 1,094,286 1,104,333
Company:Copel Geração e Transmissão
Financial charges:It w ill be paid monthly after the first payment of the principal amount.
Destination:Construction of the Mauá Hydroelectric Pow er Plant and its transmission system: (a)
Implementation of transmission line betw een substations Foz do Iguaçu and Cascavel Oeste: (b)
Purchase of machinery and equipment: (c)
Implementation of Cavernoso II SHP: (d)
Implementation of HPP Colíder and associated transmission system: (e)
Implementation of the 230/138kV Cerquilho III Substation: (f)
Collateral:All the revenues from the sale of energy under Agreements for Energy Trade on the Regulated Pow er Market (“Contracts for the
Sale of Energy in the Regulated Environment” or CCEARs) in connection w ith this project (a) and (d)
Copel Geração e Transmissão has undertaken to assign to the BNDES the rights it holds under Concession Arrangement
027/2009-ANEEL, and to submit as a guarantee to the BNDES the credit rights deriving from the provision of energy transmission
services stipulated in the Concession Arrangement (Transmission Services Agreement 09/2010), by Copel Geração e Transmissão
and the National Electric System Operator (Operador Nacional do Sistema Elétrico or ONS), the transmission concession operators
and the users of the transmission system, including the entire revenue deriving from the transmission services provided: (b) and (c)
Statutory assignment of the rights under Concession Agreement 01/2011MME-HPP Colíder and statutory assignment under the electricity purchase and sale agreement (CCVEE) betw een Copel and Sadia S.A.: (e)
Statutory assignment of the rights under Public Electricity Transmission Service Concession Agreement 015/2010-ANEEL, betw een Copel and the federal government: (f)
Maturity
21.6 Banco do Brasil - Distribution of Funds from BNDES
Issue Number of Annual rate p.y. Consolidated
Contracts Date installment initial final (interest + com mission) Principal 06.30.2014 12.31.2013
21/02000-0 04.16.2009 179 02.15.2012 01.15.2028 2.13% above TJLP 169,500 154,841 160,580
154,841 160,580
Current 11,783 11,838 Noncurrent 143,058 148,742
Company:Copel Geração e Transmissão
Financial charges:It w ill be paid quarterly during the grace period and monthly after the first payment of the principal amount
Destination:Construction of the Mauá Hydroelectric Pow er Plant and its transmission system, in consortium w ith Eletrosul
Collateral:All the revenues from the sale of energy under Agreements for Energy Trade on the Regulated Pow er Market (“Contracts
for the Sale of Energy in the Regulated Environment” or CCEARs) in connection w ith this project
Maturity
47
21.7 Breakdown of loans and financing by currency and index
Index and change in foreign currencies Consolidated accumulated in the period (%) 06.30.2014 % 12.31. 2013 %
Foreign currency U.S. Dolar (5.98) 60,374 1.92 64,822 1.95
60,374 1.92 64,822 1.95 Local currencyTJLP - 1,281,903 40.77 1,308,607 39.37
IGP-M 2.45 - - 65 -
Ufir - 88,459 2.81 96,394 2.90
Finel 0.49 67,052 2.13 83,361 2.51 CDI 4.26 1,610,327 51.22 1,752,895 52.74
TR 0.35 16,018 0.51 - -
Without indexer - 19,914 0.64 17,640 0.53
3,083,673 98.08 3,258,962 98.05
3,144,047 100.00 3,323,784 100.00
Current 566,088 957,106 Noncurrent 2,577,959 2,366,678
21.8 Maturity of noncurrent installments
06.30.2014Foreign
currencyLocal
currency Total Foreign
currencyLocal
currency Total
2015 - 197,762 197,762 - 608,204 608,204
2016 - 197,762 197,762 - 374,839 374,839
2017 - 76,353 76,353 - 233,928 233,928
2018 - 76,353 76,353 - 233,018 233,018
2019 - 76,354 76,354 - 175,510 175,510
After 2020 59,843 - 59,843 59,843 892,617 952,460
59,843 624,584 684,427 59,843 2,518,116 2,577,959
Parent Company Consolidated
21.9 Changes in loans and financing
Foreign currency Local currencyConsolidated Current Noncurrent Current Noncurrent T otal
Balance as of January 1, 2014 2,161 62,661 954,945 2,304,017 3,323,784
Charges 1,290 - 106,521 25,687 133,498
Monetary and exchange variations (139) (2,818) 100 (359) (3,216)
Transfers - - (188,771) 188,771 -
Amortization - principal (736) - (214,927) - (215,663)
Amortization - interest (2,045) - (92,311) - (94,356)
Balance as of June 30, 2014 531 59,843 565,557 2,518,116 3,144,047

48
21.10 Contracts with clauses for anticipated matu rity
The Company and its subsidiaries contracted loans which include clauses requiring that they
maintain certain economic-financial indices within previously established parameters, as well as
other conditions that have to be observed, such as: no alterations to the investment interest of the
Company in the capital of subsidiaries that represents a change in control, without prior notice;
specifically for Copel Geração e Transmissão, no dividend distributions or payments for interest on
own capital to be made, for which the amount, individually or together, exceeds the minimum
compulsory amount, without prior and express authorization. Non compliance with these terms
could result in the anticipated maturity of the debts and/or fines.
At June 30, 2014 all contractual covenants had been complied with.

49
22 Debentures
Issue Number of Annual rate p.y. Consolidated
Debentures Date installment initial final (interest) Prin cipal 06.30.2014 12.31.2013
5th issue (a) 05.13.2014 3 05.13.2017 05.13.2019 111.5% above DI 1,000,000 1,004,707 -
1st issue (b) 10.30.2012 2 10.30.2016 10.30.2017 DI + Spread 0.99% p.y. 1,000,000 1,017,101 1,015,389
2nd issue (c) 09.26.2013 60 10.26.2013 09.26.2018 DI + Spread 1.00% p.y. 203,000 172,223 192,556
1st issue (d) 06.15.2013 40 09.15.2015 12.15.2018 TJLP+1.7% p.y.+1.0% p.y. 62,626 42,876 -
1st issue (e) 06.10.2014 1 - 06.10.2015 100% CDI + Spread 0.90% p.y. 330,000 330,335 -
2,567,242 1,207,945
Current 399,769 57,462 Noncurrent 2,167,473 1,150,483
Company:Copel: (a) Nova Asa Branca I (e) Santa Maria (e)Copel Distribuição: (b) Nova Asa Branca II (e) Santa Helena (e)Elejor: (c) Nova Asa Branca III (e) Ventos de Santo Uriel (e)Compagas: (d) Nova Eurus IV (e)
Characteristics: Simple debentures, single series, unconvertible, unsecured debenture, w as approved for public offering under restricted
placement efforts, pursuant to CVM Instruction number 476, in the minimum amount of R$ 1.000.000 (a and b) and R$ 203.000 (c)
notes w ere issued w ith a unit value of R$ 10, in quantity of 100.000 (a and b) and 20.300 (c)
Simple floating debentures, issued privately in a single series and not convertible into shares, in the amount of R$ 62.626 (d)
Securities w orth R$ 1 per unit w ere issued in the quantity of: 62,626 (d)
Simple, single series, unsecured and not convertible into shares debentures that are to be distributed in the market under restricted
placement efforts, pursuant to CVM (Brazilian Securities and Exchange Commission) Instruction 476, in the minimum amounts of:
R$ 53,000 - N. Asa Branca I; R$ 58,000 - N. Asa Branca II; R$ 50,000 - N. Asa Branca III; R$ 30,000 - N. Eurus IV; R$ 50,000 - Santa Maria;
R$ 58,000 - Santa Helena; and R$ 31,000 - Ventos de Santo Uriel. (e)
Securities w ith a unit value of R$ 10,000.00 w ere issued in the amounts of: 5,300 - N. Asa Branca I; 5,800 - N. Asa Branca II;
5,000 - N. Asa Branca III; 3,000 - N. Eurus IV; 5,000 - Santa Maria; 5,800 - Santa Helena; 3,100 - Ventos Santo Uriel. (e)
The unit value of debentures w ill not be adjusted for inf lation: (a) (b) (c) (d) (e)
Finance charges:Interest paid half-yearly in May and November: (a)
Interest paid half-yearly in April and October: (b)
Interest paid monthly: (c)
Interest paid quarterly in March, June, September and December: (d)
Interest paid in a lump sum on maturity date: (e)
Allocation:Working capital or used to make investments in the issuer: (a) and (b)
Full settlement of the loan agreement w ith Copel: (c)
Fund investment plan of the issuer: (d)
Redemption of promissory notes and investment in w ind farms: (e)
Collaterals:Personal guarantee (a) (b) (c) (e)
Floating: (d)
Guarantor:Copel: (b) (e)
Copel, at the ratio of 70% and Paineira Participações S.A., at the ratio of 30%: (c)
Compagas: (d)
Trustee: Pentágono: (a)
C&D Distribuidora de Títulos e Valores Mobiliários S.A.: (b) (c) (e)
BNDES Participações S.A. - BNDESPAR: (d)
Maturity
50
22.1 Changes in debentures
Consolidated Current Noncurrent Total
Balance as of January 1, 2014 57,462 1,150,483 1,207,945
Funding 330,000 1,042,775 1,372,775
Charges 79,668 (4,363) 75,305
Transfers 21,422 (21,422) -
Amortization - principal (20,304) - (20,304)
Amortization - interest and variation (68,479) - (68,479)
Balance as of June 30, 2014 399,769 2,167,473 2,567,242
22.2 Contracts with clauses for anticipated matur ity
Copel Distribuição and your subsidiaries issued debentures that contain covenants that require the
maintenance of certain economic and financial indices within previously established parameters
with enforceability of compliance with annual and other conditions to be observed, such as
changing the shareholding of the Company in the share capital representing a change of control
without the prior consent of the Debenture Holders; not making without prior written consent of the
Debenture holders, payments of dividends or payments of interest on equity, if they are in arrears
regarding compliance with any of their financial obligations or they do not meet the established
financial indices. Failure to comply with these conditions may allow early call of the debentures.
At June 30, 2014 all contractual covenants had been complied with.
23 Post-Employment Benefits
The Company and its subsidiaries sponsor retirement and pension plans (Unified Plan and Plan III)
and a medical and dental care plan (Healthcare Plan) to both current and retired employees and
their dependents.
23.1 Benefit Pension Plan
The unified pension plan is a Defined Benefit Plan - BD in which the income is predetermined,
according to each individual's salary, and pension plan III is a Defined Contribution Plan - CD.
The costs assumed by the sponsors for these plans are recognized according to the actuarial
evaluation prepared annually by independent actuaries in accordance with Technical
Pronouncement CPC 33 (R1)/IAS 19 and IFRC 14, issued by the Accounting Pronouncements
Committee – CPC compulsory for public stock corporations as of January 1, 2013, and refer to
employee benefits, and correlated to IAS 19 (R1) and IFRIC 14. The economic and financial
assumptions for purposes of the actuarial evaluation are discussed with the independent actuaries
and approved by the sponsors’ management.
51
23.2 Healthcare Plan
The Company and its subsidiaries allocate resources for the coverage of health-care expenses
incurred by their employees and their dependents, within rules, limits, and conditions set in specific
regulations. Coverage includes periodic medical exams and is extended to all retirees and
pensioners for life.
23.3 Statement of financial position and statemen t of income
Amounts recognized in the statement of financial position, under Post-Employment Benefits, are
summarized below:
. Parent Company Consolidated
06.30.2014 12.31.2013 06.30.2014 12.31.2013
Pension plan 14 2 191 5
Healthcare plan 17,754 2,169 1,002,776 967,227
17,768 2,171 1,002,967 967,232
Current 14 2 31,041 29,983 Noncurrent 17,754 2,169 971,926 937,249
The amounts recognized in the statement of income are shown below:
. Parent Company Consolidated
06.30.2014 06.30.2013 06.30.2014 06.30.2013
Pension plan (CD) 2,837 - 24,250 28,966
Pension plan (CD) - management 249 311 562 373
Healthcare plan - post employment 1,157 - 51,064 34,425
Healthcare plan 1,548 - 20,675 21,887
Healthcare plan - management 39 40 68 47
5,830 351 96,619 85,698
23.4 Changes in the post-employment benefits
Current NoncurrentConsolidated liabilities liabilities Total
Balance as of January 1, 2014 29,983 937,249 967,232
Appropriation of actuarial calculation - 51,061 51,061
Pension and healthcare contributions 54,374 - 54,374
Transfers 16,384 (16,384) -
Amortizations (69,700) - (69,700)
Balance as of June 30, 2014 31,041 971,926 1,002,967
23.5 Actuarial valuation pursuant to CPC 33 (R1)
The Company, in compliance with the CPC 33 (R1), opts to prepare the actuarial report annually.
The information prepared in compliance with the Actuarial Assessment Report is included in Note
23 to the financial statements as of December 31, 2013.

52
24 Customer Charges Due
Consolidated 06.30.2014 12.31.2013
Global Reversal Reserve (RGR) 13,188 31,652
Energy Development Account (CDE) 11,709 6,342
24,897 37,994
25 Research and Development and Energy Efficiency
25.1 Balance recognized to invest in R&D (Researc h and Development) and EEP (Energy
Efficiency Program)
. Applied and Balance Balance Balance as of Balance as ofunfinished to collect to apply 06.30.2014 12.31.2013
Research and Development - R&DFNDCT (a) - 4,801 - 4,801 3,771
MME - 2,401 - 2,401 1,887
R&D 35,039 - 158,750 193,789 171,928
35,039 7,202 158,750 200,991 177,586
Energy efficiency program - EEP 47,450 - 73,001 120,451 104,995
82,489 7,202 231,751 321,442 282,581
Current 126,537 127,860
Noncurrent 194,905 154,721
(a) National Fund for Scientif ic and Technological Development
25.2 Changes in balances for R&D and EEP
FNDCT MME R&D EEPcurrent current current noncurrent current noncurrent Con solidated
Balance as of January 1, 2014 3,771 1,887 46,956 124,972 75,246 29,749 282,581
Additions 16,243 8,121 492 15,750 - 13,736 54,342
Performance agreement - - - - - 487 487
Selic interest rate - - 84 7,090 - 3,121 10,295
Payments (15,213) (7,607) - - - - (22,820)
Concluded projects - - (1,555) - (1,888) - (3,443)
Balance as of June 30, 2014 4,801 2,401 45,977 147,812 73,358 47,093 321,442

53
26 Accounts Payable related to concession - Use of Public
Property
These refer to concession charges for use of public property (UPP).
Consolidated Current Noncurrent
Grants Signature Final 06.30.2014 12.31.2013 06.30.2014 1 2.31.2013
HHP Mauá (a) 06.29.2007 07.03.2007 07.2042 952 913 13,051 12,612
HHP Colider (b) 12.29.2010 01.17.2011 01.2046 878 118 17,749 17,091
SHP Cavernoso (c) 07.11.2013 07.11.2013 07.2018 37 35 91 101
SHP Apucaraninha (d) 07.11.2013 07.11.2013 07.2018 257 247 641 702
SHP Chopim I (e) 07.11.2013 07.11.2013 07.2015 57 55 2 26
SHP Chaminé (f) 07.11.2013 07.11.2013 07.2018 444 427 1,108 1,214
SHP Drifting Rio Jordão (g) 07.11.2013 02.24.2014 02.2019 221 - 648 -
Fundão – Santa Clara Hydroelectric
Energy Complex (h) 10.23.2001 10.25.2001 10.2036 49,686 49,686 396,856 388,547
52,532 51,481 430,146 420,293
Company:Copel Geração e Transmissão: (a) (b) (c) (d) (e) (f) (g)
Elejor: (h)
Discount rate applied to calculate present value:Actual net discount rate, in line w ith the estimated long-term rate. It bears no relationship w ith the expected project return:
5.65% p.y. (a)
7.74% p.y. (b) (c) (d) (e) (f) (g)
11.00% p.y. (h)
Payment to the federal government:Monthly installments equivalent to 1/12 of the proposed annual payment of R$ 643 (51% of R$ 1,262), according to clause six of
Concession Agreement number 001/07: (a)
Monthly installments equivalent to 1/12 of the proposed annual payment of R$ 1,256, as from the date the hydroelectric pow er
plant starts operations, according to clause six of Concession Agreement number 001/11: (b)
Monthly installments equivalent to 1/12 of the proposed annual payment, according to clause f if th of Concession Agreement
number 007/2013,for a period of f ive years: (c) (d) (e) (f) (g)
Monthly installments equivalent to 1/12 of the proposed annual payment of R$ 19,000, from the sixth to the thirty-f if th year of
concession or w hile the hydroelectric resources are being explored, according to the bid approval document and clause
six of Concession Agreement number 125/01: (h)
Annual adjustment of installments for inflation:Variation IPCA: (a) (b) (c) (d) (e) (f) (g)
Variation IGP-M: (h)
26.1 Change in Accounts Payable related to conces sion - Use of Public Property
Current NoncurrentConsolidated liabilities liabilities Total
Balance as of January 1, 2014 51,481 420,293 471,774
Aneel concession - use of public assets 215 2,098 2,313
Transfers from non-current to current liabilities 25,118 (25,118) -
Payments (25,754) - (25,754)
Monetary variation 1,472 32,873 34,345
Balance as of June 30, 2014 52,532 430,146 482,678

54
27 Other Accounts Payable
Consolidated 06.30.2014 12.31.2013
Financial compensation for use of w ater resources 22,286 22,952
Reimbursements to customer contributions 20,863 19,428
Public lighting fee collected 18,564 21,489
Customers 16,364 18,745
Pledges in guarantee 15,440 14,286
Consortium partners 3,003 3,003
Other liabilities 66,595 37,341
163,115 137,244
Current 162,883 137,011 Noncurrent 232 233
28 Provision for Contingencies
28.1 Lawsuits with Likelihood of Losses deemed as probable
The Company and its subsidiaries are party to several claims filed before different courts. Copel’s
management, based on the opinion of its legal counsel, maintains a provision for contingencies in
connection with lawsuits with probable chance of an unfavorable outcome.
Change in provision for contingencies
Consolidated Balance as of ConstructionAdditions to Property,
Plant and Equipment Balance as ofJanuary 1, 2014 Additions (-) Reversals cost in progress Discharges June 30, 2014
Tax (28.1.1)Cofins (a) 243,131 - - - - - 243,131
Other taxes 44,108 2,014 - - - (987) 45,135
287,239 2,014 - - - (987) 288,266
Labor 196,054 33,106 (406) - - (1,851) 226,903
Employee benefits 94,809 12,923 (414) - - (10,060) 97,258
Civil (28.1.2)Suppliers (a) 64,775 - (2,113) - - - 62,662
Civil and administrative law (b) 197,838 28,730 - - - (1,855) 224,713
Easements 10,639 6,764 - - - (608) 16,795
Condemnation and real estate (c) 353,461 26,207 - 533 11,118 (280) 391,039
Customers 9,633 595 - - - - 10,228
636,346 62,296 (2,113) 533 11,118 (2,743) 705,437
Environmental claims 211 19 - - - - 230
Regulatory (28.1.3) 51,468 853 - - - - 52,321
1,266,127 111,211 (2,933) 533 11,118 (15,641) 1,370,415
Parent Company Balance as of
January 1, 2014 Additions DischargesBalance as ofJune 30, 2014
Tax (28.1.1)Cofins (a) 243,131 - - 243,131
Others taxes 22,016 1,146 (984) 22,178
265,147 1,146 (984) 265,309
Labor - 242 - 242
Civil 390 328 - 718
Regulatory 12,310 - - 12,310
277,847 1,716 (984) 278,579
55
28.1.1 Tax claims
a) Contribution for the Financing of Social Securit y - COFINS
Lawsuit no. 10980.004398/2010-09 – Curitiba Federal Revenue Service Office
This is a tax administrative proceeding (assessment of deficiency) whereby the Brazilian Federal
Revenue Service intends to collect COFINS (Tax for Social Security Financing) for the period from
August 1995 to December 1996, as a result of the final and non-appealable decision rendered on
lawsuit 2000.04.01.100266-9 filed by the federal government, overturning the ruling in lawsuit no.
95.0011037-7 which had recognized the Company’s immunity from payment of COFINS tax.
Given the opinion of the federal tax authorities, the lack of case law precedent, the complexity and
specifics of both facts and legal matter involved, the principal of R$ 48,814 was rated as a probable
loss and the interest and fine are subject to another proceeding (11453.720001/20011-23) and at
June 30, 2014 amount to R$ 128,658, was classified as a possible risk of defeat, as the cases of
defense are different for the principal and the charges.
Lawsuit no. 10980.720458/2011-15 – Curitiba Federal Revenue Service Office
This is a tax administrative proceeding (assessment of deficiency) whereby the Brazilian Federal
Revenue Service intends to collect COFINS (Tax for Social Security Financing) for the period from
October 1998 to June 2001, as a result of the final and non-appealable decision rendered on
lawsuit 2000.04.01.100266-9 filed by the federal government, overturning the ruling in lawsuit no.
95.0011037-7 which had recognized the Company’s immunity from payment of COFINS tax.
The Federal Revenue Services understands that the sentence for the Rescission Claim had
suspended the liability period for constituting the aforementioned tax credit.
Given the lack of law precedent, the complexity and specifics of both facts and legal matter
involved, the principal of R$ 194,317 was rated as a probable loss and the interest and fine on said
tax liability at June 30, 2014 amount to R$ 673,403, was classified as a possible risk of defeat, as
the cases of defense are different for the principal and the charges.
28.1.2 Civil claims
a) Suppliers
Rio Pedrinho Energética S.A. and Consórcio Salto Na tal Energética S.A.
The companies Rio Pedrinho Energética S.A. and Consórcio Salto Natal Energética S.A. required
the filing of an arbitration proceeding with the Chamber of Arbitrage of the Fundação Getúlio
Vargas, through which they plead the payment of the overdue instalment values, as well as
cancellation fines, related to the electric energy purchase and sale agreements signed with Copel
Distribuição. The arbitrage proceedings were judged to be valid and, consequently, Copel
Distribuição was sentenced to pay the claimed amounts plus the attorney’s fees. The Company
has filed for a court order at the Superior Court of Justice making the arbitration ruling void.

56
Given that both companies have identified the pledged amounts (R$ 35,913 on June 17, 2010, R$
22,823 on October 1, 2009 and R$ 11,833 on February 03, 2010), the legal directors have
continued to classify the action as representing a probable loss, highlighting that the same bank
bond letters were presented as guarantee for the amounts identified. In addition to the legal
discussion, at the end of 2011 the remaining balance of R$ 27,438 was executed and as a result a
bank account was blocked. This execution was challenged by Copel Distribuição, which is the
reason why management decided to record a financial provision for the legal claims, for the original
value of the debts monetary adjusted to June 30, 2014, which amounts to R$ 89,025. Of this
amount, R$ 26,363 has been recorded to suppliers.
The judge of the 3rd Public Finance Court ruled the amount of R$ 22,162 is outstanding, and
released the amounts of R$ 12,790 and R$ 9,372 to the enforcement creditors on 04.12.2012, via
a bank guarantee. The matter is still under consideration since it is appealed by Copel and by the
Consórcio Salto Natal.
b) Civil and administrative claims
Tradener Ltda.
Lawsuits involving Tradener Ltda, where it is reported that it signed a contract for sale of power,
with Copel on December 1, 1998 in which the plaintiff undertook to “sell” under the best conditions
to Copel, all the surplus of purchase and all the surplus of assured power with the effective prices,
quantities and conditions to be stipulated in the agreements for purchase and sale of electric
power.
Aiming at a declaration of nullity of this contract the following lawsuits were filed:
- Popular Action (case record 37879/0000 of the 1st Court of the Public Treasury of Curitiba)
- Popular Action (case record 720/2001 of the 1st Court of the Public Treasury of Curitiba)
- Popular Civil Action (case record 421/2003 of the 2nd Court of the Public Treasury of Curitiba)
- Nullifying Declaratory Action (case record 1583/2005 of the 1st Court of the Public Treasury of
Curitiba)
- Nullifying Declaratory and Condemnatory Action (case record 0000659-69.2006.8.16.0004 of the
2nd Court of the Public Treasury of Curitiba)
In the above lawsuits values were not discussed, only the validity or otherwise of the contract of
sale entered into between Tradener and Copel and of the contracts for sale of electricity in which
Tradener figured as broker. The possibility of annulment of the contracts is remote considering
decisions already handed down in some of the processes above.

57
In light of an injunction issued in case record 421/2003 of the Public Civil Action, the execution of
the contract was suspended, however, recently there was the revocation of the injunction.
Accordingly, Tradener filed the following lawsuits for collection, aiming at receiving its
commissions:
- case record 0005990-22.2012.8.16.0004 - 1st Court of the Treasury of Curitiba - In this lawsuit,
the principal amount of R$ 47,319 was considered likely as the charging of monetary restatement
in the amount of R$ 21,850 is being challenged, considering that the execution of the contract was
suspended by an injunction and therefore this adjustment would not be charged, and it is classified
as possible.
- case record 05550-26.2012.8.16.0004 - 4th Court of the Treasury of Curitiba - In this lawsuit, the
principal amount of R$ 23,792 was considered likely as the charging of monetary restatement in
the amount of R$ 18,108 is being challenged, considering that the execution of the contract was
suspended by an injunction and therefore this adjustment would not be charged, and it is classified
as possible.
c) Easements, condemnation and real estate
Ivaí Engenharia de Obras S.A.
In a lawsuit filed before the 1st Fiscal Court of Curitiba, Ivaí Engenharia de Obras S.A. won the
right to receive credits from Copel Geração e Transmissão in connection with the execution of
contract D-01, which comprised the Jordão River diversion works. These credits were a
compensation for a supposed economic and financial imbalance in the contract. Based on this
ruling, Ivaí filed a separate collection lawsuit before the 4th Fiscal Court of Curitiba and obtained a
ruling ordering Copel to pay the amount of R$ 180,917, as of October 31, 2005, plus restatement
by the average between the INPC and IGP-DI inflation indicators, delinquent interest of 1% a
month, and 3.2% as legal fees.
The appeal claim, currently in progress in the Superior Court of Justice (Superior Tribunal de
Justiça or STJ), covers the absence of economic and financial imbalance in the contract, as well as
the nullity of the calculation performed by the judicial expert, who used wrong parameters to obtain
the value of condemnation, causing interest rates to be applied in duplicity (Selic rate + interest
rate). Although the Justice Court has dismissed the duplicity in the incidence of interest from the
elaboration of the expert report, it did not examine the appeal reasoning that showed that the
calculation contained within the expert report was wrong.
In June 2013 the writ of certiorari number 1.096.906 was granted and the decision was unfavorable
to Copel

58
Until the conclusion of judgment and in view of the unfavourable vote and of the analysis of
previous decisions ruled by the other Ministers that participated in the trial, the Company’s senior
management, proceeded to a detailed review of the process course over the last months of 2011
and decided to remeasure the value to be provisioned, from R$ 125,000, which represented the
original value of the debt in question, adjusted with legal interest and restated by inflation indexes,
to R$ 334,745.
The accumulation of interest, in this case, Selic interest rate plus interest on arrears is a situation
rejected by the Judiciary Power, and it was already denied by the Supreme Justice Court (STJ) in
numerous precedents. For this reason, it is also an appropriate approach to consider as a possible
risk the loss of the difference in the value deemed as probable and the eventual total value of the
condemnation, which is R$ 277,727, as of June 30, 2014.
Provisional enforcement was filed by Ivaí, so Copel filed a preliminary injunction before the STJ
which was awarded by Judge Castro Meira, thereby staying said enforcement. After the Special
Appeal had been heard for the collection proceedings, Ivaí requested the injunction be overturned,
which was contested by Copel, meaning the stay would remain until final judgment of the
subsequent appeals. The STJ ruled the case had lost its grounds, meaning Copel filed a special
appeal, which was rejected. Copel's motion for clarification is now pending judgment. vaí has
resumed the demand for temporary court enforcement of the debt, Copel challenged Ivaí's claims
and according to a decision published on February 28, 2014, the judge found the challenge to have
no grounds and established a period of 30 days for the defendant to deposit the full execution
amount of R$ 538,209, in other words, by March 28, 2014.
Considering this decision made on the temporary execution proceedings, Copel did not make a
court deposit, but on March 10, 2014 filed interlocutory appeal 1199139-2 with the state of
Paraná's Court of Appeals (TJ-PR). On March 21, 2014, the reporting judge's preliminary decision
on the appeal was published ordering a suspension of the enforcement of the lower court judgment
and of execution proceedings until the interlocutory appeal filed by Copel is judged on its merits by
the state of Paraná's Court of Appeals.
Copel is currently waiting for a decision on the motion filed with the Superior Court of Justice for
clarification of the judgment with respect to the difference of amounts arising from the application of
the SELIC (Central Bank overnight rate) for inflation adjustment purposes plus the late payment
interest applied under the expert report. The temporary execution is suspended for the time being
on account of the decision favorable to Copel obtained as a preliminary decision on the
interlocutory appeal filed with the state of Paraná's Court of Appeals before a judgment on the
merits of the appeal is passed.

59
28.1.3 Regulatory claims
The Company is disputing, both administratively and judicially, notifications issued by the
regulatory agency in connection with supposed regulatory violations, including the charge of
R$ 40,425 in lawsuits involving Companhia Estadual de Energia Elétrica - CEEE and Dona
Francisca Energética S.A., in which Aneel Ruling no. 288/2002 is being disputed. The probable
success in these lawsuits will result in changes in CCEE (Spot Market) accounting, which would
require the recording of a provision for these amounts, since Copel would be required to pay off the
amounts due.
28.2 Main lawsuits with losses deemed as possible
Consolidated 06.30.2014 12.31.2013
Tax (28.2.1) 1,435,120 1,384,115
Labor 484,688 342,887
Employee benefits 101,617 97,979 Civil (28.2.2) 751,202 1,006,786
Regulatory 61,187 56,193
2,833,814 2,887,960
Detailing the main claims
28.2.1 Tax claims
a) Administrative Proceeding 11453.720001/2011-23
Deriving from the Tax for Social Security Financing (Cofins) Cancelation Action
2000.04.01.100266.9, refers to Cofins interest and fine for the period 95/96, and, owing to strong
arguments presented for the defense of these charges, its classification has been assessed as
possible. This debt's principal, however, was assessed as probable and is the subject matter of
discussion in the Tax Foreclosure 5015930-53.2010.404.7000 filed by the Union, in progress at the
2nd. Federal Circuit Court, appealed by Copel (case records of appeal lodged against Foreclosure
5022933-59.2012.404.7000). Administrative Proceeding 10980720458/2011-15 also arising from
2000.04.01.100266.9 regarding Cofins, in the total amount of R$ 802,061, as of June 30, 2014.
Additional information on this action has been described in Item 28.1.1.
b) Fiscal Notification of Debt Record – NFLD no. 35 .273.870-7
Fiscal requirements according with approximate value of R$ 181,014 on June 30, 2014, authored
by the National Institute of Social Security – INSS, against Copel, and related to the fiscal
execution of social contribution; and
c) NFLD no. 35.273.876-6
Fiscal requirements with approximate value of R$ 48,259 on June 30, 2014, authored by the INSS,
against Copel, and related to the fiscal execution of social contribution levied upon labor transfer.

60
28.2.2 Civil claim
a) Mineradora Tibagiana Ltda.
Indemnification lawsuit no. 166-53.2011.8.16.0122, whose defendant is the Consórcio Energético
Cruzeiro do Sul – CECS, which Copel Geração e Transmissão detains 51%. The author claims
being the owner of a mining decree issued by the National Department of Mineral Production –
DNPM, and defends that with the mining decree, it is the legitimate holder of ownership and control
of the area around Tibagi River. The indemnification claimed refers to alleged losses in the
Company’s mining operations due to the construction work of the Mauá Hydroelectric Power Plant.
In the course of the proceeding Mineradora Tibagiana partially withdrew its initial petition, which led
to a new initial indemnification amount of R$ 97,048, restated on June 30, 2014 and classified as
possible.
b) Ivaí Engenharia de Obras S.A.
Lawsuit which consists on the claim for compensation for an alleged imbalance in the financial
economical equation in the contract signed with Copel. The Company’s senior management
classified as a risk of possible loss for this lawsuit the value of R$ 277,727 on June 30, 2014.
Additional information of this process is described in Note no. 28.1.2-c.
c) Franchise contracts for Copel branches/stores
Filing of 5 individual claims as a result of the 5 franchise contracts for Copel branches/stores, with
the main petition claiming an extension of the term of the contract and secondary petition to
recognize the existence of a subconcession, with transfer of the services provided and full pass-
through of the fees, amongst other amounts.
In the case filed regarding the franchise of the Faxinal branch, the judge of the 4th Federal Court of
Curitiba deemed the secondary petition to have grounds. Copel appealed against the award of the
Federal Regional Court of Region 4 - TRF4, which was ruled in favor of the Company in full on July
25, 2012. The plaintiff filed a special and extraordinary appeal, which was entertained by TRF4.
Company Management rated the amount of R$ 8,613 as a possible risk (corresponding to O&M
and restated commercial charges). This plaintiff also filed a complaint before the STF, the
entertainment of which was denied by Judge Marco Aurélio de Mello. The plaintiff filed a special
appeal against the decision, which was denied, and then filed a motion for clarification, which is
pending judgment.
In the case filed regarding the franchise of the São José dos Pinhais, branch, the judge of the 4th
Federal Court of Curitiba deemed the secondary petition to have grounds. Copel filed a motion for
clarification, which is pending judgment. Company management rated the case as a possible risk
of defeat, amounting to R$ 22,943 (corresponding to O&M and restated commercial charges).

61
29 Equity
29.1 Equity attributable to Parent Company
29.1.1 Capital
Copel’s paid-in share capital was R$ 6,910,000. The different classes of shares (with no par value)
and main shareholders are detailed below:
Number of shares in units
Shareholders in share % in share % in share % in share %
State of Paraná 85,028,598 58.63 - - 13,639 0.01 85,042,237 31.08
BNDESPAR 38,298,775 26.41 - - 27,282,006 21.27 65,580,781 23.96 Eletrobrás 1,530,774 1.06 - - - - 1,530,774 0.56
Free Float:
BM&FBOVESPA (a) 19,489,581 13.44 129,427 33.93 64,362,111 50.19 83,981,119 30.69 NYSE (b) 387,112 0.27 - - 36,473,106 28.44 36,860,218 13.47
Latibex (c) - - - - 69,149 0.05 69,149 0.03
Municipalities 178,393 0.12 9,326 2.44 3,471 - 191,190 0.07
Other shareholders 117,847 0.07 242,756 63.63 39,304 0.04 399,907 0.14
145,031,080 100.00 381,509 100.00 128,242,786 100.00 273,655,375 100.00
(a) São Paulo Stock, Commodities, and Futures Exchange
(b) New York Stock Exchange (c) Latin American Exchange in Euros, related to the Madrid Exchange
Common Classe A Preferred Classe B Preferred Total
The market value of Company stock as of June 30, 2014, is shown below:
Number of shares in units Market Value
Common shares 145,031,080 3,408,120
Class "A" preferred shares 381,509 11,445
Class "B" preferred shares 128,242,786 4,339,020
273,655,375 7,758,585
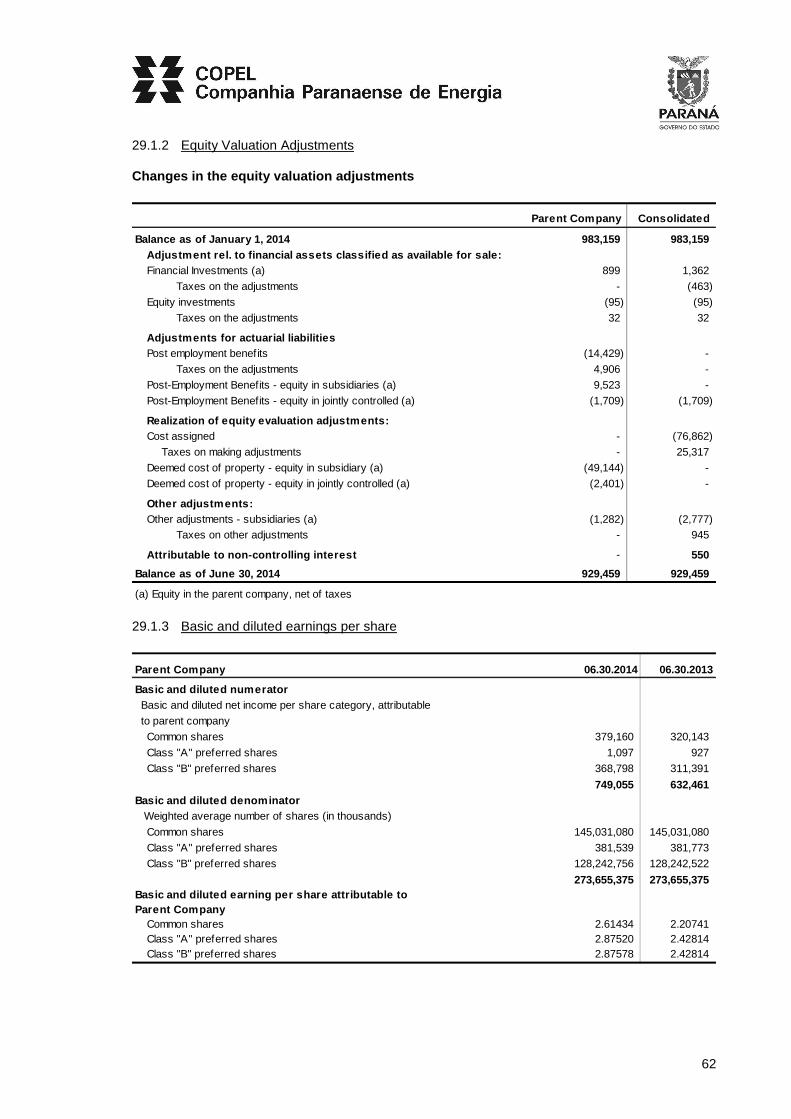
62
29.1.2 Equity Valuation Adjustments
Changes in the equity valuation adjustments
Parent Company Consolidated
Balance as of January 1, 2014 983,159 983,159 Adjustment rel. to financial assets classified as a vailable for sale:Financial Investments (a) 899 1,362
Taxes on the adjustments - (463)
Equity investments (95) (95)
Taxes on the adjustments 32 32
Adjustments for actuarial liabilitiesPost employment benefits (14,429) -
Taxes on the adjustments 4,906 -
Post-Employment Benefits - equity in subsidiaries (a) 9,523 -
Post-Employment Benefits - equity in jointly controlled (a) (1,709) (1,709)
Realization of equity evaluation adjustments:Cost assigned - (76,862)
Taxes on making adjustments - 25,317
Deemed cost of property - equity in subsidiary (a) (49,144) -
Deemed cost of property - equity in jointly controlled (a) (2,401) -
Other adjustments:Other adjustments - subsidiaries (a) (1,282) (2,777)
Taxes on other adjustments - 945
Attributable to non-controlling interest - 550
Balance as of June 30, 2014 929,459 929,459
(a) Equity in the parent company, net of taxes
29.1.3 Basic and diluted earnings per share
Parent Company 06.30.2014 06.30.2013
Basic and diluted numerator Basic and diluted net income per share category, attributable
to parent company
Common shares 379,160 320,143
Class "A" preferred shares 1,097 927
Class "B" preferred shares 368,798 311,391
749,055 632,461 Basic and diluted denominator Weighted average number of shares (in thousands)
Common shares 145,031,080 145,031,080
Class "A" preferred shares 381,539 381,773
Class "B" preferred shares 128,242,756 128,242,522
273,655,375 273,655,375 Basic and diluted earning per share attributable toParent Company
Common shares 2.61434 2.20741 Class "A" preferred shares 2.87520 2.42814 Class "B" preferred shares 2.87578 2.42814

63
29.2 Change in equity attributable to non-control ling interest
Percentage of share capital Compagás: 49% Elejor: 3 0% UEG Araucária: 20% Consolidated
Balance as of January 1, 2014 115,457 21,606 140,350 277,413 Dividends (155) - - (155)
Equity valuation adjustment - (550) - (550)
Results for the period 23,542 9,740 48,969 82,251
Balance as of June 30, 2014 138,844 30,796 189,319 358,959
30 Operating Revenues
Consolidated Gross PIS/Pasep Regulatory Service tax Net revenuesrevenues & Cofins taxes ICMS (VAT) charges (30.5) (ISSQ N ) 06.30.2014
Electricity sales to f inal customers (30.1) 2,785,649 (240,324) (681,586) (20,598) - 1,843,141
Electricity sales to distributors (30.2) 2,540,587 (216,207) - (43,558) - 2,280,822
Use of the main distribution and transmission grid (30.3) 1,734,424 (163,345) (433,990) (75,781) - 1,061,308
Construction revenues 626,559 - - - - 626,559
Revenues from telecommunications 102,788 (4,924) (18,373) - (199) 79,292
Distribution of piped gas 221,854 18,238 (54,627) - - 185,465
Other operating revenues (30.4) 123,136 (29,992) - - (485) 92,659
(636,554) (1,188,576) (139,937) (684) 6,169,246 8,134,997
Consolidated Net revenuesGross PIS/Pasep Regulatory Service tax 04.01.2014
revenues & Cofins taxes ICMS (VAT) charges (30.5) (ISSQ N ) to 06.30.2014
Electricity sales to f inal customers (30.1) 1,378,937 (117,343) (330,834) (10,329) - 920,431
Electricity sales to distributors (30.2) 1,307,028 (112,103) - (22,029) - 1,172,896
Use of the main distribution and transmission grid (30.3) 835,203 (78,741) (210,136) (42,942) - 503,384
Construction revenues 336,711 - - - - 336,711
Revenues from telecommunications 51,901 (2,497) (9,260) - (104) 40,040
Distribution of piped gas 119,142 27,669 (42,207) - - 104,604
Other operating revenues (30.4) 56,543 (16,308) - - (127) 40,108
(299,323) (592,437) (75,300) (231) 3,118,174 4,085,465
Consolidated Gross PIS/Pasep Regulatory Service tax Net revenuesrevenues & Cofins taxes ICMS (VAT) charges (30.5) (ISSQ N ) 06.30.2013
Electricity sales to f inal customers (30.1) 2,395,418 (210,038) (608,591) (20,015) - 1,556,774
Electricity sales to distributors (30.2) 1,209,393 (98,350) - (41,351) - 1,069,692
Use of the main distribution and transmission grid (30.3) 1,627,931 (153,713) (423,470) (73,345) - 977,403
Construction revenues 459,685 - - - - 459,685
Revenues from telecommunications 87,634 (4,646) (16,466) - (230) 66,292
Distribution of piped gas 222,892 (20,488) (26,776) - - 175,628
Other operating revenues (30.4) 207,221 (30,292) - - (861) 176,068
(517,527) (1,075,303) (134,711) (1,091) 4,481,542 6,210,174
Consolidated Net revenuesGross PIS/Pasep Regulatory Service tax 04.01.2013
revenues & Cofins taxes ICMS (VAT) charges (30.5) (ISSQ N ) to 06.30.2013
Electricity sales to f inal customers (30.1) 1,199,068 (104,397) (298,932) (10,160) - 785,579
Electricity sales to distributors (30.2) 404,936 (41,096) - (18,915) - 344,925
Use of the main distribution and transmission grid (30.3) 752,018 (70,215) (190,579) (26,821) - 464,403
Construction revenues 278,494 - - - - 278,494
Revenues from telecommunications 44,377 (2,343) (8,394) - (50) 33,590
Distribution of piped gas 122,201 (11,236) (14,558) - - 96,407
Other operating revenues (30.4) 114,734 (16,485) - - (515) 97,734
(245,772) (512,463) (55,896) (565) 2,101,132 2,915,828

64
30.1 Electric sales to final customers by catego ry
Consolidated Gross income Net income
06.30.2014 06.30.2013 06.30.2014 06.30.2013
Residential 923,639 746,911 628,099 494,969 Industrial 999,419 918,116 652,592 590,381
Commercial, services and other activities 569,301 484,214 349,026 293,590
Rural 113,595 92,794 97,023 78,779
Public agencies 62,367 53,663 44,143 37,770
Public lighting 53,679 44,355 33,068 27,466 Public services 63,649 55,365 39,190 33,819
2,785,649 2,395,418 1,843,141 1,556,774
Consolidated Gross income Net income
04.01.2014 04.01.2013 04.01.2014 04.01.2013
to 06.30.2014 to 06.30.2013 to 06.30.2014 to 06.30 .2013
Residential 460,242 373,415 318,608 251,490
Industrial 513,618 480,921 338,405 311,904
Commercial, services and other activities 265,247 227,195 162,177 137,811
Rural 50,718 40,961 43,194 34,696
Public agencies 31,081 27,350 22,068 19,380
Public lighting 27,073 22,305 16,928 13,812 Public services 30,958 26,921 19,051 16,486
1,378,937 1,199,068 920,431 785,579
30.2 Eletric sales to distributors
Consolidated Gross income
06.30.2014 06.30.2013
Electric Energy Trading Chamber - CCEE 1,615,300 382,920
Bilateral contracts 574,746 403,453
Agreements for Pow er Trade on the Regulated Market - CCEAR (auction) 350,433 423,020
Quota system 108 -
2,540,587 1,209,393
Consolidated Gross income
04.01.2014 04.01.2013
to 06.30.2014 to 06.30.2013
Electric Energy Trading Chamber - CCEE 864,372 (20,846)
Bilateral contracts 272,603 199,279
Agreements for Pow er Trade on the Regulated Market - CCEAR (auction) 169,945 226,503
Quota system 108 -
1,307,028 404,936

65
30.3 Use of the main distribution and transmissio n grid
Consolidated Gross income Net income
06.30.2014 06.30.2013 06.30.2014 06.30.2013
Residential 649,592 607,581 376,657 347,538
Industrial 322,238 308,286 181,735 166,038
Commercial, services and other activities 405,499 375,710 234,612 215,715
Rural 93,014 84,831 75,345 68,641
Public agencies 49,771 47,419 33,121 31,388
Public lighting 45,391 42,302 26,468 24,372
Public services 30,473 29,591 17,575 16,800
Free consumers 68,525 72,333 59,032 62,426
Basic Netw ork, BN connections, and connection grid 494 599 425 518
Operation and maintenance (O&M) revenues 46,678 44,145 36,556 31,457
Effective interest revenues 22,749 15,134 19,782 12,510
1,734,424 1,627,931 1,061,308 977,403
Consolidated Gross income Net income
04.01.2014 04.01.2013 04.01.2014 04.01.2013
to 06.30.2014 to 06.30.2013 to 06.30.2014 to 06.30 .2013
Residential 310,856 281,195 178,609 164,838
Industrial 162,037 149,458 89,326 85,250
Commercial, services and other activities 189,646 168,804 107,597 99,139
Rural 41,591 35,896 33,146 29,280
Public agencies 25,022 23,428 16,512 15,858
Public lighting 23,387 20,429 13,401 11,914
Public services 14,538 13,328 8,246 7,779
Free consumers 34,859 30,513 29,788 26,598
Basic Netw ork, BN connections, and connection grid 239 230 203 201
Operation and maintenance (O&M) revenues 22,624 21,480 17,557 17,165
Effective interest revenues 10,404 7,257 8,999 6,381
835,203 752,018 503,384 464,403
30.4 Other operating revenues
Consolidated Gross income
06.30.2014 06.30.2013
Reimbursement for unavailability of energy 58,081 45,437
Leases and rents (Note 30.4.1) 49,000 108,051
Revenues from services 10,854 33,935
Charged service 3,869 4,852
Other revenues 1,332 14,946
123,136 207,221
Consolidated Gross income
04.01.2014 04.01.2013
to 06.30.2014 to 06.30.2013
Reimbursement for unavailability of energy 33,225 24,322
Leases and rents (Note 30.4.1) 18,516 52,721
Revenues from services 2,239 20,484
Charged service 2,051 2,636 Other revenues 512 14,571
56,543 114,734

66
30.4.1 Revenue from leases and rentals
Consolidated 06.30.2014 06.30.2013
Equipment and facilities 42,653 39,020
Araucária Thermal Pow er Plant (a) 5,507 68,423
Facilities sharing 725 308
Real estate 115 300
49,000 108,051
Consolidated 04.01.2014 04.01.2013 to 06.30.2014 to 06.30.2013
Equipment and facilities 21,657 20,948
Araucária Thermal Pow er Plant (a) (3,391) 31,527
Facilities sharing 242 91
Real estate 8 155
18,516 52,721
The Company has not identified any operating lease receivables which are non cancellable.
a) TPP Araucária
In December 2006, UEG Araucária entered into an agreement for the lease of a power plant with
Petróleo Brasileiro S.A. - Petrobras, which in turn entered into an operations and maintenance
agreement with our subsidiary, Copel Geração e Transmissão, whereby the latter operated and
maintained the power plant. Both agreements expired on January 31, 2014. Therefore, as from
February 1, 2014, UEG Araucária is responsible for selling the electricity produced by TPP
Araucária. This electricity is not sold under long-term agreements, but distributed in the spot
market, as established by the National Electric System Operator (ONS).
30.5 Regulatory Charges
Consolidated 06.30.2014 06.30.2013
Research and Development and Energy Eff iciency Programs - R&D and EEP 54,342 39,569
Energy Development Account (CDE) 60,905 40,627
Global Reversal Reserve (RGR) 24,690 36,707
Fuel Consumptuon Account (CCC) - 17,808
139,937 134,711
Consolidated 04.01.2014 04.01.2013 to 06.30.2014 to 06.30.2013
Research and Development and Energy Eff iciency Programs - R&D and EEP 27,148 17,771
Energy Development Account (CDE) 35,807 19,643
Global Reversal Reserve (RGR) 12,345 18,482
Fuel Consumptuon Account (CCC) - -
75,300 55,896
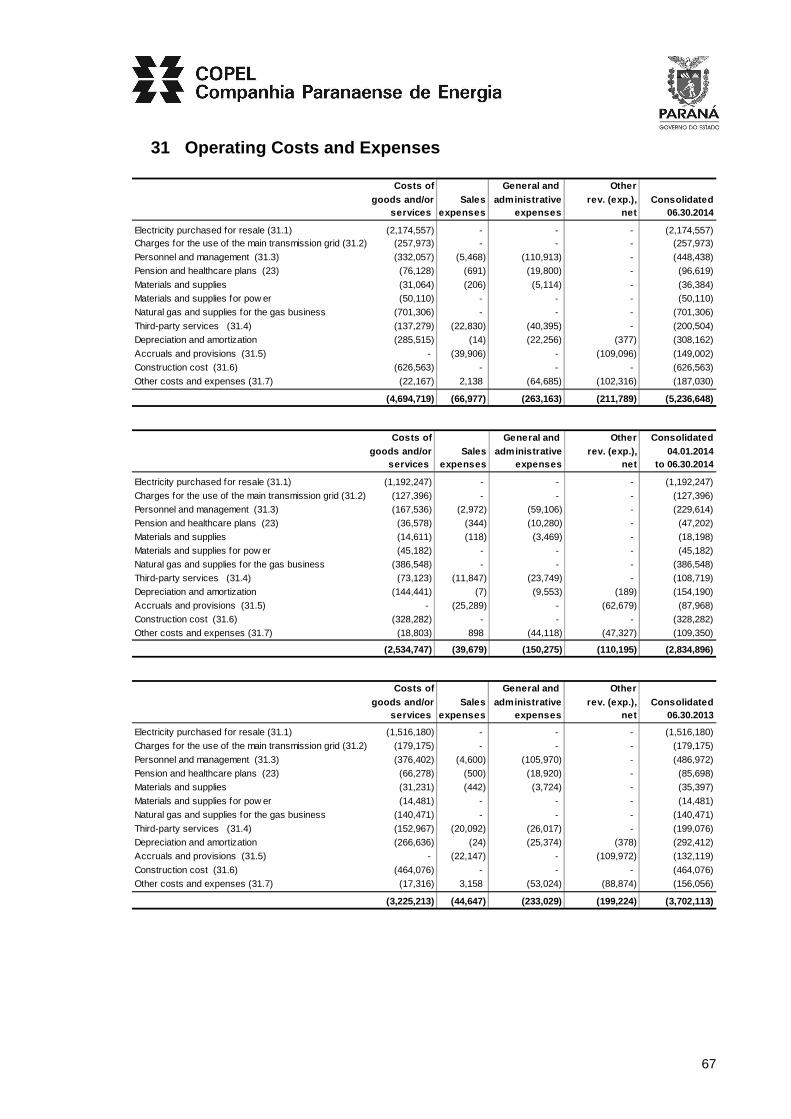
67
31 Operating Costs and Expenses
Costs of General and Othergoods and/or Sales administrative rev. (exp.), Consolid ated
services expenses expenses net 06.30.2014
Electricity purchased for resale (31.1) (2,174,557) - - - (2,174,557) Charges for the use of the main transmission grid (31.2) (257,973) - - - (257,973)
Personnel and management (31.3) (332,057) (5,468) (110,913) - (448,438)
Pension and healthcare plans (23) (76,128) (691) (19,800) - (96,619)
Materials and supplies (31,064) (206) (5,114) - (36,384)
Materials and supplies for pow er (50,110) - - - (50,110)
Natural gas and supplies for the gas business (701,306) - - - (701,306)
Third-party services (31.4) (137,279) (22,830) (40,395) - (200,504)
Depreciation and amortization (285,515) (14) (22,256) (377) (308,162)
Accruals and provisions (31.5) - (39,906) - (109,096) (149,002)
Construction cost (31.6) (626,563) - - - (626,563)
Other costs and expenses (31.7) (22,167) 2,138 (64,685) (102,316) (187,030)
(4,694,719) (66,977) (263,163) (211,789) (5,236,648)
Costs of General and Other Consolidatedgoods and/or Sales administrative rev. (exp.), 04.01.20 14
services expenses expenses net to 06.30.2014
Electricity purchased for resale (31.1) (1,192,247) - - - (1,192,247)
Charges for the use of the main transmission grid (31.2) (127,396) - - - (127,396)
Personnel and management (31.3) (167,536) (2,972) (59,106) - (229,614)
Pension and healthcare plans (23) (36,578) (344) (10,280) - (47,202)
Materials and supplies (14,611) (118) (3,469) - (18,198)
Materials and supplies for pow er (45,182) - - - (45,182)
Natural gas and supplies for the gas business (386,548) - - - (386,548)
Third-party services (31.4) (73,123) (11,847) (23,749) - (108,719)
Depreciation and amortization (144,441) (7) (9,553) (189) (154,190)
Accruals and provisions (31.5) - (25,289) - (62,679) (87,968)
Construction cost (31.6) (328,282) - - - (328,282)
Other costs and expenses (31.7) (18,803) 898 (44,118) (47,327) (109,350)
(2,534,747) (39,679) (150,275) (110,195) (2,834,896)
Costs of General and Othergoods and/or Sales administrative rev. (exp.), Consolid ated
services expenses expenses net 06.30.2013
Electricity purchased for resale (31.1) (1,516,180) - - - (1,516,180)
Charges for the use of the main transmission grid (31.2) (179,175) - - - (179,175)
Personnel and management (31.3) (376,402) (4,600) (105,970) - (486,972)
Pension and healthcare plans (23) (66,278) (500) (18,920) - (85,698)
Materials and supplies (31,231) (442) (3,724) - (35,397)
Materials and supplies for pow er (14,481) - - - (14,481)
Natural gas and supplies for the gas business (140,471) - - - (140,471)
Third-party services (31.4) (152,967) (20,092) (26,017) - (199,076)
Depreciation and amortization (266,636) (24) (25,374) (378) (292,412)
Accruals and provisions (31.5) - (22,147) - (109,972) (132,119)
Construction cost (31.6) (464,076) - - - (464,076)
Other costs and expenses (31.7) (17,316) 3,158 (53,024) (88,874) (156,056)
(3,225,213) (44,647) (233,029) (199,224) (3,702,113)

68
Costs of General and Other Consolidatedgoods and/or Sales administrative rev. (exp.), 04.01.20 13
services expenses expenses net to 06.30.2013
Electricity purchased for resale (31.1) (674,478) - - - (674,478)
Charges for the use of the main transmission grid (31.2) (27,098) - - - (27,098)
Personnel and management (31.3) (187,176) (2,367) (55,930) - (245,473)
Pension and healthcare plans (23) (33,770) (232) (9,562) - (43,564)
Materials and supplies (15,262) (323) (1,932) - (17,517)
Materials and supplies for pow er (10,220) - - - (10,220)
Natural gas and supplies for the gas business (78,160) - - - (78,160)
Third-party services (31.4) (80,067) (10,209) (17,413) - (107,689)
Depreciation and amortization (133,050) (12) (12,321) (188) (145,571)
Accruals and provisions (31.5) - (9,048) - (103,535) (112,583)
Construction cost (31.6) (269,278) - - - (269,278)
Other costs and expenses (31.7) (10,073) 1,612 (32,514) (47,556) (88,531)
(1,518,632) (20,579) (129,672) (151,279) (1,820,162)
General and OtherNature of costs and expenses administrative rev. (ex p.), Parent Company
expenses net 06.30.2014
Personnel and management (31.3) (46,741) - (46,741)
Pension and healthcare plans (23) (5,830) - (5,830)
Materials and supplies (164) - (164)
Third-party services (2,476) - (2,476)
Depreciation and amortization - (377) (377)
Accruals and provisions (31.5) - (1,716) (1,716)
Other operating expenses (4,649) 112 (4,537)
(59,860) (1,981) (61,841)
General and Other Parent Company Nature of costs and expenses administrative rev. (ex p.), 04.01.2014
expenses net to 06.30.2014
Personnel and management (31.3) (24,373) - (24,373)
Pension and healthcare plans (23) (3,350) - (3,350)
Materials and supplies (123) - (123)
Third-party services (1,759) - (1,759)
Depreciation and amortization - (189) (189)
Accruals and provisions (31.5) - (1,344) (1,344)
Other operating expenses (3,323) 39 (3,284)
(32,928) (1,494) (34,422)
General and OtherNature of costs and expenses administrative rev. (ex p.), Parent Company
expenses net 06.30.2013
Management (31.3) (5,157) - (5,157)
Pension and healthcare plans (23) (351) - (351)
Materials and supplies (1) - (1)
Third-party services (2,579) - (2,579)
Depreciation and amortization - (377) (377)
Accruals and provisions (31.5) - 14,468 14,468
Other operating expenses (11,517) 259 (11,258)
(19,605) 14,350 (5,255)

69
General and Other Parent Company Nature of costs and expenses administrative rev. (ex p.), 04.01.2013
expenses net to 06.30.2013
Management (31.3) (3,021) - (3,021)
Pension and healthcare plans (23) (236) - (236)
Materials and supplies (1) - (1)
Third-party services (1,993) - (1,993)
Depreciation and amortization - (187) (187)
Accruals and provisions (31.5) - (8,520) (8,520)
Other operating expenses (9,032) 90 (8,942)
(14,283) (8,617) (22,900)
31.1 Electricity purchased for resale
Consolidated 06.30.2014 06.30.2013
Contracts for the Sale of Energy in the Regulated Environment - CCEAR 1,498,381 1,118,815
Electric Energy Trading Chamber - CCEE 1,378,387 356,867
(-) Transfer CDE and ACR Account - Decrees 8,221/2014 and 7,945/2013 (1,062,001) (274,130)
Itaipu Binational 354,745 285,154
Bilateral contracts 116,259 106,038
Program for incentive to alternative energy sources - Proinfa 91,429 83,387
(-) PIS/Pasep/Cofins taxes on electricity purchased for resale (202,643) (159,951)
2,174,557 1,516,180
Consolidated 04.01.2014 04.01.2013 to 06.30.2014 to 06.30.2013
Contracts for the Sale of Energy in the Regulated Environment - CCEAR 878,078 586,310
Electric Energy Trading Chamber - CCEE 382,544 107,449
(-) Transfer CDE and ACR Account - Decrees 8,221/2014 and 7,945/2013 (230,230) (180,525)
Itaipu Binational 172,480 153,420
Bilateral contracts 56,097 48,980
Program for incentive to alternative energy sources - Proinfa 45,429 41,714
(-) PIS/Pasep/Cofins taxes on electricity purchased for resale (112,151) (82,870)
1,192,247 674,478
31.2 Charges for the use of the main transmission grid
Consolidated 06.30.2014 06.30.2013
System usage charges – distribution 125,746 108,272
System usage charges – basic netw ork and connection 89,157 85,016
System Service Charges - ESS 35,658 285,566
(-) Transfer CDE - ESS - Decree 7,945 / 2013 - (318,903)
Itaipu transportation charges 29,947 24,940
Charge reserve energy - EER 4,554 13,683
(-) PIS/Pasep/Cofins taxes on charges for use of pow er grid (27,089) (19,399)
257,973 179,175

70
Consolidated 04.01.2014 04.01.2013 to 06.30.2014 to 06.30.2013
System usage charges – distribution 60,609 53,312
System usage charges – basic netw ork and connection 45,046 43,206
System Service Charges - ESS 15,523 111,318
(-) Transfer CDE - ESS - Decree 7,945 / 2013 - (199,945)
Itaipu transportation charges 15,027 12,538
Charge reserve energy - EER 4,554 10,524
(-) PIS/Pasep/Cofins taxes on charges for use of pow er grid (13,363) (3,855)
127,396 27,098
31.3 Personnel and Management Expenses
. Parent Company Consolidated 06.30.2014 06.30.2013 06.30.2014 06.30.2013
Personnel Wages and salaries 27,998 - 275,910 313,692
Social charges on payroll 10,285 - 99,188 108,453
Meal assistance and education allow ance 2,983 - 38,917 41,622
Provisions for profit sharing 1,527 - 22,876 16,019
Compensation - Voluntary termination Program/retirement 197 - 2,185 (528)
42,990 - 439,076 479,258 Management
Wages and salaries 2,786 3,883 7,174 5,933 Social charges on payroll 729 1,226 1,841 1,712 Other expenses 236 48 347 69
3,751 5,157 9,362 7,714
46,741 5,157 448,438 486,972
. Parent Company Consolidated
04.01.2014 04.01.2013 04.01.2014 04.01.2013 to 06.30.2014 to 06.30.2013 to 06.30.2014 to 06.30 .2013
PessoalWages and salaries 14,620 - 141,795 155,901
Social charges on payroll 5,333 - 52,292 55,077
Meal assistance and education allow ance 2,045 - 25,312 33,651
Provisions for profit sharing 41 - 3,313 (4,896)
Compensation - Voluntary termination Program/retirement 197 - 1,458 1,178
22,236 - 224,170 240,911 Management
Wages and salaries 1,644 2,381 4,193 3,615 Social charges on payroll 436 619 1,107 916 Other expenses 57 21 144 31
2,137 3,021 5,444 4,562
24,373 3,021 229,614 245,473

71
31.4 Third-party services
Consolidated 06.30.2014 06.30.2013
Maintenance of facilities 45,403 36,195
Maintenance of electrical system 43,848 49,642
Communication, processing and transmission of data 27,286 24,222
Authorized and registered agents 18,279 16,680
Meter reading and bill delivery 17,537 18,791
Consulting and audit 5,758 10,336
(-) PIS/Pasep/Cofins taxes on services from third-parties (1,889) (3,076)
Other services 44,282 46,286
200,504 199,076
04.01.2014 04.01.2013Consolidated to 06.30.2014 to 06.30.2013
Maintenance of facilities 22,972 18,837
Maintenance of electrical system 28,213 27,584
Communication, processing and transmission of data 13,998 11,774
Authorized and registered agents 9,140 8,315
Meter reading and bill delivery 8,849 9,123
Consulting and audit 1,816 5,596
(-) PIS/Pasep/Cofins taxes on services from third-parties (987) (1,766)
Other services 24,718 28,226
108,719 107,689
31.5 Accruals and provisions
. Parent Company Consolidated 06.30.2014 06.30.2013 06.30.2014 06.30.2013
Provisions for doubtful accounts - - 39,907 22,147 .
Provisions (reversals) for losses on taxes recovera ble - - 817 (231)
Reserve (reversals) for risksTax 1,146 4,887 2,014 3,280
Labor 242 - 32,700 29,790
Employee benefits - - 12,509 57,177
Civil 328 (19,355) 60,183 19,967
Environmental - - 19 -
Regulatory - - 853 (11)
1,716 (14,468) 108,278 110,203
1,716 (14,468) 149,002 132,119

72
. Parent Company Consolidated 04.01.2014 04.01.2013 04.01.2014 04.01.2013
to 06.30.2014 to 06.30.2013 to 06.30.2014 to 06.30 .2013
Provisions for doubtful accounts - - 25,290 9,047 .
Provisions (reversals) for losses on taxes recovera ble - - 597 302
Reserve (reversals) for risksTax 1,070 11,548 1,411 9,567
Labor 242 - 24,436 19,495
Employee benefits - - 4,105 57,177
Civil 32 (3,028) 32,031 17,033
Environmental - - 10 (11)
Regulatory - - 88 (27)
1,344 8,520 62,081 103,234
1,344 8,520 87,968 112,583
31.6 Construction cost
Consolidated 06.30.2014 06.30.2013
Materials and supplies 345,883 216,162
Third-party services 190,726 164,065
Personnel and management 62,438 46,883
Others 27,516 36,966
626,563 464,076
Consolidated 04.01.2014 04.01.2013 to 06.30.2014 to 06.30.2013
Materials and supplies 179,843 123,216
Third-party services 98,841 89,859
Personnel and management 32,848 28,167
Others 16,750 28,036
328,282 269,278
31.7 Other costs and expenses
Consolidated 06.30.2014 06.30.2013
Financial compensation for use of w ater resources 67,714 55,930
Taxes 38,748 15,783
Losses in the decommissioning and disposal of assets 18,545 9,484
Leases and rents (31.7.1) 15,117 15,366
ANEEL inspection fee 9,666 11,153
Advertising 7,883 13,242
Indemnities 5,860 17,398
Sports incentives, Rouanet Law and fund for the rights of children and teenagers - FIA 2,407 4,250
Recovery of costs and expenses (17,097) (24,075)
Other costs and expenses, net 38,187 37,525
187,030 156,056

73
04.01.2014 04.01.2013Consolidated to 06.30.2014 to 06.30.2013
Financial compensation for use of w ater resources 32,713 29,063
Taxes 29,854 8,500
Losses in the decommissioning and disposal of assets 6,112 5,723
Leases and rents (31.7.1) 7,485 7,621
ANEEL inspection fee 4,497 5,432
Advertising 5,187 9,607
Indemnities 3,131 10,598
Sports incentives, Rouanet Law and fund for the rights of children and teenagers - FIA 2,346 3,154
Recovery of costs and expenses (9,019) (15,486)
Other costs and expenses, net 27,044 24,319
109,350 88,531
31.7.1 Costs and expenses of leases and rents
Consolidated 06.30.2014 06.30.2013
Real estate 12,565 12,756
Photocopiers 378 420
Others 2,887 3,099
(-) Pis and Cofins tax credits (713) (909)
15,117 15,366
04.01.2014 04.01.2013Consolidated to 06.30.2014 to 06.30.2013
Real estate 6,256 5,951
Photocopiers 212 246
Others 1,371 1,878
(-) Pis and Cofins tax credits (354) (454)
7,485 7,621
Company has not identified any operating lease commitments which are non cancellable.

74
32 Financial Results
. Parent Company Consolidated 06.30.2014 06.30.2013 06.30.2014 06.30.2013
Financial incomePenalties on overdue bills - - 94,973 57,253
Interest and monetary variation of CRC transfer (Note 8) 85,679 - 85,679 68,401
Return on financial investments held for trading 7,766 497 79,333 47,124
Monetary variation of accounts receivable related to the concession - - 51,350 35,197
Monetary variation of accounts receivable related
to the concession extension (Note 10) - - 33,835 53,891
Return on financial investments held for sale 7 5 11,304 23,604
Return on financial investments held until maturity - - - 439
Interest and commissions on loan agreements - 43,588 - -
Other financial income 11,494 4,260 26,982 15,046
104,946 48,350 383,456 300,955 (-) Financial expenses Debt charges 62,479 36,487 151,812 100,177
Monetary variation of accounts payable related to
the concession - use of public property (26.1) - - 34,345 29,888
Monetary variation of CRC transfer (Note 8) 14,513 - 14,513 -
Interest on R&D and EEP (Note 25) - - 10,295 6,528
Other monetary and exchange variations 1,474 3 3,076 8,279
PIS/Pasep/Cofins taxes on interest on capital 742 886 742 886
Other financial expenses 18 13 15,643 6,241
79,226 37,389 230,426 151,999
Net 25,720 10,961 153,030 148,956
. Parent Company Consolidated 04.01.2014 04.01.2013 04.01.2014 04.01.2013
to 06.30.2014 to 06.30.2013 to 06.30.2014 to 06.30.2013
Financial incomePenalties on overdue bills - - 54,560 30,820
Interest and monetary variation of CRC transfer (Note 8) 27,835 - 27,835 35,520
Return on f inancial investments held for trading 7,670 269 42,332 26,574
Monetary variation of accounts receivable related to the concession - - (2,020) 18,354
Monetary variation of accounts receivable related
to the concession extension (Note 10) - - 15,158 21,842
Return on f inancial investments held for sale 3 3 6,185 11,683
Return on f inancial investments held until maturity - - - 232
Interest and commissions on loan agreements - 22,835 - -
Other f inancial income 5,697 3,261 14,395 9,897
41,205 26,368 158,445 154,922 (-) Financial expenses Debt charges 36,863 19,083 80,018 52,059
Monetary variation of accounts payable related to
the concession - use of public property (26.1) - - 11,358 15,011
Monetary variation of CRC transfer (Note 8) 14,513 - 14,513 -
Interest on R&D and EEP (Note 25) - - 5,424 3,460
Other monetary and exchange variations 1,255 - (1,811) 6,357
PIS/Pasep/Cofins taxes on interest on capital 736 886 736 886
Other f inancial expenses 7 3 6,144 2,092
53,374 19,972 116,382 79,865
Net (12,169) 6,396 42,063 75,057
The costs of loans and financing capitalized during the year of 2014 amounted to R$ 59,638, at an
average rate of 7.0% p.y.

75
33 Operating Segment
The main makers of the strategic decisions of the Company and its subsidiaries, in charge of
allocating funds and assessing the performance of operational segments, are the C-level
executives of the Parent Company and of each subsidiary.
33.1 Products and services which generate revenue s for the reportable segments
The Company operates in five reportable segments identified by management, through the Chief
Executive Office and the chief offices of each business area, taking into consideration the
regulatory environments, the strategic business units, and the different products and services.
These segments are managed separately, since each business and each company requires
different technologies and strategies.
In the quarter ended June 30, 2014 all sales were made within Brazilian territory.
We have not identified any customer who individually accounts for more than 10% of total net
revenues during the six-month period ended June 30, 2014.
The Company evaluates the performance of each segment based on information derived from
accounting records.
The accounting policies of the operating segments are the same as those described in the
summary of significant accounting policies and record transactions between segments as
transactions with third-parties, i.e., at current market prices.
33.2 The Company’s reporting segments
Power generation and transmission (GeT) - this segment comprises the generation of electric
energy from hydraulic, wind, and thermal projects, the transport and transformation of the power
generated by the Company, and the construction, operation, and maintenance of all power
transmission substations and lines. This segment operates through Copel Geração e Transmissão,
Elejor, UEG Araucária, Nova Asa Branca I, Nova Asa Branca II, Nova Asa Branca III, Nova Eurus
IV, Santa Maria, Santa Helena, Ventos de Santo Uriel and Cutia Empreendimentos Eólicos;
Power distribution and sales (DIS) - this segment comprises the distribution and sale of electric
energy, the operation and maintenance of the distribution infrastructure, and related services. It
operates through Copel Distribuição;
Telecommunications (TEL) - this segment comprises telecommunications and general
communications services. It operates through Copel Telecomunicações;
Gas - this segment comprises the public service of piped natural gas distribution. It operates
through Compagás; and

76
Holding Company - this segment comprises participation in other companies. It operates through
Copel, Copel Participações and Copel Renováveis.
33.3 Assets per reporting segment
ASSETS
06.30.2014
ASSETS 13,317,982 7,766,338 514,683 490,360 15,505,476 (12,528,861) 25,065,978 CURRENT ASSETS 3,152,871 1,757,737 59,081 199,148 1,118,851 (583,165) 5,704,523 Cash and cash equivalents 1,276,071 194,065 10,793 45,932 536,676 - 2,063,537
Bonds and securities 418,590 10,710 - - 147 - 429,447
Collaterals and escrow accounts 20,542 32 - 661 - - 21,235
Trade accounts receivable 762,545 1,058,897 26,545 136,074 - (136,229) 1,847,832
Dividends receivable 1,338 - - - 450,943 (434,486) 17,795
CRC tranferred to State Government of Paraná - - - - 89,184 - 89,184
Accounts receivable related to the concession 6,258 - - - - - 6,258
Accounts receivable related to the concession extension 385,264 - - - - - 385,264
Other receivables 193,305 295,615 3,066 1,513 21,366 (12,449) 502,416
Inventories 29,063 100,014 10,318 1,120 - - 140,515
Income tax and social contribution 31,531 9,440 4,000 - 20,535 - 65,506
Other current recoverable taxes 26,153 73,826 4,279 13,624 - - 117,882
Prepaid expenses 2,210 15,138 80 224 - - 17,652
Receivable from other related parties 1 - - - - (1) -
NONCURRENT ASSETS 10,165,111 6,008,601 455,602 291,212 14,386,625 (11,945,696) 19,361,455 Long term assets 1,016,990 4,701,646 46,495 52,847 2,012,200 (137,679) 7,692,499
Bonds and securities 72,280 43,366 - - - - 115,646
Collaterals and escrow accounts - 46,337 - - - - 46,337
Trade accounts receivable 4,744 45,213 21,282 - - - 71,239
CRC tranferred to State Government of Paraná - - - - 1,276,497 - 1,276,497
Judicial deposits 49,291 377,487 4,860 279 272,759 - 704,676
Accounts receivable related to the concession 533,313 3,365,513 - - - - 3,898,826
Accounts receivable related to the concession extension 189,564 - - - - - 189,564
Advances to suppliers - - - 2,266 - - 2,266
Other noncurrent receivables 6,722 13,739 - 626 95 - 21,182
Income tax and social contribution 532 13,401 - - 177,932 - 191,865
Other noncurrent recoverable taxes 52,730 68,470 4,798 45,423 - - 171,421
Deferred Income tax and social contribution 30,506 728,120 15,555 4,056 108,850 - 887,087
Prepaid expenses - - - 197 - - 197
Receivable from other related parties 77,308 - - - 176,067 (137,679) 115,696
Investments 1,168,872 1,374 - - 12,342,413 (12,118,716) 1,393,943 Property, plant and equipment, net 7,734,611 - 394,146 - 30,073 - 8,158,830 Intangible assets 244,638 1,305,581 14,961 238,365 1,939 310,699 2,116,183
HOL Eliminations Consolidated GET DIS TEL GÁS

77
33.4 Liabilities per reporting segment
LIABILITIES
06.30.2014
TOTAL LIABILITIES 13,317,982 7,766,338 514,683 490,360 15,505,476 (12,528,861) 25,065,978 CURRENT LIABILITIES 1,847,470 1,532,937 47,328 160,866 368,850 (583,690) 3,373,761 Payroll, social charges and accruals 36,466 113,592 10,425 5,175 19,927 - 185,585
Payable from other related parties 1 - - - - (1) -
Suppliers 415,687 813,133 8,408 143,218 3,334 (148,565) 1,235,215
Income tax and social contribution 362,836 - 2,359 8,622 - - 373,817
Other taxes 33,206 171,954 3,769 1,252 747 (110) 210,818
Loans and f inancing 78,187 178,943 5,727 - 303,759 (528) 566,088
Debentures 370,823 18,455 - - 10,491 - 399,769
Dividends payable 419,881 - 14,604 1,208 3,372 (434,486) 4,579
Post-employment benefits 8,032 21,914 1,080 - 15 - 31,041
Regulatory charges 8,455 16,442 - - - - 24,897
Research and Development and Energy Eff iciency 22,118 104,419 - - - - 126,537
Accounts payable related to concession - use of public property 52,532 - - - - - 52,532
Other accounts payable 39,246 94,085 956 1,391 27,205 - 162,883
NON CURRENT LIABILITIES 3,346,681 2,937,683 85,666 46,140 1,976,818 (220,864) 8,172,124 Associated and subsidiary companies 143,695 - 16,000 - 1,326 (161,021) -
Suppliers 22,188 15,587 - - - - 37,775
Other taxes 16,888 56,868 3,227 - 516 - 77,499
Deferred income tax and social contribution 343,794 - - - - - 343,794
Loans and f inancing 1,270,768 652,402 30,205 - 684,427 (59,843) 2,577,959
Debentures 131,735 998,646 - 42,876 994,216 - 2,167,473
Post-employment benefits 298,268 622,254 31,151 2,499 17,754 - 971,926 Research and Development and Energy Eff iciency 68,974 125,931 - - - - 194,905 Accounts payable related to concession - use of public property 430,146 - - - - - 430,146 Other accounts payable 232 - - - - - 232 Provisions for contingences 619,993 465,995 5,083 765 278,579 - 1,370,415
EQUITY 8,123,831 3,295,718 381,689 283,354 13,159,808 (11,724,307) 13,520,093 Attributable to controlling interest 8,123,831 3,295,718 381,689 283,354 13,159,808 (12,083,266) 13,161,134 Capital 4,330,945 2,624,841 240,398 135,943 6,913,818 (7,335,945) 6,910,000
Advance for future investment - 153,000 - - - (153,000) -
Equity valuation adjustments 1,095,333 (150,166) (4,940) - 929,459 (940,227) 929,459
Legal reserve 301,729 135,294 9,093 18,220 624,849 (464,336) 624,849
Profit retention reserve 1,255,944 761,646 109,243 79,410 3,897,833 (2,207,981) 3,896,095
Unrealized income reserve - - - 1,738 - - 1,738
Proposed additional dividend - - - - - - -
Accumulated income (losses) 1,139,880 (228,897) 27,895 48,043 793,849 (981,777) 798,993
Attributable to non controlling interest 358,959 358,959
GET DIS TEL GÁS HOL Eliminations Consolidated

78
33.5 Statement of income per reporting segment
STATEMENT OF INCOME
06.30.2014
OPERATING REVENUES 2,819,549 3,257,428 97,542 849,364 - (854,637) 6,169,246 Electricity sales to final customers - third-parties 231,240 1,611,901 - - - - 1,843,141
Electricity sales to final customers - betw een segments - 1,073 - - - (1,073) - Electricity sales to distributors - third-parties 2,213,384 67,438 - - - - 2,280,822
Electricity sales to distributors - betw een segments 145,890 - - - - (145,890) -
Use of the main distribution and transmission grid - third-parties 56,337 1,004,971 - - - - 1,061,308 Use of the main distribution and transmission grid - betw een segments 30,908 6,196 - - - (37,104) -
Construction revenues 116,939 484,892 - 24,728 - - 626,559
Telecommunications services to third-parties - - 79,292 - - - 79,292
Telecommunications services betw een segments - - 15,144 - - (15,144) - Distribution of piped gas - third-parties - - - 185,465 - - 185,465
Distribution of piped gas - betw een segments - - - 637,217 - (637,217) -
Other operating revenues from third-parties 9,417 80,255 1,033 1,954 - - 92,659 Other operating revenues betw een segments 15,434 702 2,073 - - (18,209) -
OPERATIONAL EXPENSES (1,507,556) (3,682,882) (57,306) (777,528) (66,130) 854,754 (5,236,648) Electricity purchased for resale (54,414) (2,266,030) - - - 145,887 (2,174,557)
Charges for the use of the main transmission grid (116,959) (177,838) - - - 36,824 (257,973)
Personnel and management (99,321) (264,040) (21,650) (12,927) (50,500) - (448,438) Pension and healthcare plans (25,063) (60,494) (3,916) (963) (6,183) - (96,619)
Materials and supplies (8,094) (26,940) (583) (601) (166) - (36,384)
Raw materials and supplies for generation (687,304) - - - - 637,194 (50,110) Natural gas and supplies for gas business - - - (701,306) - - (701,306)
Third party services (80,729) (133,298) (9,571) (9,099) (2,640) 34,833 (200,504)
Depreciation and amortization (176,544) (109,252) (13,912) (8,077) (377) - (308,162) Provisions and reversals (56,933) (88,744) (1,732) 123 (1,716) - (149,002)
Construction cost (116,943) (484,892) - (24,728) - - (626,563)
Other operating costs and expenses (85,252) (71,354) (5,942) (19,950) (4,548) 16 (187,030)
EQUITY IN RESULTS SUBSIDIARIES 174,348 - - - 772,469 (862,235) 84,582
PROFIT BEFORE INCOME TAX AND SOCIAL CONTRIBUTION 1, 486,341 (425,454) 40,236 71,836 706,339 (862,118) 1,017,180 Financial income (expenses) 40,372 83,155 1,987 1,904 25,731 (119) 153,030
OPERATING INCOME (LOSSES) 1,526,713 (342,299) 42,223 73,740 732,070 (862,237) 1,170,210
Income tax and social contribution (502,543) - (14,400) (31,828) - - (548,771)
Deferred income tax and social contribution 77,555 113,402 72 6,131 12,707 - 209,867
NET INCOME (LOSSES) FOR THE PERIOD 1,101,725 (228,897) 27,895 48,043 744,777 (862,237) 831,306
GET DIS TEL GÁS HOL Eliminations Consolidated
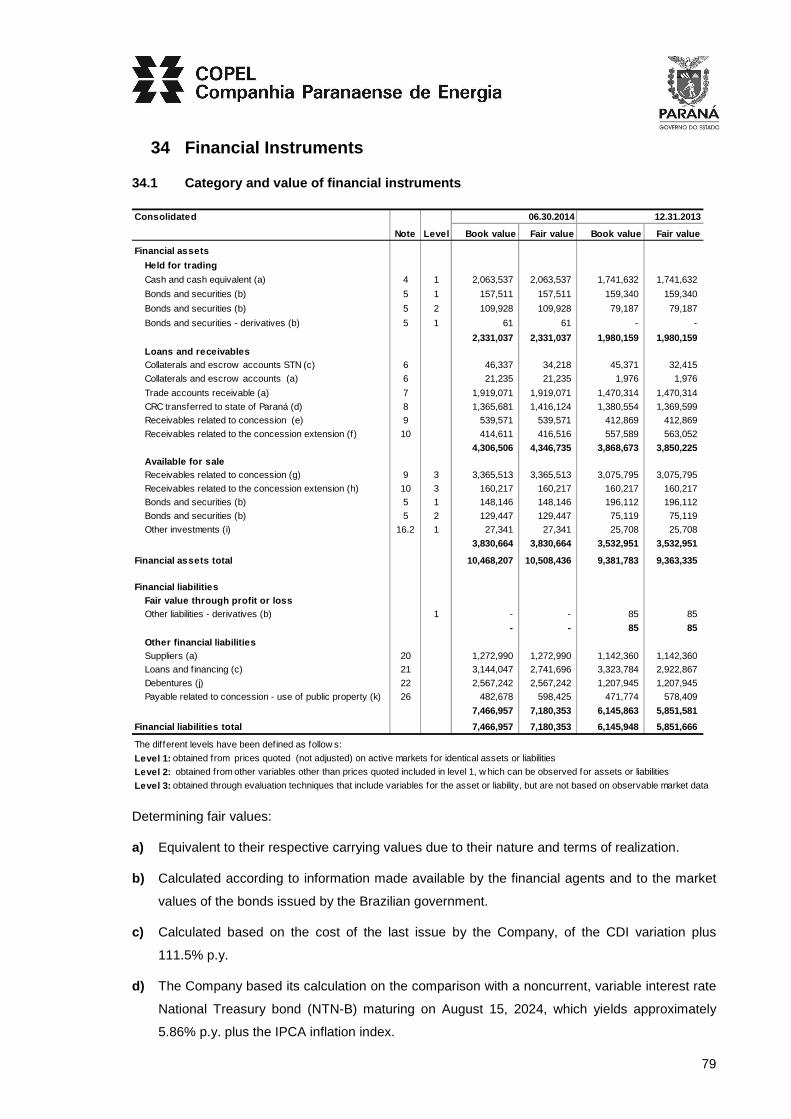
79
34 Financial Instruments
34.1 Category and value of financial instruments
Consolidated 06.30.2014
Note Level Book value Fair value Book value Fair value
Financial assets
Held for trading
Cash and cash equivalent (a) 4 1 2,063,537 2,063,537 1,741,632 1,741,632
Bonds and securities (b) 5 1 157,511 157,511 159,340 159,340
Bonds and securities (b) 5 2 109,928 109,928 79,187 79,187
Bonds and securities - derivatives (b) 5 1 61 61 - -
2,331,037 2,331,037 1,980,159 1,980,159 Loans and receivablesCollaterals and escrow accounts STN (c) 6 46,337 34,218 45,371 32,415
Collaterals and escrow accounts (a) 6 21,235 21,235 1,976 1,976
Trade accounts receivable (a) 7 1,919,071 1,919,071 1,470,314 1,470,314
CRC transferred to state of Paraná (d) 8 1,365,681 1,416,124 1,380,554 1,369,599
Receivables related to concession (e) 9 539,571 539,571 412,869 412,869
Receivables related to the concession extension (f) 10 414,611 416,516 557,589 563,052
4,306,506 4,346,735 3,868,673 3,850,225 Available for sale Receivables related to concession (g) 9 3 3,365,513 3,365,513 3,075,795 3,075,795
Receivables related to the concession extension (h) 10 3 160,217 160,217 160,217 160,217
Bonds and securities (b) 5 1 148,146 148,146 196,112 196,112
Bonds and securities (b) 5 2 129,447 129,447 75,119 75,119
Other investments (i) 16.2 1 27,341 27,341 25,708 25,708
3,830,664 3,830,664 3,532,951 3,532,951
Financial assets total 10,468,207 10,508,436 9,381,783 9,363,335
Financial liabilities Fair value through profit or loss Other liabilities - derivatives (b) 1 - - 85 85
- - 85 85
Other financial liabilities Suppliers (a) 20 1,272,990 1,272,990 1,142,360 1,142,360
Loans and financing (c) 21 3,144,047 2,741,696 3,323,784 2,922,867
Debentures (j) 22 2,567,242 2,567,242 1,207,945 1,207,945
Payable related to concession - use of public property (k) 26 482,678 598,425 471,774 578,409
7,466,957 7,180,353 6,145,863 5,851,581
Financial liabilities total 7,466,957 7,180,353 6,145,948 5,851,666
The different levels have been defined as follow s:
Level 1: obtained from prices quoted (not adjusted) on active markets for identical assets or liabilities
Level 2: obtained from other variables other than prices quoted included in level 1, w hich can be observed for assets or liabilities
Level 3: obtained through evaluation techniques that include variables for the asset or liability, but are not based on observable market data
12.31.2013
Determining fair values:
a) Equivalent to their respective carrying values due to their nature and terms of realization.
b) Calculated according to information made available by the financial agents and to the market
values of the bonds issued by the Brazilian government.
c) Calculated based on the cost of the last issue by the Company, of the CDI variation plus
111.5% p.y.
d) The Company based its calculation on the comparison with a noncurrent, variable interest rate
National Treasury bond (NTN-B) maturing on August 15, 2024, which yields approximately
5.86% p.y. plus the IPCA inflation index.

80
e) Criteria and assumptions disclosed on note 3.7.2 of December 31, 2013.
f) The accounts receivable related to concession extension, related to the assets which started
operations after May 2000, the expected flow of cash entries was discounted at the Selic rate,
the best short-term rate available for comparison for determination of its market value.
g) Criteria and assumptions disclosed on note 3.7.1 of December 31, 2013. The changes held in
the second quarter of 2014 are as follows:
Consolidated
Balance as of January 1, 2014 3,075,795
Transfers from intangible assets in progress 255,015
Monetary variation 51,350
Write off (16,647)
Balance as of June 30, 2014 3,365,513
h) These accounts receivable are related to assets existing as of May 31, 2000, equivalent to
their book values, due to the fact that the expert report to be analyzed by Aneel has not yet
been completed.
i) Calculated according to price quotes published in an active market or by applying the interest
percentage over shareholders' equity for assets with no active market.
j) Calculated according to the Unit Price Quotation (PU) as of June 30, 2014, obtained from the
National Association of Financial Market Institutions (Anbima), net of the financial cost of R$
2,022.
k) Used the rate of 7.74% p.y. as a market reference.
34.2 Risk Factors
The Company has a Corporate Risk Management Committee in charge of formulating and tracking
risk management policies and assisting the Audit Committee to ensure a good management of
resources and the protection and appreciation of its assets.
The Company's business activities are exposed to the following risks arising from financial
instruments:
34.2.1 Credit risk
Credit risk is defined as the possibility of the occurrence of losses related to non-compliance by a
client or counterpart to a financial instrument with their respective obligations under the terms
agreed on.

81
Consolidated Exposure to credit risk 06.30.2014 12.31.2013
Cash and cash equivalents (a) 2,063,537 1,741,632
Bonds and securities (a) 545,093 509,758
Collaterals and escrow accounts (a) 67,572 47,347
Trade accounts receivable (b) 1,919,071 1,470,314
CRC transferred to the State Government of Paraná (c) 1,365,681 1,380,554
Accounts receivable related to the concession (d) 3,905,084 3,488,664
Accounts receivable related to the concession extension (e) 414,611 557,589
Accounts receivable related to the concession extension (f) 160,217 160,217
10,440,866 9,356,075
a) Company management manages the credit risk of its assets in accordance with the Group's
policy of investing virtually all of its funds in federal banking institutions. As a result of legal
and/or regulatory requirements, in exceptional circumstances the Company may invest funds
in prime private banks.
b) The risk arises from the possibility of the Company incurring losses resulting from problems in
receiving amounts invoiced to its clients, customers, concession operators and licensees. This
risk is closely related to internal and external factors of Copel. To mitigate this type of risk the
Company manages its accounts receivable, detecting customer groups that pose the greatest
risk of default, cutting off energy supplies and implementing specific collection policies,
supported by guarantees whenever possible.
Doubtful accounts are adequately covered by an allowance to cover any realization losses.
c) Company management believes the CRC poses a minimal credit risk, as the amortizations are
guaranteed by dividends, and the State Government is paying the renegotiated amounts in
accordance with the fourth amendment.
d) Based on the Company's understanding that the signed agreements establish the
unconditional right to receive cash at the end of the concession, from the concession authority,
for the investments made in assets that have not been recovered through rates by the end of
the concession and specifically regarding energy transmission, as RAP is guaranteed revenue,
and therefore not subject to the risk of demand.
e) Management considers the credit risk on the indemnity approved for the assets which started
operations after May 2000 to be reduced, given that the realization and compensation rules
have already been established by the Granting Authority and has been received on schedule.
f) For value of existing assets on May 31, 2000, Aneel published Resolution no. 589/2013, which
addresses the definition criteria for calculating the New Replacement Value (VNR) for the
indemnification purpose. For these assets Management considers the credit risk as reduced
since the rules for compensation are set and there is an going survey of information required
by the granting authority.

82
34.2.2 Liquidity risk
The Company's liquidity risk consists of the possibility of insufficient funds, cash or other financial
asset to settle obligations on scheduled dates.
The Company manages liquidity risk relying on a set of methodologies, procedures and
instruments applied for a permanent control over financial processes to ensure a proper
management of risks.
Investments are financed by incurring medium and long term debt to financial institutions and
capital markets.
Short-term, medium-term and long-term business projections are made and submitted to
management bodies for evaluation. The budget for the next fiscal year is annually approved.
Medium and long-term business projections cover monthly periods over the next five years. Short-
term projections consider daily periods covering only the next 90 days.
The Company permanently monitors the volume of funds to be settled by controlling cash flows to
reduce funding costs, the risk involved in the renewal of loan agreements and compliance with the
financial investment policy, while at the same time keeping minimum cash levels.
The table below shows the expected settlement amounts within each time range. Projections were
based on financial indicators linked to the related financial instruments and forecast according to
average market expectations as disclosed on the Central Bank of Brazil's Focus Report, which
provides the average expectations of market analysts for these indicators for the current year and
the following year. As from 2014, 2013 indicators are repeated through the forecast period, except
for the US dollar, which follows the US inflation rate.

83
Consolidated Interest (a) Less than 1 to 3 3 month 1 to 5 More than Liabilities 1 month month to 1 year years 5 years Total
06.30.2014
Loans and f inancing Note 21 410,843 116,825 388,695 1,933,564 1,407,422 4,257,349
Debentures Note 22 4,164 10,780 645,455 2,852,085 - 3,512,484
Payables related to concession - Rate of return +
use of public asset IGP-M and IPCA 4,299 8,605 41,855 252,454 2,071,255 2,378,468
Eletrobrás - Itaipu Dolar - 120,303 568,063 3,670,175 5,097,101 9,455,642
Petrobras - Compagás 100% of CDI 4,643 9,377 14,560 - - 28,580
Other suppliers - 885,316 163,022 121,692 52,737 22,368 1,245,135
Post employment benefits 8.05% 43,145 86,289 388,302 2,785,404 12,492,581 15,795,721
Purchase liabilities IGP-M and IPCA - 853,472 4,042,181 22,960,871 142,888,588 170,745,112
1,352,410 1,368,673 6,210,803 34,507,290 163,979,315 207,418,491 12.31.2013Loans and f inancing Note 21 44,546 312,844 773,467 1,853,937 1,488,871 4,473,665
Debentures Note 22 5,182 10,324 160,669 1,499,400 - 1,675,575
Derivative Future DI 85 - - - - 85
Payables related to concession - Rate of return +
use of public asset IGP-M and IPCA 4,282 8,564 39,272 246,196 2,103,155 2,401,469
Eletrobrás - Itaipu Dolar - 124,286 575,224 3,606,457 5,517,175 9,823,142
Petrobras - Compagas 100% of CDI 5,295 10,738 51,243 - - 67,276
Other suppliers - 645,392 144,718 196,518 92,271 - 1,078,899
Post employment benefits 8.05% 43,145 86,289 388,302 2,785,404 12,492,581 15,795,721
Purchase liabilities IGP-M and IPCA - 605,310 2,818,490 12,216,247 80,198,892 95,838,939
747,927 1,303,073 5,003,185 22,299,912 101,800,674 131,154,771
(a) Effective interest rate - w eighted average
As disclosed in notes 21.11 and 22.2, the Company and its subsidiaries have loan and financing
agreements and debentures with covenants that if breached may require have its payment
accelerated.
The main guarantees put up for maintaining business and investing activities are invested in
securities (note 5) and cash (note 6).
34.2.3 Market risk
Market risk is the risk that the fair value or future cash flows of the financial instrument fluctuate
due to changes in market prices, such as exchange rates, interest rates and share prices. The
purpose of risk management is to control exposures within acceptable limits, while optimizing
return.
a) Foreign currency risk (US Dollar)
This risk comprises the possibility of losses due to fluctuations in exchange rates, which may
reduce assets or increase liabilities denominated in foreign currencies.
The Company’s foreign currency indebtedness is not significant and it is not exposed to foreign
exchange derivatives. The Company monitors all relevant exchange rates.
The effect of the exchange rate variation resulting from the power purchase agreement with
Eletrobras (Itaipu) is passed on to customers in Copel Distribuição's next rate review.

84
The exchange rate risk posed by the purchase of gas arises from the possibility of Compagás
reporting losses on the fluctuations in gas prices resulting from a fluctuation in the value of the
"basket of oils" and exchange rates, increasing the balances of accounts payable related to the
acquired gas.
Compagás monitors these fluctuations on a permanent basis.
Sensitivity analysis of foreign currency risk
The Company has developed a sensitivity analysis in order to measure the impact of the
devaluation of the U.S. dollar on its loans and financing subject to exchange risk.
The baseline takes into account the existing balances in each account as of June 30, 2014 and the
likely scenario takes into account the balances subject to the exchange rate variations – end of
period (R$/US$ 2.35) estimated as market average projections for 2014 according to the Focus
Report issued by the Brazilian Central Bank as of July 25, 2014. For the adverse and remote
scenarios, deteriorations of 25% and 50%, respectively, were considered for the main risk factor for
financial instruments compared to the rate used for the likely scenario.
. Baseline Projected scenarios - Dec.2014Foreign currency risks Risk 06.30.2014 Probable Advers e Remote.Financial assets Collaterals and escrow accounts - STN USD depreciation 46,337 3,103 (9,257) (21,617) . 46,337 3,103 (9,257) (21,617) Financial liabilities Loans and financing
STN USD appreciation (60,371) (4,043) (20,147) (36,250)
Eletrobrás USD appreciation (3) - (1) (2)
(60,374) (4,043) (20,148) (36,252) Suppliers
Eletrobrás (Itaipu) USD appreciation (118,180) (7,914) (39,438) (70,962) Petrobras (acquisiton of gas by Compagás) USD appreciation (141,747) (9,493) (47,303) (85,113)
(259,927) (17,407) (86,741) (156,075)
In addition to the sensitivity analysis required by CVM Resolution no. 475/08, the Company
evaluates its financial instruments considering the possible effects on profit and loss and equity of
the risks evaluated by Company management on the reporting date for the financial instruments,
as recommended by CPC 40 and IFRS 7. Based on the equity position and the notional value of
the financial instruments held as of June 30, 2014, it is estimated that these effects will
approximate the amounts stated in the above table in the column for the forecast probable
scenario, since the assumptions used by the Company are similar to those previously described.
b) Interest rate and monetary variation risk
This risk comprises the possibility of losses due to fluctuations in interest rates or other indicators,
which may reduce financial revenues or increase financial expenses in connection with assets and
liabilities on the market.
The Company has not engaged in transactions with derivatives to cover this risk, except for the

85
exclusive investment funds (34.2.3-c), but it has continually monitored interest rates and market
indicators, in order to assess the potential need for such transactions for protection for interest rate
risks.
Sensitivity analysis of interest rate and monetary variation risk
The Company has developed a sensitivity analysis in order to measure the impact of variable
interest rates and monetary variations on its financial assets and liabilities subject to these risks.
The baseline takes into account the existing balances in each account as of June 30, 2014 and the
likely scenario takes into account the indicators (CDI/Selic of 11.00%, IPCA of 6.41%, IGP-DI of
4.34%, IGP-M of 4.87% and TJLP of 5.00%) estimated as market average projections for 2014
according to the Focus Report issued by the Brazilian Central Bank as of July 25, 2014. For the
adverse and remote scenarios, deteriorations of 25% and 50%, respectively, were considered for
the main risk factor for the financial instrument compared to the rate used in the likely scenario.
. Baseline Projected scenarios - Dec.2014Interest rate and monetary variation risk Risk 06.30 .2014 Probable Adverse Remote.
Financial assets Financial investments - cash equivalents Low CDI/SELIC 1,946,883 108,126 81,562 54,777
Bonds and securities Low CDI/SELIC 545,093 30,273 22,835 15,336
Collaterals and escrow accounts Low CDI/SELIC 21,235 1,180 890 598 CRC transferred to the State Government of Paraná Low IGP-DI 1,365,681 29,927 15,415 902
Accounts receivable related to the concession Low IGP-M 3,905,084 92,323 45,914 (494)
Accounts receivable related to the concession extension - RBNI Low IPCA 414,611 10,645 4,241 (2,163) Accounts receivable related to the concession extension Undefined (a) 160,217 - - -
8,358,804 272,474 170,857 68,956 Financial liabilities Loans and f inancing
Banco do Brasil High CDI (1,610,326) (86,258) (107,145) (127,782)
Eletrobrás - Finel High IGP-M (67,054) (323) (486) (648)
Eletrobrás - RGR No Risk (b) (88,459) - - -
Finep High TJLP (36,779) (908) (1,132) (1,354)
BNDES - Copel Geração e Transmissão High TJLP (1,126,214) (27,812) (34,661) (41,470)
Banco do Brasil – Transfer BNDES funds High TJLP (154,841) (3,824) (4,765) (5,702)
Banco do Brasil High CDI - - - -
Debentures High CDI (2,567,242) (137,515) (170,815) (203,715)
. (5,650,915) (256,640) (319,004) (380,671)
(a) Risk assessment still requires ruling by the Granting Authority.
(b) Loan indexed to UFIR
In addition to the sensitivity analysis required by CVM Resolution no. 475/08, the Company
evaluates its financial instruments considering the possible effects on profit and loss and equity of
the risks evaluated by Company management on the reporting date for the financial instruments,
as recommended by CPC 40 and IFRS 7. Based on the equity position and the notional value of
the financial instruments held as of June 30, 2014, it is estimated that these effects will
approximate the amounts stated in the above table in the column for the forecast probable
scenario, since the assumptions used by the Company are similar to those previously described.

86
c) Derivative financial instruments risk
The Company employs derivative financial instruments with the sole purpose of protecting itself
against variable interest rate volatility.
In order to protect against the effects of volatility on long exposures (DI interest rates) of bonds and
securities, the Company hired future DI rate operations, negotiated at BM&FBOVESPA and
registered at CETIP, whose nominal balances and conditions are as follows:
i) For the period ended June 30, 2014, the result of operations with derivative financial
instruments on the futures market was a loss of R$ 964 (a gain of R$ 4,646 on June 2013);
ii) Contracts are adjusted daily in accordance with the future DI rates published by
BM&FBOVESPA. The reference (notional) values of these outstanding contracts as of June 30,
2014 corresponded to R$ 87,209 (R$ 109,792 as of December 31, 2013);
iii) On June 30, 2014, a share of the Company’s federal bonds in the amount of R$ 5,216 (R$
6,712 as of December 31, 2013), was deposited as collateral for transactions at
BM&FBOVESPA S.A.
Sensitivity analysis of derivative financial instru ments risk
In order to measure the effects of the variations in the indices and rates tied to the derivative
operations, the following sensitivity analysis table was prepared in accordance with the terms
provided by CVM Resolution no. 475/08, which includes a scenario considered probable by
Company management, a situation considered adverse of at least a 25% deterioration in the
variables used and a situation considered remote, with a deterioration of at least 50% in the risk
variables. The base scenario took into account the existing balances and the probable scenario for
balances with changes in the BM&FBOVESPA preferential rate for LTN (National Treasury Bills)
maturing on January 02, 2015.
. Baseline Projected scenarios - Dec.2014Risk of derivative Risk 06.30.2014 Probable Adverse Remote.
Financial assets (liabilities)Derivative – assets Decrease in DI rate 61 (226) (1,415) (2,618)
61 (226) (1,415) (2,618)
Expected effect in the result (287) (1,476) (2,679)
34.2.4 Power shortage risk
This risk results from the possibility of periods with low levels of rainfall, since Brazil relies heavily
on hydroelectric sources, which depend on the water levels in their reservoirs to operate.
A long period of drought may reduce the water levels in power plant reservoirs and result in losses
due to reduced revenues if a new rationing program is implemented.
87
According to the Annual Plan for Electricity Operation - PEN 2013, published annually on the
website: www.ons.org.br, probability assessments of energy service conditions, based on energy
deficit risks for the Benchmarking Scenario show the appropriateness of the supply criteria set by
the National Energy Policy Council - CNPE (deficit risk not higher than 5%) for all subsystems
within the period from 2013 to 2017. Deficit risks reach maximum levels 3.0% in the Southern
subsystem and 2.5% in the Southeastern/Center Western system and lower than 1.0% in the
Northern and Northeastern subsystems within the whole assessment period.
Although the 2013 Energy Plan does not show deficit risks above 5% and federal government's
official sources state that there is no risk of rationing, low reservoir levels have kept the difference
settlement price – PLD at high levels or next to the maximum level, mainly in the Southeast, since
the beginning of February 2014. This may indicate that the system is operating very close to the
risk of 5% of deficit.
34.2.5 Risk of non-renewal of concessions
Law 12,783/2013 published on January 14, 2013 ruled the extension of energy generation,
transmission and distribution concessions covered by articles 17, 19 and 22 of Law 9.074/2015.
However, extension depends on full acceptance of the conditions set by that law.
Four power plants have been affected by Law 12,783/2013: Rio dos Patos with 1.8 MW, Mourão
with 8.2 MW, Chopim with 1.8 MW and Usina Governador Pedro Viriato Parigot de Souza with 260
MW of installed capacity.
In order to maintain the Company's current profitability levels, the concessions for these plants
have not been extended, given that studies have shown that the conditions imposed by the
Concession Authority make the plants not economically feasible. By the end of the concession
agreement, these power plants will be put up for auction, and the Company has no guarantee that
it will be the winning bidder. Rio dos Patos in turn finished the agreement in February 2014.
However, the Company will remain responsible for providing the power plant services until the
concessionaire that has won the bidding assumes the enterprise. No date has yet been set for this
takeover to happen. Ordinance 170/2014 issued on April 17, 2014 by the Ministry of Mines and
Energy established the cost of managing the generation assets of this plant, which will be used to
set the annual generation revenue to be earned from rendering this service.
Concession Agreement number 060/2001, which sets rules about transmission facilities, has been
extended for 30 more years, according to the conditions established by Law 12,783/2013. In this
case the conditions for making investments arising from contingencies, modernization, renovation
and refurbishment of structures and equipment have been kept. These investments will actually be
made upon Aneel's recognition and authorization. The guarantee that the regulatory body will
reimburse the Company for the works rules out the possibility of financial losses and keeps the
Company's current profitability levels.
For the distribution services, the Company has issued a favorable opinion on the extension of

88
Concession Agreement number 046/1999, pursuant to Law 12,783/2013. The Company is waiting
for the decision by the Concession Authority on the extension. If the conditions set by the
Concession Authority ensure the Company's expected profitability levels, the Company will sign the
concession agreement or amendment for an additional period of 30 years. Even considering that
the regulatory overall scene is uncertain, the Company believes on the possibility of the concession
amendment, although it does not have sufficient information to guarantee that the contract for the
distribution services will be renewed on favorable terms.
Copel Geração e TransmissãoConcessions/authorizations contracts Maturity date
Hydroelectric Power Plants Generation Concession - 045/1999Governador Bento Munhoz da Rocha Netto (Foz do Areia) 05.23.2023
Governador Ney Aminthas de Barros Braga (Segredo) 11.15.2029
Governador José Richa (Caxias) 05.04.2030
Governador Pedro Viriato Parigot de Souza (a) (b) 07.07.2015
Guaricana 08.16.2026
Mourão (a) (b) 07.07.2015
Marumbi (c) -
São Jorge 12.03.2024
Rio dos Patos (a) (b) (g) 02.14.2014
Melissa (d) -
Salto do Vau (d) -
Pitangui (d) -
Generation Concession - 001/2007 - Mauá - 51% of Copel 07.02.2042
Generation Concession - 001/2011 - Colíder (f) 01.16.2046
Authorization - Cavernoso II (f) 02.27.2046
Generation Concession - Use of Public Property - 00 7/2013Chaminé (e) 08.16.2026
Apucaraninha (e) 10.12.2025
Derivação do Rio Jordão (e) 11.15.2029
Chopim I (a) (b) (e) 07.07.2015
Cavernoso (e) 01.07.2031
Thermal Power Plant Generation Concession - 045/1999 - Figueira 03.26.2019
Authorizathion - 351/1999 - TTP Araucária (60% da Copel GeT e 20% da Copel) 12.22.2029
Wind Power Plant Authorization - Palmas 09.28.2029
(a) Plant not renew ed pursuant to Executive Act 579/2012 - Concessionaire's prerogative
(b) By the end of the concession the project w ill be offered for competitive bidding
(c) In progress for homologation from ANEEL
(d) At plants w ith capacity of less than 1 MW, only register w ith ANEEL
(e) Pow er plants that underw ent change in the exploration system from a Public Service regime to an
Independent Producer Regime
(f) Enterprise under construction
(g) The Company w ill remain responsible for providing the pow er plant services until the concessionaire that has w on
the bidding assumes the enterprise. No date has yet been set for this takeover to happen.
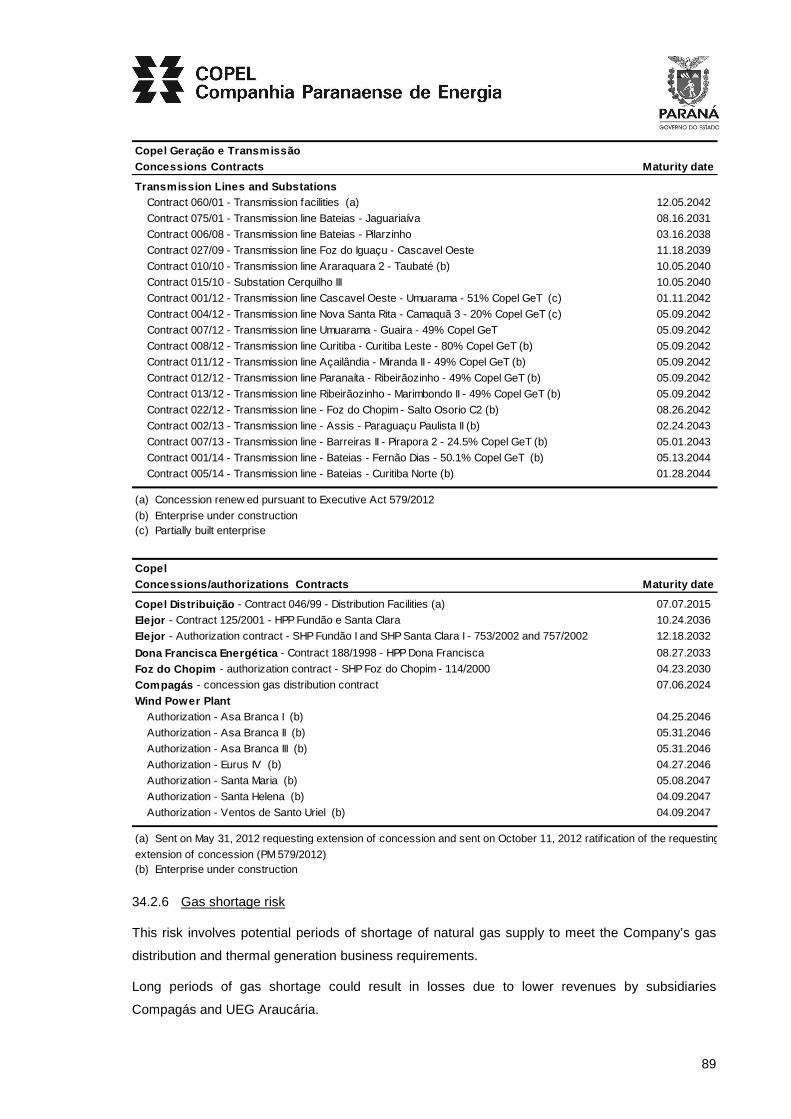
89
Copel Geração e TransmissãoConcessions Contracts Maturity date
Transmission Lines and SubstationsContract 060/01 - Transmission facilities (a) 12.05.2042
Contract 075/01 - Transmission line Bateias - Jaguariaíva 08.16.2031
Contract 006/08 - Transmission line Bateias - Pilarzinho 03.16.2038
Contract 027/09 - Transmission line Foz do Iguaçu - Cascavel Oeste 11.18.2039
Contract 010/10 - Transmission line Araraquara 2 - Taubaté (b) 10.05.2040
Contract 015/10 - Substation Cerquilho III 10.05.2040
Contract 001/12 - Transmission line Cascavel Oeste - Umuarama - 51% Copel GeT (c) 01.11.2042
Contract 004/12 - Transmission line Nova Santa Rita - Camaquã 3 - 20% Copel GeT (c) 05.09.2042
Contract 007/12 - Transmission line Umuarama - Guaira - 49% Copel GeT 05.09.2042
Contract 008/12 - Transmission line Curitiba - Curitiba Leste - 80% Copel GeT (b) 05.09.2042
Contract 011/12 - Transmission line Açailândia - Miranda II - 49% Copel GeT (b) 05.09.2042
Contract 012/12 - Transmission line Paranaíta - Ribeirãozinho - 49% Copel GeT (b) 05.09.2042
Contract 013/12 - Transmission line Ribeirãozinho - Marimbondo II - 49% Copel GeT (b) 05.09.2042
Contract 022/12 - Transmission line - Foz do Chopim - Salto Osorio C2 (b) 08.26.2042
Contract 002/13 - Transmission line - Assis - Paraguaçu Paulista II (b) 02.24.2043
Contract 007/13 - Transmission line - Barreiras II - Pirapora 2 - 24.5% Copel GeT (b) 05.01.2043
Contract 001/14 - Transmission line - Bateias - Fernão Dias - 50.1% Copel GeT (b) 05.13.2044
Contract 005/14 - Transmission line - Bateias - Curitiba Norte (b) 01.28.2044
(a) Concession renew ed pursuant to Executive Act 579/2012
(b) Enterprise under construction(c) Partially built enterprise
Copel Concessions/authorizations Contracts Maturity date
Copel Distribuição - Contract 046/99 - Distribution Facilities (a) 07.07.2015
Elejor - Contract 125/2001 - HPP Fundão e Santa Clara 10.24.2036
Elejor - Authorization contract - SHP Fundão I and SHP Santa Clara I - 753/2002 and 757/2002 12.18.2032
Dona Francisca Energética - Contract 188/1998 - HPP Dona Francisca 08.27.2033
Foz do Chopim - authorization contract - SHP Foz do Chopim - 114/2000 04.23.2030
Compagás - concession gas distribution contract 07.06.2024
Wind Power Plant Authorization - Asa Branca I (b) 04.25.2046
Authorization - Asa Branca II (b) 05.31.2046
Authorization - Asa Branca III (b) 05.31.2046
Authorization - Eurus IV (b) 04.27.2046
Authorization - Santa Maria (b) 05.08.2047
Authorization - Santa Helena (b) 04.09.2047
Authorization - Ventos de Santo Uriel (b) 04.09.2047
(a) Sent on May 31, 2012 requesting extension of concession and sent on October 11, 2012 ratif ication of the requesting
extension of concession (PM 579/2012)(b) Enterprise under construction
34.2.6 Gas shortage risk
This risk involves potential periods of shortage of natural gas supply to meet the Company’s gas
distribution and thermal generation business requirements.
Long periods of gas shortage could result in losses due to lower revenues by subsidiaries
Compagás and UEG Araucária.

90
34.3 Management of capital
The Company always seeks to maintain a strong capital base to maintain the trust of investors,
creditors and market and ensure the future development of the business. It seeks to maintain a
balance between the highest possible returns with more adequate levels of loans and the
advantages and security provided by a healthy capital position. Thus, it maximizes the return for all
interested parties in its operations, optimizing the balance of debts and equity.
The capital structure is composed of:
a) net indebtedness, defined as total loans, financing and debentures, net of cash and cash
equivalents and short term bonds and securities; and
b) own capital, defined as total equity.
Parent Company Consolidated Debt 06.30.2014 12.31.2013 06.30.2014 12.31.2013
Loans and f inancing 988,186 1,019,553 3,144,047 3,323,784
Debentures 1,004,707 - 2,567,242 1,207,945
(-) Cash and cash equivalents 535,830 10,410 2,063,537 1,741,632
(-) Bonds and securities 147 186 429,447 389,222
Net indebtedness 1,456,916 1,008,957 3,218,305 2,400,875
Equity 13,161,134 12,651,339 13,520,093 12,928,752
Net indebtedness ratio 0.11 0.08 0.24 0.19
35 Related Party Transactions
The balances of transactions between the Company and its associates and subsidiaries are shown
in Note 8, Note 15 and Note 16.
The amounts resulting from the operating activities of Copel Distribuição involving related parties
are billed at the rates approved by Aneel.

91
Consolidated Assets Liabilities Results Related parties / Nature of operation 06.30.2014 12. 31.2013 06.30.2014 12.31.2013 06.30.2014 06.30.2013
Controlling shareholders State of Paraná"Luz Fraterna" program (a) 123,950 78,987 - - - -
Remuneration and employ social security charges assigned (b) 525 266 - - - -
Telecommunication services (c) 33,912 22,410 - - 14,047 12,904
CRC (Note 8) 1,365,681 1,380,554 - - 85,679 68,401 .Entities w ith significant influence
BNDES e BNDESPAR (d)Financing (Note 21.5) - - 1,126,214 1,125,109 (35,714) (6,839)
Petrobras (e)Rental plant TTP Araucária (30.4.1 - a) - 6,499 - - 5,507 68,423
Supply and transport of gas (f) 363 374 - - 6,869 15,240
Acquisition of gas for resale (f) - - 141,747 51,502 (701,218) (140,383)
Advances to suppliers of Compagás (g) 2,266 13,504 - - - -
Dividends payable by Compagás - - - 1,076 - - .Mitsui Gás e Energia do Brasil Ltda. (h) - - 1,208 2,283 - - .Paineira Participações S.A. (i) - - - 11,985 - -
Jointly-controlled
Marumbi Transmissora de Energia (j) 184 184 - - 1,102 1,042
Caiuá Transmissora de Energia (k) 271 221 - - 98 343
AssociatesDona Francisca Energética S.A. (l) - - 6,116 6,320 (37,112) (35,306) .Foz do Chopim Energética Ltda. (m) 155 201 - - 897 812
Sercomtel S.A. Telecomunicações (n) 245 192 - - 650 1,137 .Key management personnel
Fees and related charges (Note 31.3) - - - - (9,362) (7,714)
Pension plans and health care (Note 23) - - - - (630) (420)
Other related parties
Fundação Copel Rental of administrative real estate - - - - (5,886) (5,533)
Private pension and health plans (Note 23) - - 1,002,967 967,232 - - .Lactec (o) 30,047 27,229 1,189 587 (991) (4,230)
a) The Luz Fraterna Program, created under Law no. 491/ 2013 and no. 17,639, dated July 31,
2013, allows the State Government to pay for the electricity bills of low income families in
Paraná – which have duly applied for the program – provided their consumption does not
exceed 120 kWh a month. This benefit is available to residential customers with single phase
connections, rural customers with single phase connections or two phase connections with
circuit breakers of up to 50 amperes. Applicants must not have more than one electricity bill
under their names and must not have any pending debts to Copel Distribuição. R$ 115,696 of
the total is accounted for in the related parties account in the parent company's books of
account, according to note 15.1.1.
b) Reimbursement of wages and social charges for employees transferred to the Paraná State
Government. The Company recognized an impairment allowance in the amount of R$ 1,286
as of June 30, 2014 and R$ 1,614 as of December 31, 2013
c) Telecommunications services rendered in accordance with the agreement entered into by
Copel Telecomunicações with the State of Parana.

92
d) BNDES is the parent company of BNDES Participações SA (BNDESPAR) that holds 23.96%
of the share capital of the Company (26.41% of the common shares and 21.27% of class B
preferred shares).
e) Petrobras holds 20% of the share capital of UEG Araucária and 24.5% of the share capital of
Compagás.
f) The supply and transport of piped gas and the purchase of gas for resale by Compagás.
g) Advance payments to suppliers of Compagás refer to the gas purchase contract covering
guaranteed volumes and transport capacity, higher than those actually consumed and used,
which contains a future compensation clause. Compagás has the right to receive unused gas
in subsequent months, and it may offset amounts under contract but not consumed over a
period of up to 10 years. This balance is adjusted monthly, therefore adjusting the recoverable
value. Considering Compagás's expansion plan and the expected increase in market
consumption, Management understands that the volume of accumulated gas will be offset
partially by June 30, 2014. Therefore, according to contractual provisions, Compagás
recognized an impairment loss on the ship or pay credit in the amount of R$ 15,704.
h) Mitsui Gás e Energia do Brasil Ltda. holds 24.5% of Compagás’ share capital. The balances
refer to dividends payable by Compagás.
i) Paineira Participações S.A. holds 30% of Elejor share capital. The balances refer to dividends
payable by Elejor.
j) Engineering services agreement, signed with Copel Geração e Transmissão, expiring on
September 30, 2015.
k) Specific environmental management services agreement, signed with Copel Geração e
Transmissão, expiring on March 14, 2015.
l) Power purchase and sale agreement signed by Dona Francisca Energética and Copel
Geração e Transmissão, expiring on March 31, 2015.
m) Agreements entered into between Foz do Chopim Energética Ltda. and Copel Geração e
Transmissão, one for rendering operation and maintenance services, which matures on May
24, 2015, and the other for establishing a connection with the transmission system, which
matures on July 7, 2015.
n) Light pole sharing agreement, signed between Sercomtel S.A Telecomunicações and Copel
Distribuição, expiring on December 28, 2018.

93
o) The Institute of Technology for Development (Lactec) is a Public Interest Civil Society
Organization (OSCIP), in which Copel is an associated. Lactec has service and R&D contracts
with Copel Geração e Transmissão and Copel Distribuição, which are subject to prior or later
control and approval by Aneel.
The asset balances refer to Energy Efficiency and R&D programs, recorded under current
assets, in service in progress, until the respective projects are concluded, pursuant to Aneel.
35.1 Guarantees and endorsements awarded to relat ed parties
35.1.1 Granted by Parent Company
The Parent Company granted the following guarantees and endorsements:
a) personal guarantee given for the issue of debentures by subsidiaries Nova Asa Branca I, Nova
Asa Branca II, Nova Asa Branca III, Nova Eurus, Santa Maria, Santa Helena and Ventos de
Santo Uriel, according to note 22.
b) bank guarantee for the equity interest of 70% in the debentures issued by the subsidiary Elejor
on September 26, 2013, pursuant to Note 22.
c) endorsements for its equity interest of 23.03% to its associated company Dona Francisca
Energética S.A., in 2002, in financing secured from the BNDES (joint endorsement) and
Bradesco (joint endorsement), for settlement by 2015. As of June 30, 2014 the restated
outstanding balances amounted to R$ 6,219 with BNDES and R$ 3,601 with Bradesco.
35.1.2 Granted to jointly controlled entities
Ventures Date Final Amount Total Balance as of
joint subsidiaries Financing issued Maturity approved is sued 06.30.2014
Transmissora Sul Brasileira (a) Promissory notes 12.20.2013 07.15.2028 266,572 260,145 266,067 Caiuá Transmissora (b) Promissory notes 03.19.2014 02.15.2029 84,600 79,600 81,028
Integração Maranhense (c) Promissory notes 03.19.2014 02.15.2029 142,150 131,400 133,642
Matrinchã Transmissora (d) Debentures 06.20.2013 12.20.2014 800,000 540,000 597,180
Guaraciaba Transmissora (e) Debentures 06.20.2013 12.20.2014 400,000 370,000 442,356
Costa Oeste (f) Promissory notes 01.15.2014 11.15.2028 36,720 31,000 31,628
Financier:BNDES: (a) (b) (c) (f)
HSBC Corretora de Títulos e Valores Mobiliários S.A. e Banco Santander (Brasil) S.A.: (d) (e)
Allocation:“Bridge loan" for financing operation to be secured from BNDES (a)
Working capital: (b) (c) (d) (e) (f)
Endorsement/Security:20% of the debt limit given by Copel: (a)
49% of the letter of guarantee amount, as jointly- liable endorser, Copel Geração e Transmissão: (b) (c)
49% of the debt limit given by Copel Geração e Transmissão: (d) (e)
51% of the debt limit given by Copel Geração e Transmissão: (f)
Securities offered for the transaction:Lien on shares given by Copel Geração e Transmissão, corresponding to 20%: (a)
Lien on shares of Copel Geração e Transmissão, corresponding to 49%: (b)
Lien on shares of Copel Geração e Transmissão, corresponding to 49%: (f)

94
36 Insurance
Details by risk type and effectiveness date of the main policies can be seen below.
Consolidated Final Policy Maturity Insured
Specif ied risks 08.24.2014 1,727,388
Fire - Company-ow ned and rented facilities 08.24.2014 521,633
Civil liability - Copel 08.24.2014 12,000
Civil liability - Compagas 10.30.2014 3,600
Engineering risks - Copel 08.24.2014 dependant on each event
Domestic and international transport - export and import 08.24.2014 dependant on each event
Multi-risk - Compagas 12.18.2014 14,750
Multi-risk - Compagas 04.26.2015 470
Multi-risk - Elejor 04.11.2015 395,099
Vehicles 08.20.2014 market value
Miscellaneous risks 08.24.2014 810
Operational risks - Elejor 06.06.2015 500
Operational risks - UEG Araucária (a) 05.31.2015 794,456 Court guarantee - Compagás 02.03.2015 56,938
Performance bond - Copel 07.14.2014 12,500
Performance bond - Copel 07.30.2015 44,319
Performance bond - Copel 12.27.2014 1,850
Operational risks - HPP Mauá - Consórcio Energético Cruzeiro do Sul 11.23.2014 342,139
Liability for directors and administrators - D&O (a) 06.30.2015 55,063
Performance bond - w ind farm 06.30.2015 22,200
Performance bond - w ind farm 10.02.2014 11,100
Performance bond - w ind farm 06.30.2015 3,047
Performance bond - w ind farm 03.31.2015 6,000
Participation guarantee - Brazil's National Oil Agency - ANP 08.31.2014 8,189 Performance bond - Agência Nacional de Petróleo - ANP 11.11.2018 59,440
(a) The values of the sums insured Operational Risk - UEG Araucaria and liability for directors and off icers
have been converted to real U.S. dollars w ith the rate of the day 06.30.2014, R$ 2.2025.
37 Regulatory Assets and Liabilities
As a result of adopting IFRS, the Company no longer recognizes regulatory assets and liabilities,
and unrecognized the existing balances.
These assets and liabilities continue to be recognized in the regulatory records, introduced by
Aneel Normative Resolution 396.
The Compensation Account for Variations in Items from “Part A” - CVA accompanies the variations
reported between the amounts homologated for tariff adjustments, and the amounts actually
incurred during the tariff period, from the following cost components of “Part A”: Purchase of
electric power (Bilateral, Itaipu and Auctions), Energy Transmission Cost (Transmission from Itaipu
and the Basic/BN Grid) and Sector Charges (Energy Development Account - CDE; System Service
Charges - ESS and Incentive Program for Alternative Energy Sources – Proinfa, Research and
Development and Energy Efficiency, and others).
Aneel authorized Copel Distribuição, through Homologatory Resolution 1,740, of June 24, 2014, to

95
adjust its supply tariffs as from June 24, 2014, by an average rate of 30.78%, with 24.78% that
refers to the tariff adjustment index and 6% for the pertinent financial components, of which, CVA,
represents a total of R$ 214,733, consisting of 2 parts: CVA being processed, for the tariff year
2013-2014, for the amount of R$ 214,879, and the balance to compensate for CVA from prior years
for the amount of R$ 146 (negative).
Due to the partial deferral of the adjustment, the effect was an average increase by 24.86% in
electricity prices charged from consumers, pursuant to Resolution 1,763 of July 22, 2014.
If the regulatory assets and liabilities had been recognized, the Company would have reported the
following balances in its financial statements:
37.1 Composition of balances for regulatory asset s and liabilities
Consolidated
06.30.2014 12.31.2013 06.30.2014 12.31.2013CVA recoverable tariff adjustment 2013
CCC - 3,779 - -
Charges for use of transmission system (basic grid) - 917 - -
Electricity purchased for resale (Itaipu) - 5 - -
Proinfa - 5,534 - -
Electricity purchased for resale (CVA Energ) - 4,614 - -
Other financial components - 45,146 - -
- 59,995 - - CVA recoverable tariff adjustment 2014
CCC 8,508 - - -
Charges for use of transmission system (basic grid) 28,608 18,587 - 18,587
Electricity purchased for resale (Itaipu) 4,938 - - -
CDE 2,320 - - -
Proinfa 9,207 154 - 154
Electricity purchased for resale (CVA Energ) 324,227 71,335 - 71,335
Transport of energy purchased (Itaipu) 330 - - -
Other financial components 161,512 137,728 - 137,728
539,650 227,804 - 227,804 CVA recoverable tariff adjustment 2015
Charges for use of transmission system (basic grid) - - 7,471 -
CDE - - 9,711 -
Electricity purchased for resale (CVA Energ) - - 221,106 -
Transport of energy purchased (Itaipu) - - 101 -
Other financial components - - 398,474 -
- - 636,863 -
539,650 287,799 636,863 227,804
Current Assets Noncurrent Assets

96
Consolidated
06.30.2014 12.31.2013 06.30.2014 12.31.2013
CVA compensable tariff adjustment 2013
ESS - 684 - - CDE - 2,851 - -
Transport of energy purchased (Itaipu) - 661 - -
Other financial components - 2,616 - -
- 6,812 - -
CVA compensable tariff adjustment 2014
Energy purchased for resale (Itaipu) - 3,753 - 3,753
ESS 163,406 39,610 - 39,610 CDE - 87 - 87
Transport of energy purchased (Itaipu) - 20 - 20
Other financial components 21,341 1,804 - 1,804
184,747 45,274 - 45,274
CVA compensable tariff adjustment 2015
Energy purchased for resale (Itaipu) - - 1,919 -
ESS - - 37,599 -
Other financial components - - 2,394 -
- - 41,912 -
184,747 52,086 41,912 45,274
Current Liabilities Noncurrent Liabilities
37.2 Changes in assets and liabilities
. Balance as of Balance as ofJanuary 01, 2014 Differ. Amortiz. Correction Transf. Jun e 30, 2014
AssetsCCC 3,779 8,508 (3,948) 169 - 8,508
Charges for use of transmission system (basic grid) 38,091 (4,285) (1,004) 3,277 - 36,079 Energy purchased for resale (Itaipu) 5 4,705 (5) 233 - 4,938
CDE - 11,855 - 176 - 12,031 Proinfa 5,842 8,504 (5,770) 631 - 9,207
Energy purchased for resale (CVA Energ) 147,284 392,917 (4,614) 9,746 - 545,333 Transport of energy purchased (Itaipu) - 414 - 17 - 431
Other f inancial components 320,602 256,569 (45,147) 27,962 - 559,986
515,603 679,187 (60,488) 42,211 - 1,176,513
Current 287,799 (21,954) (60,488) 14,784 319,509 539,650 Noncurrent 227,804 701,141 - 27,427 (319,509) 636,863
Liabilities
Energy purchased for resale (Itaipu) 7,506 (5,112) - (475) - 1,919
ESS 79,904 111,591 (684) 10,194 - 201,005 CDE 3,025 (173) (2,984) 132 - -
Transport of energy purchased (Itaipu) 701 (40) (692) 31 - - Other f inancial components 6,224 19,131 (2,616) 996 - 23,735
97,360 125,397 (6,976) 10,878 - 226,659
Current 52,086 67,081 (6,976) 9,079 63,477 184,747 Noncurrent 45,274 58,316 - 1,799 (63,477) 41,912

97
38 Law 12.973 of May 15, 2014
On May 15, 2014, Executive Act 617 issued on November 11, 2013 was converted into Law
12,973. Under the law, companies are granted the (irrevocable) option of applying its provisions as
from January 1, 2014. Management does not intend to adopt the provisions earlier, however the
law is being evaluated by the Company. Moreover, the Company is waiting for some explanations
that will be given by a regulation to be issued by the Brazilian Federal Revenue Service.

98
COMMENTS ON PERFORMANCE FOR THE PERIOD
for the six-month periods ended June 30, 2014
(Amounts expressed in thousands of reais, except wh en stated otherwise)
1 Distribution Lines
Compact Grids - Copel has implemented compact networks in urban areas with significant urban
forestry close to the distribution grids. This technology avoids having to prune and cut trees and
improves the quality of the supply, since it reduces the number of disconnections. At the end of
June 2014, the extension of the compact grids installed was 5,794 km (4,554 km at June 2013), the
extension of the compact grids installed was 1,240 km in 12 months, a variation of 27.2%.
Isolated Secondary Grid - Copel is also investing in secondary isolated grids for low voltage
(127/220 V), which provide significant advantages compared to the conventional aerial grid, such
as: improvement in the DEC and FEC indices, increased difficulty for electric energy stealing,
improvement in the environmental conditions and reduction to the pruned area, increased safety,
reduction to the drops in voltage throughout the network, and increased useful life of the
transformers from the decrease in the number of short circuits in the network, amongst others. By
the end of June 2014, the extent of the installed secondary isolated distribution grids was 11,338
km (9,746 km in June 2013), representing an increase of 1,592 km in the previous 12 months,
variation of 16.3%.

99
2 Energy Market
Market behavior - The energy generated by Copel during the first six months of 2014 was 11,784
GWh (10,172 GWh in the same period for 2013). The energy purchased from CCEAR (auctions)
was 7,344 GWh (7,422 GWh in the same period for 2013) and from Itaipu it was 2,911 GWh (2,569
GWh in the same period for 2013), as demonstrated in the following flow chart:
Energy flow (GWh) (a) (b) January to June 2014
Ow n generation
11,784 44.8%
Available
Received energy 26,319
14,535 - 55.2%
CCEAR 7,344
Itaipu 2,911
Itiquira 452 Bi-lateral contracts 3,717
Dona Francisca 303 CCEAR 2,549
CCEE(MCP) 1,491 CCEE(MCP) 1,237
Angra 519 MRE 2,333
CCGF 651
MRE -
Elejor 588
Proinfa 276 Losses basic grid 705
Distribution losses 1,207
Allocation of contratcs in CG 163
Not considering the energy produced by TPP Araucária (1,499.8 GWh), w hich w as sold in the short-term market (MCP).
Captive market 12,062 -
1.3%-
9,836
45.8%
Concessionaries 345
Losses and differences 2,075 - 7.9%
7.6%
Supplied energy 37.4%-
CG = Center of gravity of submarket (dif ference betw een energy contracted and received in CG -established in the contract).
Free customers
(a) The energy negotiated betw een the subsidiaries Copel has been included.
(b) Subject to alterations after closing by CCEE
CCEAR= Contracts for sale of Energy on Regulated Environment
CCEE(MCP)= Electric Pow er Trade Chamber (Short term market)
MRE= Mechanism for rellocation of energy
2,001 -

100
Sale of energy - The following table presents total energy sales by Copel between Copel
Distribuição and Copel Geração e Transmissão:
Class In GWh
January to June 2014
January to June 2013 Variation
Copel DistribuiçãoCaptive market 12,062 11,381 6.0%
Residential 3,672 3,396 8.1%Industrial 3,288 3,242 1.4%Commercial 2,740 2,552 7.4%Rural 1,186 1,072 10.6%Others 1,176 1,119 5.1%
Concessionaries and permission holder (a) 345 280 23.2%CCEE (MCP) (b) - - - Total Copel Distribuição 12,407 11,661 6.4%
Copel Geração e Transmissão
CCEAR (Copel Distribuição) (c) 197 433 -54.5%
CCEAR (other concessionaries) (c) 2,352 3,213 -26.8%
Free customers 2,001 2,025 -1.2%
Bi-lateral contracts 3,717 2,603 42.8%
CCEE(MCP) 1,069 1,810 -
Total Copel Geração e Transmissão 9,336 10,084 -7.4%
Total 21,743 21,745 -
P.S. Does not include energy available througt MRE (Mechanism for reallocation of energy)
(b) CCEE(MCP): Electric Pow er Trade Chamber (Short term market)
(c) CCEAR: Contracts for sale of Energy on Regulated Environment
(a) Include the 46 GWh Dealer CFLO consumed in the months of February and March
Captive market of Copel Distribuição - The sale of energy to Copel Distribuição's captive market
totaled 12,062 GWh in the first half of 14, up 6.0% when compared with the same period in 2013,
mainly due to the increase in average consumption and in the client base in the period.
The residential segment consumed 3,672 GWh between January and June 2014, up 8.1% due to
the increase in the number of consumers and in average consumption, as a result of favorable
income and job levels and to the above-average temperatures recorded in the period. At the end of
June 2014, this segment accounted for 30.4% of Copel’s captive market, totaling 3,386,848
residential customers.
Industries consumed 1.4% more energy in the first half of 2014, totaling 3,288 GWh, a result
caused by the good performance of Parana State industrial sector, particularly food, timber and oil
by-product companies. At the close of the period, the industrial segment represented 27.3% of
Copel’s captive market, with a total of 91,299 industrial customers.

101
The commercial class consumed 2,740 GWh which represents an increase of 7.4% over the same
period last year, mainly impacted by high level temperatures recorded in the period and expansion
of the segment. At the end of June 2014, this segment represented 22.7% of Copel’s captive
market, with a total of 348,381 customers.
Rural consumers acquired 1,186 GWh of electricity, up 10.7% in the first six months of the year, an
effect of the good performance of the Parana State agribusiness industry. At the end of June 2014,
this segment represented 9.8% of Copel’s captive market, with a total of 372,711 rural customers.
The other segments (public agencies, public lighting, public services and own consumption)
consumed 1,176 GWh, up 5.2% for the period. Taken together, these segments represented 9.8%
of Copel’s captive market, totaling 56,565 customers at the end of the period.
Number of consumers - The number of end customers (captive from Copel Distribuição plus free
customers from Copel Geração e Transmissão) billed in June 2014 was 4,255,833, representing
an increase of 3.9% compared to the same month in 2013.
Class June 2014 June 2013 Variation
Residential 3,386,848 3,250,753 4.2%Industrial 91,299 90,472 0.9%
Commercial 348,381 332,585 4.7%
Rural 372,711 367,741 1.4%
Others 56,565 55,019 2.8%
Total Captive 4,255,804 4,096,570 3.9%Free customers - Copel Geração e Transmissão 29 29 -
Total 4,255,833 4,096,599 3.9%
3 Administration
Number of employees
Employees June 2014 June 2013
Owned subsidiariesCopel 607 -
Copel Geração e Transmissão 1,508 1,814
Copel Distribuição 6,000 7,064
Copel Telecomunicações 436 462
Copel Participações 10 -
Copel Renováveis 12 -
8,573 9,340 Subsidiaries
Compagás 156 144
Elejor 7 8
UEG Araucária 14 10
177 162

102
4 Market relations
From January to June 2014, the nominative ordinary shares (ON - code CPLE3) and the
nominative preference shares class B (PNB - code CPLE6) of Copel were present on 100% of the
floors of the Stock, Futures and Commodities Exchange, (BM&FBOVESPA).
The shares for trading amounted 45% of the Company’s capital. At the end of June 2014, the
market value of Copel, considering quotations from all of the markets, was R$ 7,758,585.
Of the 70 securities that comprise the theoretical portfolio of Ibovespa, the PNB shares in Copel
participated with 0.39% and with a Beta index of 0.64.
In the IEE portfolio (Index for the Energy Sector), Copel participated with 6.64%.
Copel’s participation in the Business Sustainability Index BM&FBOVESPA (ISE) was 1.05%.
On the BM&FBOVESPA, the ordinary shares closed the period quoted at R$ 23.50 and the
preference shares at R$ 33.88, with increases of 5.4% and 11.0%, respectively, compared to
December 31, 2013. During the same period the IBOVESPA reported a negative variation of 3.2%.
On the New York Stock Exchange (NYSE), the preference shares are traded at “Level 3” in the
form of ADS’s, under the code ELP, which were present on 100% of the floors, closing the period
quoted at US$ 15.31 with a positive variation of 16.5% compared to December 31, 2013. During
the same period the DOW JONES index reported a positive variation of 1,5%.
On the LATIBEX (Latin American Exchange Market in Euros) tied to the Madrid Stock Exchange,
the Company’s PNB shares are traded under the code XCOP, and were present on 97% of the
floors, closing the second quarter quoted at € 11.14 representing a variation of 17.3% compared to
December 31, 2013. During the same period the LATIBEX All Shares reported a negative variation
of 0.9%.
The following table summarizes the behavior of Copel's shares in the first six-month in 2014:
Share performance - January to June 2014 Total Daily average Total Daily average
BovespaTraded 25,746 213 388,504 3,211
Quantity 11,380,100 94,050 73,306,600 605,840
Volume (R$ thousand) 236,228 1,952 2,174,244 17,969
Presence on ex changes 121 100% 121 100%
NyseQuantity 301,957 5,697 70,892,409 571,713
Volume (US$ thousand) 3,080 58 922,123 7,436
Presence on ex changes 53 43% 124 100%
LatibexQuantity - - 209,320 1,730
Volume (€ thousand) - - 2,015 17
Presence on ex changes - - 121 97%
PNB ON

103
5 Tariffs
Energy Supplies
Average supply tariffs (a) - R$/MWh June 2014 June 2 013 Variation
Residential 263.50 242.55 8.6%
Industrial (b) 207.75 189.05 9.9%
Commercial 241.04 220.00 9.6%
Rural 161.13 146.04 10.3%Others 185.71 168.13 10.5%
225.56 206.15 9.4%
(a) Without ICM S
(b) Does no t inclued free customers
Purchasing Energy
Tariffs for purchase of energy - R$/MWh June 2014 Ju ne 2013 VariationItaipu (a) 129.08 123.93 4.2%
Auction 2007 - 2014 164.88 140.89 17.0%
Auction 2008 - 2015 126.61 118.94 6.4%
Auction 2010 - H30 178.89 168.17 6.4%
Auction 2010 - T15 (b) 189.41 178.06 6.4%
Auction 2011 - H30 183.66 172.65 6.4%
Auction 2011 - T15 (b) 208.85 196.33 6.4%
Auction 2012 - T15 (b) 187.36 176.13 6.4%
Auction CCEAR 2014 - 2019 (c) 448.82 - - Auction CCEAR 2014 - 2019 (d) 270.81 - - Auction 2014 - 12M 191.41 - - Auction 2014 - 18M 165.20 - - Auction 2014 - 36M 149.99 - - Bilaterals 189.55 176.58 7.3%
ANGRA 150.83 137.55 9.7%CCGF (e) 32.22 33.38 -3.5%
Santo Antonio 108.60 102.00 6.5%
Jirau 95.52 89.72 6.5%
Others Auctions (f) 226.44 168.54 34.4%
Average (g) 174.40 129.59 34.6%
(a) Furnas transport charge not included.
(b) Average auction price restated according to the IPCA inflation index. The price comprises in fact three components:a f ixed component, a variable component, and expenses at the Electric Energy Trading Chamber (CCEE). The cost of
the latter tw o components is dependent upon the dispatch of facilities according to the schedule set by the
National System Operator (ONS).
(c) Availability
(d) Quantity
(e) Contract of quotas of assured pow er of those HPPs w hich concessions w ere extended pursuant the new rules of
Law 12,783/13.
(f) Products average price.
(g) Takes the amount of 812 average MW related to auction 2006-2013 to calculate June 2013 (R$ 100.63).

104
Supply of power
Sales do Distributors Average Tariff - R$/MWh June 2014 June 2013 VariationAuction - CCEAR 2007-2014 118.77 111.89 6.1%
Auction - CCEAR 2008-2015 126.86 119.48 6.2%
Auction - CCEAR 2009-2016 144.31 135.95 6.1%Auction - CCEAR 2011-2040 164.82 155.15 6.2%Auction - CCEAR 2013-2042 177.28 140.37 26.0%
Auction - CCEAR 2014 191.80 - - Concession holders in the State of Paraná 153.40 134.90 13.7%
6 Economic Financial Results
Operating Revenues (NE nº 30)
At June 2014, the net income from sales and services reached R$ 6,169,246, an increase of 37.7%
compared to the amount of R$ 4,481,542 registered to June 2013.
This variation was due mainly to the following factors:
a) 18.4% increase in the revenue from electric power supply mainly due to the tariff adjustment in
June 2013 and the increase in the market;
b) 113.2% increase in revenue from “electricity sales to distributors” due to variation of the Price
for Settlement of Difference (PLD) and income from the sale of energy produced by UEG
Araucária;
c) 36.3% increase in the Revenue from Construction. The Company records revenues related to
construction services or infrastructure improvement used in the rendering of distribution and
electricity transmission services, which total R$ 626,559 in June 2014 and R$ 459.685 million
for the same period in 2013. Corresponding expenditures are recognized in the statement of
income for the period, such as construction cost, as incurred; and
d) 47.4% decrease in “other operating revenues”, mainly caused by the termination of the lease of
the Araucária thermal plant with Petrobras.
Operational costs and expenses (Note 31)
At the end of June 2014, total operational costs and expenses amounted to R$ 5,236,648, which
represented an increase of 41.5% compared to the R$ 3,702,113 registered in the same period for
2013. The main highlights are as follows:
a) 43.4% increase in the account Electricity acquired for resale especially due to greater amount
of electricity acquired at the Electric Power Trading Chamber – CCEE and at CCEAR; offset by
the receipt of funds from the CDE to reimburse energy costs the amount of R$ 787,871;

105
b) increase by 44.0% in electricity network use charges, due mainly to the pass-on of funds from
the energy development account in 2013;
c) 7.9% decrease in relation to the same period in 2013 in the Personnel and Management
account balance, due to the lower expenses on remuneration and charges due to the reduction
in the number of employees in the period;
d) 12.7% increase in the Pension Fund and Welfare Plans mainly due to the effects arising from
the actuarial assessment, which was performed by an actuary engaged to perform such
calculations;
e) 399.3% increase in Natural Gas and supplies for the gas business resulting from the purchase
of gas for UEG Araucária.
Financial Results (NE nº 32)
Increase of 2.7% in financial results was mainly due to:
a) increase by 27.4% in finance income resulting from the higher late payment charges on
electricity bills and the higher income from financial investments; and
b) increase by 51.6% in finance costs mainly due to the higher amount of debt charges as a result
of the inflow of funds in the period.
Ebitda
Ebitda (earnings before interest, taxes, depreciation and amortization) reached R$ 1,325,342 in
June 2014, 20.07% greater than that reported for the same period of the previous year, as
demonstrated below:
Consolidated 06.30.2014 06.30.2013
Net income for the period 831,306 650,271
Deferred IRPJ and CSLL (209,867) (128,656)
Provision for IRPJ and CSLL 548,771 438,740
Financial expenses (income), net (153,030) (148,956)
Lajir/Ebit 1,017,180 811,399 Depreciation and amortization 308,162 292,412
Lajida/Ebitda 1,325,342 1,103,811 Net operational results - ROL 6,169,246 4,481,542
Ebitda% (Ebitda ÷ ROL) 21.5% 24.6%

106
GROUPS IN CHARGE OF GOVERNANCE
BOARD OF DIRECTORS Chairman MAURICIO SCHULMAN
Executive Secretary LINDOLFO ZIMMER Members CARLOS HOMERO GIACOMINI
MAURICIO BORGES LEMOS JOSÉ RICHA FILHO LUIZ EDUARDO DA VEIGA SEBASTIANI MARCO AURÉLIO ROGERI ARMELIN NATALINO DAS NEVES NEY AMILTON CALDAS FERREIRA
AUDIT COMMITTEE Chairman CARLOS HOMERO GIACOMINI Members JOSÉ RICHA FILHO
LUIZ EDUARDO DA VEIGA SEBASTIANI
FISCAL COUNCIL Chairman JOAQUIM ANTONIO GUIMARÃES DE OLIVEIRA
PORTES Full Members NELSON LEAL JUNIOR
JOSÉ TAVARES DA SILVA NETO VACANT CARLOS EDUARDO PARENTE DE OLIVEIRA ALVES
Alternate Members OSNI RISTOW ROBERTO BRUNNER GILMAR MENDES LOURENÇO VACANT FLAVIO JARCZUN KAC
BOARD OF DIRECTORS Chief Executive Officer LINDOLFO ZIMMER
Chief Corporate Management Officer MARCOS DOMAKOSKI Chief Financial and Investor Relations Officer
Chief Institutional Relations Officer ANTONIO SERGIO DE SOUZA GUETTER DENISE CAMPANHOLO BUSETTI SABBAG
Chief Business Development Officer JONEL NAZARENO IURK Deputy Director PAULO CESAR KRAUSS ACCOUNTANT
Accountant - CRC-PR-041655/O-6 NANCY ATENALIA ALVES
INFORMATION ON THIS REPORT
[email protected] Fone: +55 (41) 3331-4051
Others Informations Fone: +55 (41) 3222-2027 / 3331-4359
Fax: +55 (41) 3331-2849

107
INDEPENDENT AUDITORS’ REVIEW REPORT
To the Shareholders and Management
Companhia Paranaense de Energia - COPEL
Curitiba – PR
We have reviewed the individual and consolidated interim financial information of Companhia
Paranaense de Energia - COPEL included in the Quarterly Information Forms, for the quarter
ended June 30, 2014, which include the statement of financial position at June 30, 2014 and the
related statements of income and comprehensive income for the three-month and six-month
periods then ended, and the statements of changes in equity and cash flows for the six-month
period then ended, including a summary of the significant accounting practices and other notes to
the financial statements.
Management is responsible for preparing and presenting the individual and consolidated interim
financial information in accordance with Technical Pronouncement CPC 21 (R1) – Interim
Statements and consolidated interim financial statements and with the international standard IAS
34 – Interim Financial Reporting, issued by the International Accounting Standards Board – IASB,
and for presenting this information in a manner consistent with the norms issued by the Brazilian
Securities and Exchange Commission (CVM), applicable for preparing Quarterly Information - ITR.
Our responsibility is to express a conclusion on this interim financial information based on our
review.
Extent of our review
We performed our review in accordance with Brazilian and international standards for reviewing
interim information (NBC TR 2410 – Review of Interim Information Performed by the Entity’s
Auditors and ISRE 2410 - Review of Interim Financial Information Performed by the Independent
Auditor of the Entity, respectively). A review of interim information consists of making enquiries,
mainly of persons responsible for financial and accounting issues and applying analytical
procedures and other review procedures. The extent of our review is significantly less than that for
an audit undertaken in accordance with auditing standards and consequently, did not enable us to
obtain assurance that we were informed of all of the significant issues that could be identified
during an audit. Therefore, we do not express an audit opinion.
Unqualified conclusion on the individual interim fi nancial information

108
Based on our review, we are not aware of any fact that would lead us to believe that the individual
interim financial information included in the quarterly information referred to above, have not been
prepared, in all material respects, according to CPC Pronouncement 21(R1) applicable to the
preparation of quarterly information or have not been disclosed in accordance with the standards
issued by the Brazilian Securities and Exchange Commission.
Unqualified conclusion on the consolidated interim financial information
Based on our review, we are not aware of any fact that would lead us to believe that the
consolidated interim financial information included in the quarterly information referred to above,
have not been prepared, in all material respects, according to CPC Pronouncement 21(R1) and
IAS 34 applicable to the preparation of quarterly information and have not been disclosed in
accordance with the standards issued by the Brazilian Securities and Exchange Commission.
Other issues
Statements of added value
We also reviewed the individual and consolidated interim statements of added value, for the six-
month period ended June 30, 2014, which are management’s responsibility and presentation of
which in the interim statements is required according to the norms issued by the Brazilian
Securities and Exchange Commission, applicable for preparing Quarterly Information - ITR and
considered supplementary information by the IFRS, which do not require a statement of added
value to be reported. These statements were subject to the same review procedures described
previously, and based on our review, we are not aware of any fact that would leads us to believe
that they were not prepared, in all material respects, in accordance with the interim individual and
consolidated financial information taken as a whole.
Curitiba, August 12, 2014
KPMG Auditores Independentes
CRC 2SP014428/O-6-F-PR
A free translation of the original report signed in Portuguese
João Alberto Dias Panceri
Accountant CRC PR048555/O-2