Iteractively querying Google Analytics reports from R using ganalytics
59
Taking Google Analytics to the next level Johann de Boer, digital analytics consultant and trainer
-
Upload
johann-de-boer -
Category
Data & Analytics
-
view
13.709 -
download
0
Transcript of Iteractively querying Google Analytics reports from R using ganalytics

Taking Google Analytics to the next levelJohann de Boer, digital analytics consultant and trainer

Johann de Boer
● Digital Analytics consultant and trainer● Loves Data● Master of Analytics (Marketing)● Bachelor of Engineering (Computer Systems)● From user experience and accessibility● To analytics implementation and insights

Purpose of this talk
Encourage web data analysts to move to R and away from Excel!
Help those wanting to learn R to get started.

What is R?
● open-source programming language● purpose built for data analysis● World domination!

Interfacing with Google Analytics
Data Collection
APIs
Management API
Reporting APIs
Big Query

GA API platform overview● Collection APIs
○ Collect and send data to Google Analytics for storage and processing
● Management API
○ Configure Google Analytics accounts
○ Import off-line data
● Reporting APIs
○ Query and extract processed data from Google Analytics for reporting

Why use the Reporting APIs?● Surpass the limits of the GA user interface
● Automate repetitive tasks
● Perform more powerful data analysis
● Easily reproduce and reuse analyses
● Combine with other data sources
● Develop innovative tools
● Feed into other tools and applications

API conceptsYour application
Reporting API
Query(GET)
Response(JSON)

API QueryAuthorization: Bearer {oauth2-token}
GET https://www.googleapis.com/analytics/v3/data/ga?
ids=ga:98765432&
start-date=2014-01-01&
end-date=2014-01-31&
metrics=ga:sessions&
dimensions=ga:landingPagePath&
sort=-ga:sessions&
filters=ga:medium==organic&
segment=users::condition::ga:goalCompletionsAll>0&
samplingLevel=HIGHER_PRECISION&
start-index=1&
max-results=10000

API Response{
"kind": "analytics#gaData", "id": string, "selfLink": string,
"containsSampledData": boolean,
"query": {
...
},
"itemsPerPage": integer,
"totalResults": integer,
"previousLink": string,
"nextLink": string,
"profileInfo": {
...
},
"columnHeaders": [ { "name": string, "columnType": string, "dataType": string }, ... ], "rows": [ [string, ...], ... ], "sampleSize": string, "sampleSpace": string, "totalsForAllResults": [{ metricName: string, ... }]}

Query Explorer

Expressing yourself with GA
Explaining the steps you followed to put together a data analysis report:
● precisely and accurately● using natural language but without ambiguity● so that others can reproduce that report without error, and● can reuse your steps to save time in pursuing other analysis ideas

Google Analytics Reporting Query
1. Account Property View
2. Date Range: Start Date and End Date
3. Variables to form rows and columns: Dimensions and Metrics
4. Maximum Rows and which variables to Sort By
5. Table Filters to remove unwanted rows
6. One or more Segments to compare

Account Property View
Date Range
Table Filter
Segmentation
Sampling Level
Dimensions Metrics
Maximum Rows


library(ganalytics)my_creds <- GoogleApiCreds("[email protected]")
q <- GaQuery(view = 67809522, creds = my_creds)
DateRange(q) <- c("2015-10-27", "2015-11-26")Dimensions(q) <- c("userGender", "deviceCategory", "channelGroup")Metrics(q) <- c("users", "sessions", "pageviews")
GetGaData(q)

Conditions for Table Filters and Segments
Conditions are expressed as:
~ <variable> <comparator> <operand>
Examples:
~ UserGender == 'female'
~ Bounces > 0
~ Hour in 0, 1, 2, 3, 4, 5, 6, 7, 8, 9, 10, 11

Using conditions to form expressions
Combine one or more conditions with AND, OR
Define User and Session level segments
Define Sequences used for segmentation
First, Then, Later
Scope conditions to hit, session or user level

Sequence segments
users::sequence::ga:eventCategory==Video;ga:eventAction==Play;->perHit::ga:goal1Completions>0
played_video <- Expr(~EventCategory == "Video") & Expr(~EventAction == "Play")
purchased_ticket <- PerHit( Expr(~goal1completions > 0) )
journey <- PerUser(Sequence( played_video, Then(purchased_ticket)))

Google Analytics User Conference 2014 #GAUC2014
ganalytics for R

Goals of the ‘ganalytics’ R package● Access to all Google Analytics features
● Easy to use, familiar to R users and in GA lingo
● Abstract away from API technicalities
● Interactively build and manipulate queries
● Detect and correct query definition errors
● Integrate with R classes, functions and other packages

Getting started

Installation and “Hello World!”devtools::install_github("jdeboer/ganalytics")
library(ganalytics)
creds <- GoogleApiCreds( "[email protected]", # Your Google username "client_secret.json" # From Google APIs console)
# Default view of first account and propertyview <- NA
query <- GaQuery(view, creds)
GetGaData(query)

“Hello World!” of ganalytics

Google Analytics User Conference 2014 #GAUC2014
Defining your query and getting data into R with
ganalytics

Example queryquery <- GaQuery( view = 94605596, startDate = "2015-01-01", endDate = "2015-01-31", metrics = c("users", "sessions", "pageviews"), dimensions = c("deviceCategory", "dayOfWeekName"), filter = Expr(~deviceCategory %matches% "mobile|tablet"), segment = Expr(~country == "Australia"))
response <- GetGaData(query)

Example query response deviceCategory dayOfWeekName users sessions pageviews1 mobile Friday 429 500 8162 mobile Monday 273 329 4663 mobile Saturday 339 399 6404 mobile Sunday 256 301 4875 mobile Thursday 420 475 6896 mobile Tuesday 314 358 5427 mobile Wednesday 304 357 5718 tablet Friday 209 235 4249 tablet Monday 160 190 35510 tablet Saturday 195 225 43511 tablet Sunday 128 151 33412 tablet Thursday 217 266 45513 tablet Tuesday 169 194 37414 tablet Wednesday 161 178 356

Conditional expressionsexpr1 <- Expr(~variable comparator value)expr2...
expr3 <- expr1 | !expr2expr5 <- expr3 & expr4expr6 <- xor(expr1, expr2)
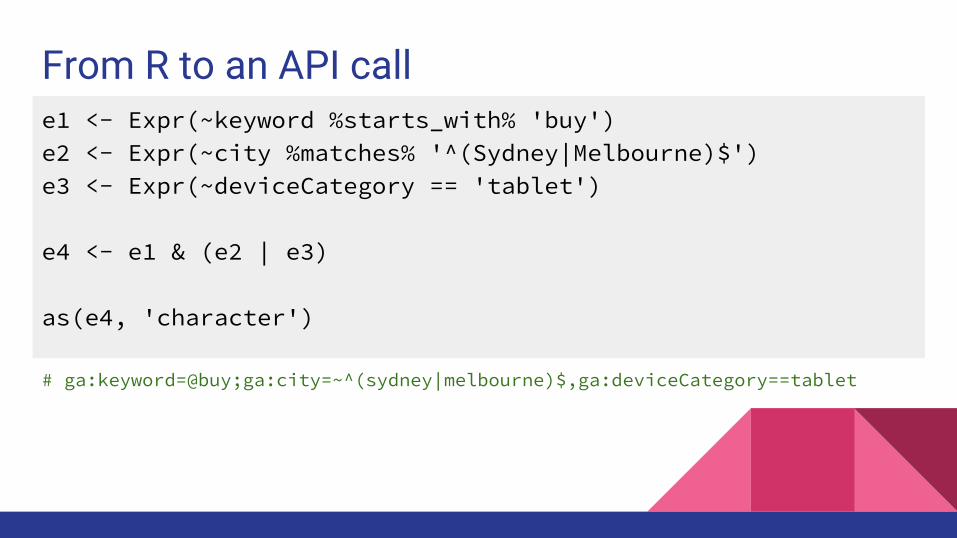
From R to an API calle1 <- Expr(~keyword %starts_with% 'buy')e2 <- Expr(~city %matches% '^(Sydney|Melbourne)$')e3 <- Expr(~deviceCategory == 'tablet')
e4 <- e1 & (e2 | e3)
as(e4, 'character')
# ga:keyword=@buy;ga:city=~^(sydney|melbourne)$,ga:deviceCategory==tablet

How does traffic from desktop, mobile and tablet users change throughout the day and over the week?
Average number of visits per hour and day – split by desktop, mobile and tablet

Step 1: Define the queryquery <- GaQuery(view = '98765432')
DateRange(query) <- c("2014-01-01", "2014-12-31")
Dimensions(query) <- c( "deviceCategory", "dayOfWeekName", "hour", "date")
Metrics(query) <- "sessions"
MaxResults(query) <- 30000

Step 2: Get data and summarisedata <- GetGaData(query)
library(dplyr)
weekly_data <- tbl_df(data) %>% group_by(deviceCategory, dayOfWeekName, hour) %>% summarise(avg_sessions_per_day = mean(sessions))
# deviceCategory dayOfWeekName hour avg_sessions_per_day#1 desktop Friday 0 83.83673#2 desktop Friday 1 81.79167#3 desktop Friday 2 77.29167#4 desktop Friday 3 80.35417#5 desktop Friday 4 91.60417#.. ... ... ... ...

Step 3: Plot the summarylibrary(ggplot2)
ggplot(weekly_data) + aes( x = hour, y = avg_sessions_per_day, fill = deviceCategory, group = deviceCategory ) + geom_area(position = "stack") + facet_wrap(~dayOfWeekName)

ggplot2 + dplyr + ganalytics =

Which permutation of two different device types are signed-in users most likely to transition between?
Define sequences to segment users by permutations of device type and compare against total users of each type of device.

Step 1: Setup query (needs UserID)Dimensions(query) <- NULL
Metrics(query) <- c("users")
DateRange(query) <- c("2015-01-01", "2015-03-31")# Maximum of 90 days for user-based segmentation

Step 2: Define sequence segmentsdevices <- list( desktop = Expr(~deviceCategory == "desktop"), mobile = Expr(~deviceCategory == "mobile"), tablet = Expr(~deviceCategory == "tablet"))
device_sequences <- lapply(devices, function(from) { lapply(devices, function(to) { SegmentFilters( Sequence(First(from), Then(to)), scope = "users" ) })})

Step 3: Get data for each segmentdata <- lapply(seq_along(device_sequences), function(from_index){ from_name <- names(device_sequences)[from_index] from_seq <- device_sequences[[from_index]] lapply(seq_along(from_seq), function(to_index){ to_name <- names(from_seq)[to_index] Segment(query) <- from_seq[[to_index]] df <- GetGaData(query) df <- cbind(from = from_name, to = to_name, df) })})
data <- unlist(data, recursive = FALSE)data <- do.call(rbind, data)

Step 4: Summarise the datalibrary(dplyr)
benchmarks <- data %>% subset(from == to) %>% select(from, benchmark = users)
data <- data %>% subset(from != to) %>% inner_join(benchmarks, by = "from") %>% group_by(from, to) %>% summarise(transitioned = users / benchmark)
# from to transitioned# 1 desktop mobile 0.05565673# 2 desktop tablet 0.02547988# 3 mobile desktop 0.16147748# 4 mobile tablet 0.03634899# 5 tablet desktop 0.15945559# 6 tablet mobile 0.07034457

Step 5: Plot the resultslibrary(ggplot2, scales)
ggplot(data) + aes(x = from, y = to, fill = transitioned) + geom_tile() + scale_fill_continuous(labels = percent) + theme_minimal(base_size = 18) + theme(axis.title.y = element_text(angle = 0))

Google Analytics User Conference 2014 #GAUC2014
Custom FunnelsWhere are shoppers likely to drop out of your ecommerce website?

Custom Funnels: GA Premium● A linear sequence of stages like a goal funnel:
○ Restricted to only five stages
● Apply retrospectively
● Beyond just pageviews, e.g. campaigns, events
● Session-based like goals or user-based
● Like the enhanced ecommerce funnel reports:
○ Create segments on-the-go

Cart
Checkout
Billing Address
Shipping Options
Payment Method
Submit Order
Custom funnels for everyone else1. Create segments for:
a. each stage in the funnel
b. the sequence of steps required to reach that stage
2. Get the number of users for each segment
3. Calculate:
a. Entrances and exits for each stage
b. Abandonment and conversion rates

Count traffic at each funnel stage● Cart
users::condition::pagePath=~cart$

Count traffic at each funnel stage● Cart =
users::condition::pagePath=~cart$● Checkout =
users::condition::pagePath=~checkout$● Billing Address =
users::condition::pagePath=~billingaddress$● Shipping Options =
users::condition::pagePath=~shippingoptions$● Payment Method = users::condition::
pagePath=~paymentmethod$● Submit Order =
users::condition::pagePath=~submitorder$

Count path completions● users::sequence::● pagePath=~cart$● ;->>pagePath=~checkout$● ;->>pagePath=~billingaddress$● ;->>pagePath=~shippingoptions$● ;->>pagePath=~paymentmethod$● ;->>pagePath=~submitorder$


Google Analytics User Conference 2014 #GAUC2014
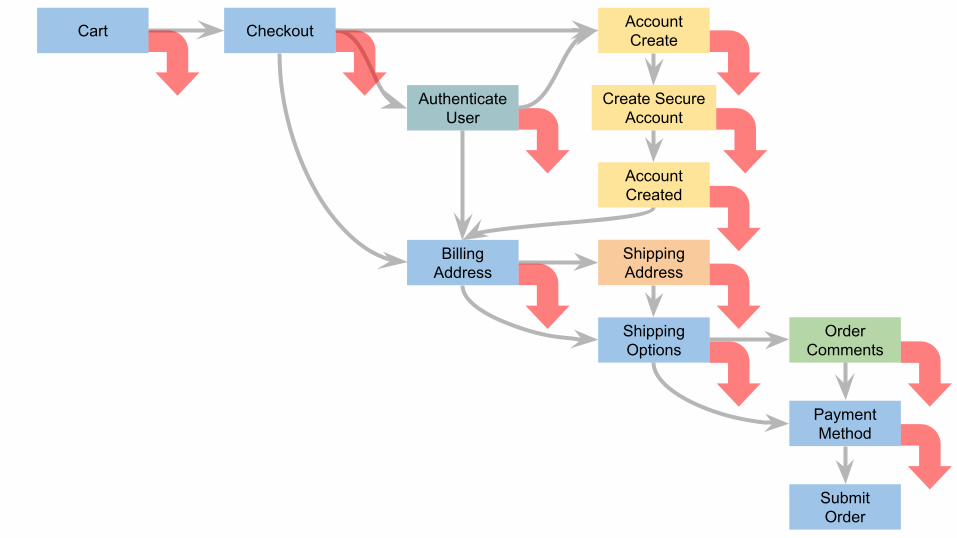
Conversion funnel analysis with R
Cart Checkout
Billing Address
Shipping Options
Payment Method
Submit Order
Authenticate User
Account Create
Create Secure Account
Account Created
Shipping Address
Order Comments

Cart
Checkout
Billing Address
Shipping Options
Payment Method
Submit Order
Authenticate User
Checkout
Billing Address
Account Create
Create Secure Account
Account Created
Checkout
Billing Address
Account Create
Authenticate User
Shipping Address
Billing Address
Shipping Options
Order Comments
Shipping Options
Payment Method
16 transitions (5 are shortcuts), and 16 routes from start to end.


#2015AC
Using Rquery <- GaQuery(view = 98765432)Segment(query) <- Sequence( Cart, Checkout, BillingAddress, ShippingOptions, PaymentMethod, SubmitOrder)GetData(query)

Google Analytics User Conference 2014 #GAUC2014
Using ganalytics with other
Google Analytics APIs

Reporting APIs
GaQuery() Core Reporting API
Standard reporting over a date range
McfQuery() Multi-channel funnels reporting API
Requires conversion tracking to be set up (goals or ecommerce)
RtQuery() Real-time reporting API
Request developer access first

Other APIs
MetaData API Internal package use only
Management API GaAccounts()GaUserSegments()
Work in progress so please use with caution!Google Tag
Manager APIGtmAccounts()

Get involved!Open source R package development is fun!

Remaining work to complete● Package documentation
● Adding examples and demos
● Further error handling and messages
● Testing and finding bugs to fix
● Submitting to CRAN
● Code optimisation and tidy up
● Feature enhancements and improvements
● Occasional updates for API changes
● Internationalisation

GA Dashboard - Shiny R demohttps://mark.shinyapps.io/GA-dashboard-demo/by Mark Edmondson

How to get involved ...● Go to the Github site:
github.com/jdeboer/ganalytics
● Submit feedback via the issues tracker
● Get in touch on twitter: @johannux
● For slides and examples: github.com/jdeboer/waw-demo