It ti Vi lA l i fInteractive Visual Analysis of Medical Data file• Time-dependent data geometry...
26
It ti Vi lA l i f Interactive Visual Analysis of Medical Data Tutorial: Interactive Visual Analysis of Scientific Data Medical Data Steffen Oeltze
Transcript of It ti Vi lA l i fInteractive Visual Analysis of Medical Data file• Time-dependent data geometry...

I t ti Vi l A l i fInteractive Visual Analysis of Medical Data
Tutorial: Interactive Visual Analysis of Scientific Data
Medical Data
Steffen Oeltze

Outline
• MotivationMotivation
• Application Examples• Application Examples
• IVA of Perfusion Data• IVA of Perfusion Data
• Summary• Summary
Tutorial: Interactive Visual Analysis of Scientific DataSteffen Oeltze – IVA of Medical Data

Motivation
• Enormous variety of data may be acquired• Image dataImage data
• CT,MRI,US,PET,SPECT,…• Spatiotemporal, multi-field and multi-modal data• Additional data derived from measured data
• Non-image data• Laboratory tests, tissue samples, ECG, patient history,…• Very heterogeneous data
IVA• IVA can:• Guide the user to interesting portions of the complex data• Confirm or generate hypotheses based on the data• Confirm or generate hypotheses based on the data
• Data organization prior to IVA is a challenge!
Tutorial: Interactive Visual Analysis of Scientific DataSteffen Oeltze – IVA of Medical Data

Applications – Epidemiology
• Accomplishment of cohort studies• Hundreds or thousands of subjectsHundreds or thousands of subjects• Analysis of life history, risk factors and correlations• Complex heterogeneous and often longitudinal data• Complex, heterogeneous and often longitudinal data• Often, related to geographic information
St d f H lth i P i (SHIP)Study of Health in Pomerania (SHIP):•Three waves with 2500-4308 subjects•Includes extensive MRI protocol
Tutorial: Interactive Visual Analysis of Scientific DataSteffen Oeltze – IVA of Medical Data
Völzke et al., 2011Dai and Gahegan, 2005

Applications – Public Health
• IVA of electronic health records:• Diagnosing a single patient based on his/her historyDiagnosing a single patient based on his/her history• Measuring healthcare quality by analyzing multiple patients
• IVA of data from syndromic surveillance:• IVA of data from syndromic surveillance:• Detect or anticipate disease outbreaks
Tutorial: Interactive Visual Analysis of Scientific DataSteffen Oeltze – IVA of Medical Data
Wang, 2011 Maciejewski, 2011

Applications – Simulation Data
• CFD simulations, e.g., of blood flow and nasal airflow, simulation of joint kinematics and cardiac electrophysiologyj p y gy• Large, complex and often time-dependent data• Multiple computed and derived attributesMultiple computed and derived attributes• Investigation of modeling and simulation parameters
Tutorial: Interactive Visual Analysis of Scientific DataSteffen Oeltze – IVA of Medical Data
Zachow et al., 2009

Applications – Kinematics Data
• Acquired by motion tracking, imaging systems or simulations• Time-dependent data geometry changes over timeTime dependent data, geometry changes over time• Multiple computed and derived attributes• Understanding joint behavior e g for assessing fracture• Understanding joint behavior, e.g., for assessing fracture
healing or for planning and evaluating orthopedic surgery
Tutorial: Interactive Visual Analysis of Scientific DataSteffen Oeltze – IVA of Medical Data
Krekel et al., 2010 Keefe et al., 2009

Applications – DTI and rs-fMRI Data
• Diffusion Tensor Imaging (DTI) data• Water diffusion indicates direction of major fiber tractsWater diffusion indicates direction of major fiber tracts• IVA helps in exploring the very complex fiber tracts
• resting state-functional MRI (rs-fMRI) data• resting state-functional MRI (rs-fMRI) data• Measuring BOLD contrast to evaluate brain activity• IVA of functional brain connectivity• IVA of functional brain connectivity
Tutorial: Interactive Visual Analysis of Scientific DataSteffen Oeltze – IVA of Medical Data
Jianu et al., 2009 Dixhoorn et al., 2010

Interactive Visual AnalysisInteractive Visual Analysis of Perfusion Dataof Perfusion Data
B. Preim, S. Oeltze, M. Mlejnek, E. Gröller, A. Hennemuth, S. Behrens: Survey of the Visual Exploration and Analysis of Perfusion Data. IEEE Trans. Vis. Comput. Graph. 15(2): 205-220 (2009)
Tutorial: Interactive Visual Analysis of Scientific DataSteffen Oeltze – IVA of Medical Data

Medical Background
• Measuring microcirculation of blood through tissue capillaries• Capillaries below resolution of today’s scanning devicesCapillaries below resolution of today s scanning devices• Derivation of macroscopic parameters from measured data• Example parameters:• Example parameters:
• Regional blood flow,• Regional blood volume• Regional blood volume,• Capillary permeability
• Major application areas: Ischemic stroke diagnosis
http://en.wikipedia.org/wiki/Capillary
• Ischemic stroke diagnosis, • Diagnosis of Coronary Heart Disease (CHD),
Breast t mor diagnosis• Breast tumor diagnosisTutorial: Interactive Visual Analysis of Scientific Data
Steffen Oeltze – IVA of Medical Data

Perfusion Imaging
• Focus on perfusion Magnetic Resonance Imaging (MRI)• Rapid injection of contrast agent (CA) to form a bolusRapid injection of contrast agent (CA) to form a bolus• CA accumulation causes signal changes perfusion tracer • Application of fast sequences for imaging the CA’s first pass• Application of fast sequences for imaging the CA s first pass• Repeated acquisition of an image stack
© Jeff Miller, 2006
Tutorial: Interactive Visual Analysis of Scientific DataSteffen Oeltze – IVA of Medical Data

Image Data and Data Preprocessing
• Typical dataset characteristics: • Ischemic stroke diagnosis
Cerebral perfusion
Ischemic stroke diagnosis• T2-weighted imaging • 128² x 10-15, every 1-2s over 40-80s
• CHD diagnosis• T1-weighted imaging
² ²Myocardial perfusion
• 128²-256² x 3-6, every heart beat over 30-60s• Breast tumor diagnosis
• T1 weighted imaging• T1-weighted imaging• 512² x 80-100, every 2-5min over 10min
• Crucial data preprocessing steps:• Motion correction, signal intensity calibration, denoisingMotion correction, signal intensity calibration, denoising
Tutorial: Interactive Visual Analysis of Scientific DataSteffen Oeltze – IVA of Medical Data

Diagnostic Evaluation of Perfusion Data
• “Eye balling” by means of cine-movies• Time intensity curve-probing based on user-defined ROIsTime intensity curve probing based on user defined ROIs
Time intensity curve
• Evaluation based on descriptive perfusion parameters
[König et al., 2000]
Tutorial: Interactive Visual Analysis of Scientific DataSteffen Oeltze – IVA of Medical Data
[König et al., 2000]

Motivation for IVA
• Complex time-dependent and multivariate data• Non-standardized signal intensity and parameter domainsNon standardized signal intensity and parameter domains• Diagnostic evaluation requires filtering and feature detection• Research on perfusion MRI particularly in ischemic stroke• Research on perfusion MRI, particularly in ischemic stroke
and CHD diagnosis:• Which perfusion parameter(s) derived by which computational method(s)
best identify ischemic tissue?• How do varying imaging parameters and parameterizations of preprocessing
methods effect reliability of perfusion parameters and computational methods? y
IVA approach integrating techniques for data pre-processing, pp g g q p p gstatistical analysis as well as feature specification
Tutorial: Interactive Visual Analysis of Scientific DataSteffen Oeltze – IVA of Medical Data

Visual Analysis Approach
• Approach consists of components for
MeVisLabp
data preprocessing, statistical analysis, and interactive
MeVisLab
and interactive feature specification
• Each component isEach component is implemented in a different software
SimVis
program MATLAB
Tutorial: Interactive Visual Analysis of Scientific DataSteffen Oeltze – IVA of Medical Data

Principal Component Analysis
• Explains structure in the relationships between variables• Reveals redundant variables and trends in the dataReveals redundant variables and trends in the data• Variance maximum rotation of data space new pc-space• PCA results:• PCA results:
• Pcs sorted by their significance level (variance explained by pc)• Loadings representing the basis vectors of the pc-spaceLoadings representing the basis vectors of the pc space• Scores representing the coordinates in the pc-space
http://cnx.org/content/m11461/latest/
Tutorial: Interactive Visual Analysis of Scientific DataSteffen Oeltze – IVA of Medical Data

Case StudiesCase Studies
S. Oeltze, H. Doleisch, H.Hauser, P. Muigg, B. Preim: Interactive Visual Analysis of Perfusion Data. IEEE Trans. Vis. Comput. Graph. 13(6): 1392-1399 (2007)p p ( ) ( )
S. Oeltze, H. Hauser, J. Rorvik, A. Lundervold, B. Preim: Visual Analysis of Cerebral Perfusion Data -- Four Interactive Approaches and a Comparison. Proc. of ISPA (588-595), 2009
S. Glaßer, U. Preim, K.D. Tönnies, B. Preim: A visual analytics approach to diagnosis of breast DCE-MRI data. Computers & Graphics 34(5): 602-611 (2010)
U Preim S Glaßer B Preim F Fischbach J Ricke: Computer-aided diagnosis in breast DCE-MRI--
Tutorial: Interactive Visual Analysis of Scientific DataSteffen Oeltze – IVA of Medical Data
U. Preim, S. Glaßer, B. Preim, F. Fischbach, J. Ricke: Computer-aided diagnosis in breast DCE-MRI--quantification of the heterogeneity of breast lesions. Eur J Radiol 81(7):532-538 (2011)

Ischemic Stroke DiagnosisAnalysis based on descriptive
f iperfusion parameters
Smooth brushing and subsequent outlier removaloutlier removal in a parallel coordinates plot reveal ischemicreveal ischemic tissue
Tutorial: Interactive Visual Analysis of Scientific DataSteffen Oeltze – IVA of Medical Data

Ischemic Stroke DiagnosisAnalysis based on enhancement t dtrends
Brushing the firstBrushing the first two principal components yields a similaryields a similar result as compared to the parameter basedparameter-based selection
Tutorial: Interactive Visual Analysis of Scientific DataSteffen Oeltze – IVA of Medical Data

Ischemic Stroke DiagnosisAnalysis based on enhancement t dtrends
Brushing the firstBrushing the first two principal components yields a similar
PCA-basedyields a similar result as compared to the parameter basedparameter-based selection
Parameter-based
Tutorial: Interactive Visual Analysis of Scientific DataSteffen Oeltze – IVA of Medical Data

Breast Tumor Diagnosis (Video)
Watch the full video at:Watch the full video at: http://www.youtube.com/watch?v=La3plyfc4VE
Tutorial: Interactive Visual Analysis of Scientific DataSteffen Oeltze – IVA of Medical Data

Breast Tumor Diagnosis• Similarity brushing of time intensity curves for evaluating a
tumor outperforms ROI-based evaluation in physical space• User-defined ROIs may cover malignant and benign tissue
Tutorial: Interactive Visual Analysis of Scientific DataSteffen Oeltze – IVA of Medical Data
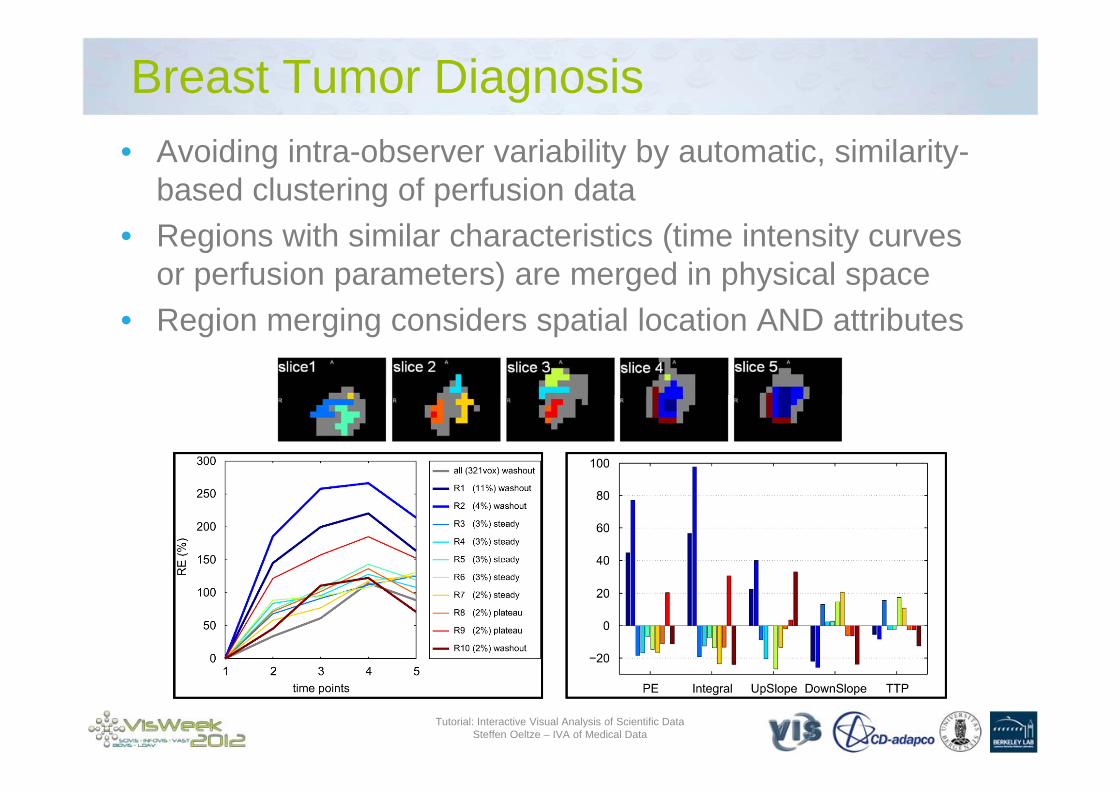
Breast Tumor Diagnosis• Avoiding intra-observer variability by automatic, similarity-
based clustering of perfusion data• Regions with similar characteristics (time intensity curves
or perfusion parameters) are merged in physical space• Region merging considers spatial location AND attributes
Tutorial: Interactive Visual Analysis of Scientific DataSteffen Oeltze – IVA of Medical Data

Summary• IVA has potential in a large variety of medical applications• Analysis of complex, heterogeneous, time-dependent data
from simulations, motion tracking, and imaging• IVA helps in:
• Filtering, guiding the user• Hypothesis generation/confirmation• Detecting correlations between attributes• Predicting disease outbreaks• Planning surgery• Understanding anatomical shape variances• Navigating complex anatomical structures• Differentiating tissue types
• But:• But: • Few documented, IVA-based clinical research results • IVA is not part of clinical routine• IVA is not part of clinical routine
Tutorial: Interactive Visual Analysis of Scientific DataSteffen Oeltze – IVA of Medical Data

Literature• S. Busking, C.P. Botha, F.H. Post: Dynamic Multi-View Exploration of Shape Spaces. Comput. Graph. Forum 29(3):
973-982 (2010)• X. Dai, M. Gahegan: Visualization Based Approach for Exploration of Health Data and Risk Factors. Proc. Of 8th
International Conference on GeoComputation, 2005.• S. Glaßer, U. Preim, K.D. Tönnies, B. Preim: A visual analytics approach to diagnosis of breast DCE-MRI data.
Computers & Graphics 34(5): 602-611 (2010)• R. Jianu, C. Demiralp, D. Laidlaw: Exploring 3D DTI Fiber Tracts with Linked 2D Representations. IEEE Trans. Vis.
Comput. Graph. 15(6): 1449-1456 (2009)D F K f M E t W Rib k R Ch I t ti C di t d M lti l Vi Vi li ti f Bi h i l• D.F. Keefe, M. Ewert, W. Ribarsky, R. Chang: Interactive Coordinated Multiple-View Visualization of Biomechanical Motion Data. IEEE Trans. Vis. Comput. Graph. 15(6): 1383-1390 (2009)
• P.R. Krekel, E.R. Valstar, J. De Groot, F.H. Post, R.G.H. H. Nelissen, C.P. Botha: Visual Analysis of Multi-Joint Kinematic Data. Comput. Graph. Forum 29(3): 1123-1132 (2010)
• M König E Klotz L Heuser: Cerebral perfusion CT: theoretical aspects methodical implementation and clinical• M. König, E. Klotz, L. Heuser: Cerebral perfusion CT: theoretical aspects, methodical implementation and clinical experience in the diagnosis of ischemic cerebral infarction. Röfo, 172(3): 210-218 (2000)
• R. Maciejewski, R. Hafen, S. Rudolph, S.G. Larew, M.A. Mitchell, W.S. Cleveland, D.S. Ebert: Forecasting Hotspots—A Predictive Analytics Approach. IEEE Trans. Vis. Comput. Graph. 17(4): 440-453 (2011)
• S. Oeltze, H. Doleisch, H.Hauser, P. Muigg, B. Preim: Interactive Visual Analysis of Perfusion Data. IEEE Trans. Vis. , , , gg, yComput. Graph. 13(6): 1392-1399 (2007)
• S. Oeltze, H. Hauser, J. Rorvik, A. Lundervold, B. Preim: Visual Analysis of Cerebral Perfusion Data -- Four Interactive Approaches and a Comparison. Proc. of ISPA (588-595), 2009
• B. Preim, S. Oeltze, M. Mlejnek, E. Gröller, A. Hennemuth, S. Behrens: Survey of the Visual Exploration and Analysis of Perfusion Data. IEEE Trans. Vis. Comput. Graph. 15(2): 205-220 (2009)
• U. Preim, S. Glaßer, B. Preim, F. Fischbach, J. Ricke: Computer-aided diagnosis in breast DCE-MRI--quantification of the heterogeneity of breast lesions. Eur J Radiol 81(7): 532-538 (2011)
Tutorial: Interactive Visual Analysis of Scientific DataSteffen Oeltze – IVA of Medical Data

Literature• A.F. van Dixhoorn, B.H. Vissers, L. Ferrarini, J. Milles, C.P. Botha: Visual Analysis of Integrated Resting State
Functional Brain Connectivity and Anatomy. Proc. of VCBM (57-64), 2010• H. Völzke et al.: Cohort profile: the study of health in Pomerania. Int J Epidemiol. 40(2): 294-307 (2011)• T.D. Wang, K. Wongsuphasawat, C. Plaisant, B. Shneiderman: Extracting insights from electronic health records: case
studies, a visual analytics process model, and design recommendations. J Med Syst. 35(5): 1135-52 (2011)• S. Zachow, P. Muigg, T. Hildebrandt, H. Doleisch, H.-C. Hege: Visual exploration of nasal airflow. IEEE Trans. Vis.
Comput. Graph. 15(6): 1407-1414 (2009)
Tutorial: Interactive Visual Analysis of Scientific DataSteffen Oeltze – IVA of Medical Data