Issues in Compensation and Profits Kurt Kunze National Economic Accounts Data Users’ Conference...
21
Issues in Compensation and Profits Kurt Kunze National Economic Accounts Data Users’ Conference October 15, 2007
-
date post
21-Dec-2015 -
Category
Documents
-
view
217 -
download
0
Transcript of Issues in Compensation and Profits Kurt Kunze National Economic Accounts Data Users’ Conference...

Issues in Compensation and Profits
Kurt Kunze National Economic Accounts Data Users’
ConferenceOctober 15, 2007

2www.bea.gov
Compensation
Compensation can be volatile and subject to large revisions
Wages and salaries Increasing impact of irregular pay
Stock options Bonuses
Pensions Lack of timely, consistent source data

3www.bea.gov
Components of CEO pay
Average chief executive officer pay (S&P 500)
0
1000
2000
3000
4000
5000
6000
7000
8000
1994 1995 1996 1997 1998 1999 2000 2001 2002 2003 2004 2005
Thousands of dollars
Salary Bonuses Options and OtherSource: Congressional testimony, Professor Steve Balsam, Temple University

4www.bea.gov
Quarterly compensation
Changes in level
-25
0
25
50
75
100
125
150
175
200
225
1990 1991 1992 1993 1994 1995 1996 1997 1998 1999 2000 2001 2002 2003 2004 2005 2006 2007
[Billions of dollars]

5www.bea.gov
Wages and salaries
Primary source data — BLS quarterly census of employment and wages (QCEW)
QCEW includes: Bonuses Gains from exercising nonqualified stock options
Data availability lag
Incorporation of quarterly QCEW Prior to 2002 — at annual revision After August 2002 — quarterly incorporation

6www.bea.gov
Annual wage and salary revisions before and after QCEW methodology change
*The average revision is the average of the absolute values of the revisions (without regard to sign)-------------------------------Source: BEA, Survey of Current Business – various issues
Average revision at first annual revision*
1998-2002 2003 -2006
$55.1
$19.9
0
10
20
30
40
50
60
[Billions of dollars]
Average revision 1998-2002
Average revision 2003-2006

7www.bea.gov
Quarterly wage and salary revisions
Revisions resulting from incorporating the QCEW
$20.8
$79.2
-$26.8
-$6.5
-$37.9
$33.3
-$110.3
-$45.5
-$17.0
-175
-150
-125
-100
-75
-50
-25
0
25
50
75
100
125
150
2005:I 2005:II 2005:III 2005:IV 2006:I 2006:II 2006:III 2006:IV 2007:I
[Billions of dollars]*
(-0.1%)
(-0.7%)
(0.4%)
(-0.8%)
(1.3%)
(-1.8%)
(-0.4%)
(0.5%)
(-0.3%)

8www.bea.gov
Quarterly unit labor costs
Percent change from proceeding quarter at annual rate
[Percent change]
-2
-1
0
1
2
3
4
5
6
7
2005Q1 2005Q2 2005Q3 2005Q4 2006Q1 2006Q2 2006Q3 2006Q4 2007Q1 2007Q2
Initial estimate First revised estimate
9www.bea.gov
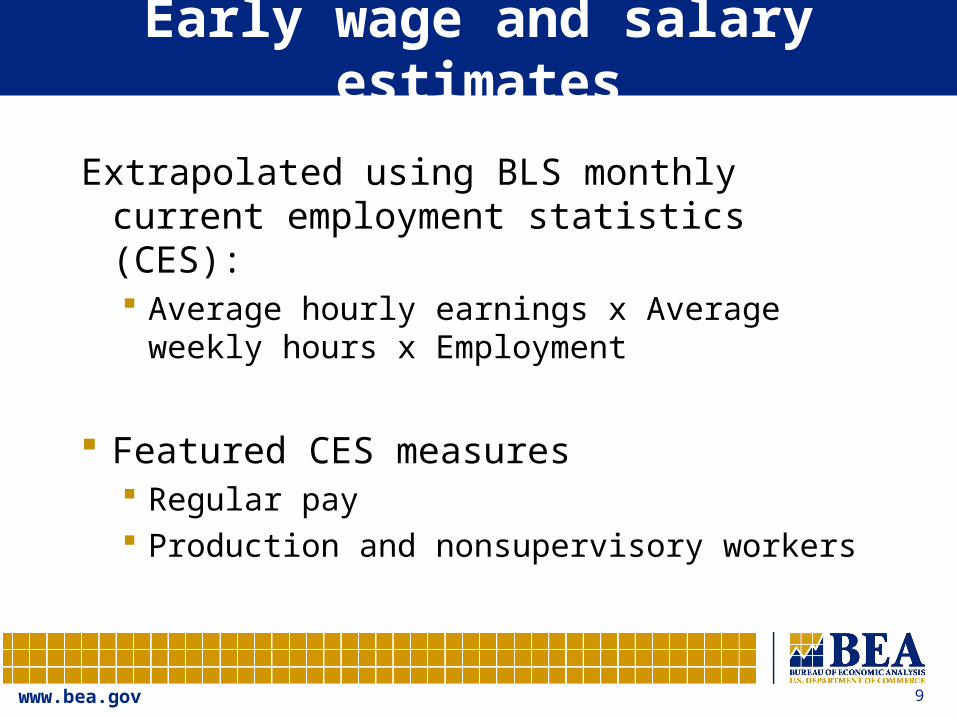
Early wage and salary estimates
Extrapolated using BLS monthly current employment statistics (CES): Average hourly earnings x Average
weekly hours x Employment
Featured CES measures Regular pay Production and nonsupervisory workers

10www.bea.gov
Irregular pay
Gain on the exercise of stock options and bonus payments contribute to volatility and revisions in wages and salaries
Gain on exercise of stock options reflected in QCEW when exercised
Bonus payments reflected in QCEW when paid Neither is separately identified in QCEW Neither stock option gains nor bonus
payments are included in current employment statistics used for extrapolation

11www.bea.gov
What next for wages and salaries?
New data: All-employee total earnings and gross monthly earnings
Studying the experimental data and evaluating its impact on personal income
When available, more timely data will replace current measures of employment, hours, and earnings

12www.bea.gov
What else?
Relationship of withheld income taxes and QCEW wages
Relationship of stock price changes and wage changes

13www.bea.gov
Pensions
Private pension contributions have contributed to large revisions to compensation
Growing concern about pensions in general as part of concerns about the aging population and retirement saving
Undertaking studies to more clearly identify data inconsistencies with the goal of developing improved methodologies

14www.bea.gov
Growth in unit labor costs(per unit of real gross product of nonfinancial corporate
business)
Growth in unit labor cost -- annual release
-3.0
-2.0
-1.0
0.0
1.0
2.0
3.0
2001 2002 2003 2004 2005 2006
Pe
rce
nt
ch
an
ge
1st Estimate
1st revision
2nd revision

15www.bea.gov
Form 5500
Informational tax form for pension plans
Comprehensive data source All large plans (100 or more participants) Sample of small plans
Extended filing period Long time lag

16www.bea.gov
Other pension data sources
Corporate financial reports
PBGC tabulations of form 5500 for defined-benefit plans
Corporate tax returns — IRS Statistics of Income tabulations of pension expenses
BLS survey data: Employment cost index Employer costs for employee compensation

17www.bea.gov
What’s ahead for pensions?
The updated System of National Accounts (international guidelines for national accounts) will recommend an accrual approach based on actuarial data
Volatility will probably be dampened
Additional estimation challenges

18www.bea.gov
Corporate profits
Corporate profits: Business receipts less business expenses
Wages and salaries and pension contributions are expenses to business
Estimates of profits are volatile and subject to substantial revisions
Improved estimates of stock option gains and pension contributions could lead to improved estimates of profits

19www.bea.gov
Quarterly corporate profits
Changes in level
-100
-50
0
50
100
150
1990 1991 1992 1993 1994 1995 1996 1997 1998 1999 2000 2001 2002 2003 2004 2005 2006 2007
[Billions of dollars]

20www.bea.gov
Profits and stock options
The gain on the exercise of stock options contributes to volatility and revisions in profits
Reflected in the corporate income tax data as an expense when exercised
Corporate financial reports (used for extrapolation) now expense options when granted based on fair value (option pricing model)
Revisions resulting from stock option activity depend on the timing of option grants and option exercises
In the future, could move to fair-value measures -- could dampen volatility, but challenging estimation issues

21www.bea.gov
Pensions and corporate profits
Corporate expense item
Differing reporting requirements can lead to timing inconsistencies
Reconciliation?