ISSN 1835-9728 Environmental Economics Research … · ISSN 1835-9728. Environmental Economics...
36
ISSN 1835-9728 Environmental Economics Research Hub Research Report Integrated Hydro-Economic Modelling: Challenges and Experiences in an Australian Catchment Marit E. Kragt and Jeff Bennett Research Report No. 15 February 2009 About the authors Marit Kragt is a PhD student in the Crawford School of Economics and Government and the Integrated Catchment Assessment and Management Centre at the Australian National University. Jeff Bennett is Professor in the Crawford School of Economics and Government at the Australian National University.
-
Upload
trannguyet -
Category
Documents
-
view
222 -
download
0
Transcript of ISSN 1835-9728 Environmental Economics Research … · ISSN 1835-9728. Environmental Economics...
ISSN 1835-9728
Environmental Economics Research Hub Research Report
Integrated Hydro-Economic Modelling:
Challenges and Experiences in an
Australian Catchment
Marit E. Kragt and Jeff Bennett
Research Report No. 15
February 2009
About the authors
Marit Kragt is a PhD student in the Crawford School of Economics and Government
and the Integrated Catchment Assessment and Management Centre at the Australian
National University.
Jeff Bennett is Professor in the Crawford School of Economics and Government at the
Australian National University.
Environmental Economics Research Hub Research Reports are published by the
The Crawford School of Economics and Government, Australian National University,
Canberra 0200 Australia.
These Reports present work in progress being undertaken by project teams within the
Environmental Economics Research Hub (EERH). The EERH is funded by the
Department of Environment and Water Heritage and the Arts under the
Commonwealth Environment Research Facility.
The views and interpretations expressed in these Reports are those of the author(s)
and should not be attributed to any organisation associated with the EERH.
Because these reports present the results of work in progress, they should not be
reproduced in part or in whole without the authorisation of the EERH Director,
Professor Jeff Bennett ([email protected])
Crawford School of Economics and Government
THE AUSTRALIAN NATIONAL UNIVERSITY
http://www.crawford.anu.edu.au
ii

Table of Contents Abstract ................................................................................................................................... iv
1 Introduction....................................................................................................................... 1
2 Integrated catchment modelling........................................................................................ 3
2.1 Optimisation models ................................................................................................ 3
2.2 Hydro-ecological models ......................................................................................... 3
2.3 Economic valuation.................................................................................................. 4
2.4 Integrated hydro-economic modelling ..................................................................... 5
3 Bayesian Networks ........................................................................................................... 5
4 Case study and scenario development .............................................................................. 8
4.1 Selecting a case study area....................................................................................... 8
4.2 Scale and management scenarios ........................................................................... 10
4.3 Attribute selection .................................................................................................. 10
4.4 Attribute states ....................................................................................................... 12
5 Modelling components ................................................................................................... 14
5.1 Water quality modelling......................................................................................... 14
5.2 Ecological modelling ............................................................................................. 15
5.3 Economic modelling .............................................................................................. 17
6 Bayesian Network modelling ......................................................................................... 19
6.1 The water quality network ..................................................................................... 20
6.2 The ecological network.......................................................................................... 21
6.3 The economics network ......................................................................................... 22
7 Discussion and lessons learned....................................................................................... 23
8 Conclusion and further steps........................................................................................... 24
9 References....................................................................................................................... 25
Appendix 1 First conceptual BN framework for the George catchment ................................. 30
Appendix 2 Integrated BN model for the George catchment .................................................. 31
Appendix 3 Seagrass and riparian vegetation sub-models ...................................................... 32
iii
Abstract Integrated catchment policies are widely used to manage natural resources in Australian
catchments. Decision support tools available to aid integrated catchment management are
often limited in their integration of environmental processes with socio-economic systems.
Fully integrated models are required to support assessments of the environmental and
economic trade-offs of catchment management changes. A Bayesian Network (BN) model is
demonstrated to provide a suitable approach to integrate environmental modelling with
economic valuation. The model incorporates hydrological, ecological and economic models
for the George catchment in Tasmania. Information about the non-market costs and benefits
of environmental changes is elicited using Choice Experiments, allowing an assessment of
the efficiency of alternative management scenarios.
iv

1 Introduction Catchment natural resource managers are faced with complex decision problems that involve multiple
systems and stakeholders, varying from environmental and ecological issues to social and economic
concerns. Mono-disciplinary analytical methods and models that aim to predict the impacts of
alternative policy decisions are typically insufficient to capture the complexities in the multiple
catchment systems. Integrated catchment management is increasingly aimed at addressing the wide
variety of catchment objectives and interests, including water quality and quantity, conservation of
natural resources, agricultural production, recreation and other economic activities (Heinz et al.,
2007). Modelling tools are increasingly developed that aim to support integrated catchment
management (Argent, 2004). However, despite the policy interest in integrated catchment
management (NWI, 2004, EU Commission, 2000), and the identified need for decision support tools
(Liu et al., 2008, Acreman, 2005) there is still limited experience in developing catchment models that
evaluate environmental and economic trade-offs in one framework (Heinz et al., 2007, Reinhard and
Linderhof, 2006). Many of the existing tools have limited flexibility to deal with the multitude of
systems and linkages between them. The scientific underpinning of economic studies is often limited
(Brookshire et al., 2007) and environmental models generally lack appropriate economic system
models (Brouwer and Hofkes, 2008).
Economics provides methods to better inform decision makers about the effects of alternative
management strategies. Economic valuation studies are particularly useful to show how catchment
management actions may impact non-market values. The study described in this report aims to
demonstrate how biophysical science can be linked with non-market valuation in one integrated
framework. This research is a collaborative project between two CERF research programs. The
Landscape Logic Knowledge Integration project 6 and the Environmental Economics Research Hub
project Theme D: ‘Valuing Environmental Goods and Services’1.
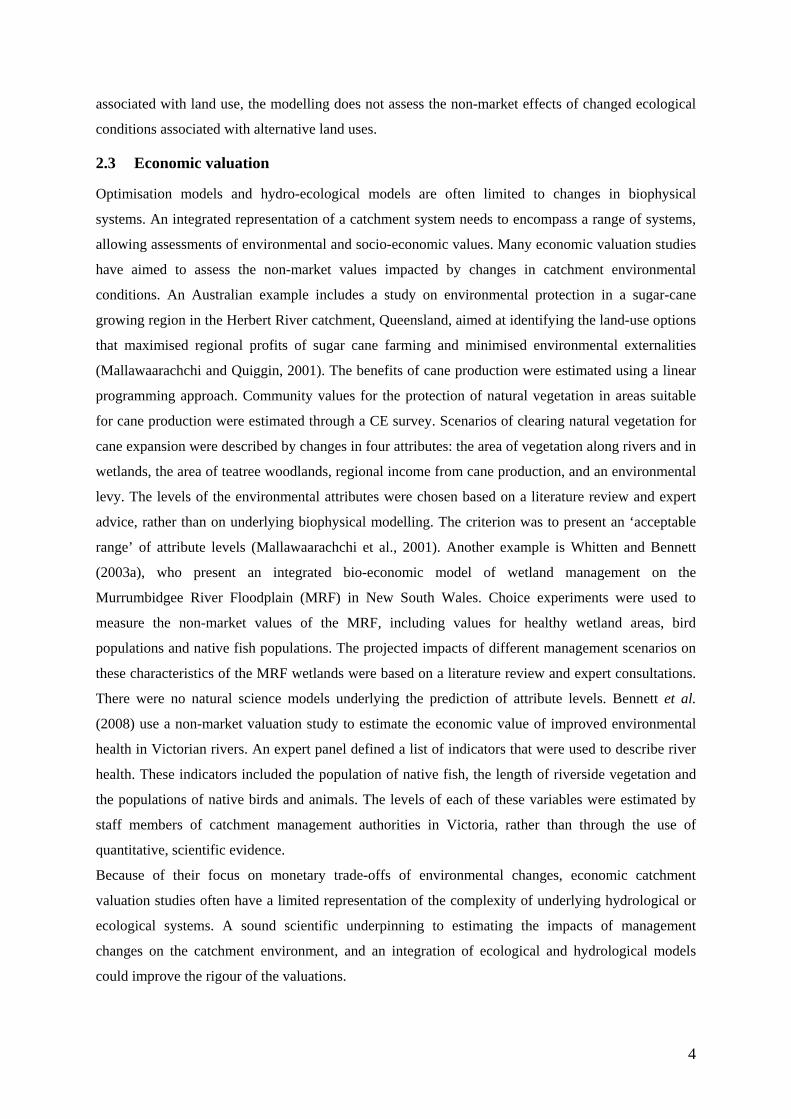
An integrated catchment model is developed for a case study of the George catchment, Tasmania. The
central processes considered in the integrated framework include catchment management actions,
hydrological response, effects on river and estuary water quality, ecological changes and impacts of
changes on economic values (Figure 1).
1 See http://www.landscapelogic.org.au/projects/projects.html and http://www.crawford.anu.edu.au/research_units/eerh/index.php for more information
1
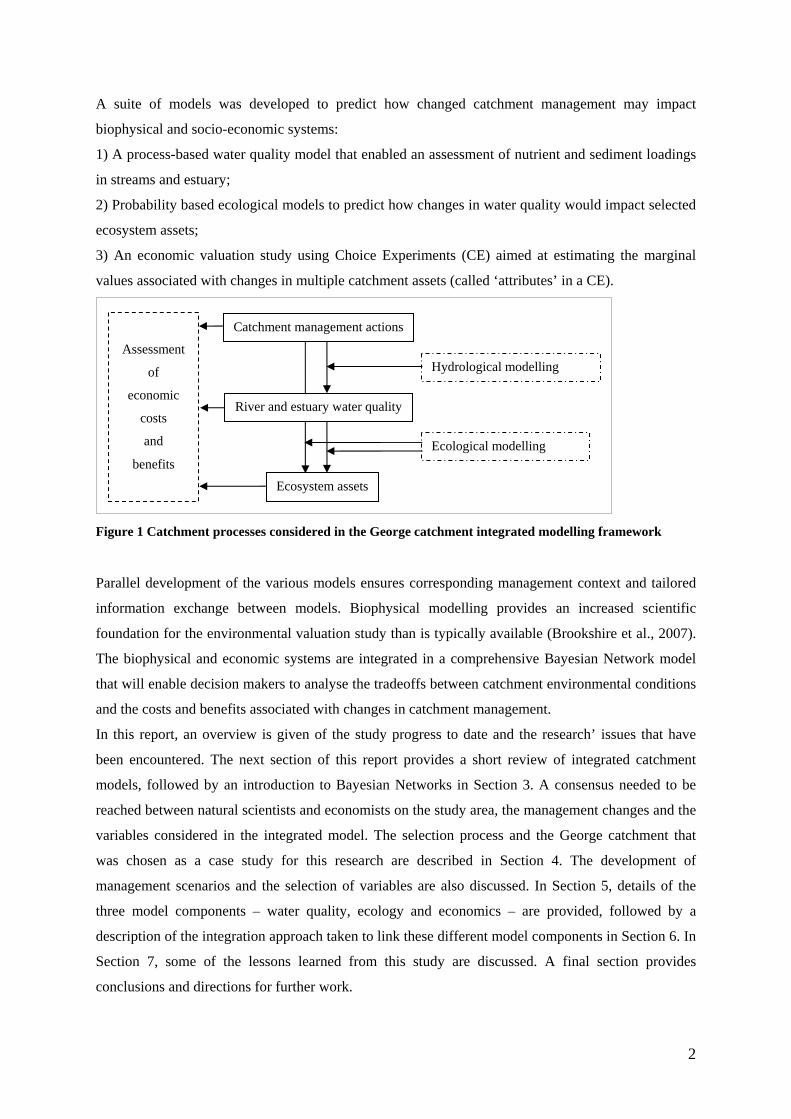
A suite of models was developed to predict how changed catchment management may impact
biophysical and socio-economic systems:
1) A process-based water quality model that enabled an assessment of nutrient and sediment loadings
in streams and estuary;
2) Probability based ecological models to predict how changes in water quality would impact selected
ecosystem assets;
3) An economic valuation study using Choice Experiments (CE) aimed at estimating the marginal
values associated with changes in multiple catchment assets (called ‘attributes’ in a CE).
Figure 1 Catchment processes considered in the George catchment integrated modelling framework
Parallel development of the various models ensures corresponding management context and tailored
information exchange between models. Biophysical modelling provides an increased scientific
foundation for the environmental valuation study than is typically available (Brookshire et al., 2007).
The biophysical and economic systems are integrated in a comprehensive Bayesian Network model
that will enable decision makers to analyse the tradeoffs between catchment environmental conditions
and the costs and benefits associated with changes in catchment management.
In this report, an overview is given of the study progress to date and the research’ issues that have
been encountered. The next section of this report provides a short review of integrated catchment
models, followed by an introduction to Bayesian Networks in Section 3. A consensus needed to be
reached between natural scientists and economists on the study area, the management changes and the
variables considered in the integrated model. The selection process and the George catchment that
was chosen as a case study for this research are described in Section 4. The development of
management scenarios and the selection of variables are also discussed. In Section 5, details of the
three model components – water quality, ecology and economics – are provided, followed by a
description of the integration approach taken to link these different model components in Section 6. In
Section 7, some of the lessons learned from this study are discussed. A final section provides
conclusions and directions for further work.
Ecological modelling
Hydrological modelling
Assessment
of
economic
costs
and
benefits
Catchment management actions
River and estuary water quality
Ecosystem assets
2

2 Integrated catchment modelling Integrated models that combine natural science and economic knowledge can contribute to more
efficient catchment management by allowing an assessment of multiple values. Of particular interest
here, is the growth in the number of ‘hydro-economic’ models, that aim to combine traditional
engineering and hydrological models of water management with economic analyses (Brouwer and
Hofkes, 2008, Heinz et al., 2007). A wide range of hydro-economic models exists, with different foci
and objectives.
2.1 Optimisation models
Many of the existing hydro-economic models aim to identify the optimal combination of management
actions that maximise a certain goal, subject to environmental and economic constraints. Such
optimisation models often focus on estimating the water needs of the physical environment and
analyse how production and extraction decisions might impact water flows. See, for example, the
models developed by Thornes and Rowntree (2006), Martín de Santa Olalla et al. (2005), Lanini et al.
(2004) and Rosegrant et al. (2000). These approaches typically include a hydrological component,
models of agricultural water demand and an economic component that estimates the financial benefits
from irrigation. Optimisation techniques are employed to assess the allocation of water between users
that maximises the expected social and economic gains from different ways to use the water, subject
to technical and environmental constraints (eg. land and water availability). Whereas such models
integrate hydrology and economics, the representation of impacts of changed allocation and efficiency
in water use on water quality, ecology or non-market values remains limited.
2.2 Hydro-ecological models
Decision makers need information about the impacts of management changes on catchment
ecosystems. Hydro-ecological models are aimed at assessing such changes by explicitly considering
hydrological and ecological processes, and the interactions between them. Such models may focus on
the ecological impacts of eutrophication and acidification of surface water (Fujita et al., 2007),
impacts of changes in river flows (Kennen et al., 2008) or effects of varying ground and surface water
levels (van den Bergh et al., 2001). Not many of these models assess the economic impacts of
ecosystem changes.
An example of a hydro-ecological model that incorporates economic effects is the NELUP model
(Moxey et al., 1995, Rushton et al., 1995). NELUP considers how rural land use changes in the River
Tyne catchment, UK, affect surface water and groundwater flows using hydrological models. An
ecological modelling component predicts changes in plant community and species composition in
response to land use changes. The economic module assesses the impacts of changes in land use
policies and prices on agricultural production. Although NELUP considers a range of activities
3
associated with land use, the modelling does not assess the non-market effects of changed ecological
conditions associated with alternative land uses.
2.3 Economic valuation
Optimisation models and hydro-ecological models are often limited to changes in biophysical
systems. An integrated representation of a catchment system needs to encompass a range of systems,
allowing assessments of environmental and socio-economic values. Many economic valuation studies
have aimed to assess the non-market values impacted by changes in catchment environmental
conditions. An Australian example includes a study on environmental protection in a sugar-cane
growing region in the Herbert River catchment, Queensland, aimed at identifying the land-use options
that maximised regional profits of sugar cane farming and minimised environmental externalities
(Mallawaarachchi and Quiggin, 2001). The benefits of cane production were estimated using a linear
programming approach. Community values for the protection of natural vegetation in areas suitable
for cane production were estimated through a CE survey. Scenarios of clearing natural vegetation for
cane expansion were described by changes in four attributes: the area of vegetation along rivers and in
wetlands, the area of teatree woodlands, regional income from cane production, and an environmental
levy. The levels of the environmental attributes were chosen based on a literature review and expert
advice, rather than on underlying biophysical modelling. The criterion was to present an ‘acceptable
range’ of attribute levels (Mallawaarachchi et al., 2001). Another example is Whitten and Bennett
(2003a), who present an integrated bio-economic model of wetland management on the
Murrumbidgee River Floodplain (MRF) in New South Wales. Choice experiments were used to
measure the non-market values of the MRF, including values for healthy wetland areas, bird
populations and native fish populations. The projected impacts of different management scenarios on
these characteristics of the MRF wetlands were based on a literature review and expert consultations.
There were no natural science models underlying the prediction of attribute levels. Bennett et al.
(2008) use a non-market valuation study to estimate the economic value of improved environmental
health in Victorian rivers. An expert panel defined a list of indicators that were used to describe river
health. These indicators included the population of native fish, the length of riverside vegetation and
the populations of native birds and animals. The levels of each of these variables were estimated by
staff members of catchment management authorities in Victoria, rather than through the use of
quantitative, scientific evidence.
Because of their focus on monetary trade-offs of environmental changes, economic catchment
valuation studies often have a limited representation of the complexity of underlying hydrological or
ecological systems. A sound scientific underpinning to estimating the impacts of management
changes on the catchment environment, and an integration of ecological and hydrological models
could improve the rigour of the valuations.
4

2.4 Integrated hydro-economic modelling
Many existing catchment models are science or engineering based models focusing on environmental
system processes, rather than on socio-economic values. Catchment valuation models, on the other
hand, often lack a thorough biophysical foundation that could improve the representation of the
complex environmental systems underlying valuation studies. To the authors’ best knowledge, only
two other studies have been undertaken that link comprehensive biophysical models to estimations of
market and non-market costs and benefits. The ‘Catchment hydrology, Resources, Economics and
Management’ (ChREAM) project aims to assess the economic impacts of implementing the EU Water
Framework Directive on rural communities in the Humber catchment, UK (Bateman et al., 2006a,
2006b). The study uses a combination of biophysical models and GIS techniques to assess how
different management scenarios might alter water flows and water quality, as well as the biological
responses they may trigger in river ecosystems. The biophysical modelling provides inputs for parallel
socio-economic assessments. Changes in agricultural production are estimated using farmers’ surveys
and socio-economic models of farming behaviour (Bateman et al., 2006a). Travel cost and CE surveys
are employed to elicit the non-market values that individual visitors attach to the Humber catchment.
ChREAM is a multidisciplinary project linking biophysical and socio-economic modelling outcomes.
There is, however, no documentation of how the various model outcomes may be integrated into one
comprehensive framework.
Another study that aims to integrate hydrological and ecological modelling with non-market valuation
is underway in two catchments in Arizona, USA (Brookshire et al., 2007). This study focuses on the
impacts of changes in groundwater levels on water flows, riparian vegetation and, subsequently,
habitat provision for birds. Natural science-based models provide information about changes in flows,
vegetation and birds as inputs into Contingent Valuation (CV) and CE studies that aim to elicit the
values people place on varying catchment conditions. A major focus of the project is the degree of
scientific detail that can be presented in the valuation surveys, while taking into account the cognitive
burden on respondents. No results have been published yet, but the researchers have highlighted the
complexity involved in creating an integrated scientific/economic framework (Dixon et al., 2008).
Available integrated modelling often concentrates on either biophysical or economic systems. Where
multiple systems and processes are considered, integration into a single comprehensive modelling
framework is limited. The study described in this report proposes a Bayesian Network approach as a
method to link biophysical science to nonmarket valuation outcomes in a single catchment model.
3 Bayesian Networks A major challenge in any integrated modelling study is to combine the knowledge from different
academic disciplines into a logically consistent framework. Some processes (for example, in
catchment hydrology) may be clearly described by deterministic models or can be derived from
5
observational data. However, many ecological and socio-economic processes are not well understood
and are inherently subject to uncertainty. Using a deterministic model that relies on quantitative data
will not be useful when there is limited information about a system. A Bayesian Network model (BN -
sometimes called belief network) quantifies uncertainty by representing the impacts from alternative
management actions as (discrete) probability distributions. Through this probability definition, BNs
enable an analysis of the risks associated with catchment management changes2.
BNs are probabilistic graphical models, widely used for knowledge representation and reasoning
under uncertainty in natural resource management (NRM) (Castelletti and Soncini-Sessa, 2007). A
BN consists of a directed acyclic graph of variables (called ‘nodes’), that can represent management
scenarios, states or utilities. The values each variable can assume are classified into mutually
exclusive, ‘states’. These states can be defined in quantitative levels (e.g. <50, 50-150, 150-300 and
>300mg/L) or in qualitative terms (e.g. ‘decrease’, ‘no change’, and ‘decrease’). That means that BNs
are able to accommodate different data sources, including expert opinion when observational data is
not available (Pearl, 1988, Jensen, 1996). The range of states should be wide enough to cover all
possible levels. The ‘discretisation’ of states can reflect the precision of the value estimates by using
more or less states to cover the range of values. The conceptual links between nodes are described by
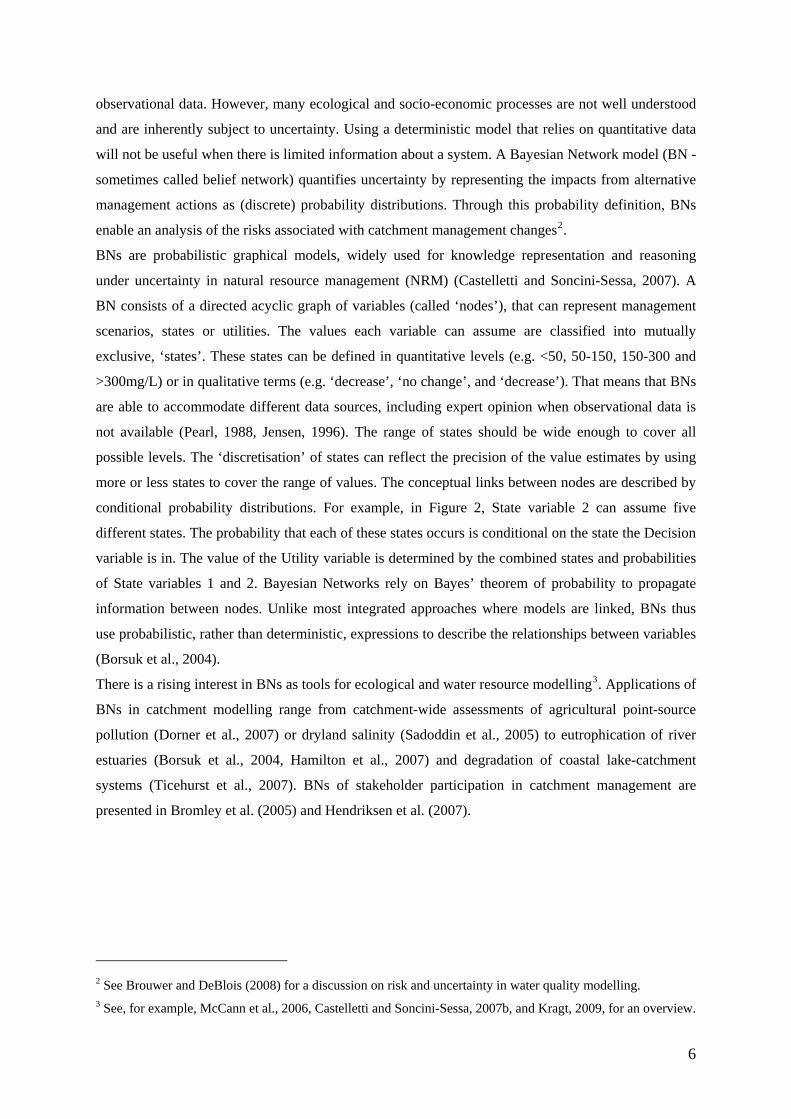
conditional probability distributions. For example, in Figure 2, State variable 2 can assume five
different states. The probability that each of these states occurs is conditional on the state the Decision
variable is in. The value of the Utility variable is determined by the combined states and probabilities
of State variables 1 and 2. Bayesian Networks rely on Bayes’ theorem of probability to propagate
information between nodes. Unlike most integrated approaches where models are linked, BNs thus
use probabilistic, rather than deterministic, expressions to describe the relationships between variables
(Borsuk et al., 2004).
There is a rising interest in BNs as tools for ecological and water resource modelling3. Applications of
BNs in catchment modelling range from catchment-wide assessments of agricultural point-source
pollution (Dorner et al., 2007) or dryland salinity (Sadoddin et al., 2005) to eutrophication of river
estuaries (Borsuk et al., 2004, Hamilton et al., 2007) and degradation of coastal lake-catchment
systems (Ticehurst et al., 2007). BNs of stakeholder participation in catchment management are
presented in Bromley et al. (2005) and Hendriksen et al. (2007).
2 See Brouwer and DeBlois (2008) for a discussion on risk and uncertainty in water quality modelling. 3 See, for example, McCann et al., 2006, Castelletti and Soncini-Sessa, 2007b, and Kragt, 2009, for an overview.
6
1
2
Figure 2 Bayesian Network modelling basics (Source: Merritt et al., 2006)
There are few BN applications focusing on economic impacts of environmental changes. Only one
BN study has been published to date that incorporates non-market costs and benefits of catchment
management changes (Barton et al., 2008). The authors used a BN approach to integrate existing
economic information on the costs of nutrient abatement measures with modelled impacts of changed
land management practices on lake water quality in the Morsa catchment, Norway. This enabled a
cost-effectiveness ranking of measures based on the expected costs and environmental effects. The
benefits of improved water quality on recreation were also evaluated, using results from a 1994 CV
survey. Combining the economic valuation of water quality to the abatement costs allowed a cost-
benefit analysis of alternative management scenarios in the catchment. The study showed the benefits
of using a BN approach compared to deterministic cost-effectiveness or cost-benefit analyses.
However, the economic studies were not developed in concordance with the biophysical models.
Doing so could have improved the information exchange between models and the integration of
biophysical and economic knowledge. Furthermore, using CV restricted the value estimate for bathing
water suitability to a binary variable. An estimation of the marginal values of changes in multiple
environmental attributes was not possible with the employed environmental valuation approach.
7

4 Case study and scenario development Each modelling process starts at the level of issue definition, including an identification of the system
that is to be studied, the objectives of the model and the changes under consideration (Jakeman et al.,
2006). In an integrated model, various stakeholders or scientific disciplines may consider a multitude
of issues related to the system under consideration, which could lead to different modelling objectives
for different stakeholders. Even a definition of the system itself may differ between model developers.
In this section, the definition of the scales and scope of the George catchment integrated modelling
study are described.
4.1 Selecting a case study area
The first step in our integrated modelling study was the selection of a case study catchment that was
suitable for both the scientific and socio-economic research. This consensus-based process involved
researchers from various disciplines. The focus of the study was on Tasmanian catchments and the
analyses of river and estuary changes. As such, the selection process started with an assessment of 34
coastal catchments in Tasmania. The aim of the biophysical modelling component was to assess the
linkages between catchment management, hydrology and impacts on freshwater and estuary water
quality and ecology. Therefore, there needed to be a demonstrated impact of management actions on
receiving waters and aquatic systems. Catchments without identified environmental issues were
excluded from the selection process. Another important criterion for biophysical modelling was the
availability of quantitative data on meteorology, catchment hydrology, soil composition, land use
distribution, and the presence of monitoring sites for stream-flow and river and estuary water quality.
Catchments with large perturbations such as hydro electric structures, dams, mining activities or
major urban developments were excluded to avoid confounding with catchment management impacts.
This process resulted in a ‘short-list’ of 13 catchments in which environmental concerns had been
demonstrated, for which adequate monitoring data were available and that did not have major
catchment modifications. This shortlist was scrutinised based on criteria for the socio-economic
research component.
The presence of environmental assets in the chosen catchment was an important criterion, as potential
attributes for the valuation survey. Furthermore, natural resource degradation needed to be related to
local catchment management and the catchment estuary needed to have economic significance
through its contribution to production, recreation or non-market values. Four Tasmanian catchments
were proposed for final selection: the Duck, George, Inglis and Port Sorell catchments. From these
four, the George catchment was selected as a suitable case study area because hydrological and water
quality data were available and because the catchment has significant socio-economic values through
its environmental assets, aquaculture production and recreational values. Another advantage was the
support the study received from local and regional NRM bodies.
8

The George catchment is a coastal catchment of about 557 km2 on the North-East coast of Tasmania
(Figure 3). The total length of rivers in the catchment is approximately 113km, with the main rivers
being the Ransom and the North and South George Rivers. The George River flows into the Georges
Bay estuary (22 km2) near the town of St Helens (population 2,200 - Census 2006). Continuous water
quality monitoring data is available for the Ransom and George river (DPIW, 2007) and ongoing
research in Georges Bay provides monitoring data on estuary water quality and ecology (Crawford
and White, 2005). The region is a popular holiday destination, and Georges Bay is intensively used
for recreational activities including boating, swimming, sailing and recreational fishing. There is also
extensive aquaculture in Georges Bay, with 10 marine farming licenses (DHHS, 2008). In 2006,
approximately 3,000 dozen of oysters were commercially harvested in Georges Bay (DEWR, 2007)4.
Figure 3 The George catchment
Land use in the upper catchment is a mix of native forestry and forest plantations along with dairy
farming, while the lower catchment is used for agriculture and contains most of the rural and urban
residences. Although the catchment environment is currently in good condition (Walker et al., 2006,
Davies et al., 2005),dairy runoff, forestry operations and urban pollution are affecting water quality in
the George catchment (NRM North, 2008a and 2008b). There are significant concerns about
degradation of the catchment environment (BOD, 2007, Sprod, 2003, Rattray, 2001). Local
management is aimed at preventing a quality decline of the natural resources in the George catchment.
Current NRM actions include limiting stock access to rivers, removing weeds along river banks,
developing riparian buffer zones, recovery of dairy effluent and improved wastewater treatment.
4 More recent (commercially sensitive) production data is not publically available.
9
4.2 Scale and management scenarios
In any integrated model, the various modelling components should consider the same management
issues on the same spatial and temporal scales. The geographical scale in this study was based on the
catchment contours of the George catchment, delineated using digital elevation models. A projection
of water quality changes in the next twenty years was considered an appropriate time frame from both
a biophysical and socio-economic modelling perspective.
The management scenarios to be considered were limited to local NRM activities, and variables that
could be incorporated in the biophysical modelling. Scenarios were specified using literature analysis
and interviews with science experts, local stakeholders and decision makers. Management actions
included in the George catchment model are targeted at:
1) Changed catchment land use;
2) Controlling erosion and point-source pollution through fencing and instream engineering
works;
3) Riparian management through establishing riparian buffer zones, weeding and revegetation of
riparian zones.
Some of these actions are already being implemented in the George catchment on a small scale, which
increases the plausibility of the management scenarios for respondents to the valuation study.
Changes that cannot be influenced by local management, such as climate change, were not
considered.
4.3 Attribute selection
The next step in model development involved defining the scope of the system in terms of the assets
or values that would be considered in the modelling. From an integration perspective, the scientific
information should predict the changes in environmental attributes of interest for socio-economic
research. Choosing science-based indicators of catchment condition that were important to policy
makers ánd suitable to be included as attributes in the choice experiment was a challenging task in this
study.
The selection of attributes was an iterative process. Many disparities were encountered between what
qualified as key indicators from a biophysical perspective and what were relevant assets from an
economic valuation point of view. A review of the literature on ecosystem indicators in Australian
catchments (e.g. NLWRA, 2008, Beeton et al., 2006, NLWRA, 2001, White and Ladson, 1999) aided
the identification of variables important in catchment and aquatic processes. Discussions with local
policy makers and a review of George catchment management plans (BOD, 2007, DPIW, 2005b,
Mount et al., 2005, Sprod, 2003, Lliff, 2002, Rattray, 2001, McKenny and Shepherd, 1999) provided
additional focus on attributes that are significant in the George catchment. These were discussed
during several science workshops with experts on river and estuary health.
10

Scientists expressed a desire to capture a complete and detailed representation of the processes related
to catchment management changes, resulting in a conceptual model framework with nearly eighty
variables (Appendix 1). It is practically impossible to collect data on so many variables and to specify
the relationships between all of them. A balance needed to be found between model parsimony and
scientific representation of catchment processes. Furthermore, the detailed model information
envisaged by natural scientists would have been impossible to present in a non-market valuation
survey. Additional rounds of workshops and expert consultation5 were therefore aimed at identifying
the most important variables that scientists expected to be impacted by land use changes, erosion and
pollution control and riparian management. The final set of variables included in the BN represent a
compromise between the detailed depiction of system complexities sought by biophysical scientists
and the parsimony desirable from a modelling perspective (Appendix 2).
The output nodes in the model deserved particular attention, as these would serve as the
environmental attributes in the environmental valuation study. An important attributes that was
identified by natural scientists was general ‘water quality’ in the rivers and in Georges Bay. From an
economic perspective, ‘water quality’ was not a desirable attribute because of its potential to act as a
‘causal attribute’ in the choice experiment. Causal attributes are seen by CE respondents as being
indicators of an array of other -consequential- attributes such as biodiversity and recreational use. The
inclusion of a causal attribute such as ‘water quality’ in the valuation task tends to preclude other
catchment attributes from playing a role in respondents’ choice processes. Scientists were therefore
challenged to define ecological indicators of ‘water quality’. Experts initially found it difficult to think
beyond chemical indicators such as nutrients, sediment, salinity or dissolved oxygen concentration.
The most important ecological indicator of water quality changes for ecologists was the abundance
and species composition of benthic macro-invertebrates (see, for example, Haase and Nolte, 2008,
Parsons et al., 2002, and Ladson et al., 1999). However, macro-invertebrates were not a useful
attribute to represent catchment environmental conditions in the valuation study, as survey respondent
were expected to be relatively unfamiliar with macro-invertebrates and their ecological significance.
Rather than ‘educating’ respondents about food webs and ecosystem functioning, it was considered
desirable to represent catchment conditions by attributes of higher trophic levels. After several
consultation rounds, experts agreed that algal growth, fish, oysters and seagrass were reasonable
ecological indicators of water quality6. Given that there are currently no observations of algal blooms
5 Interviews were conducted with experts on river health, threatened species, bird ecology, forestry management, riparian vegetation and estuary ecology. 6 Elevated nutrient and sediment levels can trigger excessive algal growth, making the occurrence of algal blooms a suitable indicator of declined water quality. Changes in water quality, salinity, aquatic vegetation and especially subsequent effects on in dissolved oxygen levels can impact fish abundance. Seagrass generally grows best in unpolluted waters with low turbidity, making the extent of seagrass beds another appropriate water quality indicator.
11
in the George catchment, seagrass area, fish and oyster populations were considered as attributes for
the valuation study.
Ecological indicators of catchment environmental conditions other than water quality were also
discussed with scientists. Ecologists argued that a complete understanding of species and vegetation
composition was needed to measure natural resource conditions in the George catchment. The aim
was to find the attributes that can represent the highest level in an ecosystem and thus serve as
indicators of ecosystem health. Two attributes were selected to represent the George catchment
environmental conditions: threatened species and riparian vegetation.
All the attributes were discussed during focus group meetings with survey respondents in Hobart, St
Helens and Launceston7. Respondents reacted positively to the riparian vegetation and species
attributes. With respect to the water quality indicators, both oyster and fish populations were
considered valuable George catchment assets. However, a lack in scientific information about the
relations between catchment management and oyster growth, and a lack in observed data on fish
populations impeded the use of these attributes. Seagrass area, riparian vegetation and rare animal and
plant species were chosen as environmental attributes to be modelled and to be included in the
valuation study.
4.4 Attribute states
The selected attributes are the final output nodes in the overall integrated Bayesian modelling
framework. Biophysical modelling was to predict how changed catchment management would impact
the attributes and a decision needed to be made about the measurement units that would represent the
attribute levels. All model components should evaluate attributes in identical measurement units.
Natural scientists and economists therefore needed to agree on the description of each attribute, the
units of measurements and the potential levels that each attribute could assume. In the BN, the
discrete states of the output nodes were to match the range of attribute levels presented in the CE
survey. It is worthwhile noting here that being able to use node states that directly correspond to
attribute levels is an added advantage of integrating CE results into BNs.
Observations of current catchment conditions were available. Scientists were, however, reluctant to
predict changes without detailed information about all the biophysical processes that could affect the
environmental attributes (Appendix 1). Initially, qualitative descriptions were used to define the states
of each attribute (e.g. ‘increase’, ‘no change’ or ‘decrease’). However, the valuation task is
advantaged when attribute levels are specified as quantitative levels. Using quantitatively attribute
levels can reduce the subjectivity that is associated with individual respondents’ interpretation of a
7 Four focus group discussions were organised in Hobart and St Helens in February 2008, and a further four in Launceston and Hobart in August 2008. For further details about the focus groups and the attribute selection process, see Kragt and Bennett (2008).
12

qualitatively defined attribute. Quantitative levels also improve the capacity of valuation results to be
used in benefit transfer exercises (Desvousges et al., 1992).
The available biophysical data and preliminary modelling outputs were discussed during several
expert workshops. Similar to experiences reported by Brookshire (2007), natural science experts
wanted to describe each variable in much scientific detail. However, the attribute description in the
CE survey needed to be simple and short to convey the information to survey respondents. The final
description of the attributes are a compromise between these two views (Table 1).
A broad range of measurement units and attribute levels was considered. Both quantitative and
qualitative measures were discussed during the CE focus groups. Given the subjectivity of qualitative
measures, quantitative levels were chosen to depict changes in seagrass, riparian vegetation and rare
animal and plant species.
Table 1 Attributes / output nodes, their units of measurement and description in the George catchment
model
Attribute / output node Measurement units Description in the choice experiment
Native riparian vegetation
The percentage of total riparian zone in the George catchment that is more than 80 percent vegetated, with at least 70 percent native vegetation
Native riverside vegetation in healthy condition contributes to the natural appearance of a river. It is mostly native species, not weeds. Riverside vegetation is also important for many native animal and plant species, can reduce the risk of erosion and provides shelter for livestock.
Rare native animal and plant species
The number of observed different native Tasmanian flora and fauna species listed as vulnerable, endangered or critically endangered listed under Tasmania's Threatened Species Protection Act, with more than one observation in the Natural Values Atlas (DPIW, 2008).
Numerous species living in the George catchment rely on good water quality and healthy native vegetation. Several of these species are listed as vulnerable or (critically) endangered. They include the Davies’ Wax Flower, Glossy Hovea, Green and Golden Frogs and Freshwater Snails. Current catchment management and deteriorating water quality could mean that some rare native animals and plants would no longer live in the George catchment.
Seagrass area
The area in hectares of dense seagrass (Heterozostera tasmanica and Zostera muelleri) beds mapped in the George estuary
Seagrass generally grows best in clean, clear, sunlit waters. Seagrass provides habitat for many species of fish, such as leatherjacket and pipefish.
13
5 Modelling components In this section, the biophysical and economic models that were developed for the George catchment
are described8. The various models provide inputs for the final integrated BN framework.
5.1 Water quality modelling
The impacts of alternative catchment management actions on river and estuary water quality were
modelled in a spatially semi-distributed framework called CatchMODS (Catchment Scale
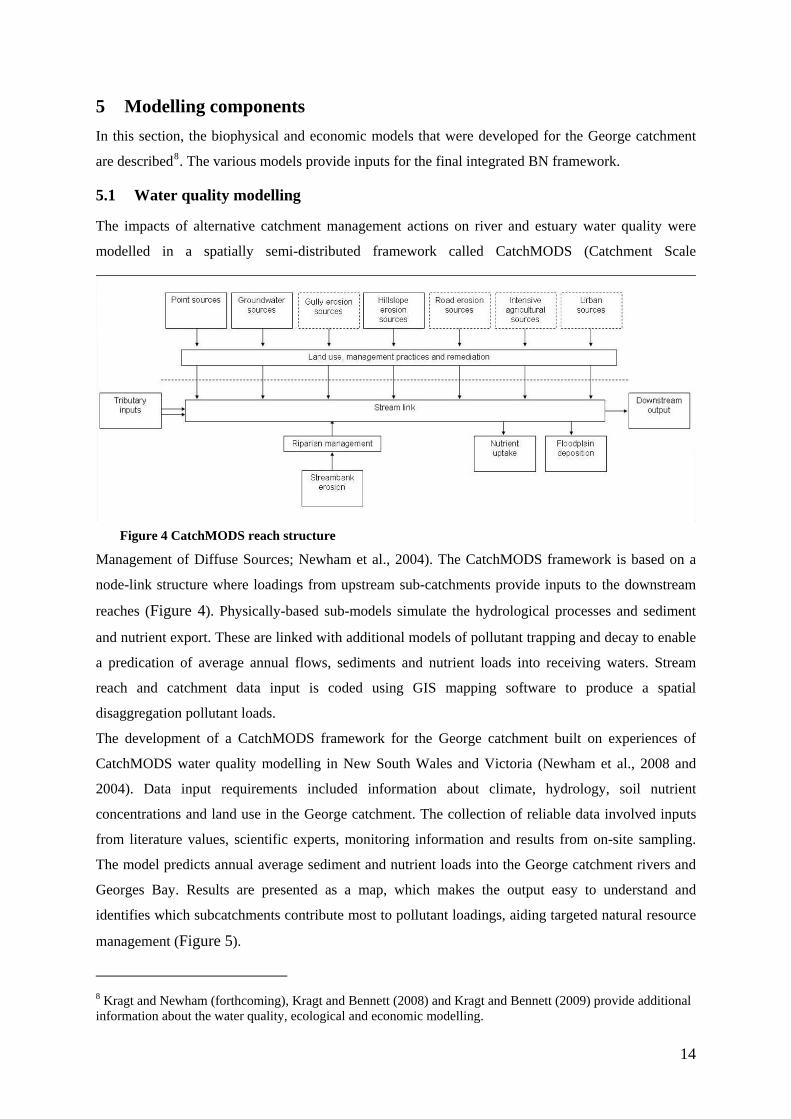
Management of Diffuse Sources; Newham et al., 2004). The CatchMODS framework is based on a
node-link structure where loadings from upstream sub-catchments provide inputs to the downstream
reaches (Figure 4). Physically-based sub-models simulate the hydrological processes and sediment
and nutrient export. These are linked with additional models of pollutant trapping and decay to enable
a predication of average annual flows, sediments and nutrient loads into receiving waters. Stream
reach and catchment data input is coded using GIS mapping software to produce a spatial
disaggregation pollutant loads.
Figure 4 CatchMODS reach structure
The development of a CatchMODS framework for the George catchment built on experiences of
CatchMODS water quality modelling in New South Wales and Victoria (Newham et al., 2008 and
2004). Data input requirements included information about climate, hydrology, soil nutrient
concentrations and land use in the George catchment. The collection of reliable data involved inputs
from literature values, scientific experts, monitoring information and results from on-site sampling.
The model predicts annual average sediment and nutrient loads into the George catchment rivers and
Georges Bay. Results are presented as a map, which makes the output easy to understand and
identifies which subcatchments contribute most to pollutant loadings, aiding targeted natural resource
management (Figure 5).
8 Kragt and Newham (forthcoming), Kragt and Bennett (2008) and Kragt and Bennett (2009) provide additional information about the water quality, ecological and economic modelling.
14

Figure 5 Example of George CatchMODS output (different colours presening different sediment yields)
5.2 Ecological modelling
The ecological modelling in this study focused on the three environmental attributes that were to be
included in the CE survey. Various combinations of the management actions (land use changes,
erosion and pollution control, riparian zone and weed management) were modelled to predict changes
in the levels of these attributes in the George catchment in 20 years time.
A specific challenge in the ecological modelling was the uncertainty that inherently arises from the
variability in natural systems (Walker et al., 2003) as well as the imperfect knowledge and
information about ecosystem functioning in the George catchment. The modelling needed to deal with
this uncertainty. Information was collected about the current status of riparian vegetation, native
species and seagrass in the George catchment and Bay. In the absence of quantitative scientific studies
and limited long-term monitoring data about ecological changes in Tasmanian catchments, no
deterministic models could be developed to simulate changes in the George catchment ecosystems.
The approach taken in this study therefore followed the strategy of assigning probabilities to the
uncertain states of each variable (Brouwer and De Blois, 2008). A combination of observed data,
expert consultation and assumptions was used to predict changes in riparian vegetation, native species
and seagrass in a probabilistic BN model. The quantification of uncertain relationships between
variables as probability distributions and the graphical representation of these probabilities provided a
more explicit depiction of system uncertainty than is usually the case in integrated models.
15
Furthermore, the formalisation of ecosystem processes in this manner provided an increased scientific
foundation for the CE than is typical in environmental valuation studies.
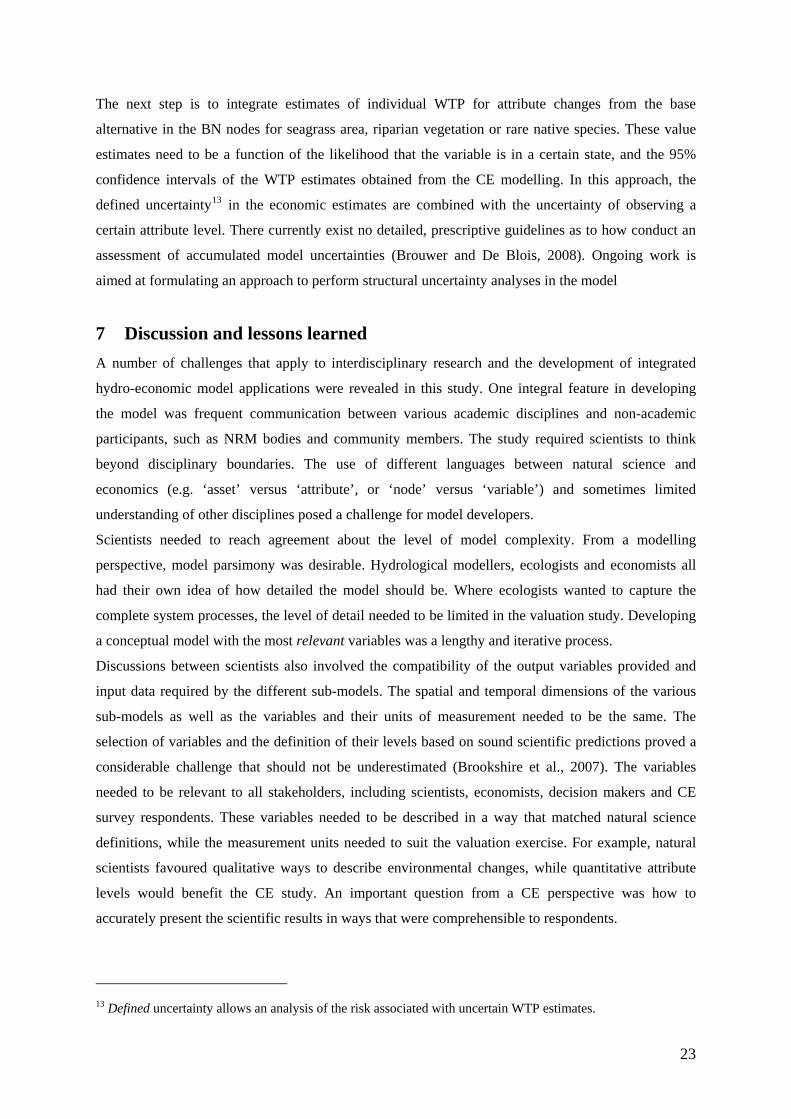
The available data for riparian vegetation, seagrass and species were reviewed by a team of natural
scientists and local and regional NRM organisations. The most important management actions
impacting upon the environmental attributes were also discussed.
Information about riparian vegetation in the George catchment was derived from digital vegetation
mapping (DPIW, 2005c), river health modelling (DPIW, 2005a), interviews with local NRM officers,
agricultural and forestry practitioners and natural scientists. Native riparian vegetation was defined as
percentage of total riparian zone in the George catchment that is more than 80 percent vegetated,
consisting of at least 70 percent native vegetation (Table 1). The current percentage of riparian zone
with native vegetation is approximately 65%, or 74km, of the total river length in the George
catchment. Management actions that were most likely to impact riparian vegetation are changes in
land use, fencing of riparian zones and weed management actions. Information about rare species was
obtained from the Natural Values Atlas (DPIW, 2008) and was discussed with flora and fauna experts
at the DPIW Threatened Species Unit. The variables assumed to impact the number of rare native
animals and plant species were length of native riparian vegetation, land use, habitat connectivity and
water quality. A total number of 68 rare flora species and 34 rare fauna species has been observed in
the George catchment, of which about 80 could directly be affected by the considered local
management changes. The area of healthy seagrass beds in Georges Bay was assessed using
monitoring data and digital mapping of the Bay (Mount et al., 2005). The current area of healthy
seagrass beds is approximately 690ha, or 31% of the total estuary area. Changes in estuary water
quality, predominantly sediment concentration, nutrient loadings and turbidity, were assumed to
impact seagrass beds.
The elicitation of probability distributions for the ecological variables followed approaches described
by Ticehurst et al. (2008) and Merrit et al. (2006). Structural interviews with various natural scientists
and local NRM officers were used to predict ‘worst case’ and ‘best case’ scenarios for each
environmental attribute. Preliminary results of this elicitation process are summarised in Table 2. The
likelihood that each output node is in a certain state needs to be further refined by probability
distributions. A wide probability distribution was used for the initial modelling, to represent the
uncertainty in the ecological information.
16

Table 2 Preliminary results of ecological modelling
Output node Worst case scenario Lowest
attribute level Best case scenario
Highest
attribute level
Native
riparian
vegetation
Decrease in natural
areas, increase in
agricultural areas and
limited weed
management
35% (40km) of
the total river
length
Increase in conservation
area, large-scale weed
management and increase
in vegetation density in
the riparian zone
75% (84km) of
the total river
length
Rare native
plants and
animals
Decrease in native
riparian vegetation,
land conversion,
limited habitat
connectivity and
degraded water quality
35 rare animal
and plant
species
Current situation
80 rare animal
and plant
species
Seagrass area Increased sediment and
nutrient loadings
420ha of
seagrass beds
Improved water quality
and reduced turbidity
815ha of
seagrass beds
An increase in the number of observed rare species in the George catchment was considered unlikely
by natural scientist. Because an increase in the number of rare species was also confusing to
respondents in the CE, only a decline in species was modelled. The assumptions for the seagrass
modelling were based on estuary models developed for mainland Australia (Baird et al., 2002).
Estuary scientists stressed that the ecological response of seagrass to water quality changes is
currently not well understood in Tasmanian estuaries. More accurate predictions and refining
probability distributions will require further modelling of estuary hydrodynamics and detailed
mapping of changes in seagrass beds in Tasmanian estuaries. Unfortunately, results from current
research in this field9 were not available to be included in the present study.
5.3 Economic modelling
The economic component of this research consisted of a non-market valuation study using Choice
Experiments (CE) to elicit community preferences towards the George catchment environment. In a
CE, respondents are presented with a series of choice questions describing several possible alternative
futures, each with different levels of the attributes. Respondents are asked to choose their preferred
option in each choice question. This allows the researcher to analyse the trade-offs respondents make
between attributes. If cost is included as one of the attributes, these trade-offs can be used to estimate
9 http://www.landscapelogic.org.au/projects/project4.html
17

the marginal value (implicit price) of each attribute.10 A CE was considered the most appropriate
environmental valuation technique in this study, as it enables an estimation of marginal values for
separate environmental attributes. These marginal values can then readily be linked to the output
nodes in the BN model, with node states matching the CE attribute level ranges. It is implausible from
a scientific perspective to predict the condition of the George catchment in terms of the exact number
of species, riparian vegetation length or seagrass area. In the ecological BN modelling, this
uncertainty is acknowledged by defining attribute levels in terms of the probability that an attribute is
in a certain state. In the CE survey, this uncertainty was acknowledged by describing the outcomes of
implementing new management actions as the “likely outcomes in 20 years time”. Four attribute
levels were used for each environmental attribute in the CE survey, based on the highest and lowest
states and two intermediate states, of the BN output nodes.
A CE survey was developed using a combination of literature review, interviews with science experts
and regional natural resource managers, biophysical modelling and feedback from various focus
group discussions (Kragt and Bennett, 2008). The description of the attributes and their levels was,
whilst based on scientific predictions, kept simple to make the survey comprehensible for
respondents. Information about natural resource management in the George catchment and the
environmental attributes was presented on a poster that accompanied the survey questionnaire The
George catchment mapping and the described management changes were derived from the water
quality modelling and were identical to the catchment scale and changes modelled in the BN.
Each choice question presented to respondents consisted of three choice alternatives. A base
alternative was included in each choice question describing a degradation of catchment conditions
over the next 20 years if no catchment management actions were to be undertaken. In this base
scenario, the attributes would be degrading to the lowest level predicted by the water quality and
ecological modelling. Two other options in each question depicted the outcomes if new management
actions were to be implemented and showed improvements in attribute levels, compared to the base.
An example of a choice question is shown in Figure 6.
10 See Hensher et al. (2005), Alpizar et al. (2001), Bennett and Blamey (2001) or Hanley et al. (1998) for more information about Choice Experiments.
18

Figure 6 One of the choice questions included in the George catchment CE
The survey was administered in Hobart, Launceston and St Helens in November and December 2008.
A limited number of surveys were collected in Hobart and St Helens. To increase the sample size, a
second sampling wave will be carried out in February 2009. As such, the results reported here are
preliminary. Analysis of the surveys collected to date showed that respondents, in general, hold
positive values for the environmental attributes in the George catchment. Results from a mixed logit,
random-effects model suggest that respondents are, on average, willing to pay $0.13 for an additional
ha increase in healthy seagrass beds, $4.46 for a km increase in the length of native riverside
vegetation and $9.35 for a species increase in rare native plants and animals (Table 3).
Table 3 Average marginal willingness to pay for environmental attributes in the George catchment (Source: Kragt and Bennett, 2009)
Attribute Mean marginal WTP* 95% confidence interval
Seagrass (ha) 0.13 (0.04 0.22)
Riverside vegetation (km) 4.46 (3.27 5.66)
Rare species (#) 9.35 (7.96 10.74) * Marginal WTP for a unit increase of the environmental attribute with the base alternative as the reference level
6 Bayesian Network modelling The main objective of the study described in this report is to integrate economic analyses and
environmental modelling in one comprehensive framework. The study goes beyond simply linking the
outputs from multiple mono-disciplinary models. The water quality, ecological and economic models
are ‘translated’ into Bayesian networks, resulting in one integrated catchment framework. Different
techniques are being used to define the conditional probability distributions that characterize the
relationships between variables.
19

6.1 The water quality network
Catchment landuse (%)UrbanAgricultureForest nonnative prodForest nat prodNative veg nonprod
20.020.020.020.020.0
RiverTSS(tonnes/yr)
RiverTN(tonnes/yr)
RiverTP(tonnes/yr)
FlowRegime(ML/yr)
Engineeringworks in river
Changingland use
Fencing
Mapped streambank erosion sites (km)0 to 55 to 88 to 10
33.333.333.3
Riparian Buffer (km)0 to 5050 to 7575 to 9090 to 114
25.025.025.025.0
Figure 7 Bayesian Network structure of the water quality sub-model in the George catchment framework
The complex, process-based water quality model will be converted into a BN-structure that serves as
a water quality sub-model in the Georges catchment integrated BN. Figure 7 shows the structure of
the water quality BN (no findings have been entered in the network). Changes in management actions
(engineering, fencing or land use changes) alter streambank erosion, the length of riparian vegetation
that serves as a nutrient and sediment trapping zone and the percentages of different land uses in the
catchment. Results from CatchMODS will provide predictions of changes in river flow, sediment and
nutrient concentrations. The BN structure does not capture all the hydrological processes modelled in
CatchMODS, but focuses on the management actions and their impacts on water quality. This BN
presents a simpler representation of the water quality model than the complex CatchMODS
framework and can be used to identify which management actions have the largest impact on water
quality parameters. The conditional probabilities that describe the links between catchment
management actions and water quality will be generated using Monte Carlo simulations of
management scenarios in CatchMODS. As such, the BN water quality model is conditional on the
information used in CatchMODS. Extensive documentation of all assumptions and data is included to
enable model verification and testing.
20

6.2 The ecological network
A BN sub-model was created for each output node, based on the ecological modelling outcomes. A
combination of empirical observations, biophysical modelling and theoretical knowledge about
ecosystem processes was used to predict the states that each node can assume in the BN. The
likelihood that different combinations of management actions would result in a change in nodes’
states was captured by a conditional probability distribution for each node. Initially, a uniform
distribution was used to capture ecosystem uncertainty, ranging from a maximum to minimum level
of each environmental attribute. These distributions then needed to be refined in the ecological
modelling to improve the models’ predictions. Proposed conditional probability distributions are
currently being scrutinised by Tasmanian scientists to increase knowledge integration in the model.
The seagrass and riparian vegetation sub-networks are shown in Appendix 3 and the rare species sub-
network is shown in Figure 8. The probabilities that a node is in a certain states are based on the
current observations in the George catchments, with wide confidence intervals to represent the
uncertainty in the system. For the example in Figure 8, the probability that the number of rare native
animals and plant species will be in one of the four states (<40, 40-60, 60-70 and >70) is conditional
on the states of water quality, land use, native riparian vegetation and habitat connectivity. Current
catchment land use is 2 percent urban, 15 percent agriculture, 5 percent forestry plantation, 45 percent
native production forest and 33 percent native vegetation under conservation. Uncertainty about the
state of the water quality node is shown by a 40 percent probability of being moderate or pristine and
a 20 percent probability of being poor.
Habitat connectivityLowMediumHigh
20.050.030.0
Water QualityPoorModeratePristine
20.040.040.0
Catchment landuse (%)UrbanAgricultureForest nonnative prodForest nat prodNative veg nonprod
2.0015.05.0045.033.0
Native Riparian Vegetation (km)Less 50Between 50 65More 65
10.020.070.0
Rare native animal and plant speciesLess 40Between 40 60Between 60 70More 70
5.005.0010.080.0
Figure 8 Species sub-model in the George catchment Bayesian Network
21

Inputs from monitoring data and CatchMODS Monte Carlo simulations are required to refine the
probability distribution of the water quality node. The current length of healthy native riparian
vegetation is more than 65 km and habitat connectivity is most likely to be medium. Using the
observations from the Natural Values Atlas (DPIW, 2008), the number of species is most likely to be
more than 70 species. To account for the uncertainty in this number of observations, small
probabilities were also assigned to the number of species being in one of the other states. More
accurate predictions and refining probability distributions are ongoing, involving a combination of
water quality modelling and expert review11.
6.3 The economics network
The various levels of the attributes presented in the CE survey were based on the minimum and
maximum levels predicted in the ecological modelling, and included the current level observed (see
Table 4). An intermediate level between the current observation and the ‘worst case’ scenario was
also included as an attribute level. For the purpose of the valuation study, the level of the riparian
vegetation attribute was described to respondents as the length in km of native riverside vegetation, so
the percentage of healthy vegetation in the George catchment riparian zone was converted into
kilometres rather than percentages. Note that the survey questionnaire described both measurement
units in the choice sets12.
Table 4 States of the nodes in the BN and levels of the attributes in CE survey
Variable BN states CE levels*
Native riverside vegetation (%)
< 40
40 - 60
60 - 70
> 70
35 (40km)
50 (56km)
65 (74km)
75 (84km)
Seagrass beds in Georges Bay(ha)
< 490
490 – 620
620 – 760
> 760
420
560
690
815
Rare native animals and plant species (number)
< 40
40 - 60
60 - 70
> 70
35
50
65
80 * Observed levels in bold
11 Results are expected by mid 2009 12 One split sample did not include a percentage description of attribute levels to examine respondents’ choice behaviour to different ways of describing attributes.
22
The next step is to integrate estimates of individual WTP for attribute changes from the base
alternative in the BN nodes for seagrass area, riparian vegetation or rare native species. These value
estimates need to be a function of the likelihood that the variable is in a certain state, and the 95%
confidence intervals of the WTP estimates obtained from the CE modelling. In this approach, the
defined uncertainty13 in the economic estimates are combined with the uncertainty of observing a
certain attribute level. There currently exist no detailed, prescriptive guidelines as to how conduct an
assessment of accumulated model uncertainties (Brouwer and De Blois, 2008). Ongoing work is
aimed at formulating an approach to perform structural uncertainty analyses in the model
7 Discussion and lessons learned A number of challenges that apply to interdisciplinary research and the development of integrated
hydro-economic model applications were revealed in this study. One integral feature in developing
the model was frequent communication between various academic disciplines and non-academic
participants, such as NRM bodies and community members. The study required scientists to think
beyond disciplinary boundaries. The use of different languages between natural science and
economics (e.g. ‘asset’ versus ‘attribute’, or ‘node’ versus ‘variable’) and sometimes limited
understanding of other disciplines posed a challenge for model developers.
Scientists needed to reach agreement about the level of model complexity. From a modelling
perspective, model parsimony was desirable. Hydrological modellers, ecologists and economists all
had their own idea of how detailed the model should be. Where ecologists wanted to capture the
complete system processes, the level of detail needed to be limited in the valuation study. Developing
a conceptual model with the most relevant variables was a lengthy and iterative process.
Discussions between scientists also involved the compatibility of the output variables provided and
input data required by the different sub-models. The spatial and temporal dimensions of the various
sub-models as well as the variables and their units of measurement needed to be the same. The
selection of variables and the definition of their levels based on sound scientific predictions proved a
considerable challenge that should not be underestimated (Brookshire et al., 2007). The variables
needed to be relevant to all stakeholders, including scientists, economists, decision makers and CE
survey respondents. These variables needed to be described in a way that matched natural science
definitions, while the measurement units needed to suit the valuation exercise. For example, natural
scientists favoured qualitative ways to describe environmental changes, while quantitative attribute
levels would benefit the CE study. An important question from a CE perspective was how to
accurately present the scientific results in ways that were comprehensible to respondents.
13 Defined uncertainty allows an analysis of the risk associated with uncertain WTP estimates.
23

Bayesian network modelling provides a suitable approach to integrating economic valuation and
biophysical modelling. The graphical representation of a BN clearly displays the links between
different system components. This facilitated discussions of the conceptual model structures with
scientists and decision makers. Advantages of using BNs to model environmental systems further
included the ability to incorporate data from different sources and the comprehensive representation
of system uncertainty in the form of probability distributions (Uusitalo, 2007). It should be noted,
however, that defining the probability distributions can be a lengthy and difficult process. A
considerable benefit of using the CE approach to environmental valuation lies in its ability to enable
an estimation of marginal values for multiple attributes. Results from the CE study can readily be
linked to the output nodes of the BN, through a matching of attribute levels and states.
8 Conclusion and further steps Catchment decision makers are facing a wide range of management issues that involve complex
environmental and socio-economic systems. Biophysical modelling tools have been developed to
support decision making by representing and predicting changes in the hydrological and ecological
systems. To effectively support catchment management, such tools needs to be integrated with
economic techniques. Integrated catchment models that are based on sound scientific foundations, and
include a representation of hydrological, ecological and socio-economic systems, are more likely to
provide decision makers with the appropriate information to enable an assessment of multiple values.
There are currently few catchment models that integrate sophisticated natural science models and non-
market economic valuation studies. This research addresses this knowledge gap by developing a
integrated model that combines science-based biophysical modelling and non-market valuation in one
framework, for a case study of the George catchment, Tasmania. A Bayesian Network modelling
approach was used to accommodate different source data and to represent the uncertainty in the
available information. Biophysical models were combined with a non-market valuation study to
enable an assessment of the impacts of alternative catchment management actions. Choice
experiments were used to assess the economic values Tasmanians hold for different environmental
attributes in the George catchment. The use of choice experiments enabled a valuation of changes in
several distinct attributes on a stepwise scale, making it a suitable valuation approach to be linked to
the Bayesian Network attribute states. Contrary to previous BN studies that aimed to integrate
valuation and environmental modelling, the biophysical and economic models were jointly developed,
enhancing the data compatibility between models.
Defining the relationships between variables involved iterative rounds of expert consultation and great
efforts were made to collect as much appropriate information in the time frame of this study.
However, the availability of scientific information about biophysical and socioeconomic processes in
Tasmanian catchments is sparse. Obtaining detailed, quantitative information about the environmental
24
attributes was limited by available scientific knowledge. Knowledge uncertainty was represented in
the BN through a coarse discretisation of states and by defining wide probability distributions in the
output nodes. Further discussions with natural scientists are carried out to refine the probability
distributions in the model.
The study described in this report has not been completed. Work is on-going to validate and refine the
models, through comparison with observational data and additional rounds of expert reviews. Prior
validation of the water quality and ecological modelling is essential to enable analyses of the effects
of alternative management scenarios in the Bayesian Network. It should be acknowledged that
improved quantity and quality of environmental data is needed to improve the representation of the
interactions between natural systems and their subsequent impacts on social and economic systems. In
particular, monitoring data and advanced modelling of ecological systems is required to achieve a
more sophisticated representation of the biophysical features underlying changes in socio-economic
systems.
Important further steps in the models’ development include sensitivity analyses to assess which
variables contribute most to environmental changes, and which variables have the largest impact on
subsequent value estimates. Additional analyses are also required to identify the variables that
contribute most to the model’s uncertainty. It is important to assess the propagation of uncertainty in
the linkages between models, and the sensitivity of the outcomes to the discretisation of states. Such
sensitivity and uncertainty analyses are needed to aid evaluation of the integrated model and to
identify weaknesses in the BN. Further research is being undertaken to formulate a structured and
systematic approach to performing uncertainty analyses in the integrated network.
9 References ACREMAN, M. (2005) Linking science and decision-making: features and experience from
environmental river flow setting. Environmental Modelling & Software, 20, 99-109. ARGENT, R. M. (2004) An overview of model integration for environmental applications--
components, frameworks and semantics. Environmental Modelling & Software, 19, 219-234. BAIRD, M., WALKER, S., WALLACE, B., SAKOV, P., PARSLOW, J. & WARING, J. (2002)
Simple Estuarine Response Model. http://www.per.marine.csiro.au/serm/. viewed 08-12-2007, CSIRO.
BARTON, D. N., SALORANTA, T., MOE, S. J., EGGESTAD, H. O. & KUIKKA, S. (2008) Bayesian belief networks as a meta-modelling tool in integrated river basin management -- Pros and cons in evaluating nutrient abatement decisions under uncertainty in a Norwegian river basin. Ecological Economics, 66, 91-104.
BATEMAN, I. J., BROUWER, R., DAVIES, H., DAY, B. H., DEFLANDRE, A., DI FALCO, S., GEORGIOU, S., HADLEY, D., HUTCHINS, M., JONES, A. P., KAY, D., LEEKS, G., LEWIS, M., LOVETT, A. A., NEAL, C., POSEN, P., RIGBY, D., SHELDON, E., TURNBULL, D. & TURNER, R. K. (2006a) Catchment Hydrology, Resources, Economic And Management (ChREAM): Integrated Modelling of Rural Land Use & Farm Income Impacts of the WFD and its Potential Non-Market Benefits. CSERGE Working Paper EDM 06-05. IIED, London, UK.
BATEMAN, I. J., BROUWER, R., DAVIES, H., DAY, B. H., DEFLANDRE, A., DIFALCO, S., GEORGIOU, S., HADLEY, D., HUTCHINS, M., JONES, A. P., KAY, D., LEEKS, G.,
25

LEWIS, M., LOVETT, A. A., NEAL, C., POSEN, P., RIGBY, D. & KERRY TURNER, R. (2006b) Analysing the Agricultural Costs and Non-market Benefits of Implementing the Water Framework Directive. Journal of Agricultural Economics, 57, 221-237.
BEETON, R. J. S., BUCKLEY, K. I., JONES, G. J., MORGAN, D., REICHELT, R. E. & TREWIN, D. (2006) Australia State of the Environment 2006. Independent report to the Australian Government Minister for the Environment and Heritage. Canberra, Department of Environment and Heritage.
BENNETT, J., DUMSDAY, R., HOWELL, G., LLOYD, C., STURGESS, N. & VAN RAALTE, L. (2008) The economic value of improved environmental health in Victorian rivers. Australasian Journal of Environmental Management, 15, 138-148.
BOD (2007) Break O'Day NRM Survey 2006 - Summary of Results. St Helens, Break O'Day Council.
BORSUK, M. E., STOW, C. A. & RECKHOW, K. H. (2004) A Bayesian network of eutrophication models for synthesis, prediction, and uncertainty analysis. Ecological Modelling, 173, 219-239.
BROMLEY, J., JACKSON, N. A., CLYMER, O. J., GIACOMELLO, A. M. & JENSEN, F. V. (2005) The use of Hugin to develop Bayesian networks as an aid to integrated water resource planning. Environmental Modelling & Software, 20, 231-242.
BROOKSHIRE, D. S., BRAND, L. A., THACHER, J., DIXON, M. D., BENEDICT, K., STROMBERG, J. C., LANSEY, K., GOODRICH, D., MCINTOSH, M., GRANDY, J., STEWART, S., BROADBENT, C. & IZON, G. (2007) Integrated Modeling and Ecological Valuation: Applications in the Semi Arid Southwest. Workshop "Valuation for Environmental Policy: Ecological Benefits". Washington DC, US Environmental Protection Agency.
BROUWER, R. & DE BLOIS, C. (2008) Integrated modelling of risk and uncertainty underlying the cost and effectiveness of water quality measures. Environmental Modelling & Software, 23, 922-937.
BROUWER, R. & HOFKES, M. (2008) Integrated hydro-economic modelling: Approaches, key issues and future research directions. Ecological Economics, 66, 16-22.
CASTELLETTI, A. & SONCINI-SESSA, R. (2007) Bayesian Networks and participatory modelling in water resource management. Environmental Modelling & Software, 22, 1075-1088.
CRAWFORD, C. & WHITE, C. (2005) Establishment of an Integrated Water Quality Monitoring Framework for Georges Bay. Hobart, Marine Research Laboratories and Tasmanian Aquaculture & Fisheries Institute.
DAVIES, P. E., LONG, J., BROWN, M., DUNN, H., HEFFNER, D. & KNIGHT, R. (2005) The Tasmanian Conservation of Freshwater Ecosystem Values (CFEV) framework: developing a conservation and management system for rivers. The freshwater protected areas conference 2004. Sydney, IRN and WWF-Australia.
DESVOUSGES, W. H., NAUGHTON, M. C. & PARSONS, G. R. (1992) Benefit Transfer: Conceptual Problems in Estimating Water Quality Benefits Using Existing Studies. Water Resources Research, 28, 675-683.
DEWR (2007) Assessment of the Harvest of Native Oysters (Ostrea angasi) from the Tasmanian Shellfish Fishery. Department of the Environment and Water Resources.
DHHS (2008) Triennial Data Review for the Moulting Bay Growing Area. Hobart, Tasmania, Tasmanian Shellfish Quality Assurance Program, Department of Health and Human Services.
DIXON, M. D., BRAND, L. A., STEWART, S., STROMBERG, J. C., LITE, S. J., BROOKSHIRE, D. & GOODRICH, D. (2008) Modeling Vegetation Change for Non-market Valuation of Riparian Ecosystems. ACES: A Conference on Ecosystem Services 2008: Using Science for Decision Making in Dynamic Systems. Naples, Florida.
DORNER, S., SHI, J. & SWAYNE, D. (2007) Multi-objective modelling and decision support using a Bayesian network approximation to a non-point source pollution model. Environmental Modelling & Software, 22, 211-222.
DPIW (2005a) The Conservation of Freshwater Ecosystem Values data layers. Hobart, Department of Primary Industries and Water, Water Assessment Branch.
26
DPIW (2005b) Environmental Management Goals for Tasmanian Surface Waters. Dorset & Break O'Day municipal areas. . IN DEPARTMENT OF PRIMARY INDUSTRIES, W. A. E. (Ed.) Hobart, Department of Primary Industries, Water and Environment.
DPIW (2005c) TASVEG, the Tasmanian Vegetation Map. Hobart, Department of Primary Industries and Water, Information and Land Services Division.
DPIW (2007) Annual Waterways Monitoring Reports 2006: George Catchment. Department of Primary Industries and Water.
DPIW (2008) Natural Values Atlas. http://www.naturalvaluesatlas.dpiw.tas.gov.au. Hobart, Department of Primary Industries and Water.
EU COMMISSION (2000) Directive 2000/60/EC of the European Parliament and of the Council, establishing a framework for the Community action in the field of water policy. Official Journal of the Eureopaan Economics K 327/1, 22.12.2000; http://europa.eu.int/comm/environment/water/water-framework/index_en.html.
FUJITA, Y., DE RUITER, P. & HEIL, G. W. (2007) Integrated eco-hydrological modeling of fens: a brief review and future perspectives. IN OKRUSZKO, T., MALTBY, E., SZATYLOWICZ, J., MIROSLAW-SWIATEK, D. & KOTOWSKI, W. (Eds.) Wetlands: Monitoring, Modelling and Management. Proceedings of the International Conference on Wetlands W3M. London, UK.
HAASE, R. & NOLTE, U. (2008) The invertebrate species index (ISI) for streams in southeast Queensland, Australia. Ecological Indicators, 8, 599-613.
HAMILTON, G. S., FIELDING, F., CHIFFINGS, A. W., HART, B. T., JOHNSTONE, R. W. & MENGERSEN, K. (2007) Investigating the Use of a Bayesian Network to Model the Risk of Lyngbya majuscula Bloom Initiation in Deception Bay, Queensland, Australia. Human and Ecological Risk Assessment, 13, 1271.
HEINZ, I., PULIDO-VELAZQUEZ, M., LUND, J. & ANDREU, J. (2007) Hydro-economic Modeling in River Basin Management: Implications and Applications for the European Water Framework Directive. Water Resources Management, 21, 1103-1125.
HENRIKSEN, H. J., RASMUSSEN, P., BRANDT, G., VON BÜLOW, D. & JENSEN, F. V. (2007) Public participation modelling using Bayesian networks in management of groundwater contamination. Environmental Modelling & Software, 22, 1101-1113.
JAKEMAN, A. J., LETCHER, R. A. & NORTON, J. P. (2006) Ten iterative steps in development and evaluation of environmental models. Environmental Modelling & Software, 21, 602-614.
JENSEN, F. V. (1996) An introduction to Bayesian networks New York Springer. KENNEN, J. G., KAUFFMAN, L. J., AYERS, M. A., WOLOCK, D. M. & COLARULLO, S. J.
(2008) Use of an integrated flow model to estimate ecologically relevant hydrologic characteristics at stream biomonitoring sites. Ecological Modelling, 211, 57-76.
KRAGT, M. E. & BENNETT, J. (2008) Developing a Questionnaire for Valuing Changes in Natural Resource Management in the George Catchment, Tasmania. Environmental Economics Research Hub Research Report No.8. Canberra, Crawford School of Economics and Government, Australian National University.
KRAGT, M. E. & BENNETT, J. (2009) Using choice experiments to value river and estuary health in Tasmania with individual preference heterogeneity. 53rd Annual Conference of the Australian Agricultural and Resource Economics Society. Cairns, 11-13 February 2009.
LADSON, A. R., WHITE, L. J., DOOLAN, J. A., FINLAYSON, B. L., HART, B. T., LAKE, P. S. & TILLEARD, J. W. (1999) Development and testing of an Index of Stream Condition for waterway management in Australia. Freshwater Biology, 41, 453-468.
LANINI, S., COURTOIS, N., GIRAUD, F., PETIT, V. & RINAUDO, J. D. (2004) Socio-hydrosystem modelling for integrated water-resources management--the Herault catchment case study, southern France. Environmental Modelling & Software, 19, 1011-1019.
LIU, Y., GUPTA, H., SPRINGER, E. & WAGENER, T. (2008) Linking science with environmental decision making: Experiences from an integrated modeling approach to supporting sustainable water resources management. Environmental Modelling & Software, 23, 846-858.
LLIFF, G. (2002) George River Catchment: Plan for Rivercare Works for the Upper Catchment, North George and South George Rivers. St Helens, George River Catchment Coordinator, 2002.
27
MALLAWAARACHCHI, T., BLAMEY, R. K., MORRISON, M. D., JOHNSON, A. K. L. & BENNETT, J. W. (2001) Community values for environmental protection in a cane farming catchment in Northern Australia: A choice modelling study. Journal of Environmental Management, 62, 301-316.
MALLAWAARACHCHI, T. & QUIGGIN, J. (2001) Modelling socially optimal land allocations for sugar cane growing in North Queensland: a linked mathematical programming and choice modelling study. The Australian Journal of Agricultural and Resource Economics, 45, 383-409.
MARTÍN DE SANTA OLALLA, F. J., DOMÍNGUEZ, A., ARTIGAO, A., FABEIRO, C. & ORTEGA, J. F. (2005) Integrated water resources management of the Hydrogeological Unit "Eastern Mancha" using Bayesian Belief Networks. Agricultural Water Management, 77, 21-36.
MCKENNY, C. & SHEPHERD, C. (1999) Ecological flow requirements for the George River. Technical Report No. WRA 99/14. Hobart, Department of Primary Industries, Water and Environment.
MERRITT, W. S., TICEHURST, J. L. & RISSIK, D. (2006) Coastal Lake Assessment and Management (CLAM) Tool : User Guide. iCAM Technical Report 2006/02. Canberra, Integrated Catchment Assessment and Management Centre, Australian National University.
MOUNT, R., CRAWFORD, C., VEAL, C. & WHITE, C. (2005) Bringing Back the Bay - Marine Habitats and Water Quality in Georges Bay. Hobart, Break O'Day Natural Resource Management Strategy.
MOXEY, A. P., WHITE, B. & O'CALLAGHAN, J. R. (1995) The Economic Component of NELUP. Journal of Environmental Planning and Management, 38, 21-34.
NEWHAM, L. T. H., DREWRY, J. J. & FUA, B. (2008) Catchment-Scale Water Quality Modelling and Integration of Collateral Information. IN SÀNCHEZ-MARRÈ, M., BÉJAR, J., COMAS, J., RIZZOLI, A. & GUARISO, G. (Eds.) International Congress on Environmental Modelling and Software Integrating Sciences and Information Technology for Environmental Assessment and Decision Making. Barcelona, July 7-10 2008, International Environmental Modelling and Software Society (iEMSs).
NEWHAM, L. T. H., LETCHER, R. A., JAKEMAN, A. J. & KOBAYASHI, T. (2004) A framework for integrated hydrologic, sediment and nutrient export modelling for catchment-scale management. Environmental Modelling & Software, 19, 1029-1038.
NLWRA (2001) Estuary Assessment 2000. Theme 7: Waterway and Estuarine, and Catchment and Landscape Health. Indooroopilly, Cooperative Research Centre for Coastal Zone, Estuary and Waterway Management.
NLWRA (2008) National Land & Water Resources Audit. http://nlwra.gov.au/. Canberra, Australian Government.
NRM NORTH (2008a) Our Region's Priorities: Water. http://www.nrmtas.org/regions/north/waterPriority.shtml. Launceston.
NRM NORTH (2008b) State of the Region: Water Quality and Stream Condition in Northern Tasmania 2006. Launceston, Northern Water Monitoring Team.
NWI (2004) Intergovernmental Agreement on a National Water Initiative. IN COAG COUNCIL OF AUSTRALIAN GOVERNMENTS (Ed.).
PARSONS, M., THOMAS, M. & NORRIS, R. (2002) Australian River Assessment System: Review of Physical River Assessment Methods — A Biological Perspective. Monitoring River Health Initiative Technical Report Number 21. Canberra, Commonwealth of Australia and University of Canberra.
PEARL, J. (1988) Probabilistic reasoning in intelligent systems : networks of plausible inference, San Mateo, California, Morgan Kaufmann Publishers.
RATTRAY, T. (2001) Draft Rivercare Plan 2001 for the Upper George River. St Helens, George River Catchment Coordinator, 1998-2001.
REINHARD, S. & LINDERHOF, V. (2006) Inventory of economic models. Water Economic Models for Policy Analysis (WEMPA) report-03. Amsterdam, Institute for Environmental Studies.
28
ROSEGRANT, M. W., RINGLER, C., MCKINNEY, D. C., CAI, X., KELLER, A. & DONOSO, G. (2000) Integrated economic-hydrologic water modeling at the basin scale: the Maipo river basin. Agricultural Economics, 24, 33-46.
RUSHTON, S. P., CHERRILL, A. J., TUCKER, K. & O'CALLAGHAN, J. R. (1995) The Ecological Modelling System of NELUP. Journal of Environmental Planning and Management, 38, 35-52.
SADODDIN, A., LETCHER, R. A., JAKEMAN, A. J. & NEWHAM, L. T. H. (2005) A Bayesian decision network approach for assessing the ecological impacts of salinity management. Mathematics and Computers in Simulation, 69, 162-176.
SPROD, D. (2003) Draft rivercare plan Lower George River. St Helens, Lower George Landcare Group.
THORNES, J. B. & ROWNTREE, K. M. (2006) Integrated catchment management in semiarid environments in the context of the European Water Framework Directive. Land Degradation & Development, 17, 355-364.
TICEHURST, J. L., LETCHER, R. A. & RISSIK, D. (2008) Integration modelling and decision support: A case study of the Coastal Lake Assessment and Management (CLAM) tool. Mathematics and Computers in Simulation, 78, 435-449.
TICEHURST, J. L., NEWHAM, L. T. H., RISSIK, D., LETCHER, R. A. & JAKEMAN, A. J. (2007) A Bayesian network approach for assessing the sustainability of coastal lakes in New South Wales, Australia. Environmental Modelling & Software, 22, 1129-1139.
UUSITALO, L. (2007) Advantages and challenges of Bayesian networks in environmental modelling. Ecological Modelling, 203, 312-318.
VAN DEN BERGH, J. C. J. M., BARENDREGT, A., GILBERT, A. J., VAN HERWIJNEN, M., VAN HORSSEN, P., KANDELAARS, P. & LORENZ, C. (2001) Spatial economic–hydroecological modelling and evaluation of land use impacts in the Vecht wetlands area. Environmental Modeling and Assessment, 6, 87-100.
WALKER, J., DOWLING, T. & VEITCH, S. (2006) An assessment of catchment condition in Australia. Ecological Indicators, 6, 205-214.
WALKER, W. E., HARREMOËS, P., ROTMANS, J., VAN DER SLUIJS, J. P., VAN ASSELT, M. B. A., JANSSEN, P. & KRAYER VON KRAUSS, M. P. (2003) Defining Uncertainty: A conceptual basis for uncertainty management in Model-Based Decision Support. Integrated Assessment, 4, 5-17.
WHITE, L. J. & LADSON, A. R. (1999) An Index of Stream Condition: Reference Manual. Melbourne, Department of Natural Resources and Environment.
WHITTEN, S. & BENNETT, J. (2003a) A bio-economic model of wetland protection on private lands. National Wetlands Research and Development Program, http://www.ecosystemservicesproject.org/html/publications/docs/wetlands.pdf.
29
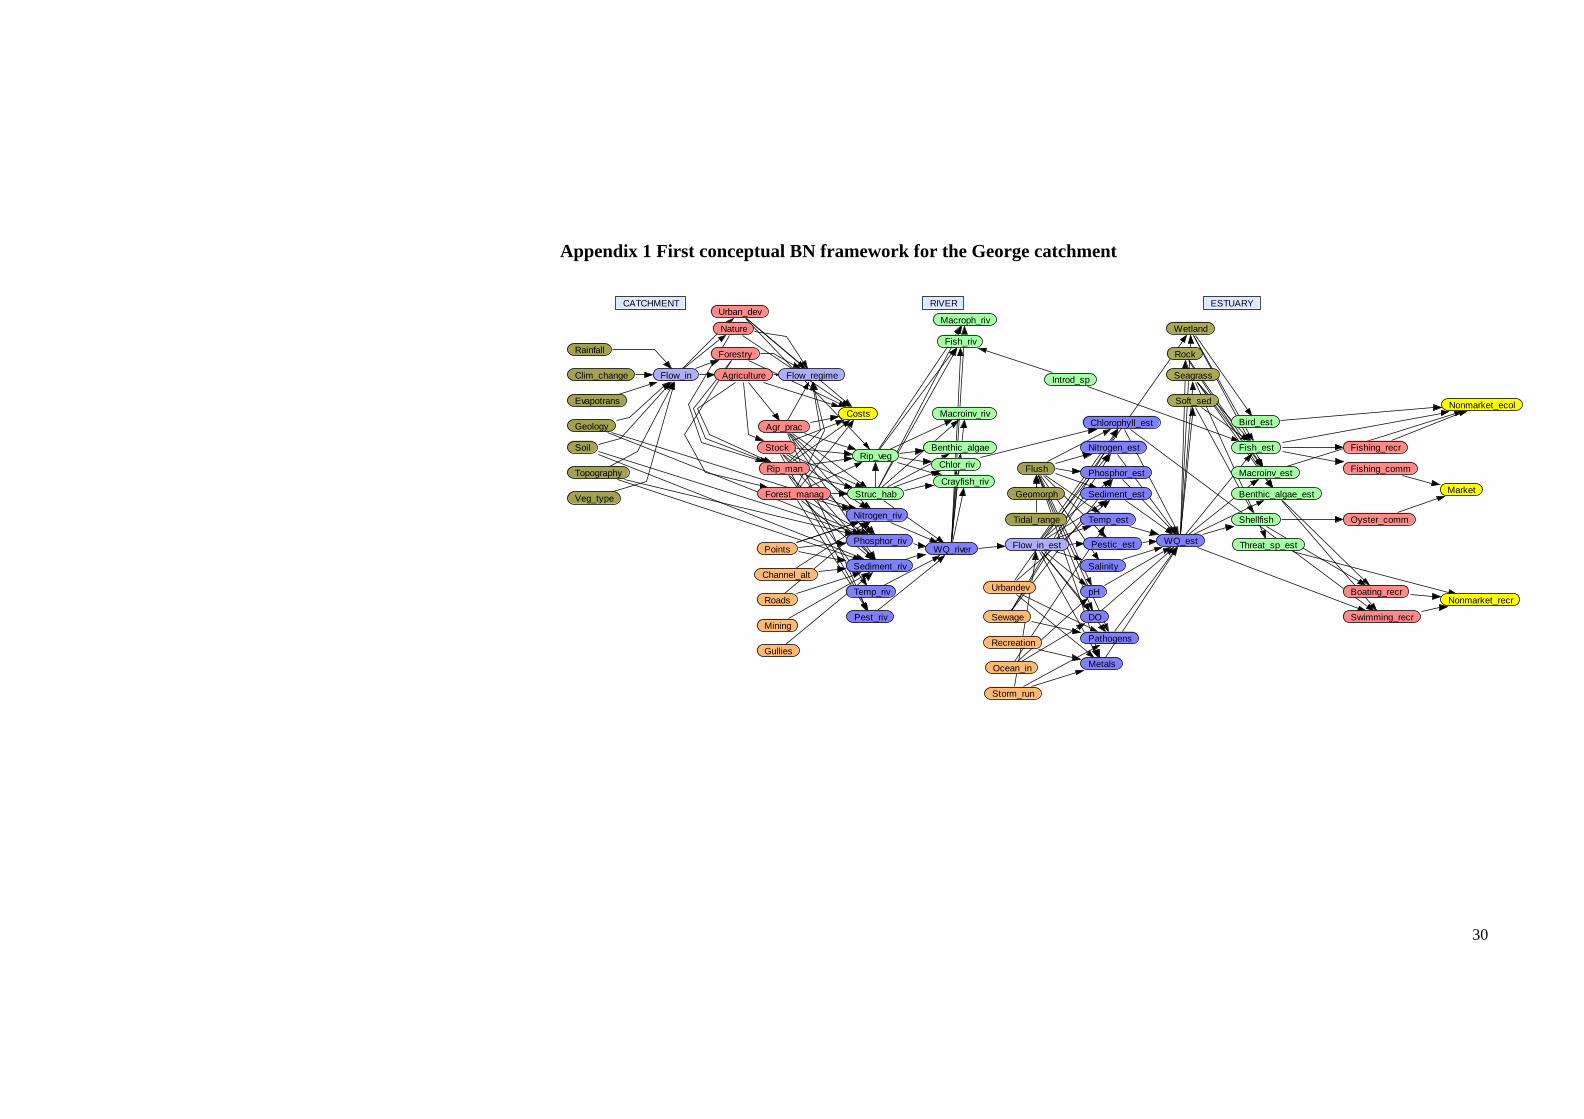
Appendix 1 First conceptual BN framework for the George catchment
CATCHMENT RIVER ESTUARY
30
Flow_in Flow_regime
Fish_est
Macroinv_est
Benthic_algae_est
Bird_est
Clim_change
Rainfall Forestry
Nature
Evapotrans
Veg_type
Topography
Soil
Wetland
Rock
Phosphor_est
Nitrogen_est
Sediment_est
Temp_est
Pathogens
Metals
Pestic_est
Salinity
pH
DO
Chlorophyll_est
Phosphor_riv
Nitrogen_riv
Sediment_riv
Temp_riv
Geology
Agriculture
CostsAgr_prac
Forest_manag
Rip_man
Stock
WQ_river
Channel_alt
Points
SeagrassIntrod_sp
Soft_sed Nonmarket_ecol
Fishing_recr
Fishing_comm
Market
Shellfish Oyster_comm
WQ_estFlow_in_est Threat_sp_est
Urbandev Boating_recrRoads Nonmarket_recr
Pest_riv Sewage Swimming_recrMining
RecreationGullies
Ocean_in
Storm_run
Macroph_riv
Struc_hab
Rip_veg
Fish_riv
Crayfish_riv
Macroinv_riv
Chlor_riv
Benthic_algae
Urban_dev
Flush
Geomorph
Tidal_range

Appendix 2 Integrated BN model for the George catchment
RiparianBuffer(km)
Streambankerosion(km)
Catchmentlanduse (%)
Changingland use
Fencing
Engineeringworks in river
NativeExoticRatio
Weed management
EstuarySalinity
Oysterproduction
OysterProductionvalues
EstuaryTSS Estuary Turbidity Light attenuation
Estuary PO4
Seagrassarea
Non-marketvaluesof seagrass
Chlorophyll aEstuaryNOx
FlowRegime(flood/normal)
RiverTP
RiverTSS
RiverTN
NativeRiparianVegetation
Connectivityof riparianzone
RiverWQ
Rare nativespecies
Non-market valuesof rare species
Non-market valuesof riparian vegetation
31
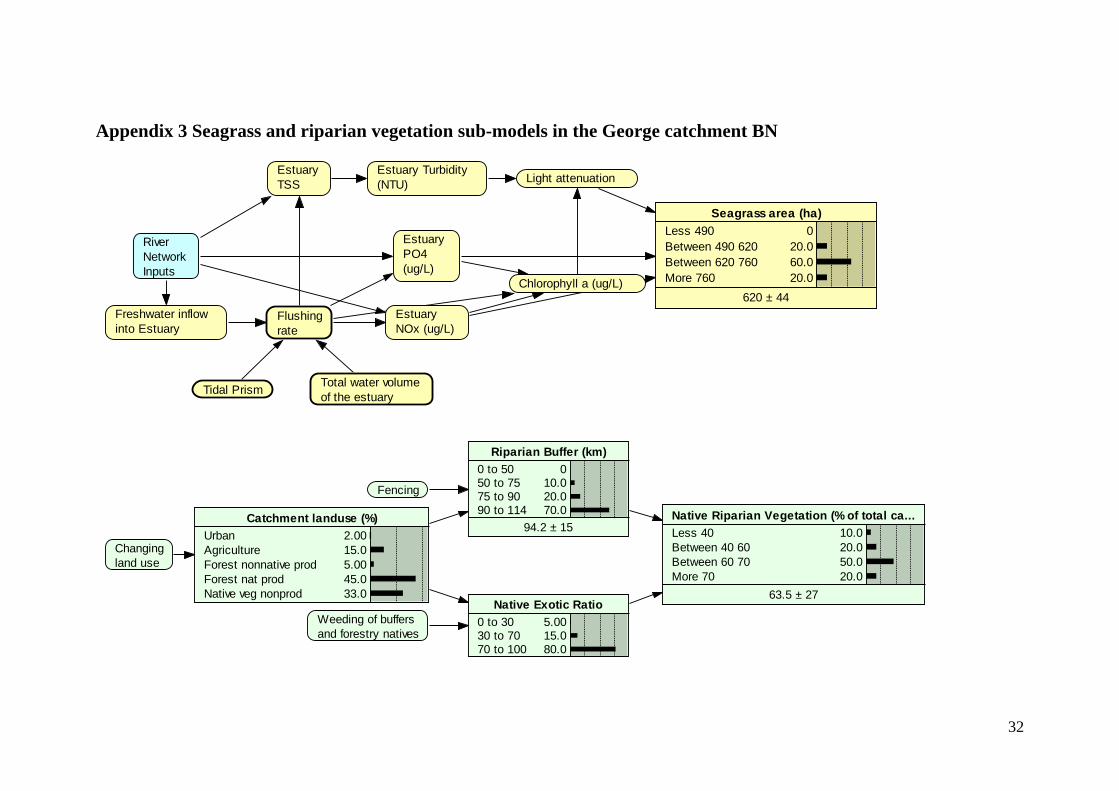
Appendix 3 Seagrass and riparian vegetation sub-models in the George catchment BN
Seagrass area (ha)Less 490Between 490 620Between 620 760More 760
020.060.020.0
620 ± 44Flushingrate
RiverNetwork Inputs
Freshwater inflowinto Estuary
Total water volume of the estuaryTidal Prism
EstuaryTSS
Estuary Turbidity(NTU)
Estuary PO4(ug/L)
EstuaryNOx (ug/L)
Light attenuation
Chlorophyll a (ug/L)
Riparian Buffer (km)0 to 5050 to 7575 to 9090 to 114
010.020.070.0
94.2 ± 15
Native Exotic Ratio0 to 3030 to 7070 to 100
5.0015.080.0
Fencing
Weeding of buffersand forestry natives
Catchment landuse (%)UrbanAgricultureForest nonnative prodForest nat prodNative veg nonprod
2.0015.05.0045.033.0
Native Riparian Vegetation (% of total ca...Less 40Between 40 60Between 60 70More 70
10.020.050.020.0
63.5 ± 27
Changingland use
32