ISSN: 1793-8236 Analysis of Influence of Draw Bead … International Journal of Engineering and...
5
IACSIT International Journal of Engineering and Technology, Vol.2, No.4, August 2010 ISSN: 1793-8236 356 Abstract—The quality of sheet metal part is secured by the material flow into the die cavity. Drawbeads are often used in sheet metal forming to restrain the sheet from flowing freely into die cavity. In this paper, finite element method was used to optimize the location of a circular and rectangular drawbeads and analyse the strain and thickness variations during the cup drawing process. DYNAFORM and LS-DYNA, a commercially available explicit FEA code were used to model and analyze the forming process respectively. In simulation, a hemispherical cup of diameter 100mm was considered and simulation studies were carried out for all possible locations of drawbead-, and location which gave minimum Vonmises stress and maximum thickness was taken as the optimized location. Experiments were conducted using a die block of 102mm inner diameter and punch of 100mm diameter on cold rolled steel of thickness 1.02mm. Circular drawbead of specific height was made on the binder surface at the optimized location corresponding groove was machined on the die surface and forming of cup was completed.The experiment was repeated with rectangular drawbead also. Strain and thickness variations were measured for the cup drawing process. The results show good agreement between numerical method and experiment. On comparison, rectangular drawbeads restrain the material more than circular drawbead. Index Terms—Drawbead, LS-DYNA, Plastic strain, Sheet metal forming. I. INTRODUCTION In sheet metal forming, the rate of material flow into die cavity must be controlled so that a better quality is maintained and defects like wrinkling, tearing and galling are prevented. Generally the restraining force required to control the material flow is provided by either the blank holder or the drawbeads. The blank holder creates restraining force by friction between sheet and the tooling. When a high restraining force is required, higher binder pressure must be applied to increase the frictional resistance force, which may cause excessive wear in the tooling and galling in strip. In some cases the required binder force may exceed the tonnage capacity of the press. Hence a local mechanism is desired which restrains the material flow sufficiently at relatively low blank holder pressure. The draw bead consists of a small groove on the die surface / binder surface matched by protrusion on the binder surface / die surface as shown in Fig 1. After the binder closure, the sheet metal is drawn over the Manuscript received on May 2, 2010 A. Assistant Professor, School of Mechanical Engineering, S.R.M. University,Chennai, India, Pin – 603 203. [email protected] B. Principal, D.M.I College of Engineering, Chennai – 602 103 C. Professor and Head, Department of Production Technology, MIT, Anna University, Chennai – 44 drawbead and is subjected to a bending and a subsequent unbending around the entry groove shoulder, bead and at the exit groove shoulder. These bending and unbending deformations together with the frictional force account for the draw bead restraining force. Fig 1 Location of drawbead on press tool II. LITERATURE SURVEY Quite a few efforts have been focused on the study of the drawbead. These include study of steady state experiments conducted by Nine [1-2] who used simplified geometry to investigate the various parameters affecting the restraining forces in the bead. Wang [3] proposed a mathematical model of the drawbead forces for calculating the force required to draw sheet metal past a drawbead of constant cross section. Levy [4] had improved Wang and Nine’s study on drawbeads in 1983. A theoretical model based on virtual work principle was proposed by Chen [5] to calculate the restraining force produced by the drawbead located on a stamping die surface. Samuel [6] devised a numerical model to determine the pull force, shear force and bending moment required to form sheet metal subjected to plane strain. A simple and very effective algorithm has been outlined and demonstrated for the optimal drawbead design problem for deep drawing cups without ears by V.Vahdat et.al [7] in 2006. The work reported in this paper concentrates on numerical analyses about a circular and rectangular drawbead position on the die surface and their effect on the strain and thickness distribution over the formed cup. Numerical investigations are carried out using LS-DYNA to observe strain and thickness distribution. Experiments were conducted to validate the numerical findings. The results obtained were used to validate the numerical findings. III. NUMERICAL MODELING Modeling of press tool and blank and pre-processing were done using DYNAFORM and finite element analysis was done using LS-DYNA. The punch and die were modeled using shell elements and have been assigned with RIGID MATERIAL MODEL [8]with surface mesh option. The diameter of punch was 100mm and diameter of die was 102.2mm with entry radius 6.5mm. The blank of 174mm diameter was assigned with TRANSVERSELY_ANISOTROPIC_ELASTIC-PLASTIC Analysis of Influence of Draw Bead Location and Profile in Hemispherical Cup Forming A. Murali G., B. Gopal M. and C. Rajadurai A
Transcript of ISSN: 1793-8236 Analysis of Influence of Draw Bead … International Journal of Engineering and...

IACSIT International Journal of Engineering and Technology, Vol.2, No.4, August 2010 ISSN: 1793-8236
356
Abstract—The quality of sheet metal part is secured by
the material flow into the die cavity. Drawbeads are often used in sheet metal forming to restrain the sheet from flowing freely into die cavity. In this paper, finite element method was used to optimize the location of a circular and rectangular drawbeads and analyse the strain and thickness variations during the cup drawing process. DYNAFORM and LS-DYNA, a commercially available explicit FEA code were used to model and analyze the forming process respectively. In simulation, a hemispherical cup of diameter 100mm was considered and simulation studies were carried out for all possible locations of drawbead-, and location which gave minimum Vonmises stress and maximum thickness was taken as the optimized location. Experiments were conducted using a die block of 102mm inner diameter and punch of 100mm diameter on cold rolled steel of thickness 1.02mm. Circular drawbead of specific height was made on the binder surface at the optimized location corresponding groove was machined on the die surface and forming of cup was completed.The experiment was repeated with rectangular drawbead also. Strain and thickness variations were measured for the cup drawing process. The results show good agreement between numerical method and experiment. On comparison, rectangular drawbeads restrain the material more than circular drawbead.
Index Terms—Drawbead, LS-DYNA, Plastic strain, Sheet
metal forming.
I. INTRODUCTION In sheet metal forming, the rate of material flow into
die cavity must be controlled so that a better quality is maintained and defects like wrinkling, tearing and galling are prevented. Generally the restraining force required to control the material flow is provided by either the blank holder or the drawbeads. The blank holder creates restraining force by friction between sheet and the tooling. When a high restraining force is required, higher binder pressure must be applied to increase the frictional resistance force, which may cause excessive wear in the tooling and galling in strip. In some cases the required binder force may exceed the tonnage capacity of the press. Hence a local mechanism is desired which restrains the material flow sufficiently at relatively low blank holder pressure.
The draw bead consists of a small groove on the die surface / binder surface matched by protrusion on the binder surface / die surface as shown in Fig 1. After the binder closure, the sheet metal is drawn over the
Manuscript received on May 2, 2010 A. Assistant Professor, School of Mechanical Engineering, S.R.M.
University,Chennai, India, Pin – 603 203. [email protected] B. Principal, D.M.I College of Engineering, Chennai – 602 103 C. Professor and Head, Department of Production Technology, MIT,
Anna University, Chennai – 44
drawbead and is subjected to a bending and a subsequent unbending around the entry groove shoulder, bead and at the exit groove shoulder. These bending and unbending deformations together with the frictional force account for the draw bead restraining force.
Fig 1 Location of drawbead on press tool
II. LITERATURE SURVEY Quite a few efforts have been focused on the study of the
drawbead. These include study of steady state experiments conducted by Nine [1-2] who used simplified geometry to investigate the various parameters affecting the restraining forces in the bead. Wang [3] proposed a mathematical model of the drawbead forces for calculating the force required to draw sheet metal past a drawbead of constant cross section. Levy [4] had improved Wang and Nine’s study on drawbeads in 1983. A theoretical model based on virtual work principle was proposed by Chen [5] to calculate the restraining force produced by the drawbead located on a stamping die surface. Samuel [6] devised a numerical model to determine the pull force, shear force and bending moment required to form sheet metal subjected to plane strain. A simple and very effective algorithm has been outlined and demonstrated for the optimal drawbead design problem for deep drawing cups without ears by V.Vahdat et.al [7] in 2006.
The work reported in this paper concentrates on numerical analyses about a circular and rectangular drawbead position on the die surface and their effect on the strain and thickness distribution over the formed cup. Numerical investigations are carried out using LS-DYNA to observe strain and thickness distribution. Experiments were conducted to validate the numerical findings. The results obtained were used to validate the numerical findings.
III. NUMERICAL MODELING Modeling of press tool and blank and pre-processing were
done using DYNAFORM and finite element analysis was done using LS-DYNA. The punch and die were modeled using shell elements and have been assigned with RIGID MATERIAL MODEL [8]with surface mesh option. The diameter of punch was 100mm and diameter of die was 102.2mm with entry radius 6.5mm. The blank of 174mm diameter was assigned with TRANSVERSELY_ANISOTROPIC_ELASTIC-PLASTIC
Analysis of Influence of Draw Bead Location and Profile in Hemispherical Cup Forming
A. Murali G., B. Gopal M. and C. Rajadurai A
IACSIT International Journal of Engineering and Technology, Vol.2, No.4, August 2010 ISSN: 1793-8236
model [9] and shell element with uniform thickness of 1.02mm. The material considered for this study was cold rolled steel (AISI 1008) and its properties are given in Table 1.
TABLE 1 MECHANICAL PROPERTIES OF MATERIAL Material Cold rolled steel
(AISI 1008) Young’s modulus,GPa 210 Mass Density, kg/m3 7800 Poisson’s ratio 0.28 Yield stress, MPa 280
A. Numerical simulation
In numerical simulation , contact is necessary between the sliding bodies for the metal forming process. In this study CONTACT_FORMING_ONE_WAY_SURFACE_TO _SURFACE title algorithm [8,9]was used for the contact between the punch, die, blank holder and blank. The blank was treated as master surface and others were treated as slave surfaces. The static coefficient of friction between the contacts were taken as 0.14. An artificial velocity of 5m/sec was given to the punch in z direction downwards with stroke distance of 40mm. The binder force was set as 8.5 tons towards negative z direction. The flow of material on the drawbead during forming process is controlled by bending and normal load curve provided in DYNAFORM. Numerical simulations were carried out for the given conditions and results were obtained. The circular and rectangular drawbeads were modeled on the die surface with the dimensions given in Table 2. The profile of drawbeads given in DYNAFORM is shown in Fig.3. A uniform gap of 0.2mm was maintained between blank, blank holder and die surface using AUTOPOSITION command.
TABLE 2 DIMENSIONS OF DRAWBEADS
Drawbead type Circular Rectangular Depth 3.5mm 3.5 mm Width 6.5 mm 6.5 mm
Entrance radius 1.5mm 1.5 mm
Groove radius 1.5 mm 1.5 mm
Groove angle 55º 55º Entrance angle 55º 55º
Fig 2 Profiles of Circular and Rectangular drawbeads
B Optimization of Drawbead Position
The positioning of the drawbeads is crucial to their effectiveness. They should be close to the area requiring restraint and perpendicular to the flow of material.The drawbead is positioned at various locations over the binder surface from the center of the die cavity. Initially
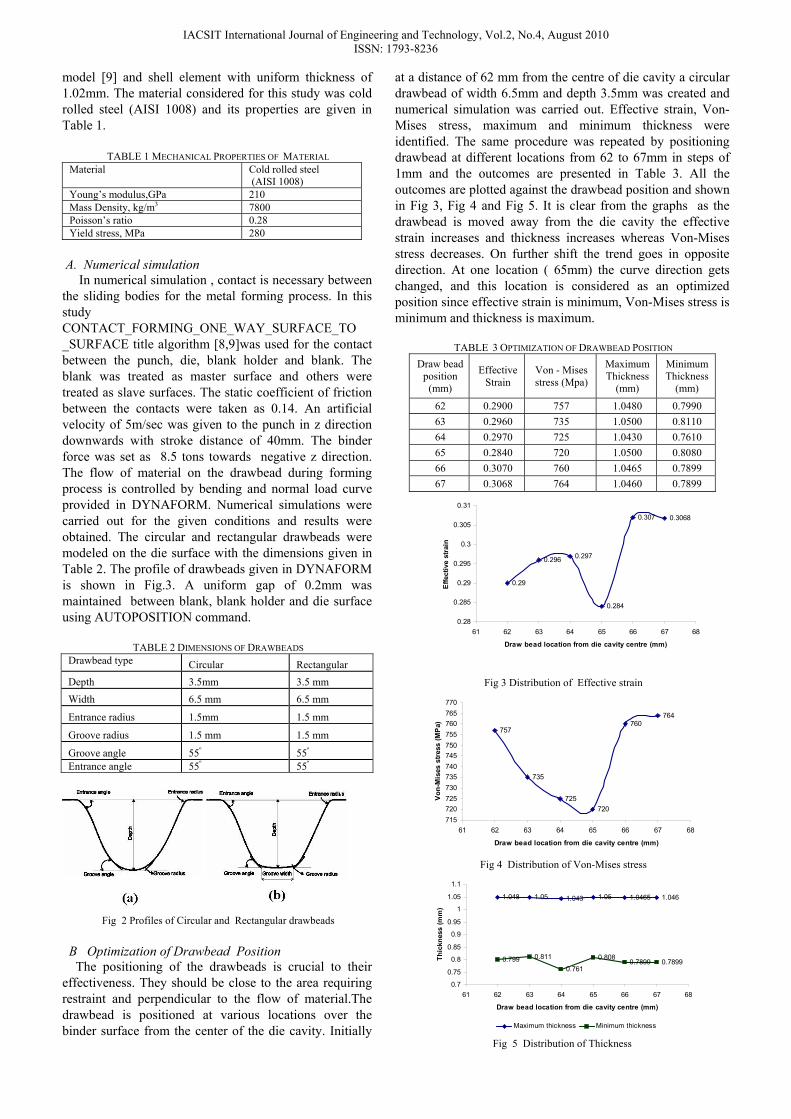
at a distance of 62 mm from the centre of die cavity a circular drawbead of width 6.5mm and depth 3.5mm was created and numerical simulation was carried out. Effective strain, Von-Mises stress, maximum and minimum thickness were identified. The same procedure was repeated by positioning drawbead at different locations from 62 to 67mm in steps of 1mm and the outcomes are presented in Table 3. All the outcomes are plotted against the drawbead position and shown in Fig 3, Fig 4 and Fig 5. It is clear from the graphs as the drawbead is moved away from the die cavity the effective strain increases and thickness increases whereas Von-Mises stress decreases. On further shift the trend goes in opposite direction. At one location ( 65mm) the curve direction gets changed, and this location is considered as an optimized position since effective strain is minimum, Von-Mises stress is minimum and thickness is maximum.
TABLE 3 OPTIMIZATION OF DRAWBEAD POSITION
Draw beadposition
(mm)
Effective Strain
Von - Mises stress (Mpa)
Maximum Thickness
(mm)
Minimum Thickness
(mm)
62 0.2900 757 1.0480 0.7990 63 0.2960 735 1.0500 0.8110 64 0.2970 725 1.0430 0.7610 65 0.2840 720 1.0500 0.8080 66 0.3070 760 1.0465 0.7899 67 0.3068 764 1.0460 0.7899
0.29
0.296 0.297
0.284
0.307 0.3068
0.28
0.285
0.29
0.295
0.3
0.305
0.31
61 62 63 64 65 66 67 68
Draw bead location from die cavity centre (mm)
Effe
ctiv
e st
rain
Fig 3 Distribution of Effective strain
757
735
725720
760764
715720725730735740745750755760765770
61 62 63 64 65 66 67 68
Draw bead location from die cavity centre (mm)
Von-
Mis
es s
tress
(MP
a)
Fig 4 Distribution of Von-Mises stress
1.048 1.05 1.043 1.05 1.0465 1.046
0.799 0.811
0.761
0.8080.7899 0.7899
0.7
0.75
0.8
0.85
0.9
0.95
1
1.05
1.1
61 62 63 64 65 66 67 68
Draw bead location from die cavity centre (mm)
Thic
knes
s (m
m)
Maximum thickness Minimum thickness Fig 5 Distribution of Thickness

IACSIT International Journal of Engineering and Technology, Vol.2, No.4, August 2010 ISSN: 1793-8236
358
C Numerical results
Numerical simulations were conducted in three phases namely, hemispherical cup forming without drawbead, with circular and rectangular drawbead at optimized position similar to the experiments , which were performed later. Post processor of LS-DYNA was utilized to obtain the thickness distribution, strain distribution, Von-Mises stress distribution on the formed blank and the observations are given in Table 4. The thickness of drawn cup was noted at locations in the direction starting from the centre of the cup to the edge as shown in Fig 6 . The numerical results of thickness variation for all three cases are shown in Fig 7, Fig 8 and Fig 9.
Fig 6 Thickness measurement locations on cup surface
Fig 7 Thickness distribution (Numerical- Without drawbead )
Fig 8 Thickness distribution (Numerical - circular drawbead)
Fig 9 Thickness distribution (Numerical- rectangular drawbead )
IV. EXPERIMENTAL WORK
For the validation of finite element analysis, comparison with experimental finding is very important. Experimental setup was prepared and press tools were
designed and manufactured in order to obtain appropriate experimental results. For drawing a hemispherical cup of 100mm diameter and 50 mm height from the flat sheet blank of 1.02 mm thickness, the press tool was designed using standard press tool design procedure [10]. Diameter of blank was computed as 174 mm. Punch was manufactured from high carbon high chromium steel stock. Die block was made from oil hardened steel.The inner diameter of die was taken as 102.2mm including clearance and outer diameter was taken as 250mm to accommodate the blank .Thickness of die block was taken as 50mm to facilitate machining of drawbeads. Based on the punch force the 100 ton hydraulic press with die cushion rod was selected. The ram speed of 10mm/sec and maximum stroke distance of 150mm were selected for the experiment The complete die set, which comprises of die, punch and binder, was mounted on the hydraulic press with the help of suitable fixture as shown in Fig 10.
Fig. 10. Experimental Setup
Fig 11 Blank Holder with circular drawbead
Fig 12 Cups formed without and with circular
drawbead
Few number of hemispherical cups were formed without the presence of drawbead. The thickness distribution of formed cup were measured at selective locations as shown in Fig 6 using dial gauge. At optimized position circular drawbead of height 3.5mm was machined on blank holder (Fig 11) which was centrally placed over the sheet metal blank and a contra bead called the female bead was machined on the die surface. Cups were formed ( Fig 12 ) and measurements were taken for comparison. The same procedure was repeated with rectangular draw bead of height 3.5mm and experiments were conducted.
V. RESULTS AND DISCUSSION

IACSIT International Journal of Engineering and Technology, Vol.2, No.4, August 2010 ISSN: 1793-8236
To obtain the effect of drawbeads in sheet metal
forming few cups were drawn without the presence of drawbeads and thickness was measured. Circular and rectangular drawbeads were introduced at optimized locations at die blank holder interface and experiments were repeated. A Thickness Distribution
The details of the thickness measured at 15 locations are given in Table 4 for experimental and numerical studies. When no drawbead was used the thickness of the cup had varied from 0.786mm to 1.03mm in the experimental specimens, whereas in numerical simulations the variation is from 0.87mm to 1.05mm. The thickness comparison graph for numerical values and experimental readings are shown in Fig 13 and Fig 14 respectively. Both the curve show thinning is more in the middle region where stretching taking place, gradually thickness increases towards the bottom portion. Due to compressive strain the flange portion has the maximum thickness, which is even thicker than original sheet thickness.
From the Table 4 it is observed that there is a deviation of about only 10% between experimental and numerical findings which shows good agreement between them. Introduction of drawbeads reduces the thickness in the side and bottom portion of the cup but there is no considerable change in the flange area. From Fig 13 and Fig 14 the thickness reduction caused by rectangular drawbead is more compared to circular drawbead due to the reason that blank is bent and unbent four times over rectangular bead instead of three times over circular bead. Since the rectangular drawbead controls more material, the flange portion is thicker than other two cases. This is proved by the right end of the curve ( locations 13 to 14 ) in Fig 14.
0.6
0.7
0.8
0.9
1
1.1
1 2 3 4 5 6 7 8 9 10 11 12 13 14 15
Locations
Thic
knes
s (m
m)
w ithout draw beadcircular draw beadrectangular draw bead
Fig 13 Comparison of thickness distribution
(Numerical)
0.6
0.7
0.8
0.9
1
1.1
1 2 3 4 5 6 7 8 9 10 11 12 13 14 15
Locations
Thic
knes
s (m
m)
Without drawbead
circular drawbead
rectangular drawbead
Fig 14 Comparison of thickness distribution
(Experimental) B Plastic Strain
The numerical simulation of distribution of plastic strain during cup formation with and without drawbeads
are shown in Fig.15, Fig 16 and Fig 17. .The plastic strain values are measured from numerical outcomes and presented in Table 5. The same values are plotted in a graph for better comparison. in Fig 18.
Fig 15 Plastic strain distribution ( without bead)
Fig 16 Plastic strain distribution (Circular drawbead)
Fig 17 Plastic strain distribution ( Rectangular drawbead)
TABLE 5 COMPARISON OF PLASTIC STRAIN
( NUMERICAL )
Locations
Plastic strain
Without drawbead
With circular drawbead
With rectangular drawbead
1 0.1956 0.3332 0.3395 2 0.2081 0.3321 0.3427 3 0.2014 0.3351 0.3445 4 0.1992 0.3464 0.3654 5 0.1971 0.3465 0.3681 6 0.1901 0.3498 0.3767 7 0.1910 0.3511 0.3675 8 0.1895 0.3509 0.3663 9 0.2101 0.3563 0.3437 10 0.2574 0.3436 0.3269 11 0.3063 0.3177 0.3005 12 0.3545 0.3601 0.3265 13 0.4013 0.3945 0.4083 14 0.4324 0.4047 0.4072 15 0.4354 0.3775 0.3476 16 0.4071 0.3010 0.2019 17 0.3452 0.2230 0.1155 18 0.2680 0.1815 0.0960 19 0.2146 0.1638 0.0800
The strain distribution patterns obtained during cup formation without the presence of drawbead shows that the strain distribution is constant over cup wall region where as in the neck region the strain value increases and near flange region it comes down. This curve pattern is true for other two
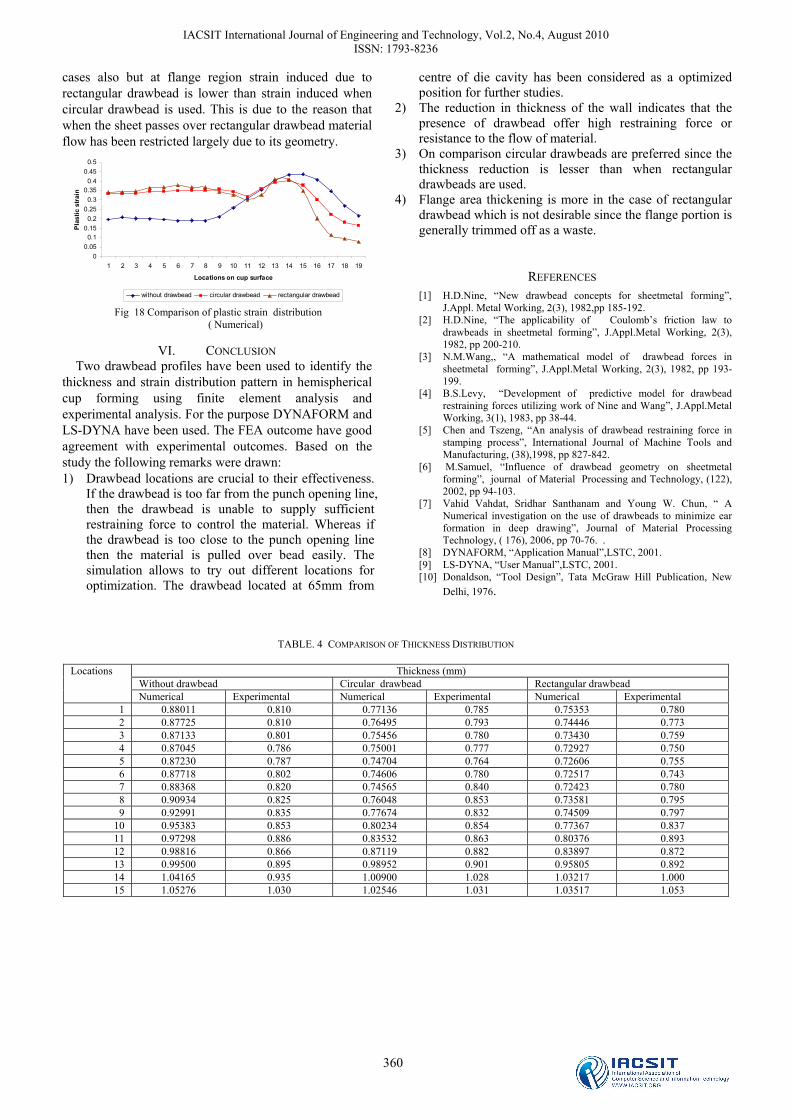
IACSIT International Journal of Engineering and Technology, Vol.2, No.4, August 2010 ISSN: 1793-8236
360
cases also but at flange region strain induced due to rectangular drawbead is lower than strain induced when circular drawbead is used. This is due to the reason that when the sheet passes over rectangular drawbead material flow has been restricted largely due to its geometry.
00.050.1
0.150.2
0.250.3
0.350.4
0.450.5
1 2 3 4 5 6 7 8 9 10 11 12 13 14 15 16 17 18 19
Locations on cup surface
Pla
stic
str
ain
without drawbead circular drawbead rectangular drawbead
Fig 18 Comparison of plastic strain distribution ( Numerical)
VI. CONCLUSION
Two drawbead profiles have been used to identify the thickness and strain distribution pattern in hemispherical cup forming using finite element analysis and experimental analysis. For the purpose DYNAFORM and LS-DYNA have been used. The FEA outcome have good agreement with experimental outcomes. Based on the study the following remarks were drawn: 1) Drawbead locations are crucial to their effectiveness.
If the drawbead is too far from the punch opening line, then the drawbead is unable to supply sufficient restraining force to control the material. Whereas if the drawbead is too close to the punch opening line then the material is pulled over bead easily. The simulation allows to try out different locations for optimization. The drawbead located at 65mm from
centre of die cavity has been considered as a optimized position for further studies.
2) The reduction in thickness of the wall indicates that the presence of drawbead offer high restraining force or resistance to the flow of material.
3) On comparison circular drawbeads are preferred since the thickness reduction is lesser than when rectangular drawbeads are used.
4) Flange area thickening is more in the case of rectangular drawbead which is not desirable since the flange portion is generally trimmed off as a waste.
REFERENCES [1] H.D.Nine, “New drawbead concepts for sheetmetal forming”,
J.Appl. Metal Working, 2(3), 1982,pp 185-192. [2] H.D.Nine, “The applicability of Coulomb’s friction law to
drawbeads in sheetmetal forming”, J.Appl.Metal Working, 2(3), 1982, pp 200-210.
[3] N.M.Wang,, “A mathematical model of drawbead forces in sheetmetal forming”, J.Appl.Metal Working, 2(3), 1982, pp 193- 199.
[4] B.S.Levy, “Development of predictive model for drawbead restraining forces utilizing work of Nine and Wang”, J.Appl.Metal Working, 3(1), 1983, pp 38-44.
[5] Chen and Tszeng, “An analysis of drawbead restraining force in stamping process”, International Journal of Machine Tools and Manufacturing, (38),1998, pp 827-842.
[6] M.Samuel, “Influence of drawbead geometry on sheetmetal forming”, journal of Material Processing and Technology, (122), 2002, pp 94-103.
[7] Vahid Vahdat, Sridhar Santhanam and Young W. Chun, “ A Numerical investigation on the use of drawbeads to minimize ear formation in deep drawing”, Journal of Material Processing Technology, ( 176), 2006, pp 70-76. .
[8] DYNAFORM, “Application Manual”,LSTC, 2001. [9] LS-DYNA, “User Manual”,LSTC, 2001. [10] Donaldson, “Tool Design”, Tata McGraw Hill Publication, New
Delhi, 1976.
TABLE. 4 COMPARISON OF THICKNESS DISTRIBUTION
Locations Thickness (mm) Without drawbead Circular drawbead Rectangular drawbead Numerical Experimental Numerical Experimental Numerical Experimental
1 0.88011 0.810 0.77136 0.785 0.75353 0.780 2 0.87725 0.810 0.76495 0.793 0.74446 0.773 3 0.87133 0.801 0.75456 0.780 0.73430 0.759 4 0.87045 0.786 0.75001 0.777 0.72927 0.750 5 0.87230 0.787 0.74704 0.764 0.72606 0.755 6 0.87718 0.802 0.74606 0.780 0.72517 0.743 7 0.88368 0.820 0.74565 0.840 0.72423 0.780 8 0.90934 0.825 0.76048 0.853 0.73581 0.795 9 0.92991 0.835 0.77674 0.832 0.74509 0.797
10 0.95383 0.853 0.80234 0.854 0.77367 0.837 11 0.97298 0.886 0.83532 0.863 0.80376 0.893 12 0.98816 0.866 0.87119 0.882 0.83897 0.872 13 0.99500 0.895 0.98952 0.901 0.95805 0.892 14 1.04165 0.935 1.00900 1.028 1.03217 1.000 15 1.05276 1.030 1.02546 1.031 1.03517 1.053