Stolen Legacy: Greek Philosophy is Stolen Egyptian Philosophy

Vehicle Tracking Report
As of February 2015

Information Support Services Limited (CarSearch) Page 2
TABLE OF CONTENTS
Pg 3 Executive Summary
Pg 4 ISSL Recovery Summary 2001 to February 2015 (Total life of ISSL)
Pg 5 Recovery Summary as at February 2015
Pg 6 Comparison of areas where vehicles were stolen and recovered as at February 2015
Pg 9 Areas where vehicles were stolen in February 2015
Pg 9 Areas where vehicles were stolen in 2015
Pg 10 Areas where vehicles were recovered in February 2015
Pg 10 Areas where vehicles were recovered in 2015
Pg 11 Comparison of areas where vehicles were stolen in February 2015 and 2014
Pg 11 Comparison of areas where vehicles were recovered in February 2015 and 2014
Pg 12 Vehicles Stolen Based on Manufacturer as at February 2015
Pg 13 Comparison of vehicles stolen based on manufacturer and year
Pg 14 Recovery summary based on manufacturer February 2015 and 2014
Pg 15 Comparison of methods used to steal vehicles as at February 2015
Pg 16 Comparison of methods used to steal vehicles as at February 2015
Pg 17 Theft type recovery summary as at February 2015
Pg 18 Recovery efficiency table as at February 2015
Information Support Services Limited (CarSearch) Page 3
EXECUTIVE SUMMARY
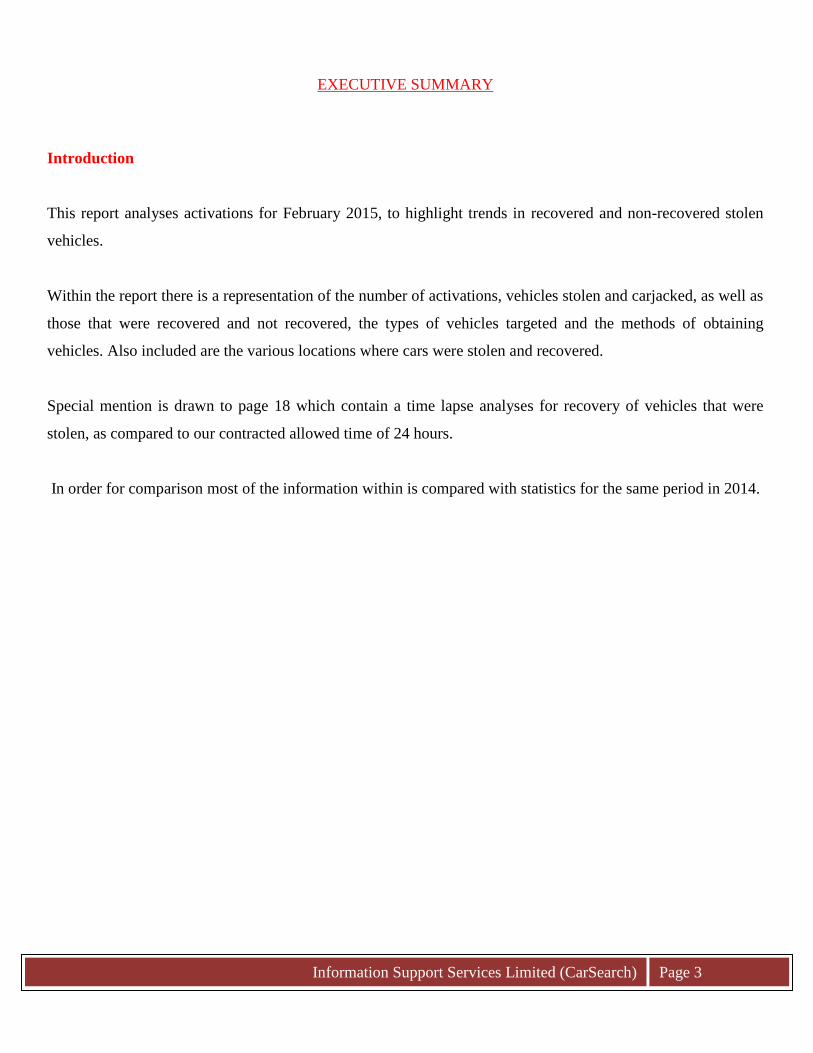
Introduction
This report analyses activations for February 2015, to highlight trends in recovered and non-recovered stolen
vehicles.
Within the report there is a representation of the number of activations, vehicles stolen and carjacked, as well as
those that were recovered and not recovered, the types of vehicles targeted and the methods of obtaining
vehicles. Also included are the various locations where cars were stolen and recovered.
Special mention is drawn to page 18 which contain a time lapse analyses for recovery of vehicles that were
stolen, as compared to our contracted allowed time of 24 hours.
In order for comparison most of the information within is compared with statistics for the same period in 2014.

Information Support Services Limited (CarSearch) Page 4
ISSL Recovery Summary 2001 – February 2015
Operations in September of 2001.
Sept-Dec 01
20 02
20 03
20 04
20 05
20 06
20 07
20 08
20 09
20 10
2011
20 12
20 13
2014
Feb-15 Total
Total
Recovered 34 67 84 73 80 59 98 89 85 72 58 54 50 6 5 946
Total
Outstanding 3 20 11 10 7 8 11 5 12 8 0 4 7 1 1 109
Total Reported 37 87 95 83 87 67 109 94 97 80 58 58 57 7 6 1055
% Recovered 92% 77% 88%
88% 92% 88%
90% 95% 88% 90% 100%
93% 88% 86%
83% 90%
% Outstanding 8% 23% 12%
12% 8% 12%
10% 5% 12% 10% 0% 7% 12% 14%
17% 10%
Note: ISSL started operations in February of 2001. (Year 2001 represents a four month period)
0
10
20
30
40
50
60
70
80
90
100
Sept-Dec01
2002 2003 2004 2005 2006 2007 2008 2009 2010 2011 2012 2013 2014 Feb-15
34
67
84
73
80
59
98
89 85
72
58 54
50
38
5 3
20
11 10 7 8
11
5
12 8
0 4
7
2 1
90% Recovered
Total Recovered Total Outstanding

Information Support Services Limited (CarSearch) Page 5
Recovery Summary 2015
Jan Feb Mar Apr May Jun Jul Aug Sep Oct Nov Dec Total
Total
Recovered 3 2 5 Total
Outstanding 1 0 1
Total Reported 4 2 6
% Recovered 75% 100% 83%
% Outstanding 25% 0% 17%
3
2
0 0 0 0 0 0 0 0 0 0
1
0 0 0 0 0 0 0 0 0 0 0 0
0.5
1
1.5
2
2.5
3
3.5
Jan Feb Mar Apr May Jun Jul Aug Sep Oct Nov Dec
83% Recovered
Total Recovered Total Outstanding

Information Support Services Limited (CarSearch) Page 6
Comparison of Areas where Vehicles were Stolen and Recovered 2015
EAST WEST CORRIDOR-2015
STOLEN AREAS # % RECOVERED AREAS # %
ARANGUEZ 1 100%
ARANGUEZ 0 0%
ARIMA 0 0%
ARIMA 0 0%
AROUCA 0 0%
AROUCA 0 0%
BARATARIA 0 0%
BARATARIA 0 0%
BALANDRA 0 0%
BALANDRA 0 0%
BLANCHISSEUSE 0 0%
BLANCHISSEUSE 0 0%
CHAMP FLEURS 0 0%
CHAMP FLEURS 0 0%
CUREPE 0 0%
CUREPE 0 0%
CUMUTO 0 0%
CUMUTO 0 0%
D' ABADIE 0 0%
D' ABADIE 0 0%
EL DORADO 0 0%
EL DORADO 0 0%
EL SOCORRO 0 0%
EL SOCORRO 0 0%
KELLY VILLAGE 0 0%
KELLY VILLAGE 0 0%
LAS LOMAS#1 0 0%
LAS LOMAS#1 0 0%
LAS LOMAS#2 0 0%
LAS LOMAS#2 0 0%
MOUNT HOPE 0 0%
MOUNT HOPE 0 0%
PETIT BOURG 0 0%
PETIT BOURG 0 0%
POINT CUMANA 0 0%
POINT CUMANA 0 0%
PIARCO 0 0%
PIARCO 0 0%
SANGRE GRANDE 0 0%
SANGRE GRANDE 1 50%
SANTA CRUZ 0 0%
SANTA CRUZ 0 0%
SAN JUAN 0 0%
SAN JUAN 1 50%
ST. AUGUSTINE 0 0%
ST. AUGUSTINE 0 0%
ST HELENA 0 0%
ST HELENA 0 0%
ST. JOSEPH 0 0%
ST. JOSEPH 0 0%
TACARIGUA 0 0%
TACARIGUA 0 0%
TRINCITY 0 0%
TRINCITY 0 0%
TUNAPUNA 0 0%
TUNAPUNA 0 0%
VALENCIA 0 0%
VALENCIA 0 0%
VALSAYN 0 0%
VALSAYN 0 0%
TOCO 0 0%
TOCO 0 0%
TOTAL FOR AREA 1 16.7%
TOTAL FOR AREA 2 50.0%

Information Support Services Limited (CarSearch) Page 7
PORT OF SPAIN & ENVIRON-2015
STOLEN AREAS # % RECOVERED AREAS # %
BELMONT 0 0%
BELMONT 0 0%
LAVENTILLE 0 0%
LAVENTILLE 0 0%
MARAVAL 0 0%
MARAVAL 0 0%
MORVANT 0 0%
MORVANT 0 0%
PETITE VALLEY 0 0%
PETITE VALLEY 0 0%
PORT OF SPAIN 0 0%
PORT OF SPAIN 0 0%
ST.CLAIR 0 0%
ST.CLAIR 0 0%
ST.JAMES 1 100%
ST.JAMES 1 100%
TOTAL FOR AREA 1 16.7%
TOTAL FOR AREA 1 25.0%
CENTRAL & ENVIRON-2015
STOLEN AREAS # % RECOVERED AREAS # %
CALIFORNIA 0 0%
CALIFORNIA 0 0%
CARAPICHAIMA 0 0%
CARAPICHAIMA 0 0%
CARONI 0 0%
CARONI 0 0%
CHAGUANAS 0 0%
CHAGUANAS 0 0%
CHASE VILLAGE 0 0%
CHASE VILLAGE 0 0%
CHARLIEVILLE 0 0%
CHARLIEVILLE 0 0%
COUVA 0 0%
COUVA 0 0%
CUNUPIA 0 0%
CUNUPIA 0 0%
FREEPORT 0 0%
FREEPORT 0 0%
FYZABAD 0 0%
FYZABAD 0 0%
LONGDENVILLE 0 0%
LONGDENVILLE 0 0%
WARRENVILLE 0 0%
WARRENVILLE 0 0%
LAS LOMAS#3 0 0%
LAS LOMAS#3 0 0%
TOTAL FOR AREA 0 0%
TOTAL FOR AREA 0 0%
WEST & ENVIRON-2015
STOLEN AREAS # % RECOVERED AREAS # %
CASCADE 0 0% CASCADE 0 0%
CARENAGE 1 100% CARENAGE 0 0%
CHAGUARAMAS 0 0% CHAGUARAMAS 0 0%
COCORITE 0 0% COCORITE 0 0%
DIEGO MARTIN 0 0% DIEGO MARTIN 0 0%
GLENCO 0 0% GLENCO 0 0%
WOODBROOK 0 0% WOODBROOK 0 0%
POWDER MAGAZINE 0 0% POWDER MAGAZINE 0 0%
TOTAL FOR AREA 1 25.0% TOTAL FOR AREA 0 0%

Information Support Services Limited (CarSearch) Page 8
SAN FERNANDO & ENVIRON-2015
STOLEN AREAS # % RECOVERED AREAS # %
BARRACKPORE 0 0%
BARRACKPORE 0 0%
COCOYEA 0 0%
COCOYEA 0 0%
GASPARILLO 0 0%
GASPARILLO 0 0%
LA ROMAIN 0 0%
LA ROMAIN 0 0%
MARABELLA 0 0%
MARABELLA 0 0%
MON REPOS 0 0%
MON REPOS 0 0%
MORUGA 0 0%
MORUGA 0 0%
NEW GRANT 0 0%
NEW GRANT 0 0%
OROPOUCHE 0 0%
OROPOUCHE 0 0%
PENAL 0 0%
PENAL 0 0%
POINT FORTIN 1 33%
POINT FORTIN 0 0%
PRINCES TOWN 1 33%
PRINCES TOWN 1 100%
SAN FERNANDO 0 0%
SAN FERNANDO 0 0%
SIPARIA 1 33%
SIPARIA 0 0%
POINT LISAS 0 0%
POINT LISAS 0 0%
ST.MADELINE 0 0%
ST.MADELINE 0 0%
TAMANA 0 0%
TAMANA 0 0%
LOS IROS 0 0%
LOS IROS 0 0%
TOTAL FOR AREA 3 50.0%
TOTAL FOR AREA 1 25.0%
Percentages in the “Total for Area” row represent the percentages of total amount stolen/ recovered for the year.
Information Support Services Limited (CarSearch) Page 9
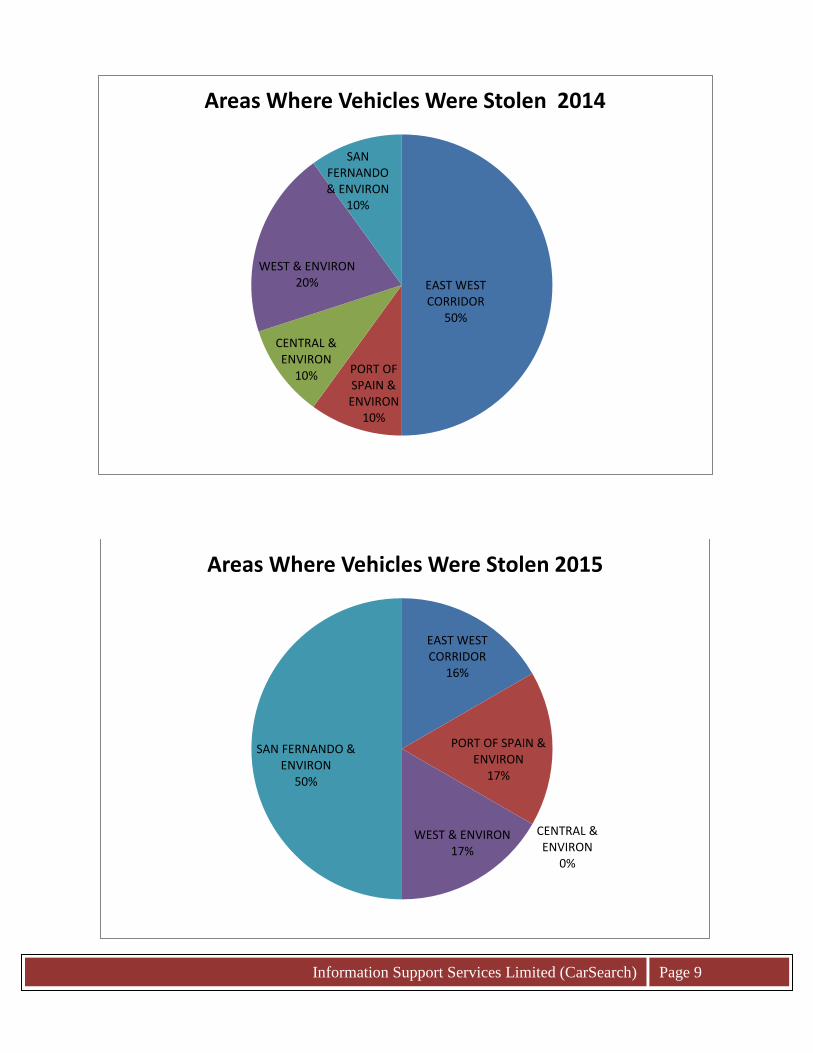
EAST WEST CORRIDOR
50%
PORT OF SPAIN & ENVIRON
10%
CENTRAL & ENVIRON
10%
WEST & ENVIRON 20%
SAN FERNANDO & ENVIRON
10%
Areas Where Vehicles Were Stolen 2014
EAST WEST CORRIDOR
16%
PORT OF SPAIN & ENVIRON
17%
CENTRAL & ENVIRON
0%
WEST & ENVIRON 17%
SAN FERNANDO & ENVIRON
50%
Areas Where Vehicles Were Stolen 2015
Information Support Services Limited (CarSearch) Page 10
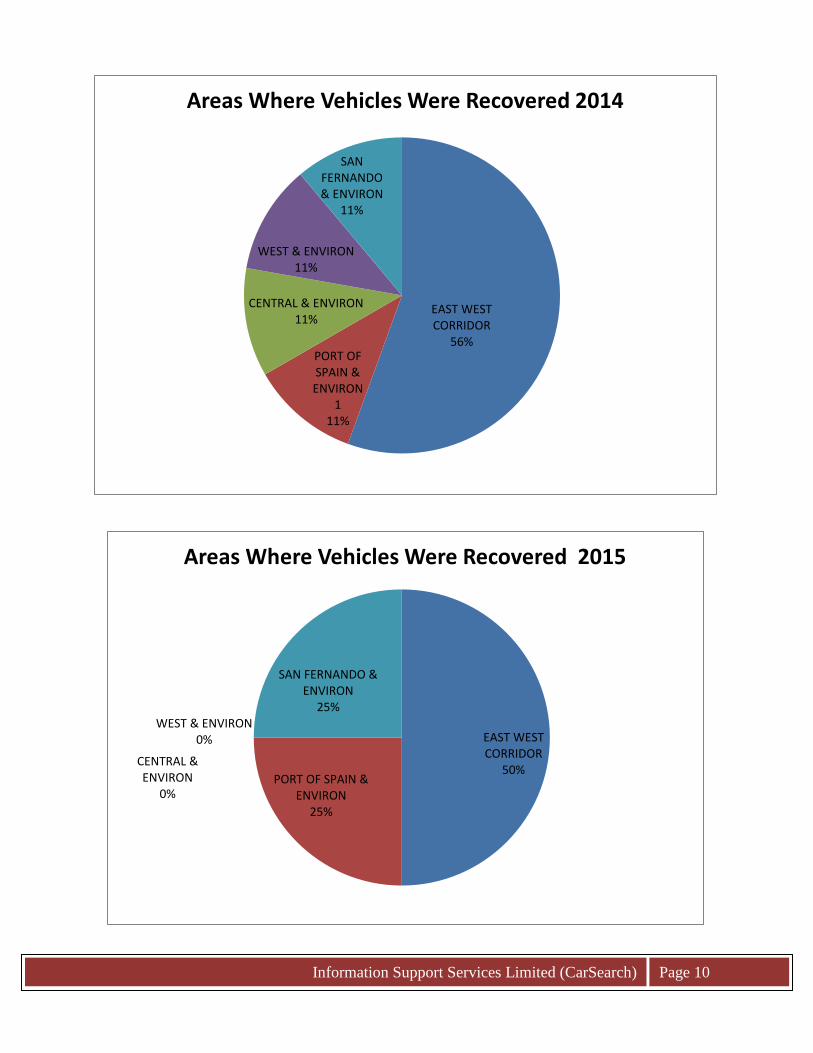
EAST WEST CORRIDOR
56% PORT OF SPAIN & ENVIRON
1 11%
CENTRAL & ENVIRON 11%
WEST & ENVIRON 11%
SAN FERNANDO & ENVIRON
11%
Areas Where Vehicles Were Recovered 2014
EAST WEST CORRIDOR
50% PORT OF SPAIN &
ENVIRON 25%
CENTRAL & ENVIRON
0%
WEST & ENVIRON 0%
SAN FERNANDO & ENVIRON
25%
Areas Where Vehicles Were Recovered 2015

Information Support Services Limited (CarSearch) Page 11
5
1 1
2
1
0
1 1
0
1
3
0 0
1
2
3
4
5
6
EAST WESTCORRIDOR
PORT OF SPAIN &ENVIRON
CENTRAL &ENVIRON
WEST &ENVIRON
SAN FERNANDO& ENVIRON
UNKNOWN
Comparison Of Stolen Vehicles Between 15 & 14
2014 2015
Information Support Services Limited (CarSearch) Page 12
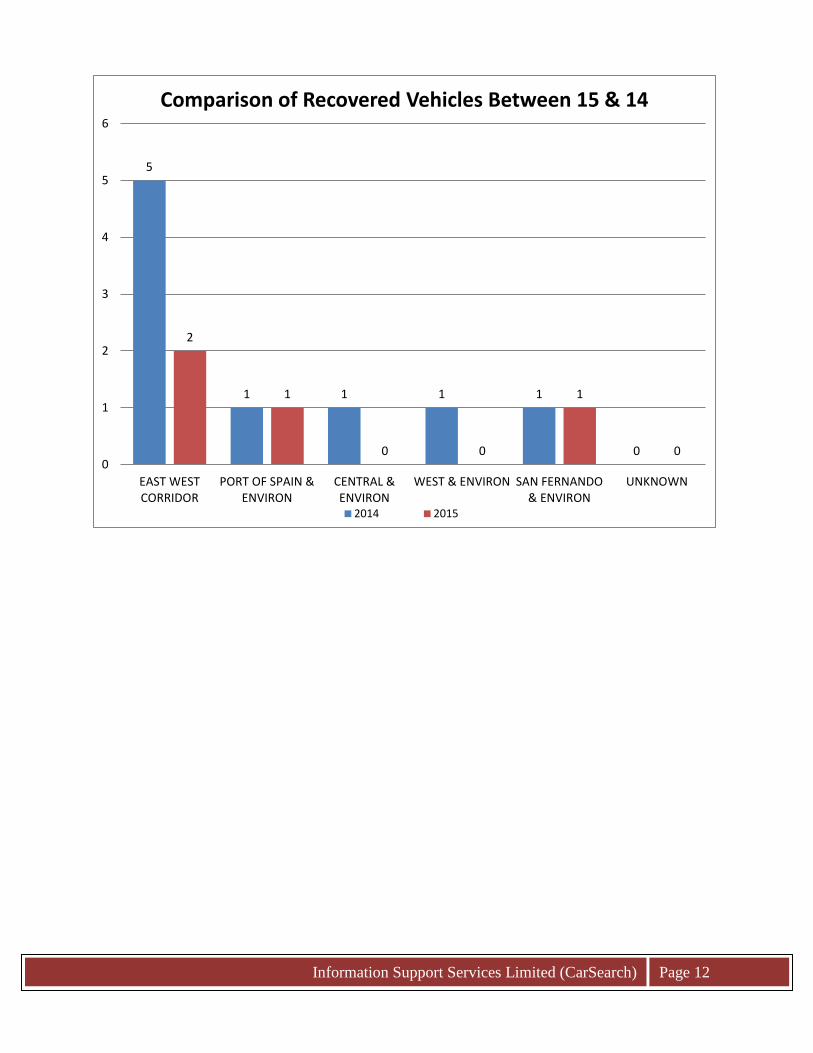
5
1 1 1 1
0
2
1
0 0
1
0 0
1
2
3
4
5
6
EAST WESTCORRIDOR
PORT OF SPAIN &ENVIRON
CENTRAL &ENVIRON
WEST & ENVIRON SAN FERNANDO& ENVIRON
UNKNOWN
Comparison of Recovered Vehicles Between 15 & 14
2014 2015

Information Support Services Limited (CarSearch) Page 13
HYUNDAI AUDI MAZDA MITSUBISHI TOYOTA NISSAN SUBARU SUZUKI TOTAL
Total
Reported 0 0 0 1 0 4 0 0 5 Total
Recovered 0 0 0 0 0 1 0 0 1 Total
Outstanding 0 0 0 1 0 5 0 0 6
% Recovered 0% 0% 0% 100% 0% 80% 0% 0% 83% %
Outstanding 0% 0% 0% 0% 0% 20% 0% 0% 17%
MITSUBISHI 20%
NISSAN 80%
Vehicles Stolen Based on Manufacturer 2015

Information Support Services Limited (CarSearch) Page 14
0 0 0 0
2
1
0
7
0 0 0 0 0
1
0
5
0
1
2
3
4
5
6
7
8
FORD HYUNDAI HONDA AUDI MAZDA MITSUBISHI TOYOTA NISSAN
Comparison Of Vehicles Stolen by Manufacturer and Year
2014 2015

Information Support Services Limited (CarSearch) Page 15
Since 2006, Nissan has been the number one type of stolen vehicle by manufacturer.
This trend continued in 2015.
0 0 0 0
2
1
0
6
0 0 0 0 0 0 0
1
0
1
2
3
4
5
6
7
FORD HYUNDAI HONDA AUDI MAZDA MITSUBISHI TOYOTA NISSAN
Recovery Summary Based On Manufacturer 2014
Total Recovered Total Outstanding
0 0 0 0 0
1
0
4
0 0 0 0 0 0 0 0 0
1
0 0 0
0.5
1
1.5
2
2.5
3
3.5
4
4.5
FORD HONDA MAZDA TOYOTA SUBARU
Recovery Summary Based On Manufacturer 2015
Total Recovered Total Outstanding

Information Support Services Limited (CarSearch) Page 16
Reported Self-
Activated Carjacked Kidnapped Other Total
Total Recovered 5 0 0 0 0 5
Total Outstanding 1 0 0 0 0 1
Total Reported 6 0 0 0 0 6
% Recovered 83% 0 #DIV/0! 0 0 83%
% Outstanding 17% 0 #DIV/0! 0 0 17%
Report 100%
Comparison of Methods used to steal Vehicles 2015

Information Support Services Limited (CarSearch) Page 17
Reported: This refers to a situation where a customer discovers their vehicle missing. Both in 2010 and in 2011
most cars were stolen in the absence of the driver.
6
1
2
0
1
6
0 0 0 0 0
1
2
3
4
5
6
7
Report Self Activated CarJack Kidnap Other
Comparison of Methods used to Steal Vehicles 15-14
2014 2015

Information Support Services Limited (CarSearch) Page 18
Regardless of the method used to steal vehicles CarSearch maintains its effectiveness.
5
0 0 0 0
1
0 0 0 0 0
1
2
3
4
5
6
Report Self Activated CarJack Kidnap Other
Theft Type Recovery Summary 2015
Total Recovered

Information Support Services Limited (CarSearch) Page 19
Our contract allows 24hrs to recover an M/V on average we use 20% of that time.
The Following is a list all recovered M/V’s and the time used to recover them.
RECOVERY EFFICIENCY TABLE FOR 2015
No.
Activation
# Date/Time Reported Date/Time Recovered
Lapse Time
(hrs/mins)
% Time Efficiency
in relation to 24hrs
period
1 203941 08/01/2015 04:00:00 AM 08/01/2015 05:23:00 AM 1:23 5.8%
2 205877 28/01/2015 03:00:00 PM 28/01/2015 05:12:00 PM 2:12 9.2%
3 205954 29/01/2015 07:08:00 PM 29/01/2015 08:14:00 PM 1:06 4.6%
4 206618 06/02/2015 09:45:00 PM 06/02/2015 10:54:00 PM 1:09 4.8%
5 207357 17/02/2015 11:30:00 PM 17/02/2015 12:10:00 AM 0:40 2.8%
Total Time
Lapse (hrs) Total Time (hrs)
No of Recovered
Activation % Total Time Used
6:30 120 5 5.0%
RECOVERY EFFICIENCY TABLE FOR 2014
No.
Activation
# Date/Time Reported Date/Time Recovered
Lapse Time
(hrs/mins)
% Time Efficiency
in relation to 24hrs
period
1 204210 12/01/2015 10:20:00 AM N/A 24 100%
There has been one vehicle not recovered in 2015.
In this case the vehicle which is equipped with our R-Only was missing for approximately three day before our
control center was informed. Thus the time-lapse could have allowed the vehicle to be dismantled before
activation.
Total Time
Lapse
(hrs) Total Time (hrs) Total No. of Activations
% Total
Time Used
30:30 144 6 20.0%