Isotopic composition of precipitation at the station ...
14
GEOLOGIJA 58/2, 233-246, Ljubljana 2015 http://dx.doi.org/10.5474/geologija.2015.019 Isotopic composition of precipitation at the station Portorož, Slovenia – period 2007–2010 Izotopska sestava padavin na postaji Portorož, Slovenija – obdobje 2007–2010 Polona VREČA 1 , Ines KRAJCAR BRONIĆ 2 & Albrecht LEIS 3 1 Department of Environmental Sciences, Jožef Stefan Institute, Jamova 39, SI–1000 Ljubljana, Slovenia 2 Ruđer Bošković Institute, Bijenička 54, 10000 Zagreb, Croatia 3 Institute of Water Resources Management, JOANNEUM RESEARCH, Elisabethstrasse 16/II, 8010 Graz, Austria Prejeto / Received 17. 11. 2015; Sprejeto / Accepted 7. 12. 2015; Objavljeno na spletu / Published online 30. 12. 2015 Key words: precipitation, isotopes, oxygen, hydrogen, tritium, Portorož, Slovenia Ključne besede: padavine, izotopi, kisik, vodik, tricij, Portorož, Slovenija Abstract The stable isotopic composition of oxygen and hydrogen (δ 18 O and δ 2 H) and the tritium activity (A) were monitored in precipitation at synoptic station Portorož (Slovenia) during the period 2007–2010. Monthly and yearly isotope variations are discussed and compared with those observed over the period 2001–2006 and with the basic meteorological parameters. The mean values for δ 18 O and δ 2 H, weighted by precipitation, are –6.28 ‰ and –41.6 ‰, and these values are 0.35 ‰ and 1.6 ‰ higher but not significantly different than for the period 2001–2006. The reduced major axis (RMA) local meteoric water line (LMWL RMA ) for the period 2007–2010 is δ 2 H = (8.14 ± 0.25)×δ 18 O + (8.28 ± 1.64), while the precipitation weighted least square regression (PWLSR) results in LMWL PWLSR δ 2 H = (7.87 ± 0.28)×δ 18 O + (7.97 ± 1.87). The deuterium excess (δ) weighted mean value is 8.6 ‰ and is 1.2 ‰ lower than in 2001–2006, while the temperature coefficient of δ 18 O is 0.21 ‰/°C and is for 0.02 ‰/°C higher than for the previous period. The mean Mediterranean precipitation index (MI) for the period 2007–2010 is 2.3. Lower values of MI and deuterium excess than in the preceding period indicate stronger continental climatic character during observation period, however the differences are not statistically significant. The weighted mean tritium activity is 6.4 TU, which is 0.5 TU lower but not significantly different than in 2001–2006. Izvleček V prispevku obravnavamo izotopsko sestavo kisika in vodika (δ 18 O in δ 2 H) ter aktivnosti tricija (A) v mesečnih vzorcih padavin, ki smo jo spremljali na sinoptični postaji Portorož (Slovenija) v obdobju 2007–2010. Analizirali smo mesečne in letne spremembe izotopske sestave padavin in jih primerjali z nizom podatkov za obdobje 2001– 2006 ter z osnovnimi meteorološkimi parametri. Srednje tehtane vrednosti δ 18 O in δ 2 H določene ob upoštevanju izmerjene količine padavin znašajo –6,28 ‰ in –41,6 ‰ in so za 0,35 ‰ oziroma 1,6 ‰ višje kot v obdobju 2001–2006, vendar so razlike statistično neznačilne. Lokalno padavinsko premico (LMWL RMA ) za obdobje 2007–2010 zapišemo kot δ 2 H = (8,14 ± 0,25)×δ 18 O + (8,28 ± 1,64), ob upoštevanju količine padavin pa kot LMWL PWLSR δ 2 H = (7,87 ± 0,28)×δ 18 O + (7,97 ± 1,87). Srednja tehtana vrednost devterijevega presežka (δ) znaša 8,6 ‰ in je za 1,2 ‰ nižja kot v obdobju 2001–2006, medtem ko je temperaturni koeficient za δ 18 O za 0,02 ‰/°C višji kot v primerjalnem obdobju in znaša 0,21 ‰/°C. Srednja vrednost indeksa mediteranskosti padavin (MI) znaša 2,3. Nižje vrednosti MI in devterijevega presežka nakazujejo v opazovanem obdobju bolj kontinentalni značaj podnebja, vendar so razlike statistično neznačilne. Srednja tehtana vrednost tricijeve aktivnosti znaša 6,4 TU in je za 0,5 TU nižja kot v obdobju 2001–2006, a je tudi ta razlika statistično neznačilna. Introduction Since initiation of the Global Network of Isotopes in Precipitation (GNIP) by the International Atomic Energy Agency (IAEA) and the World Meteorological Organisation (WMO) in 1958 the importance and need of a systematic collection of data on the isotopic composition, i.e. stable isotopes of oxygen (expressed as δ 18 O) and hydrogen (expressed as δ 2 H) and radioactive hydrogen isotope (tritium, 3 H), of precipitation across the globe to determine temporal and spatial variations in isotope ratios in precipitation, is steadily increasing. Initially GNIP was focused on monitoring atmospheric thermonuclear test fallout through levels of radioactive tritium and, after 1970, became an important observation network of stable oxygen and hydrogen isotope © Author(s) 2015. CC Atribution 4.0 License
Transcript of Isotopic composition of precipitation at the station ...

GEOLOGIJA 58/2, 233-246, Ljubljana 2015
http://dx.doi.org/10.5474/geologija.2015.019
Isotopic composition of precipitation at the station Portorož, Slovenia – period 2007–2010
Izotopska sestava padavin na postaji Portorož, Slovenija – obdobje 2007–2010
Polona VREČA1, Ines KRAJCAR BRONIĆ2 & Albrecht LEIS3
1Department of Environmental Sciences, Jožef Stefan Institute, Jamova 39, SI–1000 Ljubljana, Slovenia2Ruđer Bošković Institute, Bijenička 54, 10000 Zagreb, Croatia
3Institute of Water Resources Management, JOANNEUM RESEARCH, Elisabethstrasse 16/II, 8010 Graz, Austria
Prejeto / Received 17. 11. 2015; Sprejeto / Accepted 7. 12. 2015; Objavljeno na spletu / Published online 30. 12. 2015
Key words: precipitation, isotopes, oxygen, hydrogen, tritium, Portorož, SloveniaKljučne besede: padavine, izotopi, kisik, vodik, tricij, Portorož, Slovenija
Abstract
The stable isotopic composition of oxygen and hydrogen (δ18O and δ2H) and the tritium activity (A) were monitored in precipitation at synoptic station Portorož (Slovenia) during the period 2007–2010. Monthly and yearly isotope variations are discussed and compared with those observed over the period 2001–2006 and with the basic meteorological parameters. The mean values for δ18O and δ2H, weighted by precipitation, are –6.28 ‰ and –41.6 ‰, and these values are 0.35 ‰ and 1.6 ‰ higher but not significantly different than for the period 2001–2006. The reduced major axis (RMA) local meteoric water line (LMWLRMA) for the period 2007–2010 is δ2H = (8.14 ± 0.25)×δ18O + (8.28 ± 1.64), while the precipitation weighted least square regression (PWLSR) results in LMWLPWLSR δ2H = (7.87 ± 0.28)×δ18O + (7.97 ± 1.87). The deuterium excess (δ) weighted mean value is 8.6 ‰ and is 1.2 ‰ lower than in 2001–2006, while the temperature coefficient of δ18O is 0.21 ‰/°C and is for 0.02 ‰/°C higher than for the previous period. The mean Mediterranean precipitation index (MI) for the period 2007–2010 is 2.3. Lower values of MI and deuterium excess than in the preceding period indicate stronger continental climatic character during observation period, however the differences are not statistically significant. The weighted mean tritium activity is 6.4 TU, which is 0.5 TU lower but not significantly different than in 2001–2006.
Izvleček
V prispevku obravnavamo izotopsko sestavo kisika in vodika (δ18O in δ2H) ter aktivnosti tricija (A) v mesečnih vzorcih padavin, ki smo jo spremljali na sinoptični postaji Portorož (Slovenija) v obdobju 2007–2010. Analizirali smo mesečne in letne spremembe izotopske sestave padavin in jih primerjali z nizom podatkov za obdobje 2001–2006 ter z osnovnimi meteorološkimi parametri. Srednje tehtane vrednosti δ18O in δ2H določene ob upoštevanju izmerjene količine padavin znašajo –6,28 ‰ in –41,6 ‰ in so za 0,35 ‰ oziroma 1,6 ‰ višje kot v obdobju 2001–2006, vendar so razlike statistično neznačilne. Lokalno padavinsko premico (LMWLRMA) za obdobje 2007–2010 zapišemo kot δ2H = (8,14 ± 0,25)×δ18O + (8,28 ± 1,64), ob upoštevanju količine padavin pa kot LMWLPWLSR δ2H = (7,87 ± 0,28)×δ18O + (7,97 ± 1,87). Srednja tehtana vrednost devterijevega presežka (δ) znaša 8,6 ‰ in je za 1,2 ‰ nižja kot v obdobju 2001–2006, medtem ko je temperaturni koeficient za δ18O za 0,02 ‰/°C višji kot v primerjalnem obdobju in znaša 0,21 ‰/°C. Srednja vrednost indeksa mediteranskosti padavin (MI) znaša 2,3. Nižje vrednosti MI in devterijevega presežka nakazujejo v opazovanem obdobju bolj kontinentalni značaj podnebja, vendar so razlike statistično neznačilne. Srednja tehtana vrednost tricijeve aktivnosti znaša 6,4 TU in je za 0,5 TU nižja kot v obdobju 2001–2006, a je tudi ta razlika statistično neznačilna.
Introduction
Since initiation of the Global Network of Isotopes in Precipitation (GNIP) by the International Atomic Energy Agency (IAEA) and the World Meteorological Organisation (WMO) in 1958 the importance and need of a systematic collection of data on the isotopic composition, i.e. stable isotopes of oxygen (expressed as δ18O)
and hydrogen (expressed as δ2H) and radioactive hydrogen isotope (tritium, 3H), of precipitation across the globe to determine temporal and spatial variations in isotope ratios in precipitation, is steadily increasing. Initially GNIP was focused on monitoring atmospheric thermonuclear test fallout through levels of radioactive tritium and, after 1970, became an important observation network of stable oxygen and hydrogen isotope
© Author(s) 2015. CC Atribution 4.0 License

234 Polona VREČA, Ines KRAJCAR BRONIĆ & Albrecht LEIS
composition data for hydrologic investigations of water resources (Internet 1). The past decade has experienced increasing demand for accurate spatial and temporal predictions of point, regional, and continental-scale δ18O and δ2H values in precipitation, especially for some regions where little or no GNIP data existed (Terzer et al., 2013). The main reason for steadily increasing application of water isotopes remains their importance in hydrologic and hydrogeologic investigations of water resources, in verification and improvement of atmospheric circulation models and in investigation of regional, global and temporal climates. In addition, it was revealed that the δ18O and δ2H values of some plant, animal, and human tissues closely mirrored isotopic patterns of precipitation (Hobson & Wassenaar, 1997; Bowen et al., 2005) and therefore use of stable water isotopes expanded also in ecological, wildlife, food source traceability, and forensic sciences (Terzer et al., 2013).
The only radioactive constituent of water molecule is tritium, 3H, with the half-life of 12.32 yr (Lucas and unterweger, 2000; Internet 2). It is produced naturally in the upper atmosphere by reaction of cosmic-rays neutron with atmospheric nitrogen (Internet 2). The tritium with atmospheric oxygen subsequently forms tritiated water (1H3HO) molecule that in turn reaches the Earth’s surface through precipitation. However, most of the tritium present in the atmosphere and hydrosphere is of anthropogenic origin, i.e., tritium was released in atmospheric thermonuclear tests during 1960’s, reaching in 1963 several orders of magnitudes higher tritium activity concentration in the atmosphere than the natural levels. After the test ban treaty in 1963, atmospheric tritium activity has been decreasing almost exponentially in the following decades, while during last 10–15 years the mean tritium activity has not been significantly changed (Krajcar BronIć et al., 2006; Vreča et al., 2014; Internet 2). Nowadays, tritium has reached in precipitation levels similar to those occurring before the thermonuclear tests, about 5 TU in central Europe (Internet 2). These low and constant concentrations limit the use of tritium in hydrogeological studies. However, tritium can be used to investigate atmospheric vapour migration under different meteorological conditions, especially if the sources of water vapour differ (KIgoshI & Yoneda, 1970; unnIKrIshnan warIer et al., 2013). Due to the water vapour exchange between the atmosphere and the sea (ocean) surface, coastal and oceanic stations show considerably lower tritium activity than the continental stations because the moisture evaporating from the sea/ocean is low in tritium content (ehhalt, 1971; Vreča et al., 2006). With the more-or-less natural tritium levels in modern precipitation, the technogenic emissions of tritium (from nuclear facilities, or from manufacturing or disposal of luminous consumer products, planned fusion demo facilities) are becoming more and more visible (hebert, 1990; rozansKI et al., 1991;
MatsuMoto et al., 2013), and the knowledge of natural tritium distribution remains important from the environmental pollution point of view (thoMpson et al., 2015; ueda et al., 2015).
Regular monitoring of the oxygen and hydrogen isotopic composition of precipitation in the coastal area of SW Slovenia is important not only for studying the isotopic patterns of local meteorological conditions, but also for improvement of the knowledge of the isotopic input signal needed for hydrogeological studies of the large karstic springs used for water supply in the area (Vreča et al., 2007) and other applications. Therefore, monitoring of the isotopic composition of precipitation in Portorož (SW Slovenia) has been performed by the Jožef Stefan Institute (JSI) since 2000 (Vreča et al., 2005, 2006, 2007, 2011). To begin with, monitoring was performed in cooperation with the Slovenian Environment Agency (ARSO), the Ruđer Bošković Institute (RBI; Zagreb, Croatia) and the IAEA (Vreča et al. 2005, 2006). Since 2004 the JSI has also cooperated with Joanneum Research (JR; Graz, Austria). Details on the isotope monitoring until 2006, together with data evaluation, have been reported in Vreča et al. (2005, 2006, 2007, 2011). The isotope data obtained until 2006 for Portorož (Vreča et al., 2005, 2006, 2007, 2011) are also available in the GNIP database. The data were used in different hydrogeochemical investigations of aquifers in Slovenia (brenčIč, 2009; Mezga, 2014; Mezga et al., 2014; VerboVšeK & Kanduč, 2015), Croatia (MandIć et al., 2008) and in Italy (cucchI et al., 2008), as well as in investigations of precipitation (lIotta et al., 2008; VodIla et al., 2011; MIchelInI, 2013; Vreča et al., 2014; BrenčIč et al., 2015, KoVačIč, 2015), moisture recycling in Alpine regions (FroehlIch et al., 2008) and identification and characterisation of nitrate pollution sources in Marano lagoon in Italy (Saccon et al., 2013).
The main purpose of this paper is to present new results concerning the isotopic composition of precipitation at Portorož for the period 2007–2010 and to compare them with those for the period 2001–2006 (Vreča et al., 2011).
Materials and methods
Sampling
Monthly composite precipitation has been sampled since October 2000 at the synoptic meteorological station Portorož (45°28’N, 13°37’E; 2 m a.s.l.) which is located at the airport and is part of the Slovene national meteorological network maintained by the ARSO (Internet 3). The station is included in the GNIP under the station name Portorož and has the GNIP code 1410500.
Water samples were collected by the staff of the meteorological station from standard precipitation gauge three times daily. After measuring the amount of precipitation the sample was poured

235Isotopic composition of precipitation at the station Portorož, Slovenia – period 2007–2010
into a 5-litre plastic bottle with a well tight cap to avoid evaporation and kept in a dark place. After bringing the samples to the laboratory the impurities (e.g. dust, particles) were removed from the sample by filtration (Whatman Grade 589, Black Ribbon) before taking aliquots for different isotope analyses. Then a 50 mL glass bottle was filled for the stable isotope analysis of oxygen and hydrogen and the rest of the water was transferred to 0.5 or 1 L high density polyethylene (HDPE) bottles for tritium analysis. During the sampling period April 2007 was very dry with only 2.2 mm precipitation which was not sufficient for isotope analysis.
Meteorological data (amount of precipitation and air temperature) are available from the ARSO (Internet 3).
Stable isotope analysis
The oxygen isotopic composition (δ18O) was measured by means of the water–CO2 equilibration technique (epsteIn & MaYeda, 1953) on a dual inlet isotope-ratio mass spectrometer Finnigan DELTAplus by means of the fully automated equilibration technique at JR until February 2007 (see also Vreča et al., 2011). Since then, a continuous flow isotope-ratio mass spectrometer IsoPrime (GV Instruments, UK) coupled to an automatic water-CO2 equilibration system MultiFlow was used at the JSI. The isotopic composition of hydrogen was determined on a continuous flow Finnigan DELTAplus XP mass spectrometer with a HEKAtech high-temperature oven, by reduction of water over hot chromium (MorrIson et al., 2001) at JR. Results are reported as δ values in per mill (‰) relative to the Vienna-SMOW standard (Coplen et al., 2002). All measurements were carried out together with laboratory standards that were calibrated periodically against international standards, as recommended by the IAEA. Measurement precision was better than ±0.1 ‰ for δ18O and ±1 ‰ for δ2H.
Tritium activity
Tritium activity (A) in monthly samples was determined at the Tritium Laboratory at the Department of Experimental Physics of the RBI. Results are expressed in Tritium Units (1 TU = 0.118 BqL-1). The gas proportional counting technique (GPC) was used until 2009; since 2010, samples have been measured by the liquid scintillation counting technique (LSC) following electrolytic enrichment (EE), while during 2008 and 2009 both GPC and LSC-EE techniques were used, depending on the available sample quantity. The limit of detection (LOD) was 2.5 TU and 0.5 TU for GPC and LSC-EE techniques, respectively (for details see barešIć et al., 2010, 2011; Krajcar bronIć et al., 2013; Vreča et al., 2014).
Tritium activity in three samples (February, March and April 2010) was determined by the
Group for radiochemistry at the Department of Environmental Sciences of the JSI following electrolytic enrichment by liquid scintillation counting (LSC-EE) on a Tri Carb 3170 TR/SL Liquid Scintillation Counter (LSC, Canberra Packard) in accordance with method accredited by Slovenian Accreditation since 2009 (accreditation certificate LP-090). The LOD was 2.9 TU.
Data reduction
The approach of data reduction described by Vreča et al. (2008, 2011, 2014) for Portorož and Ljubljana isotope records 2001–2006 and 2007–2010, was used. Basic descriptive statistics, i.e. mean, minimum and maximum values were determined and the deuterium excess (d = δ2H – 8×δ18O; dansgaard, 1964) was calculated. For the quantitative characterization of the Mediterranean character of yearly precipitation the Mediterranean precipitation index (MI) introduced by KoppanY & Unger (1992) was calculated as:
MI = (PX-XI – PV-VI)×100/Pyear (1)
where PX-XI is the sum of precipitation in October and November (in mm), PV-VI is the sum of precipitation in May and June (in mm) and Pyear is the annual precipitation (in mm).
Furthermore, mean values weighted by the amount of precipitation were calculated from all monthly data, and then summed over all collected samples, per month, over each season: winter (December, January, February), spring (March, April, May), summer (June, July, August) and autumn (September, October, November), and per year. The minimum required number of data fulfilled the requirement of eight monthly measured samples per year and more than 70 % of total precipitation amount collected per year (IAEA, 1992).
Linear correlations between δ2H and δ18O were calculated by methods usually applied in stable isotope studies – the ordinary least squares regression (OLSF) and the reduced major axis (RMA) regression (IAEA, 1992; hughes & crawFord, 2012). In addition, we applied a precipitation weighted least square regression (PWLSR) method, introduced by hughes & crawFord in 2012, which takes into account the precipitation amount in particular month. The same approach was used by Vreča et al. (2014) for the 2007–2010 isotope record at Ljubljana. The lines are defined as local meteoric water lines (LMWLOLSF, LMWLRMA and LMWLPWLSR).
Finally, oxygen-temperature correlation was calculated using air temperature data provided by ARSO from station Portorož for all monthly data and for the mean monthly data from the studied period.
236
Results and discussion
Meteorological data: Precipitation and temperature
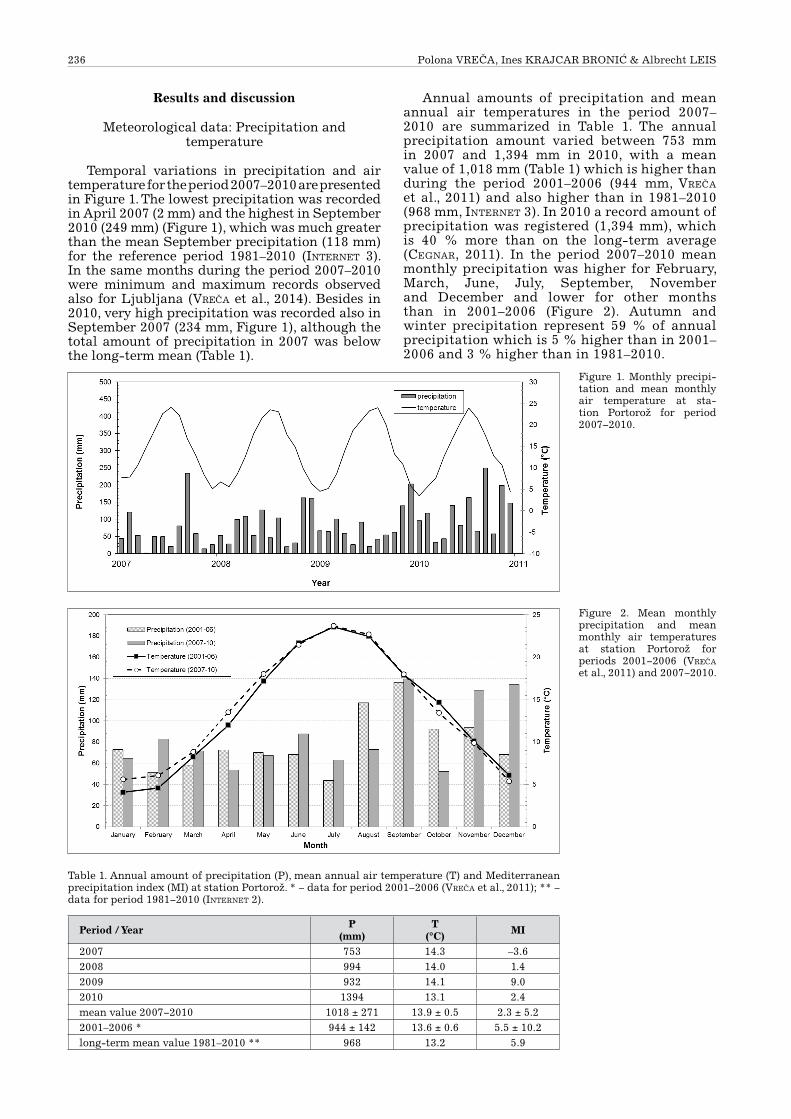
Temporal variations in precipitation and air temperature for the period 2007–2010 are presented in Figure 1. The lowest precipitation was recorded in April 2007 (2 mm) and the highest in September 2010 (249 mm) (Figure 1), which was much greater than the mean September precipitation (118 mm) for the reference period 1981–2010 (Internet 3). In the same months during the period 2007–2010 were minimum and maximum records observed also for Ljubljana (Vreča et al., 2014). Besides in 2010, very high precipitation was recorded also in September 2007 (234 mm, Figure 1), although the total amount of precipitation in 2007 was below the long-term mean (Table 1).
Annual amounts of precipitation and mean annual air temperatures in the period 2007–2010 are summarized in Table 1. The annual precipitation amount varied between 753 mm in 2007 and 1,394 mm in 2010, with a mean value of 1,018 mm (Table 1) which is higher than during the period 2001–2006 (944 mm, Vreča et al., 2011) and also higher than in 1981–2010 (968 mm, Internet 3). In 2010 a record amount of precipitation was registered (1,394 mm), which is 40 % more than on the long-term average (cegnar, 2011). In the period 2007–2010 mean monthly precipitation was higher for February, March, June, July, September, November and December and lower for other months than in 2001–2006 (Figure 2). Autumn and winter precipitation represent 59 % of annual precipitation which is 5 % higher than in 2001–2006 and 3 % higher than in 1981–2010.
Figure 1. Monthly precipi-tation and mean monthly air temperature at sta-tion Portorož for period 2007−2010.
Table 1. Annual amount of precipitation (P), mean annual air temperature (T) and Mediterranean precipitation index (MI) at station Portorož. * − data for period 2001−2006 (Vreča et al., 2011); ** − data for period 1981−2010 (Internet 2).
Period / Year P(mm)
T(°C) MI
2007 753 14.3 –3.62008 994 14.0 1.42009 932 14.1 9.02010 1394 13.1 2.4mean value 2007−2010 1018 ± 271 13.9 ± 0.5 2.3 ± 5.22001–2006 * 944 ± 142 13.6 ± 0.6 5.5 ± 10.2long-term mean value 1981–2010 ** 968 13.2 5.9
Figure 2. Mean monthly precipitation and mean monthly air temperatures at station Portorož for periods 2001−2006 (Vreča et al., 2011) and 2007−2010.
Polona VREČA, Ines KRAJCAR BRONIĆ & Albrecht LEIS

237
The variations in precipitation indicate some changes in climatic character as indicated by change of Mediterranean precipitation index (MI). The MI for the period 2007–2010 varied between –3.6 in 2007 and 9.0 in 2009, with annual mean value of 2.3 (Table 1). This value is much lower than the annual mean during the periods 2001–2006 (5.5), 1981–2010 (5.9) and 1971–2000 (6.1) and indicates at Portorož a stronger Mediterranean climate character than the continental one in the past. However, annual variations are high and therefore the differences between periods 2007–2010 and 2001–2006 are not statistically significant.
Variations of monthly air temperatures are shown in Figure 1. The lowest monthly temperature (3.5 °C) was observed in January 2010 and the highest in July 2007 (24.1 °C) (Figure 1). Similarly as observed in the period 2007–2010 in Ljubljana (Vreča et al., 2014) the warmest year in Portorož was 2007 and the coldest 2010 (Table 1). The mean air temperature for the whole period was 13.9 °C, on average 0.3 °C and 0.7 °C higher than that for 2001–2006 and 1981–2010 (Table 1). Variations of mean monthly air temperature are shown in Figure 2. Deviations up to 1.5 °C from 2001–2006 temperature record were observed in the first half of year.
Long-term mean monthly temperatures for periods 1971–2000 and 1981–2010 show winter minimum in January and summer maximum in July (Internet 3). The difference between maximum and minimum air temperature, which may be taken as a measure of the continentality of the climate (i.e. the larger the difference, the more continental the type of climate) was 18.4 °C and 18.6 °C for 1971–2000 and 1981–2010. During the 2007–2010 the maximum monthly temperature was observed
always in July while the minimum was recorded in December (2007), February (2008) or January (2009 and 2010). The difference between maximum and minimum varied from 17.9 °C to 20.4 °C, with a mean of 19.2 °C, and indicates more continental climate at Portorož in investigated period than in the preceding long-term climatological periods. Therefore, both indices of continentality, the MI that takes into account seasonal distribution of precipitation, and the range of temperatures, indicate higher continental influences on the climate in Portorož in the investigated period. These facts, together with the increase in mean annual air temperatures and general decrease in amount of precipitation may indicate modern climatic changes in the area but have to be investigated into more detail in future.
Stable isotope data (δ18O, δ2H and d)
Results of monthly isotopic composition of precipitation parameters, δ18O, δ2H and d, are summarized in Table 2. Results are reported to one decimal point for δ2H and d values and to two for δ18O.
Variations of monthly isotopic composition of precipitation (δ18O, δ2H) from 2007 to 2010 are presented in Figures 3a and 3b. The lowest δ18O value was observed in January 2010 (–12.20 ‰) and the highest in July 2008 and May 2009 (–2.60 ‰). Variations in δ2H follow those for δ18O (Figure 3a), with a minimum δ2H value of –92.7 ‰ and maximum of –7.1 ‰ observed in January 2010 and July 2008, respectively. The mean δ18O and δ2H values for the observed period are –6.08 ‰ and –41.3 ‰ (n = 47), and are more positive than values from 2001 to 2006; i.e., –6.51 ‰ and –43.1 ‰ (n = 74) (Vreča et al., 2011).
Figure 3. Monthly varia-tions a) of isotopic com-position of oxygen (δ18O), b) isotopic composition of hydrogen (δ2H), c) de-uterium excess (d) and d) tritium activity (A), in pre-cipitation at station Porto-rož, 2007−2010.
Isotopic composition of precipitation at the station Portorož, Slovenia – period 2007–2010
a)
b)

238
Monthly variations of deuterium excess (d) are presented in Figure 3c. The lowest value was obtained for the sample collected in April 2010 (–0.7 ‰, Table 2). The highest d values were observed in July 2010 (14.9 ‰) and November 2010 (14.8 ‰). The mean value is 7.4 ‰ (n = 47) (Table 2) and is 1.6 ‰ lower than the mean value of 9.0 ‰ from the period 2001–2006 (Vreča et al., 2011). Most d values (72 %, i.e. 34 out of total 47) range between 5 and 15 ‰. No value higher than 15 ‰, typical for Mediterranean-derived precipitation (Cruz-San et al., 1992; rozansKI et al., 1993), was determined indicating different climate conditions as in the period 2001–2006 when more than 10 % of d values exceeded 15 ‰ (Vreča et al., 2011). It is known, that d values can alter as the air mass moves inland, due to secondary processes such as evaporation from an open surface water body which returns moisture to the air (craIg & gordon, 1965; MerlIVat & jouzel, 1979; gat et al., 1994; gat, 1996). In addition, d values can change as precipitation falls through the atmosphere (gat, 1996; araguas-araguas et al., 2000; peng et al., 2004) or as the precipitation sample sits in the precipitation collector (harVeY, 2005). It was estimated that the initial d values should not be less than 3 ‰ and that lower values should be used with caution unless the source of their evaporative enrichment is known (harVeY, 2005). A high proportion (15 %) of d values was <3 ‰ (Table 2). These values probably indicate secondary evaporation processes and correspond mainly to months with low precipitation, related to local stormy and windy events in the area or to months with light rainy events, therefore we did not exclude them from evaluation. It
is interesting that high d values (>13 ‰) were obtained for July 2010 and also July 2008. For both months very intense thunderstorms were characteristic with prevailing south and southwest winds (Internet 3).
Monthly mean δ18O, δ2H and d values, weighted by precipitation amount are summarized in Table 3 and presented in Figures 4 and 5a, where they are compared with the 2001–2006 values (Vreča et al., 2011). The higher δ18O and δ2H values in spring and summer months, due to higher air temperatures, constitute a typical seasonal variation which is less pronounced than in Ljubljana (Vreča et al., 2014). Seasonal variations of δ18O and δ2H of 5.47 ‰ and 43.1 ‰ (Table 3), respectively, were observed and are smaller than for continental stations like Ljubljana (8.81 ‰ and 53.7 ‰, respectively, Vreča et al., 2014). The lowest δ18O and δ2H values are observed in January (Table 3) and are 1.38 ‰ and 9.4 ‰ lower than those for the period 2001–2006. The positive deviations from 2001–2006 calculations are observed for May, June, August and September and can be attributed to higher temperatures and lower amounts of precipitation during sampling period 2007–2010. d values range around 8.2 ‰ (Table 3) with the lowest values in April (2.9 ‰) and the highest in July (12.9 ‰) and November (12.4 ‰). Slightly higher d values are observed in autumn and winter precipitation, with values above 10 ‰ only in November and December (Figure 5a). Most mean monthly values are lower than for the period 2001–2006, indicating the minor influence of Mediterranean air masses over the region during the observation period.
c)
d)
Polona VREČA, Ines KRAJCAR BRONIĆ & Albrecht LEIS

239
Table 2. Monthly isotopic composition (δ18O, δ2H, deuterium excess (d) and tritium activity (A)) of precipitation at Portorož for period 2007–2010. n. d. – not determined; GPC – gas proportional counter; LSC – liquid scintillation counter and electrolytic enrichment; JSI – Jožef Stefan Institute; n –number of samples.
Month/ Yearδ18O(‰)
δ2H(‰)
d(‰)
A(TU)
Method of tritium activity measurement
01/2007 –9.00 –59.7 12.3 4.3 GPC
02/2007 –8.25 –55.8 10.2 3.1 GPC
03/2007 –9.18 –72.8 0.6 4.6 GPC
04/2007 n. d. n. d. n. d. n. d.
05/2007 –6.94 –47.9 7.7 7.5 GPC
06/2007 –5.58 –34.0 10.7 10.7 GPC
07/2007 –4.37 –34.0 1.0 3.7 GPC
08/2007 –3.37 –21.6 5.4 4.8 GPC
09/2007 –5.97 –37.2 10.6 1.8 GPC
10/2007 –7.15 –47.7 9.5 2.9 GPC
11/2007 –3.56 –21.0 7.5 2.1 GPC
12/2007 –10.84 –85.0 1.7 5.0 GPC
01/2008 –4.98 –32.8 7.1 4.8 GPC
02/2008 –4.97 –35.0 4.7 3.4 GPC
03/2008 –9.39 –69.4 5.7 7.3 GPC
04/2008 –4.82 –32.8 5.8 5.8 GPC
05/2008 –3.28 –20.5 5.8 9.1 GPC
06/2008 –4.60 –35.0 1.8 9.7 LSC
07/2008 –2.60 –7.1 13.7 7.5 GPC
08/2008 –4.82 –29.4 9.2 8.6 LSC
09/2008 –5.79 –41.9 4.4 6.7 GPC
10/2008 –2.81 –18.8 3.7 14.0 GPC
11/2008 –5.02 –30.5 9.7 4.9 LSC
12/2008 –6.89 –44.2 10.9 5.5 GPC
01/2009 –10.00 –70.8 9.2 10.1 GPC
02/2009 –7.24 –50.1 7.8 7.1 GPC
03/2009 –4.06 –23.4 9.1 4.8 GPC
04/2009 –5.73 –45.6 0.2 14.8 GPC
05/2009 –2.60 –16.1 4.7 19.7 GPC
06/2009 –5.20 –37.0 4.6 9.4 LSC
07/2009 –2.63 –13.6 7.5 7.5 GPC
08/2009 –3.71 –23.8 5.9 4.4 GPC
09/2009 –5.22 –33.6 8.2 11.5 GPC
10/2009 –5.80 –39.8 6.6 13.0 GPC
11/2009 –6.60 –40.3 12.5 11.7 GPC
12/2009 –6.66 –43.0 10.3 3.6 LSC
01/2010 –12.20 –92.7 4.9 5.5 LSC
02/2010 –9.81 –73.3 5.2 7.1 LSC (JSI)
03/2010 –5.70 –43.5 2.1 8.4 LSC (JSI)
04/2010 –8.04 –65.1 –0.7 11.4 LSC (JSI)
05/2010 –4.70 –29.1 8.5 8.1 LSC
06/2010 –8.15 –54.8 10.4 9.6 LSC
07/2010 –6.18 –34.5 14.9 7.6 LSC
08/2010 –4.27 –27.9 6.3 9.1 LSC
09/2010 –5.03 –29.9 10.4 4.3 LSC
10/2010 –6.65 –42.0 11.2 5.7 LSC
11/2010 –8.49 –53.1 14.8 3.7 LSC
12/2010 –7.06 –42.2 14.3 4.0 LSC
min –12.20 –92.7 –0.7 1.8
max –2.60 –7.1 14.9 19.7
mean –6.08 –41.3 7.4 7.2
n 47 47 47 47
Isotopic composition of precipitation at the station Portorož, Slovenia – period 2007–2010

240
Figure 4. Monthly weighted mean δ18O (in legend O) and δ2H (in legend H) for periods 2001−2006 (Vreča et al., 2011) and 2007−2010 at station Portorož.
Figure 5. Monthly weighted mean a) deuterium excess (d) and b) tritium activity (A) for periods 2001−2006 (Vreča et al., 2011) and 2007−2010 at station Por-torož.
a)
b)
Seasonal mean δ18O, δ2H and d values weighted by amount of precipitation are summarized in Table 4. The lowest δ18O and δ2H values are typical of those in winter and the highest of those in summer and autumn. The d values for all seasons are <10 ‰ and confirm lower Mediterranean-derived precipitation influence than for the period 2001–2006 (Vreča et al., 2011).
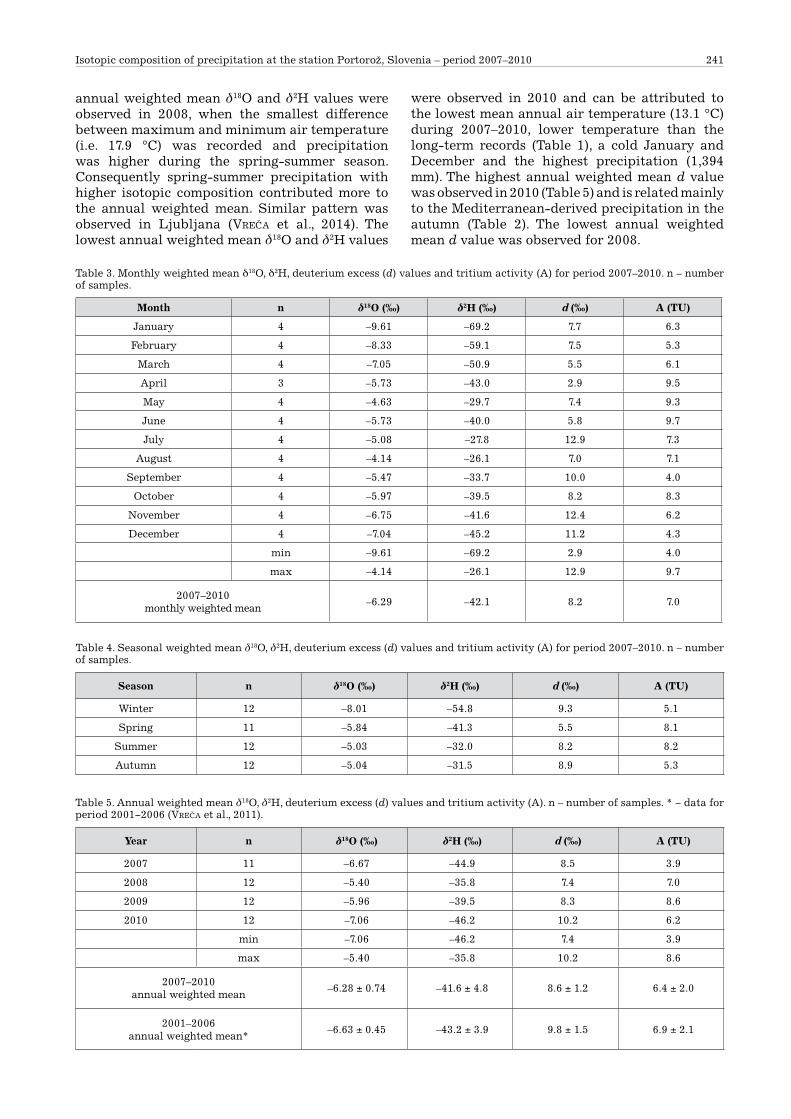
Annual mean δ18O, δ2H and d values, weighted by amount of precipitation for the period 2007–2010 are summarized in Table 5. The δ18O and δ2H values show an overall increase by 0.35 ‰ and 1.6 ‰ compared to the period 2001–2006 (Table 5), while the weighted mean d values show an overall decrease by 1.2 ‰. However, changes are not statistically significant different. The maximum
Polona VREČA, Ines KRAJCAR BRONIĆ & Albrecht LEIS
241
annual weighted mean δ18O and δ2H values were observed in 2008, when the smallest difference between maximum and minimum air temperature (i.e. 17.9 °C) was recorded and precipitation was higher during the spring-summer season. Consequently spring-summer precipitation with higher isotopic composition contributed more to the annual weighted mean. Similar pattern was observed in Ljubljana (Vreča et al., 2014). The lowest annual weighted mean δ18O and δ2H values
were observed in 2010 and can be attributed to the lowest mean annual air temperature (13.1 °C) during 2007–2010, lower temperature than the long-term records (Table 1), a cold January and December and the highest precipitation (1,394 mm). The highest annual weighted mean d value was observed in 2010 (Table 5) and is related mainly to the Mediterranean-derived precipitation in the autumn (Table 2). The lowest annual weighted mean d value was observed for 2008.
Table 3. Monthly weighted mean δ18O, δ2H, deuterium excess (d) values and tritium activity (A) for period 2007–2010. n – number of samples.
Month n δ18O (‰) δ2H (‰) d (‰) A (TU)
January 4 –9.61 –69.2 7.7 6.3
February 4 –8.33 –59.1 7.5 5.3
March 4 –7.05 –50.9 5.5 6.1
April 3 –5.73 –43.0 2.9 9.5
May 4 –4.63 –29.7 7.4 9.3
June 4 –5.73 –40.0 5.8 9.7
July 4 –5.08 –27.8 12.9 7.3
August 4 –4.14 –26.1 7.0 7.1
September 4 –5.47 –33.7 10.0 4.0
October 4 –5.97 –39.5 8.2 8.3
November 4 –6.75 –41.6 12.4 6.2
December 4 –7.04 –45.2 11.2 4.3
min –9.61 –69.2 2.9 4.0
max –4.14 –26.1 12.9 9.7
2007–2010monthly weighted mean
–6.29 –42.1 8.2 7.0
Table 4. Seasonal weighted mean δ18O, δ2H, deuterium excess (d) values and tritium activity (A) for period 2007–2010. n – number of samples.
Season n δ18O (‰) δ2H (‰) d (‰) A (TU)
Winter 12 –8.01 –54.8 9.3 5.1
Spring 11 –5.84 –41.3 5.5 8.1
Summer 12 –5.03 –32.0 8.2 8.2
Autumn 12 –5.04 –31.5 8.9 5.3
Table 5. Annual weighted mean δ18O, δ2H, deuterium excess (d) values and tritium activity (A). n – number of samples. * − data for period 2001−2006 (Vreča et al., 2011).
Year n δ18O (‰) δ2H (‰) d (‰) A (TU)
2007 11 –6.67 –44.9 8.5 3.9
2008 12 –5.40 –35.8 7.4 7.0
2009 12 –5.96 –39.5 8.3 8.6
2010 12 –7.06 –46.2 10.2 6.2
min –7.06 –46.2 7.4 3.9
max –5.40 –35.8 10.2 8.6
2007–2010 annual weighted mean
–6.28 ± 0.74 –41.6 ± 4.8 8.6 ± 1.2 6.4 ± 2.0
2001–2006 annual weighted mean*
–6.63 ± 0.45 –43.2 ± 3.9 9.8 ± 1.5 6.9 ± 2.1
Isotopic composition of precipitation at the station Portorož, Slovenia – period 2007–2010

242
Local meteoric water lines
The local meteoric water lines (LMWLs) for the period 2007–2010 were calculated using different types of linear regression analysis. The ordinary least squares regression (OLSF) regression line (LMWLOLSF) for Portorož is:
δ2H = (7.96 ± 0.28)×δ18O + (7.15 ± 1.81); r = 0.98, n = 47 (2)
The reduced major axis (RMA) regression line (LMWLRMA) is:
δ2H = (8.14 ± 0.25)×δ18O + (8.28 ± 1.64); r = 0.98, n = 47 (3)
For the precipitation amount recorded at Portorož, the precipitation weighted least square regression (PWLSR) line (LMWLPWLSR) is:
δ2H = (7.87 ± 0.28)×δ18O + (7.97 ± 1.87); r = 0.99, n = 47 (4)
For comparison with LMWLPWLSR for the 2007–2010 we calculated also the LMWLPWLSR for the 2001–2006 isotope record at Portorož (Vreča et al., 2011) and the PWLSR line (LMWLPWLSR(2001–2006)) is:
δ2H = (7.80 ± 0.27)×δ18O + (8.52 ± 1.85); r = 0.96, n = 71 (5)
All regression lines have similar values (within uncertainties) for both the slope and the intercept values.
The slopes of LMWLs obtained are close to the LMWLs for the period 2001–2006 (Vreča et al., 2011) and to those at Ljubljana for the period 2007–2010 (Vreča et al., 2014). All slopes are also close to the slope 8 of Global Meteoric Water Line (GMWL) of craIg (1961) and to that calculated from the GNIP database for the period 1961–2000 by gourcY et al. (2005).
Oxygen – temperature correlation
The linear correlation between δ18O in monthly samples and mean monthly air temperature at Portorož, T, for the period 2007–2010 (Figure 6) is:
δ18O = 0.21×T –8.94; r = 0.61, n = 47 (6)
The linear correlation between monthly weighted δ18O values and mean monthly air temperature at Portorož, Tmonthly, for the period 2007–2010 (Figure 6) is:
δ18O = 0.20×Tmonthly – 9.03; r = 0.86; n = 12 (7)
The correlations obtained differ slightly in their intercept values and have the higher slope as that for the records 2001–2003 and 2001–2006 (Vreča et al., 2006, 2011). The slope of about 0.20 ‰/°C is between those typical of continental and maritime stations (RozansKI et al., 1993) but indicates a more continental climate influence than during the period 2001–2003 (Vreča et al., 2006), lower than the one estimated for the same period for Ljubljana (Vreča et al., 2014) and close to an average isotope temperature gradient of 0.25 ‰/°C for groundwater in Slovenia estimated by Mezga et al. (2014).
Tritium activity
Results of monthly tritium activity (A) of precipitation are summarized in Table 2. We present also two numerical results below the LOD (September and November 2007) for the purpose of statistical analysis. Amount of precipitation weighted mean monthly, seasonal and annual values are summarized in Tables 3, 4 and 5. Variations of tritium activity in monthly precipitation during the sampling period 2007–2010 are presented in Figure 3d. Maximum value was observed in May 2009 (19.7 TU, Table 2), similarly as in Ljubljana (Vreča et al.,
Figure 6. Correlation betwe-en δ18O of monthly samples and monthly air temperatu-re in the period 2007−2010 (open symbol), and monthly weighted mean δ18O values and mean monthly air tem-perature for the same peri-od (full symbols).
Polona VREČA, Ines KRAJCAR BRONIĆ & Albrecht LEIS

243
2014). In May 2009 high air temperatures were recorded, precipitation was lower than the long-term mean and most precipitation fell during two thunderstorms (Internet 3). Therefore, the relatively high tritium activity may indicate the influence of continental effect and re-evaporation of tritium from the continental land surfaces. The minimum (1.8 TU, <LOD) was recorded in September 2007. Seasonal fluctuations typical of stations of the Northern hemisphere (RozansKI et al., 1991) are observed for 2007 and 2010, with lower tritium activities in autumn and winter and higher ones in spring and summer (Figure 3d), while in 2008 we observed maximum in October and in 2009 three peaks were recorded in January, May and October. Similar patterns of 3H were observed also for Ljubljana (Vreča et al., 2014) and Zagreb (Krajcar bronIć, unpublished data). The seasonality is evident also by about 3 TU difference between autumn-winter and spring-summer precipitation (Table 4). Monthly weighted mean A values are presented in Table 3 and in Figure 5b. Maximum value was observed in June (9.7 TU) and the minimum in September (4.0 TU) and December (4.3 TU) (Table 3), which is slightly different than in the period 2001–2006 (Figure 5b). The differences are related to different climate conditions (see Meteorological data: Precipitation and temperature) during periods 2001–2006 and 2007–2010. The mean tritium activity in the studied period is 7.2 TU (Table 2) and is the same as in the period 2001–2006 (Vreča et al., 2011). The weighted mean annual A is 6.4 TU and is 0.5 TU lower than for the 2001–2006 record (Table 5) but not significantly different.
The weighted mean tritium activity at the Portorož station (6.4 TU) is 2.1–2.6 TU lower than the mean tritium activity for the same period at the continental stations Ljubljana and Zagreb (8.5 TU and 9.0 TU, Vreča et al., 2014) and is related to the coastal position of the station. Similar difference (1.7–2.5 TU) between Portorož and continental stations was also observed for a short-term period 2001–2003 (Vreča et al., 2006).
A good correlation between mean monthly deuterium excess (d) and tritium activity (A) has been obtained with a slope of –0.35 ‰/TU (r = 0.52, n = 12) indicating that during the period 2007–2010 higher d values were associated with lower A values (Table 3) that correspond to precipitation that has been formed by moisture evaporated from the Adriatic Sea (FroehlIch et al., 2008).
Conclusions
The results of the water isotopic composition (δ18O, δ2H, d and A) of precipitation collected at Portorož in the period 2007–2010 are presented and compared with the data from the period 2001–2006. Isotope data corroborate conclusions derived from the analysis of the meteorological data about the change in climate setting in the
Portorož area: more positive δ18O and δ2H mean values reflect an increase in temperature, while lower deuterium excess (d) values together with the lower MI values indicate a change in air mass trajectory towards more continental influence. However, the time period of isotope data records is relatively short and is influenced by year-to-year differences in weather conditions.
The results presented are important for further scientific and practical applications in hydrology and hydrogeology, and in climatology. Taking into account the characteristic geographic diversity of Slovenia, which influences considerably the climate and the isotopic composition of precipitation, a more detailed investigation of the complete 10-year isotope data set (2001–2010) for Portorož needs to be performed. The LMWLs obtained for 10-year isotope record will be useful above all in investigating the karst hydrological systems in Slovenia that are fed directly by precipitation. Finally, a mathematical model that enables estimation of δ18O and δ2H values for the precipitation generated at distinctive atmospheric circulation patterns proposed by BrenčIč et al. (2015) will be applied to separate data with different air mass origins.
Acknowledgements
The authors express their gratitude to the staff of the Slovenian Environment Agency at the meteorological station Portorož for their valuable help in sampling and M. Demšar for help with meteorological data. Special thanks are due to S. Žigon, S. Lindbichler, J. Barešić, A. Rajtarić, B. Svetek and V. Stibilj for their valuable help with analyses. Investigations were supported financially in the frame of projects P1-0143 and BI-HR/09-10-32 by the Slovenian Research Agency and by the Ministry of Education, Science and Sports of the Republic of Croatia in the frame of project 098-0982709-2741.
References
araguas-araguas, l., FröhlIch, K. & rozansKI, K. 2000: Deuterium and oxygen-18 isotope composition of precipitation and atmospheric moisture. Hydrol. Process., 14/8: 1341–1355, doi:10.1002/1099-1 0 8 5 ( 2 0 0 0 0 6 1 5 ) 1 4 : 8 < 1 3 4 1 : : A I D -HYP983>3.0.CO;2-Z.
barešIć, j., horVatInčIć, n., Krajcar bronIć, I. & obelIć, b. 2010: Comparison of two techniques for low-level tritium measurement – gas proportional and liquid scintillation counting. Third European IRPA Congress: Radiation protection - science, safety and security, Proceedings, Full papers of poster presentations. Helsinki, Finland: P12-21-1-P12-21-5: 1988 – 1992. Internet: http://www.irpa2010europe.com/pdfs/Proceedings_-_Third_European_IRPA_Congress_2010.pdf (02.12.2015)
barešIć, j., Krajcar bronIć, I., horVatInčIć, n., obelIć, b., sIronIć, a. & Kožar-logar, j. 2011: Tritium activity measurement of water samples using liquid scintillation counter and
Isotopic composition of precipitation at the station Portorož, Slovenia – period 2007–2010

244
electrolytical enrichment. Proceedings of the 8th Symposium of the Croatian Radiation Protection Association, Krk, 13 – 15 April, 2011, Ed. by Krajcar Bronić, I., Kopjar, N., Milić, M., Branica, G. HDZZ, Zagreb, 2011, 461-467.
Bowen, G.J., Wassenaar, L. I. & Hobson, K. A. 2005: Global application of stable hydrogen and oxygen isotopes to wildlife forensics. Oecologia, 143/3: 337–348, doi:10.1007/s00442-004-1813-y.
BrenčIč, M. 2009: Hydrogeochemistry of Coastal Carbonate Aquifer in Lucija-Portorož (Gulf of Trieste, Northern Adriatic Sea, Slovenia). Acta Carsologica, 38/2: 179–196, doi:10.3986/ac.v38i2-3.122.
BrenčIč, M., KononoVa, N. & Vreča, P. 2015: Relation between isotopic composition of precipitation and atmospheric circulation patterns. J. Hydrol., 529/3:1422–1432, doi:10.1016/j.jhydrol.2015.08.040.
cegnar, T. 2011: Climate in Slovenia in 2010. UJMA 25: 17–27. (in Slovene)
Coplen, T.B., Hopple, J.A., BöhlKe, J.K., PeIser, H.S., RIeder, S.E., Krouse, H.R., RosMan, K.J.R., DIng, T., VocKe, Jr., R.D., ReVesz, K.M., LaMbertY, A., TaYlor, P, & De BIèVre, P. 2002: Compilation of minimum and maximum isotope ratios of selected elements in naturally occurring terrestrial materials and reagents: U.S. Geological Survey Water-Resources Investigations Report 01-4222,01-4222: 98 p.
craIg, h. 1961: Isotope variations in meteoric waters. Science, 133: 1702-1703, doi:10.1126/science.133.3465.1702.
craIg, h. & gordon, l. 1965: Deuterium and Oxygen-18 Variations in the Ocean and the Marine Atmosphere. In: tongIorgI, E. (Ed.): Stable Isotopes in Oceanographic Studies and Paleotemperatures. Cons. Naz. di Rech., Spoleto, Italy, 9–130.
cruz-san, j., araguas-araguas, l., rozansKI, K., benaVente, j., cardenal, j., hIdalgo, M. c., garcIa-lopez, s., MartInez-garrIdo, j. c., Moral, F. & olIas, M. 1992: Sources of precipitation over South-Eastern Spain and groundwater recharge – An isotopic study. Tellus, 44B: 226–236.
CucchI, F., FranceschInI, G. & ZInI, L. 2008: Hydrogeochemical investigations and groundwater provinces of the Friuli Venezia Giulia Plain aquifers, northeastern Italy. Environ. Geol., 55: 985–999, doi: 10.1007/s00254-007-1048-4.
dansgaard, w. 1964: Stable isotopes in precipitation. Tellus, 16/4: 436–468, doi: 10.1111/j.2153-3490.1964.tb00181.x.
ehhalt, D.H. 1971: Vertical profiles and transport of HTO in the troposphere. J. Geophys. Res., 76: 7351–7367.
epsteIn, s. & MaYeda, t.K. 1953: Variations of 18O content of waters from natural sources. Geochim. Cosmochim. Acta, 4/5: 213–224, doi:10.1016/0016-7037(53)90051-9.
FroehlIch, K., KralIK, M., Papesch, W., RanK, D., ScheIFInger, H. & StIchler, W. 2008: Deuterium excess in precipitation of Alpine regions - moisture recycling. Isot. Environ. Health. Stud., 44/1: 61–70, doi:10.1080/10256010801887208.
gat, j. r., bowser, c. j. & Kendall, c.1994: The Contribution of Evaporation from the Great Lakes to the Continental Atmosphere: Estimate Based on Stable Isotope Data. Geophys. Res. Lett., 21/7: 557–560, doi:10.1029/94GL00069.
gat, j.r. 1996: Oxygen and hydrogen isotopes in the hydrologic cycle. Annu. Rev. Earth. Planet Sci, 24: 225–262.
gourcY, l.l., groenIng, p.K. & aggarwal, p.K. 2005: Stable oxygen and hydrogen isotopes in precipitation. In: aggarwal, p.K., gat, j.r. & FroehlIch, K. (Eds.): Isotopes in the water cycle: past, present and future of a developing science. Dordrecht: Springer, 39–51.
harVeY, F.e. 2005: Stable hydrogen and oxygen isotopic composition of precipitation in northeastern Colorado. J. Am. Water Resour. Assoc., 41/2: 447–460, doi:10.1111/j.1752-1688.2005.tb03748.x
hebert, d. 1990: Technogenic tritium in Central European precipitation. Isot. Environ. Health. Stud., 26/2: 592–595, doi:10.1080/10256019008622441.
hobson, K.a. & wassenaar, l.I. 1997: Linking brooding and wintering Grounds of neotropical migrant songbirds using stable hydrogen Isotopic analysis of feathers. oecologia, 109: 142–148.
hughes, c.e. & crawFord, j. 2012: A new precipitation weighted method for determining the meteoric water line for hydrological applications demonstrated using Australian and global GNIP data. J. Hydrol., 464–465: 344–351, doi:10.1016/j.jhydrol.2012.07.029.
IAEA 1992: Statistical treatment of environmental isotopes in precipitation. Technical Report Series No. 331, IAEA, Vienna: 781 p.
KIgoshI, K. & Yoneda, K. 1970: Daily variation in the tritium concentration of atmospheric moisture. J. Geophys. Res., 75: 2981–2984, doi:10.1029/JC075i015p02981.
KoppanY, g. & Unger, j. 1992: Mediterranean Climatic Character in the Annual March of Precipitation. Acta Climatologica, 24–26: 59–71.
KoVačIč, K. 2015: radioactive isotopes in ground waters of Slovenia. Dissertation, Nova Gorica, XV, 127 p. Internet: http://repozitorij.ung.si/Dokument.php?id=3167&lang=slv (date 29/10/ 2015)
Krajcar bronIć, I., Vreča, P., horVatInčIć, N., barešIć, J. & obelIć, B. 2006: Distribution of hydrogen, oxygen and carbon isotopes in the atmosphere of Croatia and Slovenia, Arhiv za higijenu rada i toksikologiju, 57: 23–29.
Krajcar bronIć, I., barešIć, j., sIronIć, a. & horVatInčIć, n. 2013: Stability analysis of systems for preparation and measurement of 3H and 14C (In Croatian with English Abstract). In: KnežeVIć, ž., Majer, M. & Krajcar bronIć, I. (Eds.): Proceedings of the 9th Symposium of the
Polona VREČA, Ines KRAJCAR BRONIĆ & Albrecht LEIS

245
Croatian Radiation Protection Association, Krk, 10 – 12 April, 2013, HDZZ, Zagreb, 495–501.
LIotta, M., BellIssIMo, S., FaVara, R. & Valenza, M. 2008: Isotopic composition of single rain events in the central Mediterranean. J. Geophys. Res. 113: D16304, doi:10.1029/2008JD009996.
Lucas, L. L. & Unterweger, M. P. 2000: Comprehensible Review and Critical of the Half-life of Tritium. Journal of Research of the National Institute of Standards and Technology, 105–4: 541–549.
MandIć, M., BojIć, D., Roller-Lutz, Z., Lutz, H.O. & Krajcar BronIć, I. 2008: Note on the spring region of Gacka River (Croatia). Isot. Environ. Health. Stud., 44/2: 201–208.
MatsuMoto, t., MaruoKa, t., shIModa, g., obata, h., KagI, h., suzuKI, K., YaMaMoto, K., MItsuguchI, t., hagIno, K., toMIoKa, n., saMbandaM, c., bruMMer, d., Klaus, p.M. & aggarwal, p. 2013: Tritium in Japanese precipitation following the March 2011 Fukushima Daiichi Nuclear Plant accident. Sci. Total Environ., 445–446: 365–370, doi:10.1016/j.scitotenv.2012.12.069.
MerlIVat, l. & jouzel, j. 1979: Global Climate Interpretation of the Deuterium-Oxygen 18 Relationship for Precipitation. J. Geophys. Res., 84(C8): 5029–5033, doi:10.1029/JC084i C08p05029.
Mezga, K. 2014: Natural hydrochemical background and dynamics of groundwater in Slovenia. Dissertation, Nova Gorica, XVI: 226 p. Internet: http://www.ung.si/~library/doktorati/okolje/37Mezga.pdf (date 11/08/2014)
Mezga, K., urbanc, j. & cerar, s. 2014: The isotope altitude effect reflected in groundwater: a case study from Slovenia. Isot. Environ. Health. Stud., 50/1: 33–51, doi:10.1080/10256016.2013.826213.
MIchelInI, M. 2013: Studio geochimico-isotopico delle precipitazioni del Friuli-Venezia Giulia. Dissertation, Trieste: 123 p. Internet: http://www.openstarts.units.it/dspace/bitstream/10077/8666/1/Studio%20geochimico%20isotopico%20delle%20p r e c i p i t a z i o n i % 2 0 d e l % 2 0 Fr i u l i % 2 0Venezia%20Giulia.pdf (date 05/11/2015).
MorrIson, j., brocKwell, t., Merren, t., Fourel, F. & phIllIps a.M. 2001: On-line high-precision stable hydrogen isotopic analyses on nanoliter water samples. Anal. Chem., 73/15: 3570–3575, doi:10.1021/ac001447t.
peng, h., MaYer, b., harrIs, s. & Krouse, h. r. 2004: A 10-yr record of stable isotope ratios of hydrogen and oxygen in precipitation at Calgary, Alberta, Canada. Tellus, 56B: 147–159, doi:10.1111/j.1600-0889.2004.00094.x.
rozansKI, K., gonFIantInI, r. & araguas-araguas, l. 1991: Tritium in the global atmosphere: distribution patterns and recent trends. Journal of Physics G: Nuclear and Particle Physics, 17: 523–536, doi:10.1088/0954-3899/17/S/053.
rozansKI, K., araguas-araguas, l. & gonFIantInI, r. 1993: Isotopic patterns in modern global precipitation. Geophys. Monogr. 78: 1–36, doi:10.1029/GM078p0001.
Saccon, P., LeIs, A., Marca, A., KaIser, J., CaMpIsI, L., Böttcher, M.E., SaVarIno, J., Escher, P., EIsenhauer, A. & Erbland, J. 2013: Multi-isotope approach for the identification and characterisation of nitrate pollution sources in the Marano lagoon (Italy) and parts of its catchment area. Appl. Geochem. 34: 75–89, doi:10.1016/j.apgeochem.2013.02.007.
terzer, s., wassenaar, l. I., araguas-araguas, l. & aggarwal, p. 2013: Global isoscapes for δ18O and δ2H in precipitation: improved prediction using regionalized climatic regression models. Hydrol. Earth syst. Sci., 17: 4713–4728, doi:10.5194/hess-17-4713-2013.
thoMpson, p.a., KwaMena, n.-o.a., IlIna, M., wIlK, M. & clarK, I.D. 2015: Levels of tritium in soils and vegetation near Canadian nuclear facilities releasing tritium to the atmosphere: implications for environmental models. J. Environ. Radioact. 140: 105-113, doi:10.1016/j.jenvrad.2014.11.009
ueda, s., hasegawa, h., KaKIuchI, K., ochIaI, s., aKata, n. & hIsaMatsu, s. 2015: Nuclear accident-derived 3H in river water of Fukushima Prefecture during 2011–2014. J. Environ. Radioact. 146: 102–109,
unnIKrIshnan warIer, c., praVeen babu, M., Manjula, p. & shahul haMeed, A. 2013: Spatial and temporal variations of natural tritium in precipitation of southern India. Curr. Sci. India 105: 242–249.
VerboVšeK, T. & Kanduč, T. 2015: Isotope Geochemistry of Groundwater from Fractured Dolomite Aquifers in Central Slovenia. Aquat. Geochem., 1-21, doi: 10. 1007/ s10498-015-9281-z.
VodIla, g., palcsu, l., Futó, I. & szántó, zs. 2011: A 9-year record of stable isotope ratios of precipitation in Eastern Hungary: Implications on isotope hydrology and regional palaeoclimatology. J. Hydrol., 400: 144–153, doi:10.1016/j.jhydrol.2011.01.030.
Vreča, p., Kanduč, t., žIgon, s. & trKoV, z. 2005: Isotopic composition of precipitation in Slovenia. In: gourcY, L. (Ed.): Isotopic composition of precipitation in the Mediterranean basin in relation to air circulation patterns and climate, 157-172, IAEA-TECDOC-1453, IAEA, Vienna.
Vreča, p., Krajcar bronIć, I., horVatInčIć, n. & barešIć, j. 2006: Isotopic characteristics of precipitation in Slovenia and Croatia: Comparison of continental and maritime stations. J. Hydrol., 330/3–4: 457–469, doi:10.1016/j.jhydrol.2006.04.005.
Vreča, p., brenčIč, M. & leIs, a. 2007: Comparison of monthly and daily isotopic composition of precipitation in the coastal area of Slovenia. Isot. Environ. Health. Stud., 43/4: 307–321, doi:10.1080/10256010701702739.
Vreča, p., Krajcar bronIć, I., leIs, a. & brenčIč, M. 2008: Isotopic composition of precipitation in Ljubljana (Slovenia). Geologija, 51/2: 169–180, doi:10.5474/geologija.2008.018.
Isotopic composition of precipitation at the station Portorož, Slovenia – period 2007–2010

246
Vreča, p., Krajcar bronIć, I. & leIs, a. 2011: Isotopic composition of precipitation in Portorož (Slovenia). Geologija, 54/1: 129–138, doi:10.5474/geologija.2011.010.
Vreča, p., Krajcar bronIć, I., leIs, a. & deMšar, M. 2014: Isotopic composition of precipitation at the station Ljubljana (Reaktor), Slovenia – period 2007–2010. Geologija, 57/2: 217–230, doi:10.5474/geologija.2014.019.
Internet resources:Internet 1: http://www-naweb.iaea.org/napc/ih/
IHS_resources_gnip.html (15/11/2015)Internet 2: http://www-naweb.iaea.org/napc/ih/
documents/global_cycle/vol%20II/cht_ii_05.pdf (02/12/2015)
Internet 3: http://meteo.arso.gov.si/ (10/11/2015)
Polona VREČA, Ines KRAJCAR BRONIĆ & Albrecht LEIS


![Isotopic composition [ACE] Solar Modulation [PAMELA,ULYSSES]](https://static.fdocuments.us/doc/165x107/56814019550346895dab6670/isotopic-composition-ace-solar-modulation-pamelaulysses.jpg)