Chemical and isotopic composition of secondary organic ...
20
university of copenhagen Chemical and isotopic composition of secondary organic aerosol generated by -pinene ozonolysis Meusinger, Carl; Dusek, Ulrike; King, Stephanie Michelle; Holzinger, Rupert; Rosenørn, Thomas; Sperlich, Peter; Julien, Maxime; Remaud, Gerald S.; Bilde, Merete; Röckmann, Thomas; Johnson, Matthew Stanley Published in: Atmospheric Chemistry and Physics DOI: 10.5194/acp-17-6373-2017 Publication date: 2017 Document version Publisher's PDF, also known as Version of record Document license: CC BY Citation for published version (APA): Meusinger, C., Dusek, U., King, S. M., Holzinger, R., Rosenørn, T., Sperlich, P., Julien, M., Remaud, G. S., Bilde, M., Röckmann, T., & Johnson, M. S. (2017). Chemical and isotopic composition of secondary organic aerosol generated by -pinene ozonolysis. Atmospheric Chemistry and Physics, 17(10), 6373-6391. https://doi.org/10.5194/acp-17-6373-2017 Download date: 28. okt.. 2021
Transcript of Chemical and isotopic composition of secondary organic ...
u n i ve r s i t y o f co pe n h ag e n
Chemical and isotopic composition of secondary organic aerosol generated by -pineneozonolysis
Meusinger, Carl; Dusek, Ulrike; King, Stephanie Michelle; Holzinger, Rupert; Rosenørn,Thomas; Sperlich, Peter; Julien, Maxime; Remaud, Gerald S.; Bilde, Merete; Röckmann,Thomas; Johnson, Matthew Stanley
Published in:Atmospheric Chemistry and Physics
DOI:10.5194/acp-17-6373-2017
Publication date:2017
Document versionPublisher's PDF, also known as Version of record
Document license:CC BY
Citation for published version (APA):Meusinger, C., Dusek, U., King, S. M., Holzinger, R., Rosenørn, T., Sperlich, P., Julien, M., Remaud, G. S.,Bilde, M., Röckmann, T., & Johnson, M. S. (2017). Chemical and isotopic composition of secondary organicaerosol generated by -pinene ozonolysis. Atmospheric Chemistry and Physics, 17(10), 6373-6391.https://doi.org/10.5194/acp-17-6373-2017
Download date: 28. okt.. 2021
Atmos. Chem. Phys., 17, 6373–6391, 2017www.atmos-chem-phys.net/17/6373/2017/doi:10.5194/acp-17-6373-2017© Author(s) 2017. CC Attribution 3.0 License.
Chemical and isotopic composition of secondary organic aerosolgenerated by α-pinene ozonolysisCarl Meusinger1,a, Ulrike Dusek2,3, Stephanie M. King1,4, Rupert Holzinger2, Thomas Rosenørn1,5, Peter Sperlich6,b,Maxime Julien7, Gerald S. Remaud7, Merete Bilde1,c, Thomas Röckmann2, and Matthew S. Johnson1
1Department of Chemistry, University of Copenhagen, 2100, Copenhagen Ø, Denmark2Institute for Marine and Atmospheric research Utrecht (IMAU), Utrecht University, 3584 CC, Utrecht, the Netherlands3Centre for Isotope Research, Energy and Sustainability Research Institute Groningen, 9747 AG Groningen, the Netherlands4now at: Haldor Topsøe A/S, 2800, Kgs. Lyngby, Denmark5Infuser ApS, 2200, Copenhagen N, Denmark6Max-Planck Institute for Biogeochemistry, 07745 Jena, Germany7CEISAM, UMR CNRS6230, BP 92208, Nantes 44322 cedex 3, Franceanow at: Airlabs, 2200, Copenhagen N, Denmarkbnow at: National Institute of Water and Atmospheric Research (NIWA), Wellington 6021, New Zealandcnow at: Aarhus University, Department of Chemistry, 8000 Aarhus C, Denmark
Correspondence to: Carl Meusinger ([email protected])
Received: 17 February 2016 – Discussion started: 19 February 2016Revised: 21 March 2017 – Accepted: 20 April 2017 – Published: 29 May 2017
Abstract. Secondary organic aerosol (SOA) plays a centralrole in air pollution and climate. However, the description ofthe sources and mechanisms leading to SOA is elusive de-spite decades of research. While stable isotope analysis isincreasingly used to constrain sources of ambient aerosol, inmany cases it is difficult to apply because neither the iso-topic composition of aerosol precursors nor the fractiona-tion of aerosol forming processes is well characterised. Inthis paper, SOA formation from ozonolysis of α-pinene –an important precursor and perhaps the best-known modelsystem used in laboratory studies – was investigated us-ing position-dependent and average determinations of 13C inα-pinene and advanced analysis of reaction products usingthermal-desorption proton-transfer-reaction mass spectrom-etry (PTR-MS). The total carbon (TC) isotopic compositionδ13C of the initial α-pinene was measured, and the δ13C ofthe specific carbon atom sites was determined using position-specific isotope analysis (PSIA). The PSIA analysis showedvariations at individual positions from−6.9 to+10.5 ‰ rela-tive to the bulk composition. SOA was formed from α-pineneand ozone in a constant-flow chamber under dark, dry, andlow-NOx conditions, with OH scavengers and in the absenceof seed particles. The excess of ozone and long residence
time in the flow chamber ensured that virtually all α-pinenehad reacted. Product SOA was collected on two sequentialquartz filters. The filters were analysed offline by heatingthem stepwise from 100 to 400 ◦C to desorb organic com-pounds that were (i) detected using PTR-MS for chemicalanalysis and to determine the O : C ratio, and (ii) convertedto CO2 for 13C analysis.
More than 400 ions in the mass range 39–800 Da weredetected from the desorbed material and quantified using aPTR-MS. The largest amount desorbed at 150 ◦C. The O : Cratio of material from the front filter increased from 0.18 to0.25 as the desorption temperature was raised from 100 to250 ◦C. At temperatures above 250 ◦C, the O : C ratio of ther-mally desorbed material, presumably from oligomeric pre-cursors, was constant. The observation of a number of com-ponents that occurred across the full range of desorption tem-peratures suggests that they are generated by thermal decom-position of oligomers.
The isotopic composition of SOA was more or less inde-pendent of desorption temperature above 100 ◦C. TC analy-sis showed that SOA was enriched in 13C by 0.6–1.2 ‰ rel-ative to the initial α-pinene. According to mass balance,gas-phase products will be depleted relative to the initial
Published by Copernicus Publications on behalf of the European Geosciences Union.

6374 C. Meusinger et al.: Isotopic and chemical composition of α-pinene SOA
α-pinene. Accordingly, organic material on the back filters,which contain adsorbed gas-phase compounds, is depleted in13C in TC by 0.7 ‰ relative to the initial α-pinene, and by1.3 ‰ compared to SOA collected on the front filter. The ob-served difference in 13C between the gas and particle phasesmay arise from isotope-dependent changes in the branchingratios in the α-pinene + O3 reaction. Alternatively, some gas-phase products involve carbon atoms from highly enrichedand depleted sites, as shown in the PSIA analysis, giving anon-kinetic origin to the observed fractionations. In eithercase, the present study suggests that the site-specific distri-bution of 13C in the source material itself governs the abun-dance of 13C in SOA.
1 Introduction
Secondary organic aerosol (SOA) is formed in the atmo-sphere by oxidation of volatile organic compounds (VOCs).SOA contributes significantly to atmospheric aerosol and im-pacts climate, air quality, and health (Stocker et al., 2013;Hänninen et al., 2004; Dockery et al., 1993; Andreae andCrutzen, 1997). Despite their impacts the mechanisms ofSOA formation and processing are poorly understood andsignificant discrepancies between model predictions and ob-servations are common.
Stable carbon isotopes are increasingly used to investi-gate aerosols in the atmosphere. Isotopic analysis holds thepromise of clearly identifying SOA sources and atmospherictransformations, as long as we know enough details, such asthe isotopic composition of the source emissions, the kineticfractionations occurring in oxidation reactions, and the iso-tope effects in phase partitioning. The ability to distinguishindividual sources, including marine aerosol (Turekian et al.,2003; Ceburnis et al., 2011) and biomass burning (Kirillovaet al., 2013), by isotope measurements has been particularlyuseful when it comes to source apportionment of ambientaerosol (e.g. Sakugawa and Kaplan, 1995; Narukawa et al.,2008; Turekian et al., 2003; Widory et al., 2004; Ho et al.,2006; Huang et al., 2006; Fisseha et al., 2009; Kirillova et al.,2013; Ceburnis et al., 2011; Fu et al., 2012; Miyazaki et al.,2012; O’Dowd et al., 2014; Masalaite et al., 2015).
In some other cases, measurements of the isotopic compo-sition of SOA have yielded intriguing and/or contradictoryresults: (Irei et al., 2014) found that SOA formation from ox-idation of volatile organics lead to depletion in 13C in thelow-volatile fraction of the aerosol. (Fu et al., 2012), how-ever, reported isotopic enrichments in ambient SOA that aredistinguishable between biomass burning and primary emis-sions, possibly hinting at the oxidation of biogenic VOCs.
Recent technical advances have made it possible to quan-tify isotopic enrichments at specific sites within molecules,in addition to the traditional determination of the enrichmentof the sample itself (Bayle et al., 2014b). This development
makes possible new analyses of chemical mechanisms andtransformations in the environment. Consider a chemical re-action that goes to completion to give a variety of products.The atoms of a reagent are distributed among the products,depending on the branching ratios for the different reactionchannels. The branching ratios may themselves be isotope-dependent. For the formation of SOA from a VOC precur-sor, the isotopic enrichments or depletions that are observedin the SOA arise from the contributions of many oxidationproducts. Mass balance implies that the complimentary pat-tern will be observed in gas-phase products. Many interestingresearch questions arise from the application of site-specificisotopic analysis to atmospheric science. Perhaps the mostimportant question is whether observed average compositionof the SOA is due to the isotope dependent changes in prod-uct branching ratios within the reaction mechanism or due tothe site-specific enrichments of the reagent.
Isotopic substitution can cause reactions to be faster orslower than for the un-substituted case, kinetically fraction-ating the isotopes and leading to isotopic enrichment or de-pletion in the products. This is known as the kinetic isotopeeffect (KIE). If a reaction leads to a single product, the prod-uct may initially have a different abundance; but due to thelaw of mass balance, the product will achieve the same abun-dance as the reagent as the reaction goes to completion. If areaction has multiple product channels, enrichment or deple-tion will occur if there are isotope-dependent changes in theproduct branching ratios.
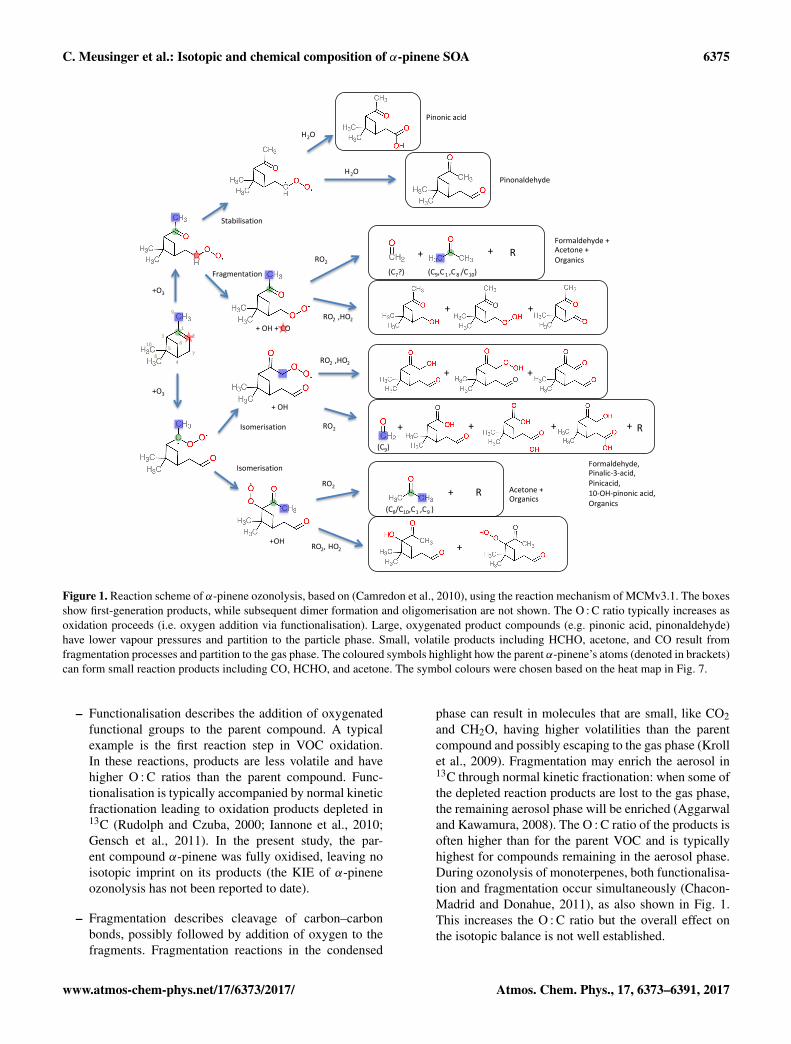
The ozonolysis of α-pinene is often used as a test sys-tem for formation of SOA; it is fairly well studied. Fig-ure 1 shows a reaction scheme for α-pinene ozonolysis,based on the “Master Chemical Mechanism” (MCMv3.1)as described by (Camredon et al., 2010). In the first step,ozone adds into the double bond of the molecule, result-ing in two branches depending on the usual Criegee mech-anism. These two branches proceed by stabilisation, subse-quent fragmentation and isomerisation, and subsequent reac-tion with RO2, HO2, and H2O to yield a wide range of oxida-tion products from CO, HCHO, and acetone, to many largeroxidised low volatile molecules like pinic acid and pinonicacid and pinonaldehyde. The figure shows only formation offirst-generation products. Further reactions including dimerformation (Kristensen et al., 2016) and oligomerisation reac-tions are not shown.
Generally, reactions involved in atmospheric VOC ox-idation fall into three categories: functionalisation, frag-mentation, and oligomerisation (Kroll and Seinfeld, 2008;Rudich et al., 2007; Chacon-Madrid and Donahue, 2011).The volatility (Donahue et al., 2006; Jimenez et al., 2009)and oxygen-to-carbon ratio, O : C (Donahue et al., 2011;Kroll et al., 2011), of involved species allow for the charac-terisation of these processes. The characteristics of the threetypes of atmospheric VOC reactions and current understand-ing of how they contribute to isotopic fractionation (Kirillovaet al., 2013, 2014) are summarised as follows:
Atmos. Chem. Phys., 17, 6373–6391, 2017 www.atmos-chem-phys.net/17/6373/2017/
C. Meusinger et al.: Isotopic and chemical composition of α-pinene SOA 6375
Stabilisation
Fragmentation
+ O3
+ O3
Isomerisation
Isomerisation
H2O
H2O
RO2
RO2 , HO2
RO2
RO2, HO2
RO2 , HO2
RO2
Formaldehyde + Acetone + Organics
R + +
+ +
+ +
+
+
+ + + +
R Acetone + Organics
R
Formaldehyde, Pinalic-3-acid, Pinic acid, 10-OH-pinonic acid, Organics
Pinonic acid
Pinonaldehyde
+ OH
1 2 3
4
5 6
7 8
9
10
+ OH + CO
+ OH
(C8/C10, C1 , C9 )
(C9)
(C7?) (C9, C 1 , C 8 /C10)
Figure 1. Reaction scheme of α-pinene ozonolysis, based on (Camredon et al., 2010), using the reaction mechanism of MCMv3.1. The boxesshow first-generation products, while subsequent dimer formation and oligomerisation are not shown. The O : C ratio typically increases asoxidation proceeds (i.e. oxygen addition via functionalisation). Large, oxygenated product compounds (e.g. pinonic acid, pinonaldehyde)have lower vapour pressures and partition to the particle phase. Small, volatile products including HCHO, acetone, and CO result fromfragmentation processes and partition to the gas phase. The coloured symbols highlight how the parent α-pinene’s atoms (denoted in brackets)can form small reaction products including CO, HCHO, and acetone. The symbol colours were chosen based on the heat map in Fig. 7.
– Functionalisation describes the addition of oxygenatedfunctional groups to the parent compound. A typicalexample is the first reaction step in VOC oxidation.In these reactions, products are less volatile and havehigher O : C ratios than the parent compound. Func-tionalisation is typically accompanied by normal kineticfractionation leading to oxidation products depleted in13C (Rudolph and Czuba, 2000; Iannone et al., 2010;Gensch et al., 2011). In the present study, the par-ent compound α-pinene was fully oxidised, leaving noisotopic imprint on its products (the KIE of α-pineneozonolysis has not been reported to date).
– Fragmentation describes cleavage of carbon–carbonbonds, possibly followed by addition of oxygen to thefragments. Fragmentation reactions in the condensed
phase can result in molecules that are small, like CO2and CH2O, having higher volatilities than the parentcompound and possibly escaping to the gas phase (Krollet al., 2009). Fragmentation may enrich the aerosol in13C through normal kinetic fractionation: when some ofthe depleted reaction products are lost to the gas phase,the remaining aerosol phase will be enriched (Aggarwaland Kawamura, 2008). The O : C ratio of the products isoften higher than for the parent VOC and is typicallyhighest for compounds remaining in the aerosol phase.During ozonolysis of monoterpenes, both functionalisa-tion and fragmentation occur simultaneously (Chacon-Madrid and Donahue, 2011), as also shown in Fig. 1.This increases the O : C ratio but the overall effect onthe isotopic balance is not well established.
www.atmos-chem-phys.net/17/6373/2017/ Atmos. Chem. Phys., 17, 6373–6391, 2017
6376 C. Meusinger et al.: Isotopic and chemical composition of α-pinene SOA
– Oligomerisation (sometimes also referred to as accre-tion) describes the building of larger organic structuresfrom monomers, often in the aerosol phase (Kalbereret al., 2004, 2006; Hallquist et al., 2009). One mecha-nism is that oxygenated organics become linked by de-hydration reactions, and this lowers the O : C ratio. Theformation of complex organic mixtures in the aerosolphase (Cappa et al., 2008) is expected to show similarcharacteristics in vapour pressure and O : C ratio. Theinfluence of oligomerisation on the isotopic composi-tion of the aerosol is not clear, but likely small.
Chemical analysis based on proton-transfer-reaction massspectrometry has proven very useful in ambient and labora-tory studies investigating aerosol and gas-phase compoundsand their properties (e.g. Holzinger et al., 2010a, b; Shillinget al., 2008; Presto and Donahue, 2006). Advantages of thetechnique include the soft ionisation, high sensitivity, widerange of detectable compounds, and the possibility of quan-tifying them. In addition, using a proton-transfer-reactiontime-of-flight mass spectrometer (PTR-ToF-MS, shortenedto PTR-MS for the remainder of the article) allows chemicalcharacterisation and identification of compounds and estima-tion of the O : C ratio.
Position-specific isotope analysis (PSIA) of the initial re-actant offers a detailed description of bulk isotopic data bymapping the intra-molecular isotope distribution. PSIA by13C isotope ratio monitoring by nuclear magnetic resonance(NMR) (irm-13C NMR) has proven valuable in interpreting anumber of (bio)chemical (Bayle et al., 2014a; Botosoa et al.,2009a; Gilbert et al., 2011, 2012) and physical–chemical pro-cesses such as distillation and sorption (Botosoa et al., 2008,2009b; Höhener et al., 2012), leading to a deeper understand-ing of the underlying phenomena causing isotope fractiona-tion in nature. It is widely understood that the enrichmentor depletion of a product depends on the enrichment of thestarting material, the isotopic fractionation occurring in themechanism of its formation, and the extent of reaction. Us-ing PSIA, we can take this analysis one step further: the en-richment of a product will depend on the position-dependentenrichments of the atoms from which it is formed. For ex-ample the ozonolysis mechanism transfers the C9-atom in α-pinene into several small, volatile products (see blue squaresin Fig. 1). If the C9-position was depleted in 13C, the gas-phase products containing this atom would be depleted, andthe SOA correspondingly enriched, as long as the position-dependent effect was stronger than kinetic isotope effects.
In this study we have designed an experiment to use a com-bination of position-specific, sample-average, and molecule-average isotopic abundance data to investigate the formationof SOA from the ozonolysis of α-pinene. Due to mass bal-ance, the enrichment (or depletion) in SOA must be balancedby depletion (or enrichment) in gas-phase products, since inour experiment α-pinene ozonolysis has gone to completion.However, since the reaction mechanism is not known in de-
tail and cannot be determined from our experiment, we areleft to interpret an incomplete case. One instructive limitingcase is to ask which atoms in α-pinene are transformed intoknown gas-phase products. We argue that the observed iso-tope distribution in SOA is likely balanced by the oppositepattern in the gas-phase products, and that this pattern couldbe produced by site-specific enrichments in the starting mate-rial and current incomplete knowledge of the reaction mech-anism alone, aside from whatever effects isotopic substitu-tion may have on product branching ratios. Thus, we makethe case that position-sensitive isotopic enrichments and de-pletions, and not just bulk KIEs, are an important element ofexplaining field observations, especially for natural productswhich are known to have, as a group, significant site-specificenrichments and depletions relative to fossil and/or syntheticcompounds. The goal of this study is to provide detailedisotopic and chemical characterisation of newly formed α-pinene SOA and to shed light on the mechanisms that governisotopic fractionation in the formation of fresh SOA.
2 Material and methods
2.1 Chemical compounds used
Chamber experiments were performed using the fol-lowing chemicals: (+)-α-pinene (Aldrich, > 99%, batchno. 80796DJV), 1-Butanol (Sigma-Aldrich, > 99.4%) andcyclohexane (Labscan, 99.5 %). PSIA was performed on sev-eral samples of α-pinene from Sigma-Aldrich (different lot),Acros Organics, Merck, and Alfa Aesar; see Table 1. Thebatch of α-pinene used in the chamber experiments could notbe analysed using PSIA, because the manufacturer does notsupply it anymore.
2.2 Chamber design and characteristics
A new aerosol smog chamber was built in Copenhagenbased on a steady-state design (King et al., 2009; Shillinget al., 2008; Kleindienst et al., 1999). It consists of a 4.5 m3
teflon bag (the volume / surface ratio is 0.275 m) mounted in-side a temperature-controlled insulated room of walk-in size(Viessmann A/S); see Fig. S1 in the Supplement. While de-tails can be found in Sect. S1, chamber operation is brieflysummarised here. The chamber was operated in a constant-flow mode: dry air and reactants were constantly flushed intothe chamber using mass flow controllers. A syringe pump(NE-300, New Era Pump Systems Inc.) continuously in-jected a mixture of α-pinene and 1-butanol or a mixture of α-pinene and cyclohexane into a warmed glass bulb. 1-butanoland cyclohexane were used as OH scavengers and the mix-ing ratio between α-pinene and the OH scavenger was 1 : 600(v/v). A small flow of clean, dry air (0.1 L min−1) directedover a Hg lamp emitting UV light (model 600, Jelight com-pany inc.) generated ozone which was fed into the chamberseparately.
Atmos. Chem. Phys., 17, 6373–6391, 2017 www.atmos-chem-phys.net/17/6373/2017/

C. Meusinger et al.: Isotopic and chemical composition of α-pinene SOA 6377
Table 1. Manufacturer information and isotopic composition of α-pinene samples. Position-specific isotopic fractionation is given as isotopicdifference, 1i
(13C
)= δi
(13C
)− δ◦jTC
(13C
), of individual C atoms (i) in α-pinene sample j with bulk isotopic composition δ◦jTC
(13C
).
Listed are the means of five measurements. See inserted figure for numbering of C atoms. Sample 1 was used in the chamber experiments,but PSIA could not be performed as the sample was no longer available.
Sample j Manufacturer Purity Code Lot δ◦jTC
(13C
)1i
(13C
)(‰)
29
(%) (‰) C1 C2 C3 C4 C5 C6,7 C8 C9 C10
1 Sigma-Aldrich > 99 268070 80796DJV −30.02 Sigma-Aldrich > 99 268070 MKBQ6213V −27.7 4.8 10.5 −1.0 2.4 −6.0 0.6 −0.3 −6.7 −4.33 Acros Organics 98 131261000 A0310018 −27.0 4.1 10.4 −1.3 3.2 −5.2 1.9 −0.2 −6.9 −5.44 Merck > 97 818632 S21251 423 −28.1 6.1 9.6 −1.4 3.6 −3.8 −0.8 −1.2 −5.2 −3.95 Alfa Aesar 98 L04941 10175835 −27.8 7.8 5.8 −0.8 4.2 0.0 −1.8 −3.6 −4.5 −3.3
Table 2. Overview of α-pinene (δ◦1TC
(13C
)= (−29.96± 0.08)‰) ozonolysis experiments using 1-butanol (B) or cyclohexane (C) as OH-
scavenger. Filter IDs are explained in the text. The sampling time, t , and the sampled volume, V , are given. Isotopic data at 100 ◦C and150 ◦C and for total carbon (TC) are given as 1
(13C
)= δ
(13C
)− δ◦1TC
(13C
). The total aerosol mass loading as detected by PTR-MS,
MPTR-MStotal , is listed next. The last column lists the measured O : C ratio averaged over all desorption temperatures.
1(
13C)(‰)
Experiment Filter ID t (h) V (m3) 100◦C 150 ◦C TC MPTR-MStotal (µg m−3) O : C
Ba (α-pinene, B1f 47 28.2 2.8± 0.2 1.2± 0.1 1.2± 0.1 6.9 0.231-butanol) B1b 47 28.2 2.9± 0.4 -0.7± 0.2 – 0.4 0.21
B2f 16.8 10.1 – – – 6.3 0.22B2b 16.8 10.1 – – – – –
C (α-pinene, C1f 24.5 14. 7 2.4± 0.5 0.5± 0.1 0.6± 0.1 8.9 0.23cyclohexane) C1b 24.5 14.7 – – – 0.9 0.22
C2f 26.7 16.5 1.7± 0.3 1.0± 0.1 0.7± 0.1 11.7 0.23C2b 26.7 16.5 – – -0.8± 0.3 – –
Handling blank HB – – 10.0± 0.8 8.9± 0.1 – 0.23b –
a CCN data available; see Sect. S2.b Surface loading in units of micrograms per square centimetre (µg cm−2).
Generated aerosol was sampled after an ozone scrubberon doubly stacked quartz-fibre filters (4.7 cm diameter, QM-A 1851, Whatman) for offline chemical and isotope analysisat 10 Lmin−1. Collection times were around 1–2 days in or-der to provide sufficient amounts of carbon on the filters forisotope analysis; see Table 2. The ozone scrubber had a de-nuder design and used potassium iodine (Williams and Gros-jean, 1990). It protected instruments from high ozone levelsbut also precluded further reaction of collected samples withozone on the filters.
Several instruments monitored gaseous and particulatematter inside the bag: a scanning mobility particle sizer(SMPS; TSI 3081 DMA and 3772 CPC, 0.0508 cm impactor)was used to measure particle size distributions (10–500 nmdiameter if not stated otherwise) and a cloud condensationnuclei (CCN) counter (Droplet Measurement Technologies)gave information on the CCN properties of generated SOA(King et al., 2012). Temperature and relative humidity weremeasured continuously inside the bag (HygroFlex HF532,
Rotronic) and read by the same software that controlled thepressure inside the bag. NOx (= NO+NO2) levels weremonitored using a chemiluminescence NOx analyzer (42i,Thermo). The same line fed a UV photometric O3 analyzer(49i, Thermo) to monitor ozone levels.
2.3 α-pinene ozonolysis
All aerosol was generated from the dark ozonolysis of α-pinene under low-NOx conditions (< 2ppb) without anyseed particles present. Experiments were performed with twodifferent OH scavengers: Experiment B with 1-butanol andExperiment C with cyclohexane. The amount of α-pinene in-jected using the syringe pump resulted in a steady-state con-centration of ca. 60 ppb inside the bag (without oxidants).Ozone concentrations during the experiment were alwaysabove 150 ppb, i.e. ozone was always in excess. The tem-perature was stable at 22 ◦C and RH< 1%. Without seedparticles present, aerosol formed via new particle formation.
www.atmos-chem-phys.net/17/6373/2017/ Atmos. Chem. Phys., 17, 6373–6391, 2017

6378 C. Meusinger et al.: Isotopic and chemical composition of α-pinene SOA
Table 2 gives an overview of the conditions under which ex-periments B and C were performed.
The natural (e-folding) lifetime of α-pinene with respect toozonolysis is τO3 = (k[O3])
−1= 40min, based on an ozone
concentration of 150 ppb and a second-order rate coefficientof k = 1.1× 10⁻¹⁶ cm3 molecule−1 s−1 (Witter et al., 2002).The nominal residence time of an air parcel in the chamberis τnominal ≈ 3.4h (see Sect. S1) which exceeds the naturallifetime with respect to ozone loss by a factor of 5. Thismeans that more than 99 % of α-pinene will have reactedat steady state, and for further evaluation and discussion itis assumed that α-pinene ozonolysis was complete. As totalmass is conserved for all isotopes, the isotopic compositionof the ozonolysis products should be equal to that of the ini-tial reagent.
2.4 Filter handling protocol
Glass vials with plastic stoppers were used to store the quartzfilters for off-line analysis before and after the experiments.The glass vials themselves were cleaned in a ceramic oven at600 ◦C for 24 h prior to use. The quartz filters were cleaned inthe same oven at 600 ◦C for more than 20 h prior to use. Eachfilter was stored in a separate glass vial that was wrapped inaluminium foil and stored in a dark freezer (−30 ◦C) exceptwhen loading or during transport between Copenhagen andUtrecht. Two quartz filters (quartz behind quartz, QBQ) wereloaded at a time in a cleaned filter holder to account for pos-sible sampling artefacts, such as adsorption and evaporationof organic vapours on or from the filters (Watson et al., 2009;Turpin et al., 2000). In this study the first filter, facing thesample stream, is called the front filter, while the second one(stacked below) is called the back filter. Storage time betweenloading and analysis was up to 6 months. During transportthe filters stayed in the wrapped vials but were not activelycooled. Prior to analysis the filters were cut into pieces of uni-form size (0.5 and 1 cm diameter). Blank filters were treatedidentically to loaded filters but were not exposed to chamberair. Gloves were used whenever working directly with the fil-ters, and all tools were rinsed several times using first acetoneand then ethanol.
2.5 Filter analysis
The filter samples from the smog chamber experiments wereanalysed for their chemical and isotopic composition atthe Institute for Marine and Atmospheric research Utrecht(IMAU). Propagated uncertainties based on at least threemeasurements are given as 1-sigma errors. Filter IDs (iden-tifications) are composed of a capital letter denoting the ex-periment (B using 1-butanol or C using cyclohexane as OHscavenger), a digit counting the experiments using that scav-enger, and a small letter indicating the filter position: b forback filter and f for front filter.
2.5.1 Thermal-desorption chemical analysis of filters
The chemical analysis follows methods described earlier(Holzinger et al., 2010b; Timkovsky et al., 2015) and willonly be outlined briefly here. The chemical analysis setupconsisted of a two-stage oven. Filter pieces were heated step-wise in the first oven to temperatures of 100, 150, 200,250, 300, and 350 ◦C, while the temperature of the sec-ond oven was kept constant at 200 ◦C. SOA componentsdesorbed from the filters according to their volatility and aflow of nitrogen (50 mL min−1) carried them to the PTR-MS (PTR-TOF8000, Ionicon Analytik GmbH, Austria) sit-uated directly after the second oven. The PTR-MS inlet washeated to its maximum temperature of 180 ◦C, while the drifttube was operated at 120 ◦C. This monotonic gradient fromthe first oven stage to the drift tube inside the PTR-MS re-duced cold spots and minimised repeated sample condensa-tion. The PTR-MS detected the desorbed compounds afterprotonation (addition of 1H) as ions with a mass-to-chargeratio (m/z)+ 1.
The PTR-MS had a mass resolution of m/1m≈ 4000, al-lowing detection of ions with differences in m/z larger than30 mDa. The algorithm for analysing the PTR-MS data isbased on a method reported earlier (Holzinger et al., 2010a;Holzinger, 2015). For each experiment (B or C), the ionsdetected on the front and back filters were combined ina unified-peak list to minimise statistical uncertainty andimprove overall mass accuracy (Holzinger et al., 2010a).Ions with m/z < 39 Da were excluded (except 33.03 Da,methanol, and 31.01 Da, formaldehyde) as the PTR-MSmainly detects primary ions in this mass region, which do notoriginate from the filters. Water clusters with masses 37.026and 55.038 Da can form in the PTR-MS and were not con-sidered to be aerosol compounds. A total of 685 (753) ionswere detected by the PTR-MS in experiment B (C). In orderto take the contribution from the blank filter (filter ID “HB”for handling blank) into account, the blank filter loading wascalculated from the PTR-MS signal and subtracted from thefront and back filters for each ion on the unified-peak list.All concentrations are then reported relative to smog cham-ber conditions, i.e. as mass concentration per unit volume ofair in the smog chamber. Table 2 lists the blank-corrected to-tal mass concentration, MPTR-MS
total . Many ions had negligibleconcentrations. The 427 (451) ions from the unified-peak listof experiment B (C), comprising 90 % of the total aerosolmass detected by PTR-MS (counting from the ion with high-est concentration downwards), were considered for furtheranalysis in order to streamline data analysis and reduce noise.
The data analysis algorithm identified the molecular for-mulas of the detected ions (i.e. the total number of mostabundant stable C, H, O, and N isotopes) based on their ex-act masses. If the peak resolution did not allow unambiguousidentification, several candidates were suggested (Holzingeret al., 2010a). The suggested formulas for all prominentpeaks were checked manually on at least two filters and cor-
Atmos. Chem. Phys., 17, 6373–6391, 2017 www.atmos-chem-phys.net/17/6373/2017/

C. Meusinger et al.: Isotopic and chemical composition of α-pinene SOA 6379
rected if necessary, including when the suggested formulacontained N or 13C. The former can be excluded due to thelow-NOx conditions in the experiment, and the latter canbe easily verified by the corresponding carbon-12 peak at(m/z− 1)+ 1. Most of the ions were identified unambigu-ously and typically only ca. 5 % of the total mass from frontfilter desorption was attributed to ions with no clear molecu-lar formula.
The oxygen-to-carbon ratios of the ions were calculated asin (Holzinger et al., 2013) for each filter at each desorptiontemperature:
O :C=∑winO,i∑winC,i
. (1)
Here, the sum counts over all identified ions i, wi is the mea-sured amount of ion i in moles (mol) and nC,i , and nO,i arethe respective number of carbon and oxygen atoms for ioni as given by its molecular formula. Equation (1) gives theratio of oxygen to carbon atoms in all identified ions.
2.5.2 Thermal-desorption isotope analysis of filters
The system used to measure the carbon isotope compositionof the filter samples consisted of a two-stage oven, as de-scribed in detail by (Dusek et al., 2013). The filter pieceswere heated stepwise in the first oven stage to tempera-tures of 100, 150, 200, 250, 300, 340, and 390 ◦C, desorbingSOA compounds according to their volatility. In the secondoven stage, the gaseous compounds were oxidised to CO2 at550 ◦C using a platinum wool catalyst. The CO2 was driedand purified using two cold traps and a gas chromatographycolumn before it was analysed in a Delta Plus XL isotoperatio mass spectrometer (IR-MS; Thermo). The catalyst wascharged using pure O2 and then a filter piece was placed inthe oven which was subsequently flushed with helium. Theheating of the filter and subsequent purification of CO2 tookplace in a helium carrier gas flow. Filter samples were brack-eted between blank filter samples. IR-MS detects each iso-topologue of CO2 as a distinct peak with an associated peakarea. The δ
(13C)
value was calculated from these areas (seebelow). Reported data were corrected by taking the corre-sponding blank filter measurements into account.
Isotope data are commonly reported in delta notation,using Vienna Pee Dee Belemnite (VPDB), as an element-specific international standard for 13C:
δ(
13C)=
Rsa(13C
)RVPDB
(13C
) − 1. (2)
Here, Rsa(13C
)and RVPDB
(13C)
denote the isotope ratios(13C / 12C) in the sample and standard, respectively. For typi-cal ambient samples, the reproducibility lies below 0.3 ‰ foroven temperatures below 200 ◦C and below 0.5 ‰ for oventemperatures above 200 ◦C (Dusek et al., 2013).
In this study isotopic compositions of filter material arediscussed relative to the isotopic composition of the initialα-pinene, δ◦1TC
(13C), where TC denotes total carbon analysis
(see below). Changes in isotopic composition are then re-ported as an isotopic difference (Coplen, 2011):
1(
13C)= δ
(13C
)− δ◦1TC
(13C
), (3)
where 1(13C
)> 0 indicates enrichment and 1
(13C)< 0 in-
dicates depletion in 13C with respect to the initial α-pinene.
2.6 Total carbon isotope analysis of α-pinene andselected filters
The α-pinene used in the smog chamber experiments andselected filters (see Table 2) were transferred into tin cap-sules (4× 6 mm capsules from Lüdi AG, Flawil, Switzer-land), weighed, and analysed for total carbon isotopic com-position, δTC
(13C)
in the ISOLAB of the Max Planck In-stitute for Biogeochemistry in Jena, Germany. The analyti-cal setup comprised an elemental analyser (EA-1100, CarloErba, Milan, Italy) which was coupled to a Delta+ IR-MS(Finnigan MAT, Bremen, Germany) through a ConFlo III in-terface (Werner et al., 1999). The complete system was de-scribed by Brooks et al. (2003). All δTC
(13C)
isotope ratioswere referenced against the VPDB scale using an in-houseworking standard which itself is referenced against NBS-22(National Bureau of Standards, now NIST), with a prescribedvalue of −30.03 ‰ (Coplen et al., 2006). Blank tests withineach measurement sequence were used for blank correction.The analytical performance was maintained and monitoredaccording to a measurement protocol that was described byWerner and Brand (2001). The estimated uncertainty of theδTC
(13C)
analysis was 0.11 ‰, based on long-term perfor-mance records. The total carbon isotopic composition is re-ported here as δ◦1TC
(13C)
for the initial α-pinene used in thesmog chamber experiments and as isotopic difference withsubscript TC,1TC
(13C)= δTC
(13C)−δ◦1TC
(13C), for all other
samples.
2.7 Position-specific isotope analysis of α-pinene
Quantitative NMR spectrometry tuned for isotopic measure-ments was used to quantify the relative abundance of eachcarbon isotopomer of α-pinene. The sample preparation forNMR analysis consisted of the successive addition of 100 µLof a relaxing agent, Cr(Acac)3 (Merck) at 0.1 M in the locksubstance, Acetone-d6 (EURISOTOP), to a 4 mL vial. Then600 µL of pure α-pinene was added and the mixture wasintroduced into a 5 mm NMR tube. Quantitative 13C NMRspectra were recorded using a Bruker AVANCE III con-nected to a 5 mm internal diameter BBFO probe tuned to therecording frequency of 100.62 MHz. The temperature of theprobe was set to 303 K, without tube rotation. The acquisi-tion conditions were those recommended in previous works
www.atmos-chem-phys.net/17/6373/2017/ Atmos. Chem. Phys., 17, 6373–6391, 2017

6380 C. Meusinger et al.: Isotopic and chemical composition of α-pinene SOA
(Bayle et al., 2014b; Silvestre et al., 2009) and are detailed inSect. S5. Isotope 13C / 12C ratios were calculated from pro-cessed spectra (see Fig. S4) as described previously (Bayleet al., 2014b; Silvestre et al., 2009); see Sect. S5. The mea-sured position-specific isotopic compositions are given indelta notation and denoted as δi
(13C)
where i denotes the po-sition of the C atom; see Fig. 7. Typical accuracy of δi
(13C)
is 1‰.Total carbon isotopic abundance, δ◦jTC
(13C), was deter-
mined by IR-MS using an Integra2 spectrometer (Ser-con Instruments, Crewe, UK) linked to a Sercon elemen-tal analyser. Here, j denotes different α-pinene samplesas listed in Table 1 (PSIA was only performed for sam-ples j = 2. . .5). A precision balance (Ohaus DiscoveryDV215CD) has been used to introduce 0.5 mg of pure α-pinene into tin capsules (2× 5 mm, Thermo Fisher sci-entific), before loading them into the elemental analyser.The instrument was referenced against the VPDB scale us-ing international reference materials NBS-22 (δVPDB
(13C)=
−30.03‰), SUCROSE-C6 (δVPDB(13C
)=−10.80‰), and
IAEA-CH-7 PEF-1 (δVPDB(13C
)=−32.15‰) (IAEA, Vi-
enna, Austria). Instrumental deviation was followed via alaboratory standard of glutamic acid. The correspondingposition-specific isotopic difference is reported as1i
(13C)=
δi(13C
)− δ◦j
(13C).
3 Results
3.1 Aerosol characteristics
The evolution of SMPS-derived size distributions and totalmass concentrations over time show that the aerosol popula-tion inside the bag was nearly constant for several days afterthe first day; see Fig. S2 and panel (a) in Fig. S3. Samplingon filters was started ca. 24 h after the injection of VOCsinto the chamber. The CCN activity of SOA generated in thisstudy resembles literature data for α-pinene SOA generatedin batch mode chambers (Fig. S3b). The integrated SMPSsize distribution provides an estimate of the total SOA massconcentration in the chamber: 22 and 25 µgm−3 for exper-iment B and C, respectively, although particles larger than500 nm are not accounted for. A detailed characterisation ofthe chamber aerosol can be found in Sect. S2.
3.2 Chemical composition
3.2.1 Blank filter
Very low surface loadings (0.23 µgcm−2) were found on theblank filter (HB); see Table 2. No peaks above 220 Da weredetected. C3H6OH+ (corresponding to protonated acetone)was the only compound found on the blank filter in con-centrations above 5 ngcm−2 at 100 ◦C, while all other ionsshowed temperature-independent concentrations below that.
6000
5000
4000
3000
2000
1000
0Sum
of i
on c
once
ntra
tions
/ ng
m-3
350300250200150100
Desorption temperature /˚C
B1f B1b B2f C1f C1b C2f
Figure 2. Sum of mass concentrations of desorbed SOA filter ma-terial from α-pinene ozonolysis, as detected by PTR-MS. The con-centrations of all detected ions were summed for each desorptiontemperature. Full lines represent front filters, dashed lines back fil-ters.
High concentrations of acetone desorbed from all filters at100 ◦C and may be an artefact from cleaning, although ace-tone is produced in the reaction, as shown in Fig. 1. The totalsurface loadings of the front and back filters always exceededthose on the blank filter except for single ions with concen-trations near the detection limit, sometimes found desorbingfrom back filters at temperatures other than 150 ◦C. Correc-tion for the blank filter concentration then resulted in nega-tive concentrations for these ions for the back filters. Thesecases were neglected in the further data analysis.
3.2.2 Concentration thermograms
Figure 2 shows the sum of mass concentrations at eachtemperature step, as measured by PTR-MS. All front filters(B1f, B2f, C1f, and C2f) show a similar profile with mostof the mass desorbing at 150 ◦C. The back filters (B1b andC1b) are used to characterise the positive sampling artifact,namely gas-phase compounds that adsorb to the quartz-fibrefilters. Material collected on QBQ back filters can be as-sumed to mainly consist of adsorbed gas-phase compoundscorresponding to a positive gas-phase artefact (Cheng andHe, 2015). This is confirmed by the chemical analysis of backfilters in this study, which differs considerably from that ofthe corresponding front filters, as detailed in Sect. S3. Theback filters show small mass loadings – roughly 6 and 13 %of the masses of their respective front filters. The large massdifference between front and back filters suggests efficientsampling of a dominant aerosol phase on front filters and asmall positive sampling artifact. The front filters were notcorrected for the sampling artifact.
The total SOA mass concentration in the chamber derivedfrom PTR-MS measurements was of the order of 10 µgm−3;see Table 2. Overall, the SMPS measured total mass concen-
Atmos. Chem. Phys., 17, 6373–6391, 2017 www.atmos-chem-phys.net/17/6373/2017/

C. Meusinger et al.: Isotopic and chemical composition of α-pinene SOA 6381
100 150 200 250 300 350
Desorption temperature / ◦ C
0
50
100
150
200
250
300
-Io
n c
once
ntr
ati
on / n
g m
3 (a) 169.085, C9H12O3H+81.07, C6H8H+125.096, C8H12OH+43.0172, C2H2OH+39.0226, C3H2H+155.07, C8H10O3H+41.0381, C3H4H+59.0491, C3H6OH+95.0861, C7H10H+127.075, C7H10O2H+
100 150 200 250 300 350
Desorption temperature / ◦ C
0
10
20
30
40
50
60
Ion
conce
ntr
atio
n/
ng
m3 (b)
45.0330, C2H4OH+171.065, C8H10O4H+141.089, C8H12O2H+183.098, C10H14O3H+171.098, C9H14O3H+61.0285, C2H4O2H+199.092, C5H14O6N2H+187.092, C9H14O4H+185.116, C10H16O3H+31.0169, CH2OH+
-
Figure 3. Mass concentration thermograms of compounds desorbing from filter C1f as detected by PTR-MS. Filter C1f contains SOA fromα-pinene ozonolysis in dark and dry conditions using cyclohexane as an OH scavenger. All ions are labelled by their masses in daltons (Da)and their identified molecular formula. Ions with the largest concentrations are listed first. The 10 ions with highest mass concentrationsare plotted in (a). The most abundant ions found in this study with masses similar to compounds reported in the literature (see Table 3) areplotted in (b). These are the same compounds as those below the line in Table 4 and include those predicted by the MCM, e.g. pinic acid(187.093 Da) and pinonic acid (185.117 Da). See Sect. S4 for more details. Most ions show a peak at 150 ◦C, but their desorption patternsdiffer at lower and higher temperatures.
Table 3. Main references cited in this study for comparison of chemical composition. The identifier (last column) denotes the letter thereference corresponds to in Table 4 and Sect. S6. Abbreviations: QP: quadrupole; TD: thermal desorption; TOF: time-of-flight; LC: liquidchromatography; MS: mass spectrometer; GC: gas chromatography; HP: high performance.
Study Sample Sample phase Instrumentation / method Identifier
(Holzinger et al., 2005) Ambient, forest Gas PTR-MS (QP) –(Holzinger et al., 2010a) Ambient, Austrian Alps Aerosol TD-PTR-MS (TOF) a(Winterhalter et al., 2003) α-pinene ozonolysis Aerosol LC-MS b(Jaoui and Kamens, 2003) α-pinene + β-pinene ozonolysis Aerosol GC-MS, HP-LC c(Jenkin, 2004) α-pinene ozonolysis Gas + aerosol Modelling d(Camredon et al., 2010) α-pinene ozonolysis Gas + aerosol MCM Modelling ∗
∗ MCM names.
trations that were up to 4 times higher than the concentra-tions measured by PTR-MS. This difference might be due tosome factors related to the individual steps of the chemicalanalysis, e.g. filter sampling, extraction from the filter, andanalysis by PTR-MS. An earlier study using an impactor-based thermal-desorption PTR-MS concluded that the totalaerosol mass measured was typically 20 % lower than the to-tal aerosol mass measured with an SMPS (Holzinger et al.,2010b). The authors estimated conservatively that their PTR-MS setup detected 55–80 % of the total aerosol mass. Fil-ter sampling losses of up to 10 % were attributed to nega-tive sampling artefacts, i.e. evaporation from the filter, duringsampling times of 24 h or longer in earlier work (Subrama-nian et al., 2004). The maximum desorption temperature dur-ing chemical analysis was only 350 ◦C, and previous studieson β-pinene ozonolysis and photo-oxidation of terpenes alsoshowed significant remaining volume fractions at desorptiontemperatures exceeding 400 ◦C (Emanuelsson et al., 2013,2014). Finally, charring and fragmentation in the PTR-MScan additionally lower PTR-MS-derived total mass concen-trations. Section S4 describes these processes in more detail,
as well as other aspects relevant to PTR-MS data interpreta-tion.
Figure 3 shows mass concentration thermograms of spe-cific compounds desorbing from front filter C1f. Table 4complements information in Fig. 3, and Sect. S6 gives thefull list of ions detected by PTR-MS from filter C1f. In Fig. 3most ions show the highest concentrations at a desorptiontemperature of 150 ◦C, in agreement with Fig. 2.
A pure compound is expected to desorb from the filter attemperatures between its melting and boiling temperatures.(Dusek et al., 2013) observed this on the same analyticalsetup for dicarboxylic acids. In principle, pure compoundswill be detected by the PTR-MS as an ion of similar massand only in this temperature window. There are several pos-sible reasons why the same ion is observed over a range oftemperatures. Since fragmentation of chemical compoundscan occur during thermal desorption in the oven and ionisa-tion in the PTR-MS (see Sect. S4), a fraction of the detectedions are likely fragments of larger (heavier) compounds. Thisfragmentation can occur at all desorption temperatures andconsequently fragments are detected over a range of temper-
www.atmos-chem-phys.net/17/6373/2017/ Atmos. Chem. Phys., 17, 6373–6391, 2017
6382 C. Meusinger et al.: Isotopic and chemical composition of α-pinene SOA
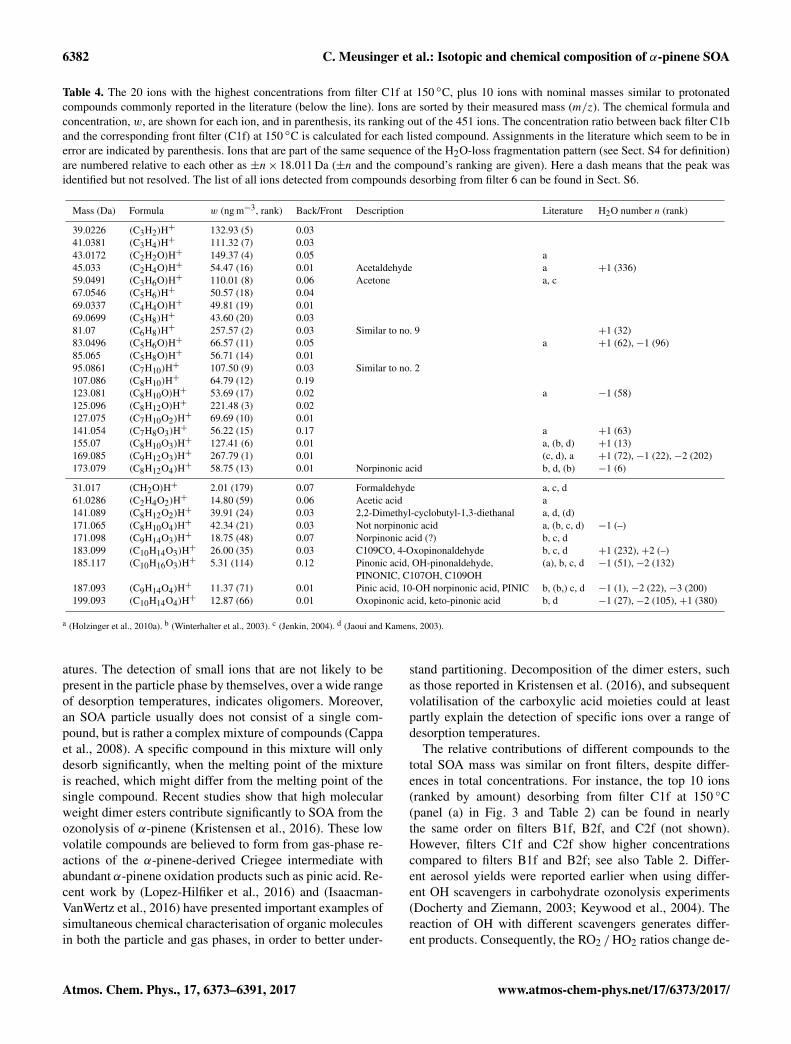
Table 4. The 20 ions with the highest concentrations from filter C1f at 150 ◦C, plus 10 ions with nominal masses similar to protonatedcompounds commonly reported in the literature (below the line). Ions are sorted by their measured mass (m/z). The chemical formula andconcentration, w, are shown for each ion, and in parenthesis, its ranking out of the 451 ions. The concentration ratio between back filter C1band the corresponding front filter (C1f) at 150 ◦C is calculated for each listed compound. Assignments in the literature which seem to be inerror are indicated by parenthesis. Ions that are part of the same sequence of the H2O-loss fragmentation pattern (see Sect. S4 for definition)are numbered relative to each other as ±n× 18.011 Da (±n and the compound’s ranking are given). Here a dash means that the peak wasidentified but not resolved. The list of all ions detected from compounds desorbing from filter 6 can be found in Sect. S6.
Mass (Da) Formula w (ng m−3, rank) Back/Front Description Literature H2O number n (rank)
39.0226 (C3H2)H+ 132.93 (5) 0.0341.0381 (C3H4)H+ 111.32 (7) 0.0343.0172 (C2H2O)H+ 149.37 (4) 0.05 a45.033 (C2H4O)H+ 54.47 (16) 0.01 Acetaldehyde a +1 (336)59.0491 (C3H6O)H+ 110.01 (8) 0.06 Acetone a, c67.0546 (C5H6)H+ 50.57 (18) 0.0469.0337 (C4H4O)H+ 49.81 (19) 0.0169.0699 (C5H8)H+ 43.60 (20) 0.0381.07 (C6H8)H+ 257.57 (2) 0.03 Similar to no. 9 +1 (32)83.0496 (C5H6O)H+ 66.57 (11) 0.05 a +1 (62), −1 (96)85.065 (C5H8O)H+ 56.71 (14) 0.0195.0861 (C7H10)H+ 107.50 (9) 0.03 Similar to no. 2107.086 (C8H10)H+ 64.79 (12) 0.19123.081 (C8H10O)H+ 53.69 (17) 0.02 a −1 (58)125.096 (C8H12O)H+ 221.48 (3) 0.02127.075 (C7H10O2)H+ 69.69 (10) 0.01141.054 (C7H8O3)H+ 56.22 (15) 0.17 a +1 (63)155.07 (C8H10O3)H+ 127.41 (6) 0.01 a, (b, d) +1 (13)169.085 (C9H12O3)H+ 267.79 (1) 0.01 (c, d), a +1 (72), −1 (22), −2 (202)173.079 (C8H12O4)H+ 58.75 (13) 0.01 Norpinonic acid b, d, (b) −1 (6)
31.017 (CH2O)H+ 2.01 (179) 0.07 Formaldehyde a, c, d61.0286 (C2H4O2)H+ 14.80 (59) 0.06 Acetic acid a141.089 (C8H12O2)H+ 39.91 (24) 0.03 2,2-Dimethyl-cyclobutyl-1,3-diethanal a, d, (d)171.065 (C8H10O4)H+ 42.34 (21) 0.03 Not norpinonic acid a, (b, c, d) −1 (–)171.098 (C9H14O3)H+ 18.75 (48) 0.07 Norpinonic acid (?) b, c, d183.099 (C10H14O3)H+ 26.00 (35) 0.03 C109CO, 4-Oxopinonaldehyde b, c, d +1 (232), +2 (–)185.117 (C10H16O3)H+ 5.31 (114) 0.12 Pinonic acid, OH-pinonaldehyde, (a), b, c, d −1 (51), −2 (132)
PINONIC, C107OH, C109OH187.093 (C9H14O4)H+ 11.37 (71) 0.01 Pinic acid, 10-OH norpinonic acid, PINIC b, (b,) c, d −1 (1), −2 (22), −3 (200)199.093 (C10H14O4)H+ 12.87 (66) 0.01 Oxopinonic acid, keto-pinonic acid b, d −1 (27), −2 (105), +1 (380)
a (Holzinger et al., 2010a). b (Winterhalter et al., 2003). c (Jenkin, 2004). d (Jaoui and Kamens, 2003).
atures. The detection of small ions that are not likely to bepresent in the particle phase by themselves, over a wide rangeof desorption temperatures, indicates oligomers. Moreover,an SOA particle usually does not consist of a single com-pound, but is rather a complex mixture of compounds (Cappaet al., 2008). A specific compound in this mixture will onlydesorb significantly, when the melting point of the mixtureis reached, which might differ from the melting point of thesingle compound. Recent studies show that high molecularweight dimer esters contribute significantly to SOA from theozonolysis of α-pinene (Kristensen et al., 2016). These lowvolatile compounds are believed to form from gas-phase re-actions of the α-pinene-derived Criegee intermediate withabundant α-pinene oxidation products such as pinic acid. Re-cent work by (Lopez-Hilfiker et al., 2016) and (Isaacman-VanWertz et al., 2016) have presented important examples ofsimultaneous chemical characterisation of organic moleculesin both the particle and gas phases, in order to better under-
stand partitioning. Decomposition of the dimer esters, suchas those reported in Kristensen et al. (2016), and subsequentvolatilisation of the carboxylic acid moieties could at leastpartly explain the detection of specific ions over a range ofdesorption temperatures.
The relative contributions of different compounds to thetotal SOA mass was similar on front filters, despite differ-ences in total concentrations. For instance, the top 10 ions(ranked by amount) desorbing from filter C1f at 150 ◦C(panel (a) in Fig. 3 and Table 2) can be found in nearlythe same order on filters B1f, B2f, and C2f (not shown).However, filters C1f and C2f show higher concentrationscompared to filters B1f and B2f; see also Table 2. Differ-ent aerosol yields were reported earlier when using differ-ent OH scavengers in carbohydrate ozonolysis experiments(Docherty and Ziemann, 2003; Keywood et al., 2004). Thereaction of OH with different scavengers generates differ-ent products. Consequently, the RO2 /HO2 ratios change de-
Atmos. Chem. Phys., 17, 6373–6391, 2017 www.atmos-chem-phys.net/17/6373/2017/
C. Meusinger et al.: Isotopic and chemical composition of α-pinene SOA 6383
pending on the scavenger used, influencing the volatility dis-tribution of products of α-pinene SOA. Overall, an increaseof SOA yield is predicted when using cyclohexane as OHscavenger compared to 2-butanol (Jenkin, 2004). Assumingthat 1-butanol behaves like 2-butanol (Shilling et al., 2008),the larger desorbed aerosol mass detected by PTR-MS in thecyclohexane experiments is consistent with these consider-ations. However, the most abundant reaction products werenot affected.
The chemical composition of aerosol found in this studywas compared to previously published chemical composi-tions of ambient aerosol and SOA derived from α-pineneozonolysis (in dry, dark, and low-NOx conditions). Figure 3bshows concentration thermograms of ions with masses at-tributed to compounds reported previously; see Table 4. ThePTR-MS allowed discrimination of particulate reaction prod-ucts reported earlier (Holzinger et al., 2005, 2010a; Winter-halter et al., 2003; Jenkin, 2004; Jaoui and Kamens, 2003). Inmany cases the identification could be positively confirmed,but in some cases an original attribution could be falsified(details can be found in Sect. S4). Some references in Table 4and in Sect. S5 are bracketed to indicate when the assignedformulae for ion masses differed from those in the litera-ture. Compounds predicted by modelling studies are notedby their capitalised Master Chemical Mechanism name in thedescription field in Table 4 and Sect. S6, confirming the pres-ence of several predicted species. These compounds includepinic acid (compound no. 72 in Sect. S6) and pinonic acid(no. 116 in Sect. S6) which are also shown in Fig. 1.
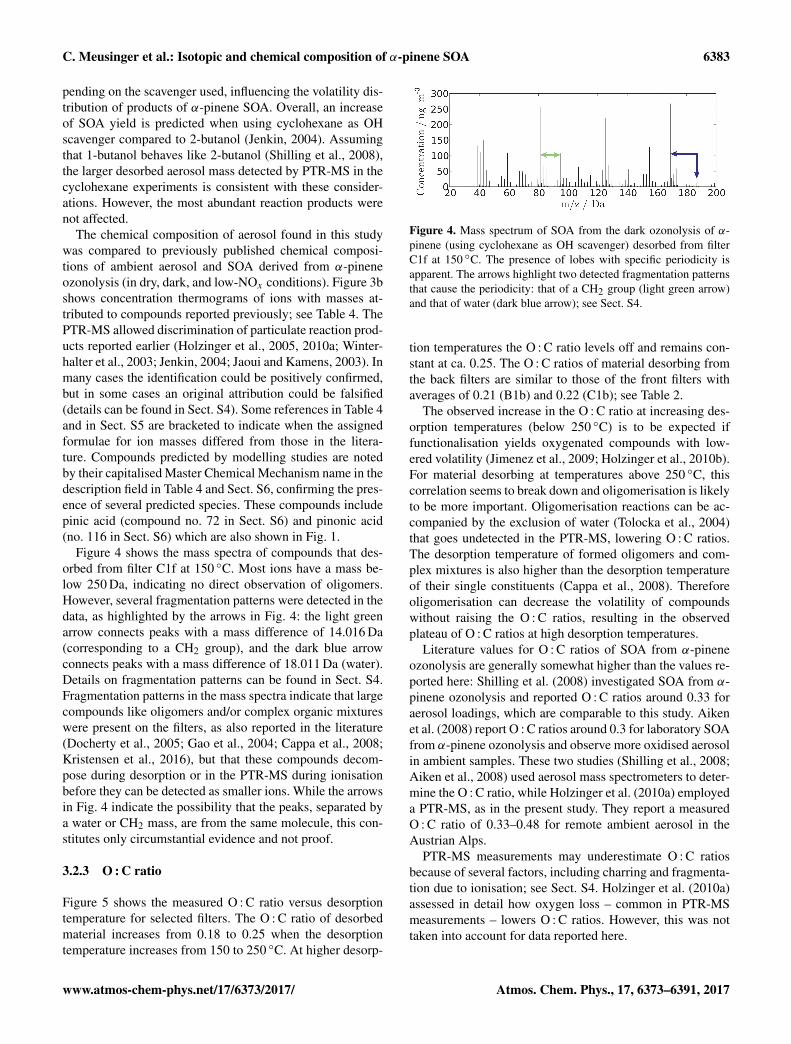
Figure 4 shows the mass spectra of compounds that des-orbed from filter C1f at 150 ◦C. Most ions have a mass be-low 250 Da, indicating no direct observation of oligomers.However, several fragmentation patterns were detected in thedata, as highlighted by the arrows in Fig. 4: the light greenarrow connects peaks with a mass difference of 14.016 Da(corresponding to a CH2 group), and the dark blue arrowconnects peaks with a mass difference of 18.011 Da (water).Details on fragmentation patterns can be found in Sect. S4.Fragmentation patterns in the mass spectra indicate that largecompounds like oligomers and/or complex organic mixtureswere present on the filters, as also reported in the literature(Docherty et al., 2005; Gao et al., 2004; Cappa et al., 2008;Kristensen et al., 2016), but that these compounds decom-pose during desorption or in the PTR-MS during ionisationbefore they can be detected as smaller ions. While the arrowsin Fig. 4 indicate the possibility that the peaks, separated bya water or CH2 mass, are from the same molecule, this con-stitutes only circumstantial evidence and not proof.
3.2.3 O : C ratio
Figure 5 shows the measured O : C ratio versus desorptiontemperature for selected filters. The O : C ratio of desorbedmaterial increases from 0.18 to 0.25 when the desorptiontemperature increases from 150 to 250 ◦C. At higher desorp-
Figure 4. Mass spectrum of SOA from the dark ozonolysis of α-pinene (using cyclohexane as OH scavenger) desorbed from filterC1f at 150 ◦C. The presence of lobes with specific periodicity isapparent. The arrows highlight two detected fragmentation patternsthat cause the periodicity: that of a CH2 group (light green arrow)and that of water (dark blue arrow); see Sect. S4.
tion temperatures the O : C ratio levels off and remains con-stant at ca. 0.25. The O : C ratios of material desorbing fromthe back filters are similar to those of the front filters withaverages of 0.21 (B1b) and 0.22 (C1b); see Table 2.
The observed increase in the O : C ratio at increasing des-orption temperatures (below 250 ◦C) is to be expected iffunctionalisation yields oxygenated compounds with low-ered volatility (Jimenez et al., 2009; Holzinger et al., 2010b).For material desorbing at temperatures above 250 ◦C, thiscorrelation seems to break down and oligomerisation is likelyto be more important. Oligomerisation reactions can be ac-companied by the exclusion of water (Tolocka et al., 2004)that goes undetected in the PTR-MS, lowering O : C ratios.The desorption temperature of formed oligomers and com-plex mixtures is also higher than the desorption temperatureof their single constituents (Cappa et al., 2008). Thereforeoligomerisation can decrease the volatility of compoundswithout raising the O : C ratios, resulting in the observedplateau of O : C ratios at high desorption temperatures.
Literature values for O : C ratios of SOA from α-pineneozonolysis are generally somewhat higher than the values re-ported here: Shilling et al. (2008) investigated SOA from α-pinene ozonolysis and reported O : C ratios around 0.33 foraerosol loadings, which are comparable to this study. Aikenet al. (2008) report O : C ratios around 0.3 for laboratory SOAfrom α-pinene ozonolysis and observe more oxidised aerosolin ambient samples. These two studies (Shilling et al., 2008;Aiken et al., 2008) used aerosol mass spectrometers to deter-mine the O : C ratio, while Holzinger et al. (2010a) employeda PTR-MS, as in the present study. They report a measuredO : C ratio of 0.33–0.48 for remote ambient aerosol in theAustrian Alps.
PTR-MS measurements may underestimate O : C ratiosbecause of several factors, including charring and fragmenta-tion due to ionisation; see Sect. S4. Holzinger et al. (2010a)assessed in detail how oxygen loss – common in PTR-MSmeasurements – lowers O : C ratios. However, this was nottaken into account for data reported here.
www.atmos-chem-phys.net/17/6373/2017/ Atmos. Chem. Phys., 17, 6373–6391, 2017

6384 C. Meusinger et al.: Isotopic and chemical composition of α-pinene SOA
0.28
0.26
0.24
0.22
0.20
0.18
0.16
O :
C r
atio
350300250200150100
Desorption Temperature / ˚C
B1f B2f C1f C2f
Figure 5. Measured oxygen-to-carbon ratios (O : C) of α-pineneSOA desorbing from filters at different temperatures.
3.3 Isotopic composition
3.3.1 Total carbon and thermally desorbed material
Figure 6, panel (a), shows the isotopic composition of totalcarbon on the filters relative to the isotopic composition ofthe precursor α-pinene. The aerosol on all front filters is en-riched in carbon 13 relative to the initial α-pinene, and theenrichment is larger for filter B1f (1.2 ‰) than for filters C1f(0.6 ‰) and C2f (0.7 ‰). Compounds desorbing from backfilter C2b, which very likely represent gas-phase material, aredepleted by 0.8 ‰.
Figure 6b shows 1(13C
)of thermally desorbed filter ma-
terial as a function of desorption temperature. Aerosol onthe front filters shows a 13C enrichment of 0.2–2.8 ‰ rela-tive to the initial compound. The most volatile fraction thatdesorbed at 100 ◦C consistently shows the highest enrich-ment. SOA compounds desorbing at 100 ◦C are enriched in13C compared to 150 ◦C by about 0.7 to 1.9 ‰; see Table 2.The 1
(13C)
values of SOA do not change significantly withtemperature at desorption temperatures above 150 ◦C. SOAformed in the presence of 1-butanol (filter B1f) is enrichedby an additional 0.2–1.3 ‰ compared to SOA formed in thepresence of cyclohexane (filters C1f and C2f). The higherenrichment observed for SOA formed in the presence of 1-butanol scavenger relative to cyclohexane scavenger may bebecause the latter has a higher SOA yield. This is corrobo-rated by the PTRMS data; see Table 2. The gas-phase com-pounds desorbing at 150 ◦C from back filter B1b are depletedby 0.7 ‰ compared to the initial α-pinene and depleted by1.9 ‰ with respect to the particulate SOA on filter B1f. Thisis expected due to isotopic mass balance. The isotopic en-richment of gas-phase compounds on filter B1b at 100 and350 ◦C is similar to that of the corresponding particulate mat-ter on front filter B1f. The low concentrations detected onthe back filters at these desorption temperatures preclude anyin-depth discussion of the enrichment seen at those tempera-tures.
4
3
2
1
0
-1
Δ(
13C) /‰
400350300250200150100Desorption temperature /˚C
B1f B1b C1f C2f
4
3
2
1
0
-1
ΔT
C(13
C)
/‰
B1f
C1f
C2bC2f
(a) (b)
Figure 6. 1(
13C)
values of alpha-pinene SOA filter samples. Fulllines represent front filters, and dashed lines back filters. Error barsdenote 1-σ standard deviations and are propagated; they vary withloading. (a) TC analysis of selected filters (see x axis). (b) Thermaldesorption analysis of filter material.
Values of 1TC(13C
)are close to 1
(13C)
values at 150 ◦C(Fig. 6 and Table 2). Values of 1TC
(13C)
represent a convo-lution of the volume-normalised peak area and 1
(13C), with
a dominant contribution of 1(13C
)at 150 ◦C. Total carbon
analysis, however, misses details like the enrichment of themost volatile mass fraction desorbing at 100 ◦C.
3.3.2 Position-specific isotope analysis of α-pinene
Table 1 lists 1i(13C
)for each C atom of all analysed α-
pinene samples. Single sites show variations between −6.9and 10.5‰. The α-pinene samples from manufacturersSigma-Aldrich (different lot from SOA experiments), AcrosOrganics, and Merck have similar position-specific isotopeprofiles. It is likely that these three manufacturers sell α-pinene with the same origin (e.g. natural) and use similarpreparation techniques. The last sample (from Alfa Aesar)has a slightly different profile which would seem to indi-cate a different origin and/or purification method. Samplesof α-pinene from Acros Organics (j = 3) and Merck (j = 4)have similar1i
(13C)
profiles but differ by 1.1 ‰ in their bulkvalue.
Unfortunately, PSIA could not be performed on the α-pinene used in chamber experiments (it was used up and isno longer available from the manufacturer). The α-pineneused in chamber experiments has a bulk isotopic compo-sition of δ◦1TC
(13C)= (−29.96± 0.08)‰, which differs by
up to 3 ‰ from the other α-pinene samples; see Table 1.Given that the bulk isotopic composition is not correlatedwith the position-specific isotope profiles, and assuming thatthe manufacturer did not change product origin or purifica-tion method, it is probable that the two α-pinene samplesfrom Sigma-Aldrich share similar position-specific isotopeprofiles. It is therefore assumed for the remainder of the dis-cussion that the α-pinene used for the SOA experiments hasthe same position-specific isotope profile as the batch from
Atmos. Chem. Phys., 17, 6373–6391, 2017 www.atmos-chem-phys.net/17/6373/2017/
C. Meusinger et al.: Isotopic and chemical composition of α-pinene SOA 6385
Table 5. Calculated 1(
13C)
values, assuming that fragmentationyields certain C atoms to be expelled to the gas phase and oth-ers to partition to the aerosol phase (details in Sect. 4.1). Calcula-tions based on position-specific measurement results of the Sigma-Aldrich sample in Table 1. See Fig. 7 for numbering of C atoms.
Expelled C atom(s) 1gas(
13C)(‰) 1aerosol
(13C
)/(‰)
C1 4.9 −0.4C2 10.5 −1.1C7 0.6 0.0C9 −6.7 0.8C8 + C1 + C9 −0.7 0.4C10 + C1 + C9 −2.0 1.0
Sigma-Aldrich on which PSIA was performed. The 1i(13C
)distribution of that sample is visualised in Fig. 7.
4 Discussion
In this experiment we have run α-pinene ozonolysis to com-pletion and analysed the SOA and some of the gas-phase ma-terial. After comparing the IR-MS (Fig. 6) analysis with thePTRMS data (Fig. 5), we found that 1
(13C)
does not showa correlation with the O : C ratio. The PTRMS data showedthat the isotopic enrichment in the SOA is carried by a broadrange of oxidation products rather than one or a few domi-nant products. We argue that the observed isotopic abundan-cies are largely due to a combination of isotope-dependentchanges in product branching ratios and unequal partition-ing of carbon atoms from specific sites in α-pinene intothe aerosol and gas phases. Additional effects could includeisotope-dependent variations in partitioning of semi-volatilecompounds between the gas and condensed phases.
4.1 Can position-specific isotope analysis of α-pineneexplain the enriched aerosol phase?
Here, a limiting case is presented for the isotopic differ-ence of a number of plausible oxidation products. The un-derlying assumptions exclude isotope-dependent changes inproduct branching ratios, as well as effects of temperature,relative humidity, pressure, ozone concentration, etc. Thissimplistic approach allows for the estimation of the maxi-mum isotopic enrichment in α-pinene fragments using the1i(13C
)profiles obtained from PSIA. Table 5 shows pre-
dicted maximal enrichments or depletions if a single carbonatom or reasonable combinations of three carbon atoms aresplit off the parent compound. Based on the chemical reac-tion pathways presented in Fig. 1, volatile reaction productssuch as acetone, CO, and formaldehyde can reasonably beassigned to specific sites in the parent α-pinene. The mi-nor (potentially gaseous) expelled fragment is predicted tohave an overall isotopic difference relative to the initial α-
Figure 7. Heat map of 1i(
13C)
in α-pinene (Sigma-Aldrich, lotMKBQ6213V) relative to its bulk isotopic composition; see Ta-ble 1. The boundary of the image was set to 1i
(13C
)= 0, i.e. the
bulk isotopic composition. A large enrichment is visible at the dou-ble bond (C2), and large depletions are visible at positions C5 andC9 where isotopic substitution is expected to reduce the molar vol-ume significantly. C atoms are numbered in order of decreasing 13Cchemical shifts in the 13C NMR spectrum.
pinene, 1gas(13C
), similar to the measured 1i
(13C)
valuefor the carbon atom’s former position, as seen in Fig. 7.The larger fragment, which would partition to the aerosolphase, is predicted to have an overall 1aerosol
(13C)
valueequal to the average of the 1i
(13C)
values of the remainingC atoms. For example, the pathway leading to formaldehydein the sixth box in Fig. 1 is predicted to deplete formalde-hyde by 19
(13C)= 6.7‰ relative to the initial compound
and leave the corresponding major fragment (denoted as “R”in Fig. 1) enriched by
[1i(13C
)]av(i=1−8,10) = 0.8‰. Here,
[. . .]av(i=1−8,10) denotes the mean of 1i(13C
)values for C
atoms 1–8 and 10. Expelled C atoms from positions withsmall 1i
(13C)
values, e.g. C7, will only have a small im-pact on the isotopic composition of the remaining fragment.For expulsion of C2, a depletion of −1.1 ‰ is predicted forthe aerosol fragment relative to the initial α-pinene.
If three carbon atoms are expelled, as in the case of ace-tone, the enrichment of the minor fragment relative to theinitial α-pinene is calculated as the average of the 1i
(13C)
values of the respective expelled positions C8, C1, C9 or C10,C1, and C9; see Fig. 1. The formation of acetone may involvemethyl migration of either the C8 or C10 atom. The gaseousfragments composed of three carbon atoms are predicted toshow 1gas
(13C)
values of −0.7 and −2.0‰, and the corre-sponding1aerosol
(13C)
values for the larger fragment are 0.4and 1.0‰; see Table 5. These calculations are based on themeasured position-specific enrichment for sample 2 in Ta-ble 1, but the results and conclusions drawn do not changesignificantly when performing similar calculations for theother α-pinene samples where PSIA data are available (withthe exception of the anomalous Alfa Aesar sample).
www.atmos-chem-phys.net/17/6373/2017/ Atmos. Chem. Phys., 17, 6373–6391, 2017
6386 C. Meusinger et al.: Isotopic and chemical composition of α-pinene SOA
4.2 Branching ratios and other isotope effects
The observed 13C enrichment in compounds from the frontfilters (SOA) and the depletion in compounds from the backfilters (gas phase) are generally larger or equal in magnitudeto those predicted by position-specific isotope effect analysis(see Table 5). The data shown in Table 5 are limiting val-ues and show that PSIA is capable, in principle, of producingabundances of similar magnitude to what was observed inour experiment. This mechanism does not include concomi-tant enrichment due to isotope effects on product branchingratios.
The other explanations include isotope-dependent changesin branching ratios in the reaction mechanism (Fig. 1) and in-complete reactions. It has been shown previously in simplesystems (e.g. evaporation of solvents and sorption of vanillin)that each carbon position can have its own isotopic fraction-ation and that different positions can show opposing isotopeeffects at the same time (Höhener et al., 2012; Julien et al.,2015). In chemical reactions, the substitution of a 12C atomby 13C will affect isomerisation and stabilisation dynam-ics by changing vibrational frequencies with an associatedchange in zero point energies. Therefore, positions that arenot reaction sites can also show isotope effects, which havebeen termed non-covalent isotope effects (Wade, 1999), ashas been observed during the chain-shortening reaction forthe bioconversion of ferulic acid to vanillin (Botosoa et al.,2009b). It is generally difficult to predict which position haswhich isotope effect, but it has been shown that isotopic sub-stitution in ring structures at positions that carry functionalgroups lead to stronger position-specific isotope effects com-pared to positions that have no functional groups attached(Höhener et al., 2012; Botosoa et al., 2009b). Similarly, theC atoms in α-pinene that are not part of the ring structuremight have large position-specific isotope effects. Höheneret al. (2012) note that, for vanillin, such effects can producelarge fractionations in the small fragments and small frac-tionations in the large fragments, similar to what we showin Table 5. Accordingly, in α-pinene there is about an orderof magnitude difference between the site-dependent enrich-ments seen in the C10 molecule (6–10‰) and the enrich-ments seen in the SOA (0.6–1.2 ‰).
Kinetic isotope effects associated with fragmentation pro-vide a possible explanation for the enrichment of the particlephase with respect to the gas phase. After the first two reac-tion steps (i.e. formation of the Criegee intermediate and thesubsequent decomposition, stabilisation, or isomerisation ofit; see Fig. 1) the products will be distributed between the gasand particle phases according to their respective partition-ing coefficients. This partitioning is not expected to lead tosignificant isotopic fractionation within a chemical species.A number of these products are small volatile compoundsthat partition to the gas phase. The remaining particle phasewould be enriched, which is consistent with observations re-ported previously (Aggarwal and Kawamura, 2008; Kirillova
et al., 2013, 2014). Fragmentation followed by functionalisa-tion is expected to be accompanied by elevated O : C ratios inboth products, as detailed in the introduction. This is in linewith the observed increasing O : C ratios of desorbed mate-rial from front filters at increasing desorption temperaturesbelow 250 ◦C (Fig. 5), and with O : C ratios that are generallyelevated for back filter material desorbing at all temperatures(Table 2).
Large equilibrium fractionation due to gas-particle parti-tioning could also explain the observations, given that indi-vidual compounds might show isotope effects of 1–2 ‰ dueto partial volatilisation. In an ensemble of compounds, how-ever, most individual compounds are likely to be found pre-dominantly in one phase; only a fraction of products haveintermediate volatilities. In the case of α-pinene ozonoly-sis shown in Fig. 1, small first generation products like CO,HCHO, and acetone will be gaseous and the larger entities,including prominent acids, will partition to particles due totheir lower vapour pressure. Ongoing reactions (e.g. dimerformation and oligomerisation) will lower their vapour pres-sure even further. Equilibrium isotope effects of single com-pounds are therefore diluted and hence less likely to causethe observed isotopic enrichment in SOA.
The present study allows new insight to be gained into ob-servations of isotopically enriched ambient SOA. In somecases isotopic enrichment in ambient aerosol was attributedto photochemical ageing during long-range transport (Kir-illova et al., 2013; Pavuluri et al., 2011). However, Fu et al.(2012) note that a normal kinetic isotope effect cannot ex-plain their observation of aerosol that was even more en-riched than aerosol from biomass burning. The authors notedthat such aerosol occurred predominantly during the dayduring episodes of high abundance of biogenic SOA. Thepresent study suggests that the site-specific distribution of13C in the source material itself governs the abundance of13C in SOA.
5 Conclusions
The isotopic and chemical compositions of SOA generatedfrom dark ozonolysis of α-pinene were determined using iso-tope ratio mass spectrometry and thermal-desorption PTR-MS, and PSIA was applied for the first time on α-pinenefrom a series of manufacturers. A key result is the first obser-vations of strong site-dependent enrichments and depletionsin 13C in α-pinene, with values between −6.9 and +10.5‰relative to the bulk composition. Total carbon from SOAcollected on front filters was enriched in 13C by 0.6–1.2 ‰with respect to the initial α-pinene precursor. Total carbonadsorbed on the back filters, designed to sample gas-phasecompounds, was depleted by −0.8‰.
High-resolution data retrieved by a PTR-MS detectedmore than 400 ions. More than 90 % of the total desorbedmass as measured by PTR-MS (from front filters) was un-
Atmos. Chem. Phys., 17, 6373–6391, 2017 www.atmos-chem-phys.net/17/6373/2017/

C. Meusinger et al.: Isotopic and chemical composition of α-pinene SOA 6387
ambiguously identified and discussed in the context of thecurrent literature. SOA mainly desorbed from the filters at150 ◦C, and larger compounds likely formed in oligomeri-sation reactions decomposed during extraction or ionisa-tion. Besides the fragments from such oligomers, single con-stituents of complex organic mixtures formed on the filterwere also detected as single ions of lower mass which showsignificant non-zero concentrations at desorption tempera-tures higher than 150 ◦C. The observed constant O : C ratioat desorption temperatures exceeding 250 ◦C also indicatesfragments of larger molecules. At lower temperatures theO : C ratio increases from 0.18 to 0.25, indicating function-alisation reactions during SOA formation. A comparison ofthe IR-MS results with the PTRMS data shows that 1
(13C)
does not correlate with the O : C ratio.Analysis of the isotopic composition as a function of des-
orption temperature showed that the isotopic composition ofmaterial desorbing at 150 ◦C was similar to the isotopic com-position of total carbon. Functionalisation typically followsfragmentation in monoterpene ozonolysis and was shown todrive the O : C temperature profiles. The partitioning of prod-ucts between the gas and condensed phases is an active areaof research, and both chemical and physical effects mustbe considered. The partitioning is not simply governed byvapour pressure; some gas-phase products may be incorpo-rated into SOA through oligomerisation. Many variables, in-cluding product branching ratios, temperature, pressure, hu-midity, OH, NOx , etc., can in principle have an effect onthe isotopic abundance of 13C in SOA and this leaves roomfor further studies. The present study suggests that the site-specific distribution of 13C in the source material itself gov-erns the abundance of 13C in SOA.
Data availability. The archive is publicly available at:http://www.erda.dk/public/archives/YXJjaGl2ZS16OVF4em0=/published-archive.html (Johnson, 2017).
The Supplement related to this article is available onlineat doi:10.5194/acp-17-6373-2017-supplement.
Competing interests. The authors declare that they have no conflictof interest.
Acknowledgements. The authors thank IntraMIF and the Uni-versity of Copenhagen for supporting this research. The researchhas received funding from the European Commission’s SeventhFramework Programme (FP7/2007–2013) under grant agreementnumber 237890. The thermogram 13C analysis was funded by theNetherlands Organisation for Scientific Research (NWO), grantnumber 820.01.001.
Edited by: M. C. FacchiniReviewed by: three anonymous referees
References
Aggarwal, S. G. and Kawamura, K.: Molecular distributionsand stable carbon isotopic compositions of dicarboxylic acidsand related compounds in aerosols from Sapporo, Japan: Im-plications for photochemical aging during long-range atmo-spheric transport, J. Geophys. Res. Atmos., 113, D14301,doi:10.1029/2007JD009365, 2008.
Aiken, A. C., DeCarlo, P. F., Kroll, J. H., Worsnop, D. R., Huff-man, J. A., Docherty, K. S., Ulbrich, I. M., Mohr, C., Kimmel,J. R., Sueper, D., Sun, Y., Zhang, Q., Trimborn, A., Northway,M., Ziemann, P. J., Canagaratna, M. R., Onasch, T. B., Alfarra,M. R., Prevot, A. S. H., Dommen, J., Duplissy, J., Metzger, A.,Baltensperger, U., and Jimenez, J. L.: O/C and OM/OC Ratios ofPrimary, Secondary, and Ambient Organic Aerosols with High-Resolution Time-of-Flight Aerosol Mass Spectrometry, Environ.Sci. Technol., 42, 4478–4485, doi:10.1021/es703009q, 2008.
Andreae, M. O. and Crutzen, P. J.: Atmospheric Aerosols: Biogeo-chemical Sources and Role in Atmospheric Chemistry, Science,276, 1052–1058, doi:10.1126/science.276.5315.1052, 1997.
Bayle, K., Akoka, S., Remaud, G. S., and Robins, R. J.: Non-Statistical 13C Distribution during Carbon Transfer from Glu-cose to Ethanol During Fermentation is Determined by theCatabolic Pathway Exploited, J. Biol. Chem., 290, 4118–4128,doi:10.1074/jbc.M114.621441, 2014a.
Bayle, K., Gilbert, A., Julien, M., Yamada, K., Silvestre, V., Robins,R. J., Akoka, S., Yoshida, N., and Remaud, G. S.: Conditionsto obtain precise and true measurements of the intramolecular13C distribution in organic molecules by isotopic 13C nuclearmagnetic resonance spectrometry, Anal. Chim. Acta., 846, 1–7,doi:10.1016/j.aca.2014.07.018, 2014b.
Botosoa, E. P., Caytan, E., Silvestre, V., Robins, R. J., Akoka, S.,and Remaud, G. S.: Unexpected Fractionation in Site-Specific13C Isotopic Distribution Detected by Quantitative 13C NMRat Natural Abundance, J. Am. Chem. Soc., 130, 414–415,doi:10.1021/ja0771181, 2008.
Botosoa, E. P., Blumenstein, C., MacKenzie, D. A., Silvestre, V.,Remaud, G. S., Kwiecien, R. A., and Robins, R. J.: Quantitativeisotopic 13C nuclear magnetic resonance at natural abundanceto probe enzyme reaction mechanisms via site-specific isotopefractionation: The case of the chain-shortening reaction for thebioconversion of ferulic acid to vanillin, Anal. Biochem., 393,182–188, doi:10.1016/j.ab.2009.06.031, 2009a.
Botosoa, E. P., Silvestre, V., Robins, R. J., Rojas, J. M. M., Guil-lou, C., and Remaud, G. S.: Evidence of 13C non-covalent iso-tope effects obtained by quantitative 13C nuclear magnetic reso-nance spectroscopy at natural abundance during normal phaseliquid chromatography, J. Chromatogr. A, 1216, 7043–7048,doi:10.1016/j.chroma.2009.08.066, 2009b.
Brooks, P. D., Geilmann, H., Werner, R. A., and Brand, W. A.: Im-proved precision of coupled d13C and d15N measurements fromsingle samples using an elemental analyzer/isotope ratio massspectrometer combination with a post-column six-port valve andselective CO2 trapping; improved halide robustness of the com-
www.atmos-chem-phys.net/17/6373/2017/ Atmos. Chem. Phys., 17, 6373–6391, 2017
6388 C. Meusinger et al.: Isotopic and chemical composition of α-pinene SOA
bustion reactor using CeO2, Rapid Commun. Mass Sp., 17,1924–1926, doi:10.1002/rcm.1134, 2003.
Camredon, M., Hamilton, J. F., Alam, M. S., Wyche, K. P., Carr, T.,White, I. R., Monks, P. S., Rickard, A. R., and Bloss, W. J.: Dis-tribution of gaseous and particulate organic composition duringdark a-pinene ozonolysis, Atmos. Chem. Phys., 10, 2893–2917,doi:10.5194/acp-10-2893-2010, 2010.
Cappa, C. D., Lovejoy, E. R., and Ravishankara, A. R.: Evidencefor liquid-like and nonideal behavior of a mixture of organicaerosol components, P. Natl. Acad. Sci. USA, 105, 18687–18691, doi:10.1073/pnas.0802144105, 2008.
Ceburnis, D., Garbaras, A., Szidat, S., Rinaldi, M., Fahrni, S., Per-ron, N., Wacker, L., Leinert, S., Remeikis, V., Facchini, M. C.,Prevot, A. S. H., Jennings, S. G., Ramonet, M., and O’Dowd,C. D.: Quantification of the carbonaceous matter origin in sub-micron marine aerosol by 13C and 14C isotope analysis, At-mos. Chem. Phys., 11, 8593–8606, doi:10.5194/acp-11-8593-2011, 2011.
Chacon-Madrid, H. J. and Donahue, N. M.: Fragmentation vs.functionalization: chemical aging and organic aerosol forma-tion, Atmos. Chem. Phys., 11, 10553–10563, doi:10.5194/acp-11-10553-2011, 2011.
Cheng, Y. and He, K.: Uncertainties in observational dataon organic aerosol: An annual perspective of sampling ar-tifacts in Beijing, China, Environ. Pollut., 206, 113–121,doi:10.1016/j.envpol.2015.06.012, 2015.
Coplen, T. B.: Guidelines and recommended terms for expressionof stable-isotope-ratio and gas-ratio measurement results, RapidCommun. Mass Sp., 25, 2538–2560, doi:10.1002/rcm.5129,2011.
Coplen, T. B., Brand, W. A., Gehre, M., Gröning, M., Meijer,H. A. J., Toman, B., and Verkouteren, R. M.: New Guide-lines for d13C Measurements, Anal. Chem., 78, 2439–2441,doi:10.1021/ac052027c, 2006.
Docherty, K. S. and Ziemann, P. J.: Effects of Stabilized CriegeeIntermediate and OH Radical Scavengers on Aerosol Formationfrom Reactions of beta-Pinene with O3, Aerosol Sci. Tech., 37,877–891, doi:10.1080/02786820300930, 2003.
Docherty, K. S., Wu, W., Lim, Y. B., and Ziemann, P. J.: Contribu-tions of Organic Peroxides to Secondary Aerosol Formed fromReactions of Monoterpenes with O3, Environ. Sci. Technol., 39,4049–4059, doi:10.1021/es050228s, 2005.
Dockery, D. W., Pope, C. A., Xu, X., Spengler, J. D., Ware, J. H.,Fay, M. E., Ferris, B. G., and Speizer, F. E.: An Association be-tween Air Pollution and Mortality in Six U.S. Cities, New Engl.J. Med., 329, 1753–1759, doi:10.1056/NEJM199312093292401,1993.
Donahue, N. M., Robinson, A. L., Stanier, C. O., and Pandis,S. N.: Coupled Partitioning, Dilution, and Chemical Aging ofSemivolatile Organics, Environ. Sci. Technol., 40, 2635–2643,doi:10.1021/es052297c, 2006.
Donahue, N. M., Epstein, S. A., Pandis, S. N., and Robinson, A.L.: A two-dimensional volatility basis set: 1. organic-aerosolmixing thermodynamics, Atmos. Chem. Phys., 11, 3303–3318,doi:10.5194/acp-11-3303-2011, 2011.
Dusek, U., Meusinger, C., Oyama, B., Ramon, W., de Wilde, P.,Holzinger, R., and Röckmann, T.: A thermal desorption systemfor measuring d13C ratios on organic aerosol, J. Aerosol Sci., 66,72–82, doi:10.1016/j.jaerosci.2013.08.005, 2013.
Emanuelsson, E. U., Watne, A. K., Lutz, A., Ljungstrom, E., andHallquist, M.: Influence of Humidity, Temperature, and Radicalson the Formation and Thermal Properties of Secondary OrganicAerosol (SOA) from Ozonolysis of beta-Pinene, J. Phys. Chem.A, 117, 10346–10358, doi:10.1021/jp4010218, 2013.
Emanuelsson, E. U., Mentel, T. F., Watne, A. K., Spindler, C.,Bohn, B., Brauers, T., Dorn, H.-P., Hallquist, A. M., Haseler,R., Kiendler-Scharr, A., Müller, K.-P., Pleijel, H., Rohrer,F., Rubach, F., Schlosser, E., Tillmann, R., and Hallquist,M.: Parameterization of Thermal Properties of Aging Sec-ondary Organic Aerosol Produced by Photo-Oxidation of Se-lected Terpene Mixtures, Environ. Sci. Technol., 48, 6168–6176,doi:10.1021/es405412p, 2014.
Fisseha, R., Saurer, M., Jäggi, M., Siegwolf, R. T. W., Dommen, J.,Szidat, S., Samburova, V., and Baltensperger, U.: Determinationof primary and secondary sources of organic acids and carbona-ceous aerosols using stable carbon isotopes, Atmos. Environ., 43,431–437, doi:10.1016/j.atmosenv.2008.08.041, 2009.
Fu, P. Q., Kawamura, K., Chen, J., Li, J., Sun, Y. L., Liu, Y.,Tachibana, E., Aggarwal, S. G., Okuzawa, K., Tanimoto, H.,Kanaya, Y., and Wang, Z. F.: Diurnal variations of organic molec-ular tracers and stable carbon isotopic composition in atmo-spheric aerosols over Mt. Tai in the North China Plain: an influ-ence of biomass burning, Atmos. Chem. Phys., 12, 8359–8375,doi:10.5194/acp-12-8359-2012, 2012.
Gao, S., Ng, N. L., Keywood, M., Varutbangkul, V., Bahreini, R.,Nenes, A., He, J., Yoo, K. Y., Beauchamp, J. L., Hodyss, R. P.,Flagan, R. C., and Seinfeld, J. H.: Particle Phase Acidity andOligomer Formation in Secondary Organic Aerosol, Environ.Sci. Technol., 38, 6582–6589, doi:10.1021/es049125k, 2004.
Gensch, I., Laumer, W., Stein, O., Kammer, B., Hohaus, T.,Saathoff, H., Wegener, R., Wahner, A., and Kiendler-Scharr,A.: Temperature dependence of the kinetic isotope effectin beta-pinene ozonolysis, J. Geophys. Res., 116, D20301,doi:10.1029/2011JD016084, 2011.
Gilbert, A., Silvestre, V., Segebarth, N., Tcherkez, G., Guillou, C.,Robins, R. J., Akoka, S., and Remaud, G. S.: The intramolec-ular 13C-distribution in ethanol reveals the influence of theCO2-fixation pathway and environmental conditions on the site-specific 13C variation in glucose, Plant Cell Environ., 34, 1104–1112, doi:10.1111/j.1365-3040.2011.02308.x, 2011.
Gilbert, A., Hattori, R., Silvestre, V., Wasano, N., Akoka,S., Hirano, S., Yamada, K., Yoshida, N., and Remaud,G. S.: Comparison of IRMS and NMR spectrometry forthe determination of intramolecular 13C isotope compo-sition: Application to ethanol, Talanta, 99, 1035–1039,doi:10.1016/j.talanta.2012.05.023, 2012.
Hänninen, O. O., Alm, S., Katsouyanni, K., Künzli, N., Maroni, M.,Nieuwenhuijsen, M. J., Saarela, K., Srám, R. J., Zmirou, D., andJantunen, M. J.: The EXPOLIS study: implications for exposureresearch and environmental policy in Europe, J. Expo. Sci. Env.Epid., 14, 440–456, doi:10.1038/sj.jea.7500342, 2004.
Hall, W. A. and Johnston, M. V.: The Thermal-Stability of Oligomers in Alpha-Pinene Secondary Or-ganic Aerosol, Aerosol Sci. Technol., 46, 983–989,.doi:10.1080/02786826.2012.685114, 2012.
Hallquist, M., Wenger, J. C., Baltensperger, U., Rudich, Y., Simp-son, D., Claeys, M., Dommen, J., Donahue, N. M., George,C., Goldstein, A. H., Hamilton, J. F., Herrmann, H., Hoff-
Atmos. Chem. Phys., 17, 6373–6391, 2017 www.atmos-chem-phys.net/17/6373/2017/

C. Meusinger et al.: Isotopic and chemical composition of α-pinene SOA 6389
mann, T., Iinuma, Y., Jang, M., Jenkin, M. E., Jimenez, J. L.,Kiendler-Scharr, A., Maenhaut, W., McFiggans, G., Mentel, Th.F., Monod, A., Prévôt, A. S. H., Seinfeld, J. H., Surratt, J. D.,Szmigielski, R., and Wildt, J.: The formation, properties and im-pact of secondary organic aerosol: current and emerging issues,Atmos. Chem. Phys., 9, 5155–5236, doi:10.5194/acp-9-5155-2009, 2009.
Ho, K. F., Lee, S. C., Cao, J. J., Li, Y. S., Chow, J. C., Watson, J.G., and Fung, K.: Variability of organic and elemental carbon,water soluble organic carbon, and isotopes in Hong Kong, At-mos. Chem. Phys., 6, 4569–4576, doi:10.5194/acp-6-4569-2006,2006.
Holzinger, R.: PTRwid: A new widget tool for processingPTR-TOF-MS data, Atmos. Meas. Tech., 8, 3903–3922,doi:10.5194/amt-8-3903-2015, 2015.
Holzinger, R., Lee, A., Paw, K. T., and Goldstein, U. A. H.: Ob-servations of oxidation products above a forest imply biogenicemissions of very reactive compounds, Atmos. Chem. Phys., 5,67–75, doi:10.5194/acp-5-67-2005, 2005.
Holzinger, R., Kasper-Giebl, A., Staudinger, M., Schauer, G., andRöckmann, T.: Analysis of the chemical composition of or-ganic aerosol at the Mt. Sonnblick observatory using a novelhigh mass resolution thermal-desorption proton-transfer-reactionmass-spectrometer (hr-TD-PTR-MS), Atmos. Chem. Phys., 10,10111–10128, doi:10.5194/acp-10-10111-2010, 2010a.
Holzinger, R., Williams, J., Herrmann, F., Lelieveld, J., Donahue,N. M., and Röckmann, T.: Aerosol analysis using a Thermal-Desorption Proton-Transfer-Reaction Mass Spectrometer (TD-PTR-MS): a new approach to study processing of organicaerosols, Atmos. Chem. Phys., 10, 2257–2267, doi:10.5194/acp-10-2257-2010, 2010b.
Holzinger, R., Goldstein, A. H., Hayes, P. L., Jimenez, J. L., andTimkovsky, J.: Chemical evolution of organic aerosol in Los An-geles during the CalNex 2010 study, Atmos. Chem. Phys., 13,10125–10141, doi:10.5194/acp-13-10125-2013, 2013.
Huang, L., Brook, J., Zhang, W., Li, S., Graham, L., Ernst, D.,Chivulescu, A., and Lu, G.: Stable isotope measurements of car-bon fractions (OC/EC) in airborne particulate: A new dimensionfor source characterization and apportionment, Atmos. Environ.,40, 2690–2705, doi:10.1016/j.atmosenv.2005.11.062, 2006.
Höhener, P., Silvestre, V., Lefrançois, A., Loquet, D., Boto-soa, E. P., Robins, R. J., and Remaud, G. S.: Analyticalmodel for site-specific isotope fractionation in 13C duringsorption: Determination by isotopic 13C NMR spectrometrywith vanillin as model compound, Chemosphere, 87, 445–452,doi:10.1016/j.chemosphere.2011.12.023, 2012.
Iannone, R., Koppmann, R., and Rudolph, J.: Stable carbon ki-netic isotope effects for the production of methacrolein andmethyl vinyl ketone from the gas-phase reactions of isoprenewith ozone and hydroxyl radicals, Atmos. Environ., 44, 4135–4141, doi:10.1016/j.atmosenv.2010.07.046, 2010.
Irei, S., Rudolph, J., Huang, L., Auld, J., and Hastie, D.: Stable car-bon isotope ratio of secondary particulate organic matter formedby photooxidation of toluene in indoor smog chamber, Atmos.Environ., 45, 856–862, doi:10.1016/j.atmosenv.2010.11.021,2011.
Irei, S., Takami, A., Hayashi, M., Sadanaga, Y., Hara, K., Kaneyasu,N., Sato, K., Arakaki, T., Hatakeyama, S., Bandow, H., Hikida,T., and Shimono, A.: Transboundary Secondary Organic Aerosol
in Western Japan Indicated by the δ13C of Water-Soluble OrganicCarbon and the m/z 44 Signal in Organic Aerosol Mass Spectra,Environ. Sci. Technol., 48, 6273–6281, doi:10.1021/es405362y,2014.
Isaacman-VanWertz, G., Yee, L. D., Kreisberg, N. M., Wernis,R., Moss, J. A., Hering, S. V., de Sá, S. S., Martin, Scot T.,Alexander, M. L., Palm, B. B., Hu, W., Campuzano-Jost, P.,Day, D. A., Jimenez, J. L., Riva, M., Surratt, J. D., Viegas, J.,Manzi, A., Edgerton, E., Baumann, K., Souza, R., Artaxo, P.,and Goldstein, A. H.: Ambient gas-particle partitioning of tracersfor biogenic oxidation, Environ. Sci. Technol., 18, 9952–9962,doi:10.1021/acs.est.6b01674, 2016.
Jaoui, M. and Kamens, R. M.: Gaseous and Particulate OxidationProducts Analysis of a Mixture of α-pinene + β-pinene/O3/Airin the Absence of Light and α-pinene + β-pinene/NOx /Air inthe Presence of Natural Sunlight, J. Atmos. Chem., 44, 259–297,doi:10.1023/A:1022977427523, 2003.
Jenkin, M. E.: Modelling the formation and composition of sec-ondary organic aerosol from α- and β-pinene ozonolysis usingMCM v3, Atmos. Chem. Phys., 4, 1741–1757, doi:10.5194/acp-4-1741-2004, 2004.
Jimenez, J. L., Canagaratna, M. R., Donahue, N. M., Prevot, A.S. H., Zhang, Q., Kroll, J. H., DeCarlo, P. F., Allan, J. D., Coe,H., Ng, N. L., Aiken, A. C., Docherty, K. S., Ulbrich, I. M.,Grieshop, A. P., Robinson, A. L., Duplissy, J., Smith, J. D.,Wilson, K. R., Lanz, V. A., Hueglin, C., Sun, Y. L., Tian, J.,Laaksonen, A., Raatikainen, T., Rautiainen, J., Vaattovaara, P.,Ehn, M., Kulmala, M., TomLinson, J. M., Collins, D. R., Cu-bison, M. J., E, Dunlea, J., Huffman, J. A., Onasch, T. B., Al-farra, M. R., Williams, P. I., Bower, K., Kondo, Y., Schneider, J.,Drewnick, F., Borrmann, S., Weimer, S., Demerjian, K., Salcedo,D., Cottrell, L., Griffin, R., Takami, A., Miyoshi, T., Hatakeyama,S., Shimono, A., Sun, J. Y., Zhang, Y. M., Dzepina, K., Kim-mel, J. R., Sueper, D., Jayne, J. T., Herndon, S. C., Trimborn,A. M., Williams, L. R., Wood, E. C., Middlebrook, A. M., Kolb,C. E., Baltensperger, U., and Worsnop, D. R.: Evolution of Or-ganic Aerosols in the Atmosphere, Science, 326, 1525–1529,doi:10.1126/science.1180353, 2009.
Johnson, M. S.: Data files for Meusinger et al. alpha pinene SOA pa-per ACP 2017, available at: http://www.erda.dk/public/archives/YXJjaGl2ZS16OVF4em0=/published-archive.html, 2017.
Johnson, M. S., Feilberg, K. L., von Hessberg, P., and Nielsen, O. J.:Isotopic processes in atmospheric chemistry, Chem. Soc. Rev.,31, 313–323, doi:10.1039/b108011n, 2002.
Julien, M., Parinet, J., Nun, P., Bayle, K., Höhener, P., Robins,R. J., and Remaud, G. S.: Fractionation in position-specific iso-tope composition during vaporization of environmental pollu-tants measured with isotope ratio monitoring by 13C nuclearmagnetic resonance spectrometry, Environ. Pollut., 205, 299–306, doi:10.1016/j.envpol.2015.05.047, 2015.
Kalberer, M., Paulsen, D., Sax, M., Steinbacher, M., Dommen, J.,Prevot, A. S. H., Fisseha, R., Weingartner, E., Frankevich, V.,Zenobi, R., and Baltensperger, U.: Identification of Polymers asMajor Components of Atmospheric Organic Aerosols, Science,303, 1659–1662, doi:10.1126/science.1092185, 2004.
Kalberer, M., Sax, M., and Samburova, V.: Molecular Size Evolu-tion of Oligomers in Organic Aerosols Collected in Urban Atmo-spheres and Generated in a Smog Chamber, Environ. Sci. Tech-nol., 40, 5917–5922, doi:10.1021/es0525760, 2006.
www.atmos-chem-phys.net/17/6373/2017/ Atmos. Chem. Phys., 17, 6373–6391, 2017

6390 C. Meusinger et al.: Isotopic and chemical composition of α-pinene SOA
Keywood, M. D., Kroll, J. H., Varutbangkul, V., Bahreini, R., Fla-gan, R. C., and Seinfeld, J. H.: Secondary Organic Aerosol For-mation from Cyclohexene Ozonolysis: Effect of OH Scavengerand the Role of Radical Chemistry, Environ. Sci. Technol., 38,3343–3350, doi:10.1021/es049725j, 2004.
King, S. M., Rosenoern, T., Shilling, J. E., Chen, Q., and Martin,S. T.: Increased cloud activation potential of secondary organicaerosol for atmospheric mass loadings, Atmos. Chem. Phys., 9,2959–2971, doi:10.5194/acp-9-2959-2009, 2009.
King, S. M., Butcher, A. C., Rosenørn, T., Coz, E., Lieke, K. I.,de Leeuw, G., Nilsson, E. D., and Bilde, M.: Investigating Pri-mary Marine Aerosol Properties: CCN Activity of Sea Salt andMixed Inorganic–Organic Particles, Environ. Sci. Technol., 46,10 405–10 412, doi:10.1021/es300574u, 2012.
Kirillova, E. N., Andersson, A., Sheesley, R. J., Kruså, M., Praveen,P. S., Budhavant, K., Safai, P. D., Rao, P. S. P., and Gustafs-son, O.: 13C- and 14C-based study of sources and atmo-spheric processing of water-soluble organic carbon (WSOC) inSouth Asian aerosols, J. Geophys. Res.-Atmos., 118, 614–626,doi:10.1002/jgrd.50130, 2013.
Kirillova, E. N., Andersson, A., Han, J., Lee, M., and Gustafsson,Ö.: Sources and light absorption of water-soluble organic car-bon aerosols in the outflow from northern China, Atmos. Chem.Phys., 14, 1413–1422, doi:10.5194/acp-14-1413-2014, 2014.
Kleindienst, T., Smith, D., Li, W., Edney, E., Driscoll, D., Speer, R.,and Weathers, W.: Secondary organic aerosol formation from theoxidation of aromatic hydrocarbons in the presence of dry sub-micron ammonium sulfate aerosol, Atmos. Environ., 33, 3669–3681, doi:10.1016/S1352-2310(99)00121-1, 1999.
Kristensen, K., Watne, Å. K., Hammes, J., Lutz, A., Petäjä, T., Hal-lquist, M., Bilde, M., and Glasius, M.: High-Molecular WeightDimer Esters Are Major Products in Aerosols from α-PineneOzonolysis and the Boreal Forest, Environ. Sci. Technol. Lett.,3, 280–285, doi:10.1021/acs.estlett.6b00152, 2016.
Kroll, J. H. and Seinfeld, J. H.: Chemistry of secondary or-ganic aerosol: Formation and evolution of low-volatility or-ganics in the atmosphere, Atmos. Environ., 42, 3593–3624,doi:10.1016/j.atmosenv.2008.01.003, 2008.
Kroll, J. H., Smith, J. D., Che, D. L., Kessler, S. H., Worsnop, D. R.,and Wilson, K. R.: Measurement of fragmentation and func-tionalization pathways in the heterogeneous oxidation of oxi-dized organic aerosol, Phys. Chem. Chem. Phys., 11, 8005–8014,doi:10.1039/B905289E, 2009.
Kroll, J. H., Donahue, N. M., Jimenez, J. L., Kessler, S. H., Cana-garatna, M. R., Wilson, K. R., Altieri, K. E., Mazzoleni, L. R.,Wozniak, A. S., Bluhm, H., Mysak, E. R., Smith, J. D., Kolb,C. E., and Worsnop, D. R.: Carbon oxidation state as a metricfor describing the chemistry of atmospheric organic aerosol, Nat.Chem., 3, 133–139, doi:10.1038/nchem.948, 2011.
Lopez-Hilfiker, F. D., Mohr, C., D’Ambro, E. L., Lutz, A., Riedel,T. P., Gaston, C. J., Iyer, S., Zhang, Z., Gold, A., Surratt, J.D., Lee, B. H., Kurten, T., Hu, W. W., Jimenez, J., Hallquist,M., and Thornton, J. A.: Molecular Composition and Volatil-ity of Organic Aerosol in the Southeastern U.S.: Implicationsfor IEPOX Derived SOA, Environ. Sci. Technol., 5, 2200–2209,doi:10.1021/acs.est.5b04769, 2016.
Masalaite, A., Remeikis, V., Garbaras, A., Dudoitis, V., Ule-vicius, V., and Ceburnis, D.: Elucidating carbonaceousaerosol sources by the stable carbon d13CTC ratio in
size-segregated particles, Atmos. Res., 158–159, 1–12,doi:10.1016/j.atmosres.2015.01.014, 2015.
Miyazaki, Y., Fu, P. Q., Kawamura, K., Mizoguchi, Y., and Ya-manoi, K.: Seasonal variations of stable carbon isotopic com-position and biogenic tracer compounds of water-soluble organicaerosols in a deciduous forest, Atmos. Chem. Phys., 12, 1367–1376, doi:10.5194/acp-12-1367-2012, 2012.
Narukawa, M., Kawamura, K., Li, S.-M., and Bottenheim,J. W.: Stable carbon isotopic ratios and ionic composition ofthe high-Arctic aerosols: An increase in d13C values fromwinter to spring, J. Geophys. Res.-Atmos., 113, D02312,doi:10.1029/2007JD008755, 2008.
O’Dowd, C., Ceburnis, D., Ovadnevaite, J., Vaishya, A., Ri-naldi, M., and Facchini, M. C.: Do anthropogenic, continentalor coastal aerosol sources impact on a marine aerosol signa-ture at Mace Head?, Atmos. Chem. Phys., 14, 10687–10704,doi:10.5194/acp-14-10687-2014, 2014.
Pavuluri, C. M., Kawamura, K., Swaminathan, T., and Tachibana,E.: Stable carbon isotopic compositions of total carbon, di-carboxylic acids and glyoxylic acid in the tropical Indianaerosols: Implications for sources and photochemical process-ing of organic aerosols, J. Geophys. Res.-Atmos., 116, D18307,doi:10.1029/2011JD015617, 2011.
Presto, A. A. and Donahue, N. M.: Investigation of alpha-Pinene+ Ozone Secondary Organic Aerosol Formation at Low To-tal Aerosol Mass, Environ. Sci. Technol., 40, 3536–3543,doi:10.1021/es052203z, 2006.
Rudich, Y., Donahue, N. M., and Mentel, T. F.: Aging ofOrganic Aerosol: Bridging the Gap Between Laboratoryand Field Studies, Annu. Rev. Phys. Chem., 58, 321–352,doi:10.1146/annurev.physchem.58.032806.104432, 2007.
Rudolph, J. and Czuba, E.: On the use of isotopic composition mea-surements of volatile organic compounds to determine the “pho-tochemical age” of an air mass, Geophys. Res. Lett., 27, 3865–3868, doi:10.1029/2000GL011385, 2000.
Rudolph, J., Czuba, E., and Huang, L.: The stable carbon isotopefractionation for reactions of selected hydrocarbons with OH-radicals and its relevance for atmospheric chemistry, J. Geophys.Res., 105, 29329–29346, 2000.
Sakugawa, H. and Kaplan, I. R.: Stable carbon isotope measure-ments of atmospheric organic acids in Los Angeles, California,Geophys. Res. Lett., 22, 1509–1512, doi:10.1029/95GL01359,1995.
Shilling, J. E., Chen, Q., King, S. M., Rosenoern, T., Kroll, J. H.,Worsnop, D. R., McKinney, K. A., and Martin, S. T.: Particlemass yield in secondary organic aerosol formed by the darkozonolysis of α-pinene, Atmos. Chem. Phys., 8, 2073–2088,doi:10.5194/acp-8-2073-2008, 2008.
Silvestre, V., Mboula, V. M., Jouitteau, C., Akoka, S., Robins, R. J.,and Remaud, G. S.: Isotopic 13C NMR spectrometry to assesscounterfeiting of active pharmaceutical ingredients: Site-specific13C content of aspirin and paracetamol, J. Pharmaceut. Biomed.,50, 336–341, doi:10.1016/j.jpba.2009.04.030, 2009.
Stocker, T. F., Qin, D., Plattner, G.-K., Tignor, M., Allen, S. K.,Boschung, J., Nauels, A., Xia, Y., Bex, V., and Midgley, P. (Eds.):IPCC, 2013: Climate Change 2013: The Physical Science Basis.Contribution of Working Group I to the Fifth Assessment Reportof the Intergovernmental Panel on Climate Change, Cambridge
Atmos. Chem. Phys., 17, 6373–6391, 2017 www.atmos-chem-phys.net/17/6373/2017/
C. Meusinger et al.: Isotopic and chemical composition of α-pinene SOA 6391
University Press, Cambridge, United Kingdom and New York,NY, USA, 2013.
Subramanian, R., Khlystov, A. Y., Cabada, J. C., and Robin-son, A. L.: Positive and Negative Artifacts in ParticulateOrganic Carbon Measurements with Denuded and Unde-nuded Sampler Configurations, Aerosol Sci. Tech., 38, 27–48,doi:10.1080/02786820390229354, 2004.
Timkovsky, J., Dusek, U., Henzing, J. S., Kuipers, T. L.,Röckmann, T., and Holzinger, R.: Offline thermal-desorptionproton-transfer-reaction mass spectrometry to study com-position of organic aerosol, J. Aerosol Sci., 79, 1–14,doi:10.1016/j.jaerosci.2014.08.010, 2015.
Tolocka, M. P., Jang, M., Ginter, J. M., Cox, F. J., Kamens,R. M., and Johnston, M. V.: Formation of Oligomers in Sec-ondary Organic Aerosol, Environ. Sci. Technol., 38, 1428–1434,doi:10.1021/es035030r, 2004.
Turekian, V. C., Macko, S. A., and Keene, W. C.: Concen-trations, isotopic compositions, and sources of size-resolved,particulate organic carbon and oxalate in near-surface marineair at Bermuda during spring, J. Geophys. Res., 108, 4157,doi:10.1029/2002JD002053, 2003.
Turpin, B. J., Saxena, P., and Andrews, E.: Measuring and sim-ulating particulate organics in the atmosphere: problems andprospects, Atmos. Environ., 34, 2983–3013, 2000.
Wade, D.: Deuterium isotope effects on noncovalent interactionsbetween molecules, Chemico-Biological Interactions, 117, 191–217, doi:10.1016/S0009-2797(98)00097-0, 1999.
Watson, J. G., Chow, J. C., Chen, L.-W. A., and Frank, N. H.: Meth-ods to Assess Carbonaceous Aerosol Sampling Artifacts for IM-PROVE and Other Long-Term Networks, J. Air Waste Manage.,59, 898–911, doi:10.3155/1047-3289.59.8.898, 2009.
Werner, R. A. and Brand, W. A.: Referencing strategies and tech-niques in stable isotope ratio analysis, Rapid Commun. Mass Sp.,15, 501–519, doi:10.1002/rcm.258, 2001.
Werner, R. A., Bruch, B. A., and Brand, W. A.: ConFlo III – an inter-face for high precision d13C and d15N analysis with an extendeddynamic range, Rapid Commun. Mass Sp., 13, 1237–1241,doi:10.1002/(SICI)1097-0231(19990715)13:13<1237::AID-RCM633>3.0.CO;2-C, 1999.
Widory, D., Roy, S., Le Moullec, Y., Goupil, G., Cocherie, A., andGuerrot, C.: The origin of atmospheric particles in Paris: a viewthrough carbon and lead isotopes, Atmos. Environ., 38, 953–961,doi:10.1016/j.atmosenv.2003.11.001, 2004.
Williams, E. L. and Grosjean, D.: Removal of atmospheric oxi-dants with annular denuders, Environ. Sci. Technol., 24, 811–814, doi:10.1021/es00076a002, 1990.
Winterhalter, R., Van Dingenen, R., Larsen, B. R., Jensen, N. R.,and Hjorth, J.: LC-MS analysis of aerosol particles from the ox-idation of α-pinene by ozone and OH-radicals, Atmos. Chem.Phys. Discuss., 3, 1–39, doi:10.5194/acpd-3-1-2003, 2003.
Witter, M., Berndt, T., Böge, O., Stratmann, F., and Heintzenberg,J.: Gas-phase ozonolysis: Rate coefficients for a series of ter-penes and rate coefficients and OH yields for 2-methyl-2-buteneand 2,3-dimethyl-2-butene, Int. J. Chem. Kinet., 34, 394–403,doi:10.1002/kin.10063, 2002.
www.atmos-chem-phys.net/17/6373/2017/ Atmos. Chem. Phys., 17, 6373–6391, 2017


![Isotopic composition [ACE] Solar Modulation [PAMELA,ULYSSES]](https://static.fdocuments.us/doc/165x107/56814019550346895dab6670/isotopic-composition-ace-solar-modulation-pamelaulysses.jpg)