Nd isotopic composition of water masses and dilution...
14
Article Volume 12, Number 6 30 June 2011 Q06020, doi:10.1029/2011GC003529 ISSN: 1525‐2027 Nd isotopic composition of water masses and dilution of the Mediterranean outflow along the southwest European margin K. Copard Laboratoire des Interactions et Dynamique des Environnements de Surface, UMR 8148, CNRS, Université de Paris‐Sud, Bâtiment 504, F‐91405 Orsay CEDEX, France ([email protected]) Laboratoire des Sciences du Climat et de l’Environnement, Laboratoire mixte CNRS‐CEA, Avenue de la Terrasse, F‐91198 Gif‐sur‐Yvette CEDEX, France C. Colin Laboratoire des Interactions et Dynamique des Environnements de Surface, UMR 8148, CNRS, Université de Paris‐Sud, Bâtiment 504, F‐91405 Orsay CEDEX, France N. Frank Laboratoire des Sciences du Climat et de l’Environnement, Laboratoire mixte CNRS‐CEA, Avenue de la Terrasse, F‐91198 Gif‐sur‐Yvette CEDEX, France C. Jeandel Laboratoire d’Etudes en Géophysique et Océanographie Spatiale, UMR 5566, CNRS, Observatoire Midi‐Pyrénées, 14 Avenue E. Belin, F‐31400 Toulouse, France J.‐C. Montero‐Serrano Laboratoire des Interactions et Dynamique des Environnements de Surface, UMR 8148, CNRS, Université de Paris‐Sud, Bâtiment 504, F‐91405 Orsay CEDEX, France Laboratoire des Sciences du Climat et de l’Environnement, Laboratoire mixte CNRS‐CEA, Avenue de la Terrasse, F‐91198 Gif‐sur‐Yvette CEDEX, France G. Reverdin Laboratoire d’Océanographie et de Climatologie par Expérimentation et Analyse Numérique, Institut Pierre Simon Laplace, Université Pierre et Marie Curie, Case 100, 4 Place Jussieu, F‐75252 Paris CEDEX 05, France B. Ferron Laboratoire de Physique des Océans, UMR 6523, IFREMER, Centre de Brest, F‐29280 Plouzané, France [1] Nd isotopic compositions ("Nd) of seawater profiles and deep‐sea corals collected off the coast of Iberia and from the Bay of Biscay were measured (1) to constrain the Nd isotopic composition of water masses along the southwest European margin, (2) to track the Mediterranean Outflow Water (MOW) during its northward propagation, and (3) to establish hydrological changes during the last 1500 years. The Eastern North Atlantic Central Water (ENACW) is characterized by Nd isotopic composition of around -12.0. Mediterranean Sea Water (MSW) is collected from 800 and 1200 m depth and is characterized by "Nd values ranging from -10.9, off the coast of Iberia, to -11.6 in the Bay of Biscay. These "Nd results suggest a strong dilution of the pure MOW at the Strait of Gibraltar ("Nd -9.4) of approximately 40% Copyright 2011 by the American Geophysical Union 1 of 14
Transcript of Nd isotopic composition of water masses and dilution...

Article
Volume 12, Number 6
30 June 2011
Q06020, doi:10.1029/2011GC003529
ISSN: 1525‐2027
Nd isotopic composition of water masses and dilutionof the Mediterranean outflow along the southwestEuropean margin
K. CopardLaboratoire des Interactions et Dynamique des Environnements de Surface, UMR 8148, CNRS,Université de Paris‐Sud, Bâtiment 504, F‐91405 Orsay CEDEX, France ([email protected])
Laboratoire des Sciences du Climat et de l’Environnement, Laboratoire mixte CNRS‐CEA, Avenue dela Terrasse, F‐91198 Gif‐sur‐Yvette CEDEX, France
C. ColinLaboratoire des Interactions et Dynamique des Environnements de Surface, UMR 8148, CNRS,Université de Paris‐Sud, Bâtiment 504, F‐91405 Orsay CEDEX, France
N. FrankLaboratoire des Sciences du Climat et de l’Environnement, Laboratoire mixte CNRS‐CEA, Avenue dela Terrasse, F‐91198 Gif‐sur‐Yvette CEDEX, France
C. JeandelLaboratoire d’Etudes en Géophysique et Océanographie Spatiale, UMR 5566, CNRS, ObservatoireMidi‐Pyrénées, 14 Avenue E. Belin, F‐31400 Toulouse, France
J.‐C. Montero‐SerranoLaboratoire des Interactions et Dynamique des Environnements de Surface, UMR 8148, CNRS,Université de Paris‐Sud, Bâtiment 504, F‐91405 Orsay CEDEX, France
Laboratoire des Sciences du Climat et de l’Environnement, Laboratoire mixte CNRS‐CEA, Avenue dela Terrasse, F‐91198 Gif‐sur‐Yvette CEDEX, France
G. ReverdinLaboratoire d’Océanographie et de Climatologie par Expérimentation et Analyse Numérique, InstitutPierre Simon Laplace, Université Pierre et Marie Curie, Case 100, 4 Place Jussieu, F‐75252 ParisCEDEX 05, France
B. FerronLaboratoire de Physique des Océans, UMR 6523, IFREMER, Centre de Brest, F‐29280 Plouzané,France
[1] Nd isotopic compositions ("Nd) of seawater profiles and deep‐sea corals collected off the coast of Iberiaand from the Bay of Biscay were measured (1) to constrain the Nd isotopic composition of water massesalong the southwest European margin, (2) to track the Mediterranean Outflow Water (MOW) during itsnorthward propagation, and (3) to establish hydrological changes during the last 1500 years. The EasternNorth Atlantic Central Water (ENACW) is characterized by Nd isotopic composition of around −12.0.Mediterranean Sea Water (MSW) is collected from 800 and 1200 m depth and is characterized by "Ndvalues ranging from −10.9, off the coast of Iberia, to −11.6 in the Bay of Biscay. These "Nd resultssuggest a strong dilution of the pure MOW at the Strait of Gibraltar ("Nd −9.4) of approximately 40%
Copyright 2011 by the American Geophysical Union 1 of 14

and 30% along its northward circulation pathway essentially with a contribution from ENACW. Ataround 2000 m depth, "Nd water profiles display the occurrence of a nonradiogenic water mass ("Nd −13),originating from the Labrador Sea (Labrador Sea Water). Fossil deep‐sea corals, dated between 84 and1500 years, display Nd isotopic compositions that vary moderately from present‐day seawater values,suggesting a weaker influence of MOW in the formation of MSW during the Dark Ages and the Little IceAge. These recent cold events seem to be associated with a reduction in the northward penetration ofMSW, which may result from a greater eastward extension of the middepth subpolar gyre and/or a reductionof MSW formation, likely tied to a variation in deep Mediterranean water production.
Components: 9100 words, 6 figures, 3 tables.
Keywords: European margin; Nd isotopic composition; deep‐sea corals; water masses.
Index Terms: 0454 Biogeosciences: Isotopic composition and chemistry (1041, 4870).
Received 25 January 2011; Revised 7 April 2011; Accepted 9 April 2011; Published 30 June 2011.
Copard, K., C. Colin, N. Frank, C. Jeandel, J.-C. Montero‐Serrano, G. Reverdin, and B. Ferron (2011), Nd isotopiccomposition of water masses and dilution of the Mediterranean outflow along the southwest European margin, Geochem.Geophys. Geosyst., 12, Q06020, doi:10.1029/2011GC003529.
1. Introduction
[2] In the ocean, dissolved Nd is a trace element oflithogenic origin characterized by a residence timeof approximately 500 to 1000 years [Tachikawaet al., 2003]. The Nd isotopic composition corre-sponds to the 143Nd/144Nd ratio and is expressed as"Nd. "Nd is defined by "Nd = ([(143Nd/144Nd)sample/(143Nd/144Nd)CHUR]− 1)*10000, where CHUR standsfor Chrondritic Uniform Reservoir and represents apresent‐day average earth value: (143Nd/144Nd)CHUR=0.512638 [Jacobsen and Wasserburg, 1980]. TheNd isotopic composition of the continents is het-erogeneous. It was shown that through the Nd iso-topic composition gradients of continental margins,water masses acquire a characteristic Nd isotopicsignature that is subsequently modified by themixing of these water masses or by geochemicalprocesses at the continental margin, referred to asboundary exchange [Lacan and Jeandel, 2005a].This observation encouraged the study of the Ndisotopic composition of seawater to trace the originof water masses in modern oceanography [e.g.,Lacan and Jeandel, 2004a, 2005b; Piepgras andWasserburg, 1983; Spivack and Wasserburg,1988; Tachikawa et al., 2004] and to trace theprovenance and advection strength of water massesin the past [Burton and Vance, 2000; Vance andBurton, 1999; Piotrowski et al., 2004, 2005; Colinet al., 2010].
[3] Numerous studies have been conducted to iden-tify the water mass signatures and temporal evolutionof Nd isotopic gradients in the North Atlantic
[Piepgras and Wasserburg, 1983, 1987; Spivack andWasserburg, 1988; Lacan and Jeandel, 2005b]. TheNorth Atlantic is a region of complex hydrologicalpatterns driven by surface gyre circulations, thenorthward advection of water from the temperateAtlantic, intermediate water recirculation, and theformation and southward propagation of NorthAtlantic Deep Water (NADW). Although many ofthe water masses of the complex Atlantic circulationpatterns have already been investigated on bothmodern and millennial times scales using deep‐seasediments and corals [van de Flierdt et al., 2006;Colin et al., 2010; Copard et al., 2010], little isknown about the Nd isotopic composition of modernseawater from the Eastern margin of the NorthAtlantic. However, this information is crucial to es-tablishing the Nd isotopic composition of watermasses such as the Eastern North Atlantic CentralWater (ENACW) and the Mediterranean Sea Water(MSW). These water masses flow along the Euro-pean margin and penetrate into the Rockall Trough[Lozier and Stewart, 2008] where they can mix andinfluence other water masses flowing northwardbefore they enter into Nordic Seas and are down-welled. Here, we present "Nd measurements of twowater profiles along the Western European margin(Bay of Biscay and off the Iberian Peninsula) tobetter characterize water masses circulation in thisregion and to track the northward transport andevolution of the Nd isotopic composition of MSWand ENACW. The Nd isotopic composition of thesewater masses is then compared to the Nd isotopiccomposition of both modern and fossil deep‐seacorals (L. Pertusa, M. oculata, D. dianthus) collected
GeochemistryGeophysicsGeosystems G3G3 COPARD ET AL.: ND ISOTOPIC COMPOSITION OF WATER MASSES 10.1029/2011GC003529
2 of 14

at variable depths in the Bay of Biscay and offthe Iberian Peninsula. The Nd isotopic compositionof deep‐sea corals is then used to determine thepotential variability of the "Nd of the WesternEuropean water masses through time and thus totrack hydrological changes along the Eastern marginof the North Atlantic during the last 1500 years.
2. Hydrological Setting
[4] Along the Western European margin, a sub-surface water mass, called the Eastern NorthAtlantic Central Water (ENACW), is formed by thesubduction of water during winter. The ENACWis located between the seasonal thermocline andthe lower part of the permanent thermocline. In theGulf of Cadiz, this water mass occurs between100 and 600 m [Louarn, 2008].
[5] At the Strait of Gibraltar, two layers of watercan be distinguished by a sharp density gradient:the eastward flow of low‐density Atlantic water(ENACW) overlies the more saline westward out-flow of high‐density Mediterranean water corre-sponding to the MOW. The MOW is characterizedby high salinities (S > 36.9 ‰), temperatures rang-ing from 13.22 to 13.76°C, a density >28.8 kg m−3
and an "Nd value of −9.4 [Tachikawa et al., 2004;Spivack and Wasserburg, 1988]. At the exit ofthe Gulf of Cadiz, the MOW is strongly modifiedby vertical mixing with the overlying ENACWduring its overflow and is thus referred to as Med-iterranean Sea Water (MSW). In the Gulf of Cadiz,two layers of the MSW have been discriminated.The upper layer of the MSW (MSWu) lies between800 and 900 m and the lower layer of the MSW(MSWl) occurs at depths of 1100–1200 m.
[6] The presence of Antarctic Intermediate Water(AAIW) has also been identified in the MSWl inthe Gulf of Cadiz [Louarn, 2008]. However,AAIW is present only in the southern part of theGulf of Cadiz and comprises a small proportion(<10%) of the total water mass and does not flowfurther North along the European coast [Louarn,2008]. The upper layer of MSW is then com-posed of MOW and ENACW and its lower layer iscomposed of MOW, ENACW and AAIW [Louarn,2008]. The Nd isotopic composition of MSW isnot well determined and depends on the rate ofmixing between MOW ("Nd = −9.4) and the sur-rounding water masses (mainly the ENACW)during the overflow.
[7] Below intermediate waters (MSW and AAIW),the study area is characterized at 2000 m depth by
the presence of the Labrador Sea Water (LSW)[van Aken, 2000; Forner, 2005; Aït‐Ameur andGoyet, 2006; Louarn, 2008]. At even greaterdepths, Lower Deep Water (LDW) flows north[van Aken, 2000]. This deep water mass resultsfrom the mixing of Antarctic Bottom Water(AABW) and the less dense Eastern North AtlanticDeep Water (ENADW) as its flows northwardthrough the Atlantic Ocean.
3. Material and Methods
[8] Ten seawater samples were collected during theOVIDE cruise off the Iberian Peninsula (Ovidestation 15: 40°20′N; 12°13.21′W) in June 2008.Eleven seawater samples were collected duringthe CAROLS cruise in the Bay of Biscay, inNovember 2008 (Figure 1 and Table 1). Sampleswere collected at both sites in the upper 3000 mof the water column.
[9] Eighteen deep‐sea corals (L. Pertusa, M. oculata,D. dianthus) from the collection of the MNHN(Muséum national d’Histoire naturelle de Paris) wereoriginally collected off the Iberian Peninsula andalong the slope of the Bay of Biscay during BIOGASI cruise and several THALASSA cruises (1972–1973) (Figure 1 and Table 2). Two additional deep‐sea coral samples (B08–04) were collected duringthe BISCOT cruise in 2008 (Figure 1 and Table 2).
[10] Nd isotopic compositions of seawater wereanalyzed on unfiltered samples following the ana-lytical procedures described by Lacan and Jeandel[2001]. Briefly, the Nd was extracted from approx-imately 15 L of seawater by ion exchange chroma-tography. Seawater rare earth elements (REE) werepreconcentrated using SEP‐PAK Classic C18 car-tridges loaded with a HDEHP.H2.MEHP complex-ant. REE were then purified using a cationic resin(AG50X8). Nd was purified using an Ln‐Spec col-umn, following the method described in detail byCopard et al. [2010]. 143Nd/144Nd ratios of seawatersamples were performed using static multicollectionon a Finnigan MAT‐262 at the Laboratoire desSciences du Climat et de l’Environnement (LSCE,CEA‐CNRS‐UVSQ, Gif/Yvette). 143Nd/144Nd ratioswere corrected for mass fractionation relative to146Nd/144Nd = 0.7219 using a power law. Blankvalues were <500 pg. These values can be neglectedas they represent less than 1.5% of the total seawatersamples (taking account the volume of the sea-water sample (15 L) and the Nd concentration ofseawater in the study area). Replicate analyses (n =30) of the La Jolla standard gave a mean 143Nd/144Nd
GeochemistryGeophysicsGeosystems G3G3 COPARD ET AL.: ND ISOTOPIC COMPOSITION OF WATER MASSES 10.1029/2011GC003529
3 of 14

La Jolla = 0.511859 ± 0.000014 which is within theuncertainty of its certified value of 0.511850 ±0.000013.
[11] Deep‐sea corals are often exposed to seawaterfor a long time and may acquire a black coating offerromanganese oxides and hydroxides. Rigorouscleaning techniques were therefore applied, follow-ing the procedure presented by Copard et al. [2010],to avoid contamination of Nd isotopic compositionby these coatings. This procedure consists mainly ofcarefully polishing the inner and outermost surfaceof the coral skeletons using a diamond blade saw toretrieve an opaque and translucent pure aragoniteskeleton. This mechanical cleaning was followedby two weak attacks with dilute ultraclean 0.5 N
hydrochloric acid in an ultrasonic bath for 10 min toremove further potential residual Fe‐Mn coatings. ANd‐oxide technique for thermal ionization massspectrometry (TIMS) was used to determine the Ndisotopic composition (143Nd/144Nd ratios) of deep‐sea corals. The chemical purification of Nd, usingTRU‐Spec resin and Ln‐Spec resin as well as themass spectrometric techniques applied here aredescribed in detail by Copard et al. [2010]. Nd cutswere loaded onto a single Re degassed filaments andrun using the H3PO4/silica gel method. Sampleswere analyzed for two hundred 143Nd/144Nd ratioswith a monitor beam (144Nd16O) higher than 500 mVon a six Faraday collector Finnigan MAT 262 TIMS(LSCE, Gif/Yvette). PrO+ isobaric interferenceswere measured and corrected line by line during
Figure 1. Location of Ovide station 15 (blue circle), CAROLS stations (gold squares), and deep‐sea corals (greencircles, gray diamonds) investigated in this study. Undated corals are represented by gray diamonds, dated corals arerepresented by green circles. Seawater stations 69/3 and 69/6 (white diamonds) investigated by Rickli et al. [2009] andstation 95 of cruise 109–1 RV Atlantis II (black triangle) investigated by Piepgras and Wasserburg [1983] are alsoreported. Water masses circulating in this region are Mediterranean Sea Water (MSW), Eastern North Atlantic CentralWater (ENACW), Antarctic Intermediate Water (AAIW), Antarctic Bottom Water (AABW), Labrador Sea Water(LSW) and Eastern North Atlantic Deep Water (ENADW).
GeochemistryGeophysicsGeosystems G3G3 COPARD ET AL.: ND ISOTOPIC COMPOSITION OF WATER MASSES 10.1029/2011GC003529
4 of 14

offline analysis. The Nd isotopic ratios were correctedfor mass fractionation relative to 146Nd/144Nd =0.7219 using a power law. Oxygen isotope ratios usedfor the corrections are 18O/16O = 0.002085 and17O/16O = 0.000391. Concentrations of Nd in theblanks were negligible compared to the concentra-tions of Nd in the deep‐sea corals investigated inthis study. Replicate analyses (n = 124) of theLa Jolla standard gave a mean 143Nd/144Nd of0.511858 ± 0.000010. This mean value is close tothe certified value of 0.511850 ± 0.000013, sug-gesting a negligible (0.00001) machine bias thatwas taken into consideration for the sample data’sre‐treatment following a bracketing technique.
[12] Ca, Mn and Nd concentrations of deep‐seacorals were determined on same cleaned samplesthan those used for Nd isotopic compositiondeterminations in order to evaluate the efficiency ofthe cleaning procedure and to discard any deep‐seacorals samples presenting residual ferromanganesecoatings. These analyses were conducted at theLSCE using a quadruple ICP‐MS Xseries II CCT(Thermo Fisher Scientific) to measure the isotopes46Ca, 55Mn and 146Nd [Copard et al., 2010].
[13] Six deep‐sea corals investigated in this studyhave been dated by 230Th/U method (Table 2). U‐isotopic measurements were carried out using anICPQMS (ThermoX‐series ‐ Gif‐sur‐Yvette) accord-ing to the procedures of Douville et al. [2010]. Thisotopic measurements were carried out using a MC‐
ICPMS to obtain higher precision (ThermoFisherNeptune ‐ IPG Paris). Reproducibility and accuracyof analyses were determined through frequentmeasurements of HU1 standard solution spiked withan in‐house 229Th, 233U, 236U triple spike and yield<5‰ reproducibility for U isotope measurementsand <8‰ for Th isotope measurements.
4. Results
4.1. Hydrological Parameters[14] Potential temperature, salinity and potentialdensity results from the 21 seawater samples arereported in Table 1. The salinity versus potentialtemperature and salinity versus water depth dia-grams (Figures 2a and 2b) allow the identificationof similar water masses at both stations: ENACW,MSW as well as deeper and fresher water masses(LSW, LDW). At Ovide station 15, potential tem-peratures range from 14.0°C to 2.82°C and salinitiesfrom 36.08‰ to 34.95‰. For the CAROLS sta-tions, potential temperatures are between 12.18°Cand 2.97°C and the salinity varies between 35.77‰and 34.96‰. The core of ENACW is identifiableat approximately 400 m depth, at both station, by asalinity minimum of 35.6‰ and a temperature of11.5°C. At approximately 1100–1200 m depth, thecore of MSW is characterized by a salinity maxi-mum of 36.1‰ and a temperature of 10.3°C off theIberian Peninsula and a salinity maximum of 35.8‰
Table 1. Locations of Seawater Stations Investigated in This Study With Water Depth of Samplinga
Station Location Latitude Longitude Depth (m) � (°C) S (psu) s� (kg m−3) "Nd (±0.3)
OVIDE st 15 40°20′N 12°13.21′W 97 14.00 35.95 26.92 −11.340°20′N 12°13.21′W 296 12.06 35.68 27.11 −11.840°20′N 12°13.21′W 396 11.50 35.61 27.16 −12.040°20′N 12°13.21′W 496 11.33 35.64 27.21 −12.040°20′N 12°13.21′W 751 10.71 35.78 27.44 −11.440°20′N 12°13.21′W 904 10.37 35.88 27.58 −11.140°20′N 12°13.21′W 1200 10.29 36.08 27.74 −10.940°20′N 12°13.21′W 1504 7.15 35.53 27.82 −11.740°20′N 12°13.21′W 2010 3.98 35.04 27.82 −13.040°20′N 12°13.21′W 2988 2.82 34.95 27.86 −12.2
CAROLS st 40 45°21.2′N 3°22.5′W 140 12.18 35.65 27.02 −10.7CAROLS st 38 44°44.1′N 3°54.0′W 198 12.18 35.66 27.06 −11.0CAROLS st 34 44°17.4′N 3°46.9′W 302 11.75 35.63 27.07 −11.7CAROLS st 34 44°17.4′N 3°46.9′W 402 11.49 35.60 27.13 −11.6CAROLS st 38 44°44.1′N 3°54.0′W 547 11.08 35.61 27.17 −11.5CAROLS st 38 44°44.1′N 3°54.0′W 799 10.44 35.72 27.25 −11.2CAROLS st 38 44°44.1′N 3°54.0′W 1110 9.36 35.77 27.45 −11.5CAROLS st 38 44°44.1′N 3°54.0′W 1500 6.27 35.33 27.69 −12.2CAROLS st 38 44°44.1′N 3°54.0′W 1825 4.61 35.11 28.00 −12.7CAROLS st 39 45°20.1′N 3°26.7′W 2135 3.66 35.02 27.83 −11.8CAROLS st 39 45°20.1′N 3°26.7′W 2635 2.97 34.96 27.85 −11.4
aPotential temperature (�), salinity (S), and potential density (s�) and "Nd data results are reported. "Nd are given with a reproducibility of±0.3 (2s).
GeochemistryGeophysicsGeosystems G3G3 COPARD ET AL.: ND ISOTOPIC COMPOSITION OF WATER MASSES 10.1029/2011GC003529
5 of 14

and a temperature of 9.4°C in the Bay of Biscay.The deepest water masses are characterized by aminimum of salinity and temperature of 34.95‰and 2.8°C at Ovide station 15 and of 34.96‰ and2.97°C at the CAROLS stations.
4.2. Seawater ɛNd Results[15] The Nd isotopic compositions of seawatersamples analyzed are reported in Table 1. "Ndvalues for Ovide station 15 and the CAROLS sta-tions seawater samples range from −13.0 ± 0.3 to−10.9 ± 0.3 and from −12.7 ± 0.3 to −10.7 ± 0.3,respectively. The Nd isotopic compositions exhibitlarge variations at both stations along the entiredepth profile (Figure 3).
[16] For OVIDE station 15 seawater (Figure 3a),"Nd reaches its first minimum between 396 and496 m depth, with values around −12.0 ± 0.3, andthe second minimum occurs at 2010 m depth, witha value of −13.0 ± 0.3 whereas an "Nd maximumof −10.9 ± 0.3 occurs at 1200 m depth. For the
Figure 2. (a) Potential temperature (°C) versus salinity(PSU) for Ovide station 15 (blue circles) and CAROLSstations (gold squares) compared to Biscay stations 69/3and 69/6 (open diamonds) obtained by Rickli et al. [2009]and (b) salinity (PSU) versus water depth (m) obtained forOvide station 15 (blue circles) and CAROLS stations(gold squares), compared to Biscay stations 69/3 and 69/6(open diamonds) obtained by Rickli et al. [2009].
Tab
le2.
USeriesMeasurementsandAgesof
FossilCoralsInvestigated
inThisStudy
a
Labcode
Sam
ple
238U
(ppm
)232Th(ppb
)d2
34UM(‰
)(230Th/
238U)
(230Th/
232Th)
Age
(kyr)
d234UT(‰
)Age*(kyr)
Gif‐145
5MNHN
GascL53
53.83
8±0.00
40.16
1±0.00
714
6.4±1.9
0.00
10±0.00
0173
.5±6.7
97±8
146.4±1.9
84±8
Gif‐145
6MNHN
GascL60
04.13
1±0.00
40.64
1±0.04
414
5.4±1.7
0.00
19±0.00
0237
.3±4.6
181±19
145.5±1.7
133±19
Gif‐146
2MNHN
GascL90
02.82
1±0.00
30.49
6±0.01
614
5.0±2.4
0.00
29±0.00
0351
.0±5.8
281±32
145.2±2.4
226±32
Gif‐146
3MNHN
GascL95
03.16
5±0.00
40.47
8±0.02
114
7.6±2.8
0.00
21±0.00
0342
.7±5.9
202±27
147.7±2.8
155±27
Gif‐146
6MNHN
GascD60
04.11
9±0.00
42.05
8±0.11
314
4.9±2.0
0.00
69±0.00
0342
.4±3.0
664±32
145.2±2.0
508±32
Gif‐146
7MNHN
GascD82
53.16
1±0.00
60.28
3±0.01
414
3.9±1.1
0.01
60±0.00
0454
4.4±29
.015
34±37
144.5±1.1
1506
±37
a Age*reflectsages
calculated
basedon
asimplecorrectio
nmod
elconsideringprecipitatio
nof
initial
230Thfrom
seaw
ater
taking
seaw
ater
(232Th/
230Th)
activ
ityratio
srang
ingfrom
14to
6into
accoun
t[Frank
etal.,20
04].
GeochemistryGeophysicsGeosystems G3G3 COPARD ET AL.: ND ISOTOPIC COMPOSITION OF WATER MASSES 10.1029/2011GC003529
6 of 14

CAROLS stations (Figure 3b), "Nd follows thesame pattern but with less pronounced variations.Two "Nd minima occur, the first around 300 mdepth, with a value of −11.7 ± 0.3, and the secondaround 1800 m depth, with a value of −12.7 ± 0.3.An "Nd maximum of −11.2 ± 0.3 occurs atapproximately 800 m depth.
4.3. Age and ɛNd of Deep‐Sea Corals[17] Ages of the six deep‐sea corals obtained by230Th/U dating are reported in the Table 2. Uconcentrations range from 2.821 ± 0.003 and4.131 ± 0.004 ppm. These values are similar to thevalues obtained from other cold‐water corals ana-lyzed by Frank et al. [2004] and Copard et al.[2010]. Th/U ages are given as measured andcorrected (*) ages, based on measured (230Th/238U)and (234U/238U) activity ratios [Frank et al., 2004]and using the half‐lives of Cheng et al. [2000].Corrected ages include a correction for 230Thderived from seawater, which is based on an esti-mated seawater (230Th/232Th) activity ratio rangingfrom 5 to 12 (Station L3 [Vogler et al., 1998]). Thecorrected age of the six deep‐sea corals investi-gated in this study ranges from 84 ± 8 to 1506 ±37 years (Table 2). In addition, the two coralssamples B08‐04‐E2 and B08‐04‐E3, taken duringthe BISCOT cruise, were collected from a coralpolyp that was living when it was sampled. Thus,we can assume that these two deep‐sea corals areapproximately less than 30 years.
[18] Nd concentrations, Nd/Ca and Mn/Ca ratios,and "Nd of deep‐sea corals collected in the Bay ofBiscay and off the Galicia Bank are reported in
Table 3 (Figure 1). The Nd concentration of deep‐sea corals (L. pertusa, D. Dianthus and M. oculata)ranges from 6.2 to 111.1 ppb and the Mn/Ca ratiois lower than 4.47 mmol/mol (Table 3). The Mn/Caratio is not correlated with the Nd/Ca ratio (corre-lation coefficient r2 = 0.05) and "Nd (correlationcoefficient r2 = 0.09), excluding any significantcontamination by Fe‐Mn oxy‐hydroxides. Thisrange in the Mn/Ca ratio is comparable with rangesobserved in several living deep‐sea corals byCopard et al. [2010], demonstrating that thecleaning procedure used is sufficient to entirelyremove the coral coating. Therefore, Nd isotopiccompositions analyzed on cleaned coral samplesare representative of the Nd incorporated fromseawater into the aragonite skeleton.
[19] All deep‐sea corals investigated in this studypresent "Nd values ranging from −10.7 ± 0.4 to−12.3 ± 0.3 (Table 3). Undated deep‐sea corals(D. dianthus and M. oculata) from the GaliciaBank (Figure 4a) show "Nd values decreasing from−11.3 ± 0.3 at a depth of 765 m (Galice M765) and−10.9 ± 0.3 between 1150 and 1220 m depth(Galice D1150), with an intermediate value of−11.2 ± 0.3 between 985 and 1000 m depth (GaliceM985). These "Nd values are similar to the seawater"Nd profile except for the sample Galice M1110(undated) collected at 1110 m depth, which presentsa lower "Nd value of −12.0 ± 0.3 (Figure 4a).
[20] In the Bay of Biscay, deep‐sea corals of differ-ent species (L. pertusa, D. dianthus and M. oculata)sampled between 535 and 800 m depth show similar"Nd values between −11.3 ± 0.6 and −11.6 ±0.3 (Figure 4b). Three of them were dated at
Figure 3. Seawater "Nd versus water depth (m) obtained for (a) Ovide station 15 (blue circles), (b) CAROLS stations(gold squares) and (c) compared to Biscay stations 69/3 and 69/6 (open diamonds) measured by Rickli et al. [2009].
GeochemistryGeophysicsGeosystems G3G3 COPARD ET AL.: ND ISOTOPIC COMPOSITION OF WATER MASSES 10.1029/2011GC003529
7 of 14
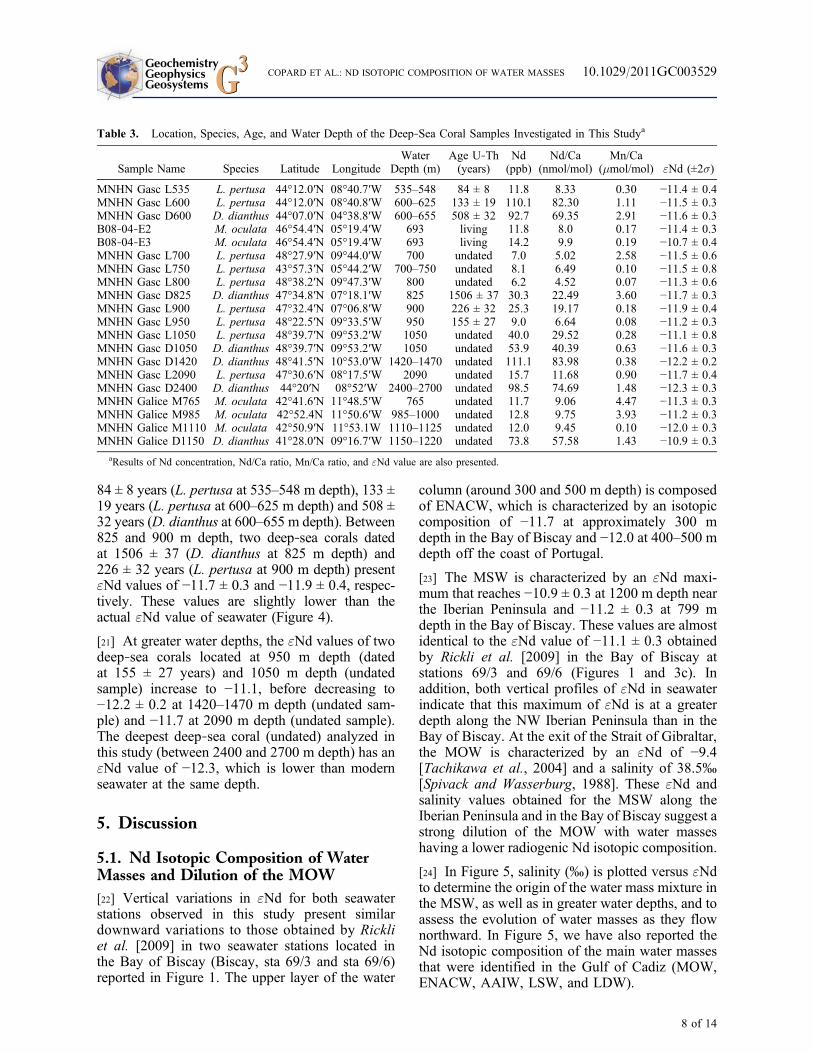
84 ± 8 years (L. pertusa at 535–548 m depth), 133 ±19 years (L. pertusa at 600–625 m depth) and 508 ±32 years (D. dianthus at 600–655 m depth). Between825 and 900 m depth, two deep‐sea corals datedat 1506 ± 37 (D. dianthus at 825 m depth) and226 ± 32 years (L. pertusa at 900 m depth) present"Nd values of −11.7 ± 0.3 and −11.9 ± 0.4, respec-tively. These values are slightly lower than theactual "Nd value of seawater (Figure 4).
[21] At greater water depths, the "Nd values of twodeep‐sea corals located at 950 m depth (datedat 155 ± 27 years) and 1050 m depth (undatedsample) increase to −11.1, before decreasing to−12.2 ± 0.2 at 1420–1470 m depth (undated sam-ple) and −11.7 at 2090 m depth (undated sample).The deepest deep‐sea coral (undated) analyzed inthis study (between 2400 and 2700 m depth) has an"Nd value of −12.3, which is lower than modernseawater at the same depth.
5. Discussion
5.1. Nd Isotopic Composition of WaterMasses and Dilution of the MOW[22] Vertical variations in "Nd for both seawaterstations observed in this study present similardownward variations to those obtained by Rickliet al. [2009] in two seawater stations located inthe Bay of Biscay (Biscay, sta 69/3 and sta 69/6)reported in Figure 1. The upper layer of the water
column (around 300 and 500 m depth) is composedof ENACW, which is characterized by an isotopiccomposition of −11.7 at approximately 300 mdepth in the Bay of Biscay and −12.0 at 400–500 mdepth off the coast of Portugal.
[23] The MSW is characterized by an "Nd maxi-mum that reaches −10.9 ± 0.3 at 1200 m depth nearthe Iberian Peninsula and −11.2 ± 0.3 at 799 mdepth in the Bay of Biscay. These values are almostidentical to the "Nd value of −11.1 ± 0.3 obtainedby Rickli et al. [2009] in the Bay of Biscay atstations 69/3 and 69/6 (Figures 1 and 3c). Inaddition, both vertical profiles of "Nd in seawaterindicate that this maximum of "Nd is at a greaterdepth along the NW Iberian Peninsula than in theBay of Biscay. At the exit of the Strait of Gibraltar,the MOW is characterized by an "Nd of −9.4[Tachikawa et al., 2004] and a salinity of 38.5‰[Spivack and Wasserburg, 1988]. These "Nd andsalinity values obtained for the MSW along theIberian Peninsula and in the Bay of Biscay suggest astrong dilution of the MOW with water masseshaving a lower radiogenic Nd isotopic composition.
[24] In Figure 5, salinity (‰) is plotted versus "Ndto determine the origin of the water mass mixture inthe MSW, as well as in greater water depths, and toassess the evolution of water masses as they flownorthward. In Figure 5, we have also reported theNd isotopic composition of the main water massesthat were identified in the Gulf of Cadiz (MOW,ENACW, AAIW, LSW, and LDW).
Table 3. Location, Species, Age, and Water Depth of the Deep‐Sea Coral Samples Investigated in This Studya
Sample Name Species Latitude LongitudeWater
Depth (m)Age U‐Th(years)
Nd(ppb)
Nd/Ca(nmol/mol)
Mn/Ca(mmol/mol) "Nd (±2s)
MNHN Gasc L535 L. pertusa 44°12.0′N 08°40.7′W 535–548 84 ± 8 11.8 8.33 0.30 −11.4 ± 0.4MNHN Gasc L600 L. pertusa 44°12.0′N 08°40.8′W 600–625 133 ± 19 110.1 82.30 1.11 −11.5 ± 0.3MNHN Gasc D600 D. dianthus 44°07.0′N 04°38.8′W 600–655 508 ± 32 92.7 69.35 2.91 −11.6 ± 0.3B08‐04‐E2 M. oculata 46°54.4′N 05°19.4′W 693 living 11.8 8.0 0.17 −11.4 ± 0.3B08‐04‐E3 M. oculata 46°54.4′N 05°19.4′W 693 living 14.2 9.9 0.19 −10.7 ± 0.4MNHN Gasc L700 L. pertusa 48°27.9′N 09°44.0′W 700 undated 7.0 5.02 2.58 −11.5 ± 0.6MNHN Gasc L750 L. pertusa 43°57.3′N 05°44.2′W 700–750 undated 8.1 6.49 0.10 −11.5 ± 0.8MNHN Gasc L800 L. pertusa 48°38.2′N 09°47.3′W 800 undated 6.2 4.52 0.07 −11.3 ± 0.6MNHN Gasc D825 D. dianthus 47°34.8′N 07°18.1′W 825 1506 ± 37 30.3 22.49 3.60 −11.7 ± 0.3MNHN Gasc L900 L. pertusa 47°32.4′N 07°06.8′W 900 226 ± 32 25.3 19.17 0.18 −11.9 ± 0.4MNHN Gasc L950 L. pertusa 48°22.5′N 09°33.5′W 950 155 ± 27 9.0 6.64 0.08 −11.2 ± 0.3MNHN Gasc L1050 L. pertusa 48°39.7′N 09°53.2′W 1050 undated 40.0 29.52 0.28 −11.1 ± 0.8MNHN Gasc D1050 D. dianthus 48°39.7′N 09°53.2′W 1050 undated 53.9 40.39 0.63 −11.6 ± 0.3MNHN Gasc D1420 D. dianthus 48°41.5′N 10°53.0′W 1420–1470 undated 111.1 83.98 0.38 −12.2 ± 0.2MNHN Gasc L2090 L. pertusa 47°30.6′N 08°17.5′W 2090 undated 15.7 11.68 0.90 −11.7 ± 0.4MNHN Gasc D2400 D. dianthus 44°20′N 08°52′W 2400–2700 undated 98.5 74.69 1.48 −12.3 ± 0.3MNHN Galice M765 M. oculata 42°41.6′N 11°48.5′W 765 undated 11.7 9.06 4.47 −11.3 ± 0.3MNHN Galice M985 M. oculata 42°52.4N 11°50.6′W 985–1000 undated 12.8 9.75 3.93 −11.2 ± 0.3MNHN Galice M1110 M. oculata 42°50.9′N 11°53.1W 1110–1125 undated 12.0 9.45 0.10 −12.0 ± 0.3MNHN Galice D1150 D. dianthus 41°28.0′N 09°16.7′W 1150–1220 undated 73.8 57.58 1.43 −10.9 ± 0.3
aResults of Nd concentration, Nd/Ca ratio, Mn/Ca ratio, and "Nd value are also presented.
GeochemistryGeophysicsGeosystems G3G3 COPARD ET AL.: ND ISOTOPIC COMPOSITION OF WATER MASSES 10.1029/2011GC003529
8 of 14

[25] Focusing on the 600–1200 m depth interval(Figure 5a), the water mass evolution off the coastof Iberia and in the Bay of Biscay confirms amixing between ENACW and MOW. At bothstations, we observe that an increase in salinitywith depth is associated with increasing "Ndvalues, reflecting a greater influence of MOW inthe mixing balance with depth. In addition, theSouthern and Northern stations differ slightly,reflecting the subsequent dilution of MOW alongits northward flow path. The "Nd and salinityvalues do not plot on a straight linear mixing linebetween the two end‐members ENACW andMOW suggesting a moderate nonlinear mixingbehavior. This implies the influence of a third watermass. The MSW in the Gulf of Cadiz (station AII109–1, 101, Figure 1) is influenced by fresherwater than MOW but with a quasisimilar Nd iso-topic composition. Such characteristics coincidewith the occurrence of AAIW in the Gulf of Cadiz,which would influence the mixing described above,as previously suggested by Louarn [2008].
[26] The "Nd value of “pure” ENACW is difficultto assess given the few available studies concerningthe Nd isotopic composition of this water mass.Piepgras and Wasserburg [1983] determine an"Nd minimum value of −12.5 at 200 m depthfrom station 95 of cruise 109–1 RV Atlantis II(36°17′41″N 10°02′27″W), close to the Gulf ofCadiz (Figure 1). However, it is ambiguous to
Figure 5. Salinity (PSU) versus "Nd obtained for Ovidestation 15 (blue circles) and CAROLS stations (goldsquares) focused on the (a) 600–1200 m water depth;(b) 1200–2000 m water depth and (c) 2000–3000 m waterdepth. Potential sources of water masses circulating alongthe Western European margin are also represented. Thesewater masses include: Mediterranean Outflow Water(MOW), Mediterranean Sea Water (MSW), EasternNorth Atlantic Central Water (ENACW), Antarctic Inter-mediate Water (AAIW), Antarctic Bottom Water(AABW), Labrador Sea Water (LSW) and Eastern NorthAtlantic Deep Water (ENADW).
Figure 4. "Nd of deep‐sea corals versus water depth(m) for (a) the Bank of Galicia and (b) the Bay of Biscay.Undated deep‐sea corals are represented by gray trian-gles, dated corals are represented by black diamondsand living corals are represented by green circles. (c) Sea-water "Nd profiles obtained for Ovide station 15 andCAROLS stations are also reported for comparison.
GeochemistryGeophysicsGeosystems G3G3 COPARD ET AL.: ND ISOTOPIC COMPOSITION OF WATER MASSES 10.1029/2011GC003529
9 of 14

affirm that this value corresponds to ENACW as thesalinity minimum is observed at 500 m depth for thesame station. Here, we obtain an "Nd value of −12for the ENACW at Ovide station 15. Taking intoconsideration the "Nd value of MOW at the exitof the Strait of Gibraltar (−9.4 [Tachikawa et al.,2004], we can estimate that MSW off the coast ofPortugal reflects a mixture of approximately 40%of MOW and 60% of ENACW, in agreement withother estimates for the Gulf of Cadiz based onhydrological and tracer data (CFC) [Rhein andHinrichsen, 1993; Louarn, 2008]. Taking only intoaccount the salinity budgets from both stations andusing 35.6‰ for ENACW and 38.5‰ for MOW,we estimate a proportion of approximately 80% ofENACW and 20% of MOW strongly different fromprevious studies [Rhein and Hinrichsen, 1993;Louarn, 2008] aswell as our Ndmixing balance. Thisis most likely due to the presence of a third lowsalinitywatermass that would lead to an overestimateof ENACW by considering only two end‐members.
[27] In the Bay of Biscay, MSW has an "Nd valueof −11.2 ± 0.3, suggesting a proportion of 30% ofMOW in the MSW using the same "Nd values of−12 for ENACW and −9.4 for MOW. However,considering that ENACW is also diluted along itsnorthward circulation, we can suppose that the "Ndvalue of −12 is underestimated ("Nd = −11.7 in theBay of Biscay) and thus that the proportion ofENACW in MSW is also underestimated and isprobably more than 70%. Such estimations are inagreement with a strong dilution of MOW by thesurrounding water masses (ENACW) when it flowsalong the western European margin. This impliesthat Mediterranean water has a very small influencefurther North of the Bay of Biscay, such as on thePorcupine Bank and in the Rockall Trough where itis confronted to subpolar gyre or Modified NorthAtlantic Water entering into the Nordic Seas.
[28] In Figure 5b, for seawater samples collectedbetween 1200 and 2000 m, water masses are get-ting fresher and unradiogenic, with "Nd value of−13.0 at 2000 m depth off the coast of Portugal and−12.7 at 1800 m depth in the Bay of Biscay. SuchNd isotopic compositions obtained for deep wateralong the Western European margin indicate thepresence of water with a more unradiogenic Ndisotopic composition at around 1800 and 2000 mdepth, not highlighted by salinity or temperatureprofiles (Figure 2). This decrease in "Nd values isalso observed by Rickli et al. [2009], but with alower amplitude than in the CAROLS profileprobably due to the lower vertical resolution oftheir analyses (Figure 3). This low "Nd value is
explained by the influence of LSW (Figure 5b),which has an "Nd value of around −15 in theLabrador Sea [Lacan and Jeandel, 2004b].
[29] Below 2000 m (Figure 5c), water masses getmore radiogenic, suggesting a mixing betweenENADW, coming from the West Atlantic and sit-uated below LSW, and a water mass with higher"Nd values. Spivack and Wasserburg [1988] sug-gest that the deepest water along the north‐westAfrican margin has a southern origin based on itsSi concentration. This water, called Lower DeepWater (LDW), is derived from Antarctic BottomWater AABW (van Aken, 2000) and has also beenidentified by Forner [2005] along the coast ofWestern Portugal below 4000 m depth. Between2000 and 4000 m depth, the LDW mixes mainlywith polar waters [Forner, 2005]. The Nd isotopiccomposition of AABW ranges from −10.6 to −11.7[Jeandel, 1993] and corresponds to the evolutionof "Nd value of the deepest water masses alongthe West European margin. However, deep waterbetween 2000 and 3000 m in the Bay of Biscayappears to be more radiogenic than off the IberianPeninsula although the same water masses seem tobe present. It is not probable that a higher propor-tion of LDW is in the Bay of Biscay than off thecoast of Portugal as this water originates furthersouth and thus flows along the Portugal marginbefore entering the Bay of Biscay. Boundaryexchange could explain this bias between the twostudied areas. Indeed, CARLOS station 39 wherethe deepest water mass (2635 m) was sampled inthe Bay of Biscay is very close to the margincompared to the other study sites. Parra et al.[1998, 1999] have determined a mean "Nd valueof around −10 for sediments along the margin ofthe Bay of Biscay which is more radiogenic thandeep water in the Bay of Biscay. Consequently,for this deepest water mass boundary exchangescould induce a slight modification of the Nd iso-topic composition.
5.2. Significance of the ɛNdof Deep‐Sea Corals[30] For all deep‐sea corals that were analyzed inthis study, Mn/Ca and Nd/Ca ratios are sufficientlylow, implying that Nd isotopic compositions rep-resent those of the deep‐sea coral skeletal aragonite[Copard et al., 2010]. In general, the Nd isotopiccompositions of modern deep‐sea corals (L. pertusa,D. dianthus and M. oculata) investigated in thispresent study are similar to the Nd isotopic compo-sition for seawater (Figure 4b), confirming the results
GeochemistryGeophysicsGeosystems G3G3 COPARD ET AL.: ND ISOTOPIC COMPOSITION OF WATER MASSES 10.1029/2011GC003529
10 of 14

of previous studies [Copard et al., 2010; van deFlierdt et al., 2010] that demonstrated that deep‐sea corals reliably record the Nd isotopic composi-tion of ambient seawater. Several fossil and undateddeep‐sea corals display a Nd isotopic compositionthat differs from seawater suggesting a modificationof the "Nd seawater through time (Figure 4).
[31] In Figure 6, "Nd values of dated deep‐seacorals are plotted against time for the Bay ofBiscay. Three corals located at the depth of theMSW present "Nd values that differ from modernday seawater (Figure 6). These corals are dated at1506 ± 37 (504 AD), 508 ± 32 (1502 AD) and 226± 32 (1784 AD) years. 504 AD corresponds to theDark Ages Period (450–650 AD [Keigwin andPickart, 1999; Mikkelsen and Kuijpers, 2001]).Ages of 1502 AD and 1784 AD corresponds to theLittle Ice Age (LIA) [Kuijpers et al., 2009;deMenocal et al., 2000; Cronin et al., 2003; Mannet al., 2009]. The Dark Ages Period and the LIAare characterized by colder atmospheric tempera-tures over Europe and by colder sea surface tem-peratures over the high latitude of the NorthAtlantic than today.
[32] The first hypothesis that could be proposed toexplain the observed variation in fossil deep‐seacorals "Nd is a significant change of the Nd iso-topic composition of the water masses that mix atthe water depth of the MSW. This would implyactive boundary exchange [Lacan and Jeandel,2005a] and a rapid modification of the Nd isoto-pic composition of sediment deposit along the
European margin. However, it is not reasonable topostulate that the Nd isotopic compositions of theEuropean margin sediments have changed drasti-cally over the last 1500 years because the sedi-mentary sources of the Bay of Biscay arecharacterized by similar Nd isotopic compositions[Parra et al., 1998, 1999]. In addition, it has alsobeen shown that unradiogenic eolian dust inputfrom North Africa ("Nd −11 to −12 [Groussetet al., 1998]) has a negligible contribution to theNd isotopic signature of the intermediate watermasses along the Iberian margin [Stumpf et al., 2010].Consequently, dissolved/particulate exchanges ofsediments from the continental margin or eoliandust and seawater cannot explain the seawater "Ndvariations of the last 1500 years.
[33] Several studies have indicated that in the NorthAtlantic, the "Nd of the main water masses hasremained nearly constant through time in spite oflarge changes in the deepwater convection patternsover glacial/interglacial periods [Foster et al.,2007; van de Flierdt et al., 2006]. Recently,Arsouze et al. [2008], using a Global Ocean Cir-culation Model, suggested a minor difference of atleast +0.5 "Nd during the Last Glacial Maximum(LGM) for northern deepwater formation, inducedby sea level changes and the presence of an icesheet over Hudson Bay, preventing boundaryexchange and reducing contact with the very neg-ative "Nd values of the continental margin duringthe LGM [Jeandel et al., 2007]. However, over thelast 1500 years, such modifications of the paleo-
Figure 6. Variations in "Nd versus time (years AD) for deep‐sea corals, located between 535 and 950 m depth,investigated in this study. The yellow horizontal band corresponds to the actual Nd isotopic composition range ofthe MSW in the Bay of Biscay and off the coast of Iberia.
GeochemistryGeophysicsGeosystems G3G3 COPARD ET AL.: ND ISOTOPIC COMPOSITION OF WATER MASSES 10.1029/2011GC003529
11 of 14
geography did not occur. Hence, it is plausible toassume that the "Nd values of various NorthAtlantic water masses must have remained nearlyidentical to modern values. Furthermore, the "Ndvalues of MOW have most likely remained con-stant during the last 20 000 years [Stumpf et al.,2010] and beyond [Muiños et al., 2008; Khélifiet al., 2009].
[34] From the above consideration, the seawater"Nd record of the last 1500 years suggests that coldperiods, such as the Dark Ages Period and LittleIce Age may have been marked by changes inmiddepth oceanic circulation with significant var-iations of the water mass balance along the WesternEuropean margin. Thus, the observed moderatedecrease in seawater "Nd could be induced by aweakening influence of MOW at intermediatedepth along the European margin during those timeintervals (Figure 6).
[35] Variability in the extend of the northwardpenetration of MOW has also been suggested byLozier and Stewart [2008] for Rockall Trough,which is located further North. During the last50 years, they observed variable northward pene-tration of MSW due to variations in the eastwardextension of the middepth subpolar gyre correlatedwith changes in the NAO index. During periods ofpositive NAO index, they shown reduced MSWpenetration into Rockall Trough induced by agreater eastward extension of the middepth sub-polar gyre. Conversely, during periods of negativeNAO, the subpolar gyre was confined to the WestAtlantic, allowing MSW to penetrate further north,past Porcupine Bank and into Rockall Trough.
[36] Variations in the "Nd values of deep‐sea coralsfrom the Bay of Biscay that are due to an apparentweaker influence of MOW may be linked to theintermittent penetration of MSW into the RockallTrough, illustrated by Lozier and Stewart [2008].Thus, a greater eastward extension of the middepthsubpolar gyre may also affect the hydrology of theBay of Biscay by limiting the northward inflowof the MOW during the Dark Ages and the LittleIce Age. However, past reconstructions of thedynamics of the middepth subpolar gyre need to befurther documented over the last 1500 years toconfirm this hypothesis. In addition, a modificationin the northward penetration of MSW along theEuropean margin is not necessarily the onlyexplanation for the decrease in the Nd isotopiccomposition of fossil deep‐sea corals. Indeed, theproduction of MOW may have varied through time
in relation to a modification of deepwater produc-tion in the Mediterranean Sea. However, suchvariations in the production of Mediterranean Seadeep water during the last 1500 years is unknownand requires further investigation.
6. Conclusion
[37] The Nd isotopic composition analyzed in thisstudy, for two seawater profiles, off the IberianPeninsula and in the Bay of Biscay, display "Ndvalues for ENACW of −12.0 off the coast ofPortugal and −11.7 in the Bay of Biscay. At depthscorresponding to MSW, between 800 and 1200 m,"Nd values increase to −10.9/−11.2 which arehigher than the "Nd of MOW at the exit of the straitof Gibraltar (−9.4). This suggests a strong dilutionof this water mass by approximately 60–70% alongits northward circulation, essentially with sur-rounding ENACW. Around 2000 m depth, the "Ndvalues decrease to −13, suggesting an influenceof LSW, originating from the Labrador Sea. Atgreater depth, Nd isotopic compositions indicatethe presence of another water mass (LDW), with amore radiogenic "Nd value, flowing Northwardfrom the South Atlantic.
[38] The Nd isotopic composition of deep‐seacorals (L. pertusa, D. dianthus and M. oculata)collected along the Western European marginpresent values similar to seawater and confirm thecapacity for deep‐sea corals to be used as a tracerof past oceanic circulation, as shown by Copardet al. [2010] and van de Flierdt et al. [2010].Furthermore, during cold periods such as the DarkAges and the Little Ice Age, fossil deep‐sea coralshighlight moderate but significantly lower "Ndvalues compared to present seawater "Nd valuesat the depth of MSW. This suggests that cooling inthe Northern Hemisphere results in a weakeningnorthward penetration of warm and saline Medi-terranean water along the European margin. Thisreduced influence of MOW in the Bay of Biscaymay be due to a greater eastward extension of themiddepth subpolar gyre, as suggested by Lozierand Stewart [2008] for Rockall Trough and forthe past decades and/or it may also reflect a mod-ification of MOW export in relation to a weakeningof Mediterranean deepwater formation. Furtherinvestigations are needed to establish more accu-rately resolved temporal records to prove a linkbetween climate and the northward propagation ofMOW along the Western European margin.
GeochemistryGeophysicsGeosystems G3G3 COPARD ET AL.: ND ISOTOPIC COMPOSITION OF WATER MASSES 10.1029/2011GC003529
12 of 14

Acknowledgments
[39] We specially thank Martin Frank and an anonymousreviewer for their constructive reviews, which significantlyhelped to improve this work. This work was funded throughthe French Agence National de Recherche projet (NEWTON:ANR‐Blanc06‐1‐139504), the French Centre National dela Recherche Scientifique (CNRS) and the Commisariat àl’Energie Atomique (CEA). We thank IPEV (Institut PolaireEmile Victor), the members and crew of the CAROLS cruiseand Ovide cruise for their excellent work recovering deep‐seacorals. In addition, we are grateful to Hans Pirlet who provideddeep‐sea coral from Gascogne. We further thank Eline Sallé,Claude Noury, Aliénor Lavergne and Louise Bordier for theirsupport with U series dating and clean laboratory management.This is LSCE contribution 4609.
References
Aït‐Ameur, N. C., and C. Goyet (2006), Distribution andtransport of natural and anthropogenic CO2 in the Gulf ofCadiz, Deep Sea Res., Part II, 53, 1329–1343, doi:10.1016/j.dsr2.2006.04.003.
Arsouze, T., J.‐C. Dutay, M. Kageyama, F. Lacan, R. Alkama,O. Marti, and C. Jeandel (2008), A modelling sensitivitystudy of the influence of the Atlantic meridional overturningcirculation on neodymium isotopic composition at the LastGlacial Maximum, Clim. Past, 4, 191–203, doi:10.5194/cp-4-191-2008.
Burton, K. W., and D. Vance (2000), Glacial‐interglacial var-iations in the neodymium isotope composition of seawater inthe Bay of Bengal recorded by planktonic foraminifera,Earth Planet. Sci. Lett., 176, 425–441, doi:10.1016/S0012-821X(00)00011-X.
Cheng, H., R. L. Edwards, J. Ho, C. D. Gallup, D. A. Richards,and Y. Asmeron (2000), The half‐lives of uranium‐234 andthorium‐230, Chem. Geol., 169, 17–33, doi:10.1016/S0009-2541(99)00157-6.
Colin, C., N. Frank, K. Copard, and E. Douville (2010), Neo-dymium isotopic composition of deep‐sea corals from theNE Atlantic: Implications for past hydrological changesduring the Holocene, Quat. Sci. Rev., 29, 2509–2517,doi:10.1016/j.quascirev.2010.05.012.
Copard, K., C. Colin, E. Douville, A. Freiwald, G. Gudmunds-son, B. de Mol, and N. Frank (2010), Nd isotopes in deep‐sea corals in the North‐eastern Atlantic, Quat. Sci. Rev.,29, 2499–2508, doi:10.1016/j.quascirev.2010.05.025.
Cronin, T. M., G. S. Dwyer, T. Kamiya, S. Schwede, andD. A. Willard (2003), Medieval Warm Period, Little IceAge and 20th century temperature variability from Chesa-peake Bay, Global Planet. Change, 36, 17–29, doi:10.1016/S0921-8181(02)00161-3.
deMenocal, P., J. Joseph Ortiz, T. Guilderson, and M. MichaelSarnthein (2000), Coherent high‐ and low‐latitude climatevariability during the Holocene warm period, Science, 288,2198–2202, doi:10.1126/science.288.5474.2198.
Forner, S. (2005), Utilisation des CFC et du CCL4 dans l’étudede la circulation profonde de l’Atlantique Nord, M.S. thesis,Univ. de Bretagne Occidentale, Brest, Fr.
Foster, G. L., D. Vance, and J. Prytulak (2007), No change inthe neodymium isotope composition of deep water exportedfrom the North Atlantic on glacial‐interglacial time scales,Geology, 35, 37–41, doi:10.1130/G23204A.1.
Frank, N., M. Paterne, L. Ayliffe, T. Van Weering, J.‐P. Henriet,and D. Blamart (2004), Eastern North Atlantic deep‐sea corals:Tracing upper intermediate water D14C during the Holocene,Earth Planet. Sci. Lett., 219, 297–309, doi:10.1016/S0012-821X(03)00721-0.
Grousset, F. E., M. Parra, A. Bory, P. Martinez, P. Bertand,G. Shimmield, and R. M. Ellam, (1998), Saharan windregimes traced by the Sr‐Nd isotopic compositions of thesubtropical Atlantic sediments: Last Glacial Maximum vstoday, Quat. Sci. Rev., 17, 395–409, doi:10.1016/S0277-3791(97)00048-6.
Jacobsen, S. B., and G. J. Wasserburg (1980), Sm‐Nd isotopicevolution of chondrites, Earth Planet. Sci. Lett., 50, 139–155,doi:10.1016/0012-821X(80)90125-9.
Jeandel, C. (1993), Concentration and isotopic composition ofNd in the South Atlantic Ocean, Earth Planet. Sci. Lett., 117,581–591, doi:10.1016/0012-821X(93)90104-H.
Jeandel, C., T. Arsouze, F. Lacan, P. Techine, and J.‐C. Dutay(2007), Isotopic Nd compositions and concentrations of thelithogenic inputs into the ocean: A compilation, with anemphasis on the margins, Chem. Geol., 239, 156–164,doi:10.1016/j.chemgeo.2006.11.013.
Keigwin, L. D., and R. S. Pickart (1999), Slope water currentover the Laurentian Fan on interannual to millennial time scales,Science, 286, 520–523, doi:10.1126/science.286.5439.520.
Khélifi, N., M. Sarnthein, N. Andersen, T. Blanz, M. Frank,D. Garbe‐Schönberg, B. A. Haley, R. Stumpf, andM.Weinelt(2009), A major and long‐term Pliocene intensification ofthe Mediterranean Outflow, 3.5–3.3 Ma ago, Geology, 37,811–814, doi:10.1130/G30058A.1.
Kuijpers, A., B. A. Malmgren, and M. S. Seidenkrantz (2009),Termination of the Medieval Warm Period: Linking sub‐polar and tropical North Atlantic circulation changes toENSO, PAGES News, 17, 76–77.
Lacan, F., and C. Jeandel (2001), Tracing Papua New Guineaimprint on the central Equatorial Pacific Ocean using neo-dymium isotopic compositions and Rare Earth Element pat-terns, Earth Planet. Sci. Lett., 186, 497–512, doi:10.1016/S0012-821X(01)00263-1.
Lacan, F., and C. Jeandel (2004a), Denmark Strait water circu-lation traced by heterogeneity in neodymium isotopic com-positions, Deep Sea Res., Part I, 51, 71–82, doi:10.1016/j.dsr.2003.09.006.
Lacan, F., and C. Jeandel (2004b), Subpolar Mode Waterformation traced by neodymium isotopic composition,Geophys. Res. Lett., 31, L14306, doi:10.1029/2004GL019747.
Lacan, F., and C. Jeandel (2005a), Neodymium isotopes as anew tool for quantifying exchange fluxes at the continent‐ocean interface, Earth Planet. Sci. Lett., 232, 245–257,doi:10.1016/j.epsl.2005.01.004.
Lacan, F., and C. Jeandel (2005b), Acquisition of the neodym-ium isotopic composition of the North Atlantic Deep Water,Geochem. Geophys. Geosyst., 6, Q12008, doi:10.1029/2005GC000956.
Louarn, E. (2008), Étude de la variabilité de la circulation desmasses d’eau profondes en Atlantique Nord en relation avecle climat: Utilisation des traceurs transitoires halocarbons,M.S. thesis, 209 pp., Univ. de Bretagne Occidentale, Brest, Fr.
Lozier, M. S., and N. M. Stewart (2008), On the tempo-rally varying northward penetration of MediterraneanOverflow Water and eastward penetration of Labrador SeaWater, J. Phys. Oceanogr., 38, 2097–2103, doi:10.1175/2008JPO3908.1.
Mann, M. E., Z. Zhang, S. Rutherford, R. S. Bradley, M. K.Hughes, D. Shindell, C. Ammann, G. Faluvegi, and F. Ni
GeochemistryGeophysicsGeosystems G3G3 COPARD ET AL.: ND ISOTOPIC COMPOSITION OF WATER MASSES 10.1029/2011GC003529
13 of 14
(2009), Global signatures and dynamical origins of the LittleIce Age and Medieval Climate Anomaly, Science, 326,1256–1260, doi:10.1126/science.1177303.
Mikkelsen, N., and A. Kuijpers (2001), Natural Climate Varia-tions in a Geological Perspective, Gads Forlag, Copenhagen.
Muiños, S. B., M. Frank, C. Maden, J. R. Hein, T. van deFlierdt, S. M. Lebreiro, L. Gaspar, J. H. Monteiro, andA. N. Halliday (2008), New constraints on the Pb and Ndisotopic evolution of NE Atlantic water masses, Geochem.Geophys. Geosyst., 9, Q02007, doi:10.1029/2007GC001766.
Parra, M., H. Trouky, J. M. Jouanneau, F. Grousset, C. Latouche,and P. Castaing (1998), Etude isotopique (Sr‐Nd) de l’originedes dépôts fins holocènes du littoral atlantique (S‐O France),Oceanol. Acta, 21, 631–644, doi:10.1016/S0399-1784(99)80022-X.
Parra, M., P. Castaing, J. M. Jouanneau, F. Grousset, andC. Latouche (1999), Nd‐Sr isotopic composition of present‐day sediments from the Gironde estuary, its drainingbasins and the WestGironde mud patch (SW France), Cont.Shelf Res., 19, 135–150.
Piepgras, D. J., and G. J. Wasserburg (1983), Influence of theMediterranean outflow on the isotopic composition of Neo-dymium in waters of the North Atlantic, J. Geophys. Res.,88, 5997–6006, doi:10.1029/JC088iC10p05997.
Piepgras, D. J., and G. J. Wasserburg (1987), Rare Earth ele-ment transport in the western North Atlantic inferred fromNd isotopic observations, Geochim. Cosmochim. Acta, 51,1257–1271, doi:10.1016/0016-7037(87)90217-1.
Piotrowski, A. M., S. L. Goldstein, S. R. Hemming, and R. G.Fairbanks (2004), Intensification and variability of oceanthermohaline circulation through the last deglaciation, EarthPlanet. Sci. Lett., 225, 205–220, doi:10.1016/j.epsl.2004.06.002.
Piotrowski, A. M., S. L. Goldstein, S. R. Hemming, and R. G.Fairbanks (2005), Temporal Relationships of carbon cyclingand ocean circulation at glacial boundaries, Science, 307,1933–1938, doi:10.1126/science.1104883.
Rhein, M., and H. H. Hinrichsen (1993), Modification ofMediterranean Water in the Gulf of Cadiz, studied withhydrographic, nutrient and chlorofluoromethane data, DeepSea Res., Part I, 40, 267–291, doi:10.1016/0967-0637(93)90004-M.
Rickli, J., M. Frank, and A. N. Halliday (2009), The hafnium‐neodymium isotopic composition of Atlantic seawater, EarthPlanet. Sci. Lett., 280, 118–127, doi:10.1016/j.epsl.2009.01.026.
Spivack, A. J., and G. J. Wasserburg (1988), Neodymiumisotopic composition of the Mediterranean outflow and theeastern North Atlantic, Geochim. Cosmochim. Acta, 52,2767–2773, doi:10.1016/0016-7037(88)90144-5.
Stumpf, R., M. Frank, J. Schönfeld, and B. A. Haley (2010),Late Quaternary variability of Mediterranean Outflow Waterfrom radiogenic Nd and Pb isotopes, Quat. Sci. Rev., 29,2462–2472, doi:10.1016/j.quascirev.2010.06.021.
Tachikawa, K., V. Athias, and C. Jeandel (2003), Neodymiumbudget in the modern ocean and paleo‐oceanographic impli-cations, J. Geophys. Res., 108(C8), 3254, doi:10.1029/1999JC000285.
Tachikawa, K., M. Roy‐Barman, A. Michard, D. Thouron,D. Yeghicheyan, and C. Jeandel (2004), Neodymium iso-topes in the Mediterranean Sea: Comparison between sea-water and sediment signals, Geochim. Cosmochim. Acta,68, 3095–3106, doi:10.1016/j.gca.2004.01.024.
van Aken, H. M. (2000), The hydrography of the mid‐latitudenortheast Atlantic Ocean: I: The deep water masses, DeepSea Res., Part I, 47, 757–788, doi:10.1016/S0967-0637(99)00092-8.
Vance, D., and K. Burton (1999), Neodymium isotopes inplanktonic foraminifera: A record of the response of conti-nental weathering and ocean circulation rates to climatechange, Earth Planet. Sci. Lett., 173, 365–379, doi:10.1016/S0012-821X(99)00244-7.
van de Flierdt, T., L. F. Robinson, J. F. Adkins, S. R. Hemming,and S. L. Goldstein (2006), Temporal stability of the neo-dymium isotope signature of the Holocene to glacial NorthAtlantic, Paleoceanography, 21, PA4102, doi:10.1029/2006PA001294.
van de Flierdt, T., L. F. Robinson, and J. F. Adkins (2010),Deep‐sea corals aragonite as a recorder for the neodymiumisotopic composition of seawater, Geochim. Cosmochim.Acta, 74, 6014–6032, doi:10.1016/j.gca.2010.08.001.
Vogler, S., J. Scholten, M. Rutgers van der Loeff, and A. Mangini(1998), 230Th in the eastern North Atlantic: The importance ofwater mass ventilation in the balance of 230Th, Earth Planet.Sci. Lett., 156, 61–74, doi:10.1016/S0012-821X(98)00011-9.
GeochemistryGeophysicsGeosystems G3G3 COPARD ET AL.: ND ISOTOPIC COMPOSITION OF WATER MASSES 10.1029/2011GC003529
14 of 14


![BIOINF4120&& Bioinformacs 2 - uni-tuebingen.deabi.inf.uni-tuebingen.de/Teaching/Old/SS12/BI2/slides/BI2_SS12_17... · Amino&Acid&Masses& AA Chemical formula Mono-isotopic [Da] Average](https://static.fdocuments.us/doc/165x107/5abdf0b87f8b9a7e418c4a15/bioinf4120-bioinformacs-2-uni-aa-chemical-formula-mono-isotopic-da-average.jpg)