
Islamic University-Gazaىا ز خقذىا زس ( غيث ث ز خ اسضىا دبزبس ىا غ غ ص...
115
Transcript of Islamic University-Gazaىا ز خقذىا زس ( غيث ث ز خ اسضىا دبزبس ىا غ غ ص...
Islamic University-Gaza
Deanship of Post Graduate Studies
Faculty of Engineering
Master of Infrastructure Program
Prospect of Water Desalination on the Light of Current
and Future Water Consumption Behavior:
Khan Younis Governorate as a Case Study
By
Yousef Shaheen
BSc. In Civil Engineering
Infrastructure M.Sc program
Supervisor
Dr. Husam Al-Najar
Assistant Professor
Depatrment Of Environmental Engineering
A Thesis submitted in partial Fulfillment of the Requirement for the Degree of
Master in Civil Engineering – Infrastructure
May, 2014

ABSTRACT
I
ABSTRACT
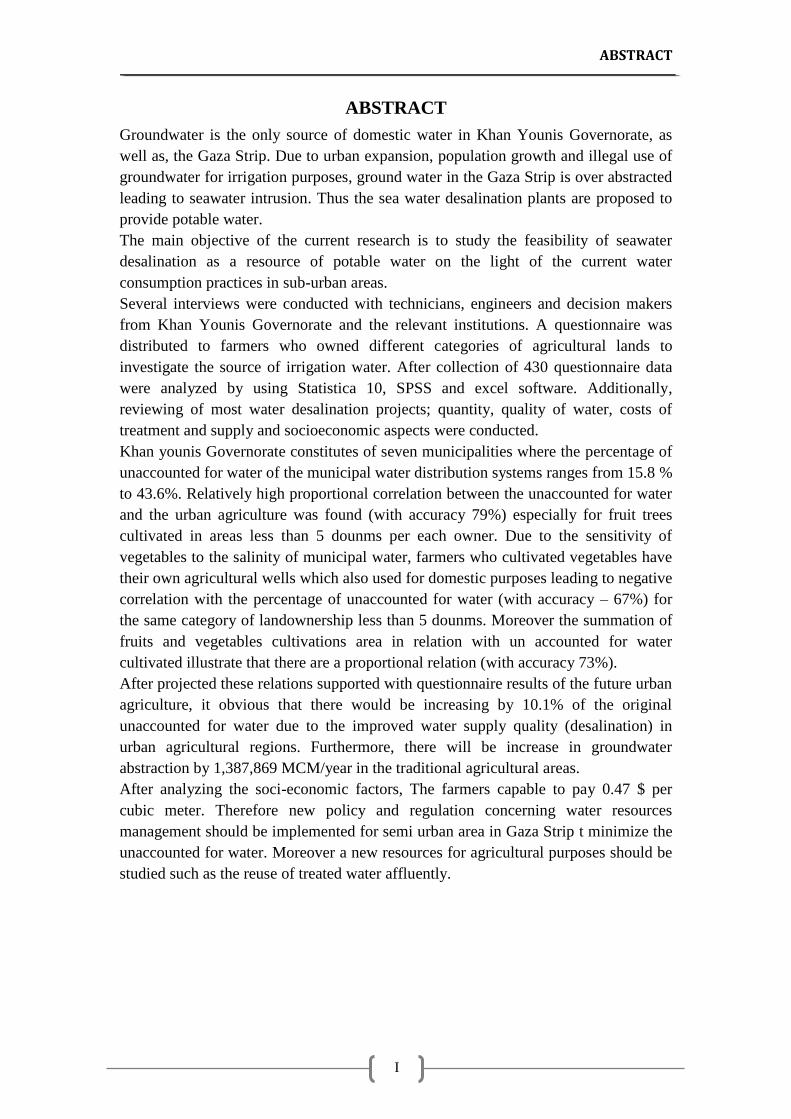
Groundwater is the only source of domestic water in Khan Younis Governorate, as
well as, the Gaza Strip. Due to urban expansion, population growth and illegal use of
groundwater for irrigation purposes, ground water in the Gaza Strip is over abstracted
leading to seawater intrusion. Thus the sea water desalination plants are proposed to
provide potable water.
The main objective of the current research is to study the feasibility of seawater
desalination as a resource of potable water on the light of the current water
consumption practices in sub-urban areas.
Several interviews were conducted with technicians, engineers and decision makers
from Khan Younis Governorate and the relevant institutions. A questionnaire was
distributed to farmers who owned different categories of agricultural lands to
investigate the source of irrigation water. After collection of 430 questionnaire data
were analyzed by using Statistica 10, SPSS and excel software. Additionally,
reviewing of most water desalination projects; quantity, quality of water, costs of
treatment and supply and socioeconomic aspects were conducted.
Khan younis Governorate constitutes of seven municipalities where the percentage of
unaccounted for water of the municipal water distribution systems ranges from 15.8 %
to 43.6%. Relatively high proportional correlation between the unaccounted for water
and the urban agriculture was found (with accuracy 79%) especially for fruit trees
cultivated in areas less than 5 dounms per each owner. Due to the sensitivity of
vegetables to the salinity of municipal water, farmers who cultivated vegetables have
their own agricultural wells which also used for domestic purposes leading to negative
correlation with the percentage of unaccounted for water (with accuracy – 67%) for
the same category of landownership less than 5 dounms. Moreover the summation of
fruits and vegetables cultivations area in relation with un accounted for water
cultivated illustrate that there are a proportional relation (with accuracy 73%).
After projected these relations supported with questionnaire results of the future urban
agriculture, it obvious that there would be increasing by 10.1% of the original
unaccounted for water due to the improved water supply quality (desalination) in
urban agricultural regions. Furthermore, there will be increase in groundwater
abstraction by 1,387,869 MCM/year in the traditional agricultural areas.
After analyzing the soci-economic factors, The farmers capable to pay 0.47 $ per
cubic meter. Therefore new policy and regulation concerning water resources
management should be implemented for semi urban area in Gaza Strip t minimize the
unaccounted for water. Moreover a new resources for agricultural purposes should be
studied such as the reuse of treated water affluently.
البحث ملخص
II
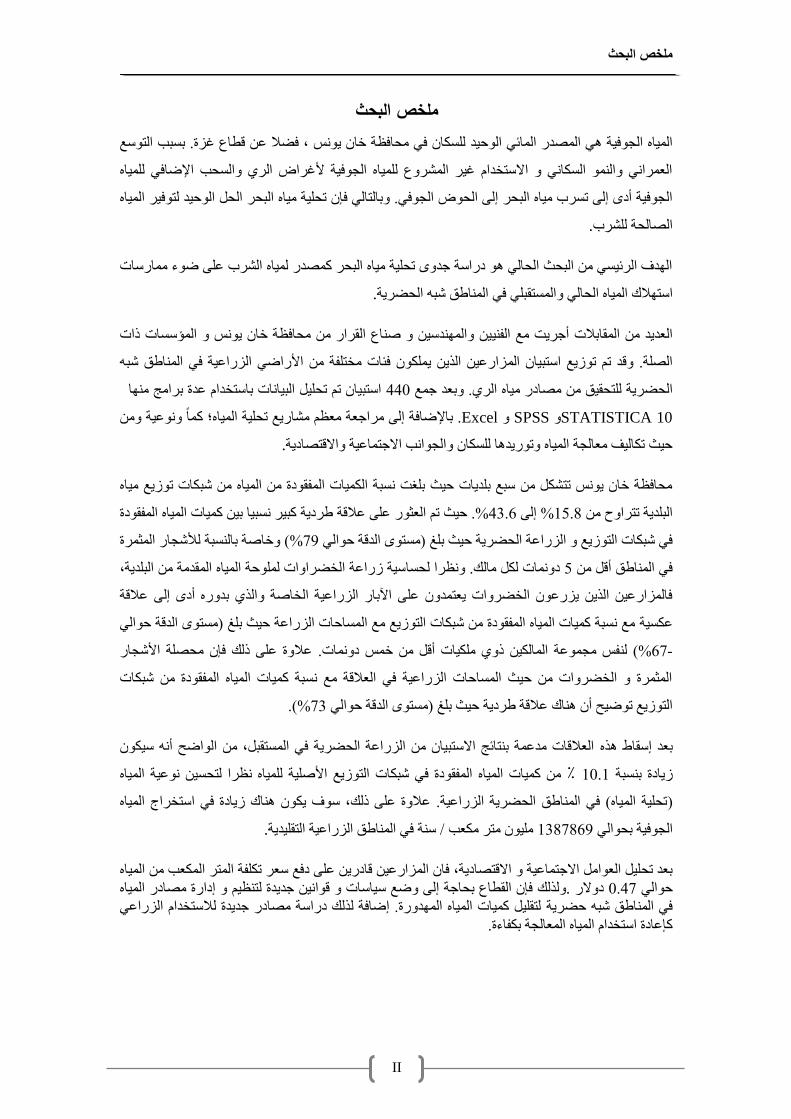
ملخص البحثىيسنب ف سبفظخ خب س ، فضال ػ قطبع غضح. ثسجت اىزسغ اىزذ اىب اىدفخ اىصذس اىبئ
اىؼشا اى اىسنب االسزخذا غش اىششع ىيب اىدفخ ألغشاض اىش اىسست اإلضبف ىيب
ىزفش اىب اىسو اىزذ رسيخ ب اىجسش ئفثبىزبى اىدفخ أد إى رسشة ب اىجسش إى اىسض اىدف.
.اىصبىسخ ىيششة
اىذف اىشئس اىجسث اىسبى دساسخ خذ رسيخ ب اىجسش مصذس ىب اىششة ػي ضء بسسبد
.اىبطق شج اىسضشخف اىسزقجياسزالك اىب اىسبى
اىذس صبع اىقشاس سبفظخ خب س اىؤسسبد راد اىؼذذ اىقبثالد أخشذ غ اىف
ضاسػ اىز ين فئبد خزيفخ األساض اىضساػخ ف اىبطق شج اىاىصيخ. قذ ر رصغ اسزجب
ب اسزجب ر رسيو اىجببد ثبسزخذا ػذح ثشاح 440صبدس ب اىش. ثؼذ خغ اىسضشخ ىيزسقق
STATISTICA 10 SPSS Excel ثبإلضبفخ إى شاخؼخ ؼظ شبسغ رسيخ اىب؛ مب ػخ .
.زث رنبىف ؼبىدخ اىب رسذب ىيسنب اىدات االخزبػخ االقزصبدخ
صغ ب سبفظخ خب س رزشنو سجغ ثيذبد زث ثيغذ سجخ اىنبد اىفقدح اىب شجنبد ر
مجش سجب ث مبد اىب اىفقدح خطشد ػالقخ%. زث ر اىؼثس ػي 43.6% إى 15.8اىجيذخ رزشاذ
خبصخ ثبىسجخ ىألشدبس اىثشح %(79)سز اىذقخ زاى ف شجنبد اىزصغ اىضساػخ اىسضشخ زث ثيغ
سخ صساػخ اىخضشااد ىيزخ اىب اىقذخ اىجيذخ، دبد ىنو بىل. ظشا ىسسب 5ف اىبطق أقو
اىز ثذس أد إى ػالقخ فبىضاسػ اىز ضسػ اىخضشاد ؼزذ ػي اثبس اىضساػخ اىخبصخ
)سز اىذقخ زاى زث ثيغ غ سجخ مبد اىب اىفقدح شجنبد اىزصغ غ اىسبزبد اىضساػخ ػنسخ
فس دػخ اىبىن ر ينبد أقو خس دبد. ػالح ػي رىل فئ سصيخ األشدبس ى %(67-
اىثشح اىخضشاد زث اىسبزبد اىضساػخ ف اىؼالقخ غ سجخ مبد اىب اىفقدح شجنبد
.%(73)سز اىذقخ زاى زث ثيغ اىزصغ رضر أ بك ػالقخ طشدخ
ن س اىؼالقبد ذػخ ثزبئح االسزجب اىضساػخ اىسضشخ ف اىسزقجو، اىاضر أثؼذ إسقبط ز
اىب ٪ مبد اىب اىفقدح ف شجنبد اىزصغ األصيخ ىيب ظشا ىزسس ػخ 10.1صبدح ثسجخ
ك صبدح ف اسزخشاج اىب رسيخ اىب( ف اىبطق اىسضشخ اىضساػخ. ػالح ػي رىل، سف ن ب)
.ي زش نؼت / سخ ف اىبطق اىضساػخ اىزقيذخ 1387869اىدفخ ثساى
اىب نؼتاىزش اىسؼش رنيفخ فب اىضاسػ قبدس ػي دفغ ثؼذ رسيو اىؼاو االخزبػخ االقزصبدخ،
بسبد قا خذذح ىزظ إداسح صبدس اىب فئ اىقطبع ثسبخخ إى ضغ س ىزىل .دالس 0.47زاى
ىزقيو مبد اىب اىذسح. إضبفخ ىزىل دساسخ صبدس خذذح ىالسزخذا اىضساػ ف اىبطق شج زضشخ
مئػبدح اسزخذا اىب اىؼبىدخ ثنفبءح.

Dedication
III
Dedication
This research is dedicated to:
The spirit of my father and my uncle…
My mother for her prays, love and continuous sacrifices …
My brothers and sisters…
My family for their encouragements …
All of my friends and colleagues…
Acknowledgements
IV
Acknowledgements
All admirations and glory are due to ALLAH for the entire support
granted to me. This effort would not be achieved without God‘s limitless
guidance and support.
I would like to express my deep gratitude to my supervisor (Dr. Husam
Al-Najar)for his encouragement, continuous support, fruitful assistance
and vision which inspired me in accomplishing this research.
I would like to express my grateful appreciation and thanks to everyone
who gave me support to bring this research to light. Especially Coastal
Municipalities Water Utility (CMWU) and Ministry of Agriculture
(MOA), Agricultural Directorate of Khan Younis, Khan Younis
governorate and the municipalities of Khan Younis, Bani Sohaella,
Abassan Kabera, AL-Qarara, Khozaa, Abassan Saghera and AL-
Foukhariy. This gratitude is for their generosity and kindness to provide
me with their time and all the necessary information and discussions
which helped me a lot in achieving this work.
My appreciation is also extended to the (IUG) for giving me the
opportunity to carry out this study. Furthermore, great thanks are also to
my colleagues and lecturers in the Engineering Faculty and the Civil
Engineering Department in particular for their continuous encouragement
and support.
Also, I could not forget the role of my friends for their help,
encouragement, constructive and positive feedback.
Finally, my deepest appreciations are to my parent, brothers, sisters and
family for their full support, encouragement, and patience that give me
the power to go on.
Contents
V
Contents
Subject
Page
No.
ABSTRACT I
اىجسث يخص II
Dedication III
Acknowledgements IV
Contents V
List of Tables IX
List of Figures X
List of Annexes XII
List of Abbreviations and Acronyms XIII
Chapter 1: Introduction 1-4
1.1 Problem Statement 2
1.2 Goal and Objectives 3
1.3 Structure of the Thesis 4
Chapter 2: Literature Review 5-14
2.1 Introduction 6
2.2 Ground Water Beneath the Gaza Strip 6
2.3 Agriculture in the Gaza Strip 9
2.4 Desalination the Proposed New Source of Water 10
2.4.1 Existing Desalination Plants in the Gaza Strip 11
2.4.2 Proposed Gaza Sea Water Desalination Plant 11
2.4.3 Cost of Cubic Meter of Desalinated Water 12
2.5 Un-accounted for Water 13
2.5.1 Acceptable levels of Water Loss 14
Chapter 3: Study Area and Research Methodology 15-25
3.1.1. Location of Khan Younis Governorate 16
3.1.2. Land Use 17
3.1.3. Rainfall of Khan Younis Governorate 18
3.1.4. Khan Younis Governorate Water Distribution System Situation 19
3.2. Research Methodology 19
3.2.1. Data Collection 19
Contents
VI
Subject
Page
No.
3.2.2. Metrological Data 19
3.2.3. Field Survey 20
3.2.3.1. Data Collection by Inspection 20
3.2.3.2. Interview Data Collection 20
3.2.3.3. Khan Younis Water Resource, Water Distribution Network and
Meter Reading 20
3.2.4. Questionnaire Design 21
3.2.4.1. Water Distribution Zones in Khan Younis 21
3.2.4.2. Sample Size and Distribution Along Khan Younis Governorate 22
3.2.4.3. Questionnaire Analysis with Software Program 24
3.2.4.4. Expected Water Losses After the Sea Water Desalination plant 25
3.2.4.5. Cost Analysis on The Light of UFW 25
Chapter 4: Results & Discussion 26-70
4.1. Introduction 27
4.2. Khan Younis Water Distribution System 27
4.2.1. Operating of Khan Younis Water Distribution System 30
4.2.1.1. Operating Criteria 30
4.3. Water Production & Meter Readings in Khan Younis
Governorate 31
4.3.1. Water Supply 31
4.3.2. Water Distribution Zone in Khan Younis Governorate: 32
4.3.2.1. Direct Supply from Wells 33
4.3.2.2. Water Tanks Supply 33
4.3.3. Water meter readings 34
4.3.4. Water Production vs. Meter Reading 35
4.3.5. Water Distribution System Efficiency 36
4.3.6. Water Per Capita in Khan Younis Governorate (2013) 38
4.4. Current Urban Agriculture Activities System 39
4.4.1. Khan Younis Municipality 42
4.4.2. Bani Sohaella Municipality 44
4.4.3. Abassan Kabera Municipality 47
4.4.4. AL-Qarara Municipality 49
Contents
VII
Subject
Page
No.
4.4.5. Khozaa Municipality 51
4.4.6. Abassan Saghera Municipality 53
4.4.7. AL-Foukhariy Municipality 55
4.5. The Relation Between Urban Agriculture Area & the UFW 56
4.6. Future of Water Losses After Desalination Process 61
4.7. Future of Urban Agriculture Requirements After Desalination
Process 65
4.8. Soci-Economic Analysis 66
Chapter 5: Conclusion & Recommendations 71-75
5.1. Conclusion 72
5.2. Recommendations: 75
References 76
Annexes 82
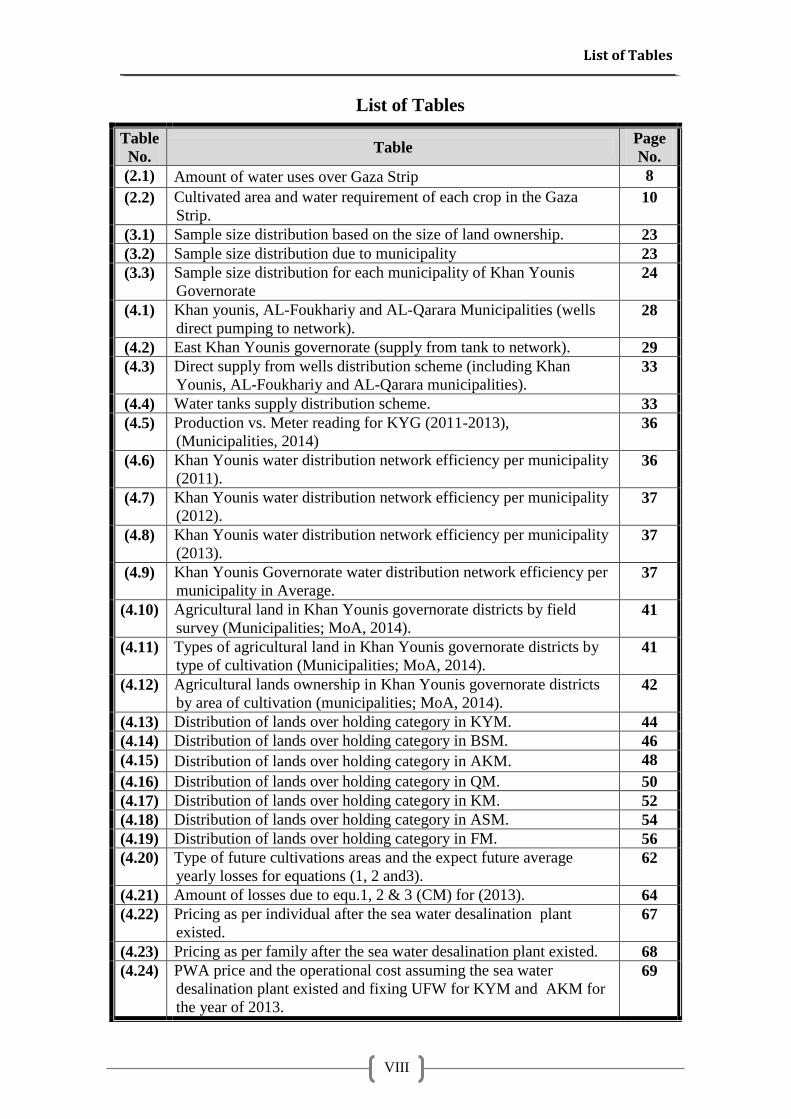
List of Tables
VIII
List of Tables
Table
No. Table
Page
No.
(2.1) Amount of water uses over Gaza Strip 8
(2.2) Cultivated area and water requirement of each crop in the Gaza
Strip. 10
(3.1) Sample size distribution based on the size of land ownership. 23
(3.2) Sample size distribution due to municipality 23
(3.3) Sample size distribution for each municipality of Khan Younis
Governorate 24
(4.1) Khan younis, AL-Foukhariy and AL-Qarara Municipalities (wells
direct pumping to network). 28
(4.2) East Khan Younis governorate (supply from tank to network). 29
(4.3) Direct supply from wells distribution scheme (including Khan
Younis, AL-Foukhariy and AL-Qarara municipalities). 33
(4.4) Water tanks supply distribution scheme. 33
(4.5) Production vs. Meter reading for KYG (2011-2013),
(Municipalities, 2014) 36
(4.6) Khan Younis water distribution network efficiency per municipality
(2011). 36
(4.7) Khan Younis water distribution network efficiency per municipality
(2012). 37
(4.8) Khan Younis water distribution network efficiency per municipality
(2013). 37
(4.9) Khan Younis Governorate water distribution network efficiency per
municipality in Average. 37
(4.10) Agricultural land in Khan Younis governorate districts by field
survey (Municipalities; MoA, 2014). 41
(4.11) Types of agricultural land in Khan Younis governorate districts by
type of cultivation (Municipalities; MoA, 2014). 41
(4.12) Agricultural lands ownership in Khan Younis governorate districts
by area of cultivation (municipalities; MoA, 2014). 42
(4.13) Distribution of lands over holding category in KYM. 44
(4.14) Distribution of lands over holding category in BSM. 46
(4.15) Distribution of lands over holding category in AKM. 48
(4.16) Distribution of lands over holding category in QM. 50
(4.17) Distribution of lands over holding category in KM. 52
(4.18) Distribution of lands over holding category in ASM. 54
(4.19) Distribution of lands over holding category in FM. 56
(4.20) Type of future cultivations areas and the expect future average
yearly losses for equations (1, 2 and3). 62
(4.21) Amount of losses due to equ.1, 2 & 3 (CM) for (2013). 64
(4.22) Pricing as per individual after the sea water desalination plant
existed. 67
(4.23) Pricing as per family after the sea water desalination plant existed. 68
(4.24) PWA price and the operational cost assuming the sea water
desalination plant existed and fixing UFW for KYM and AKM for
the year of 2013.
69
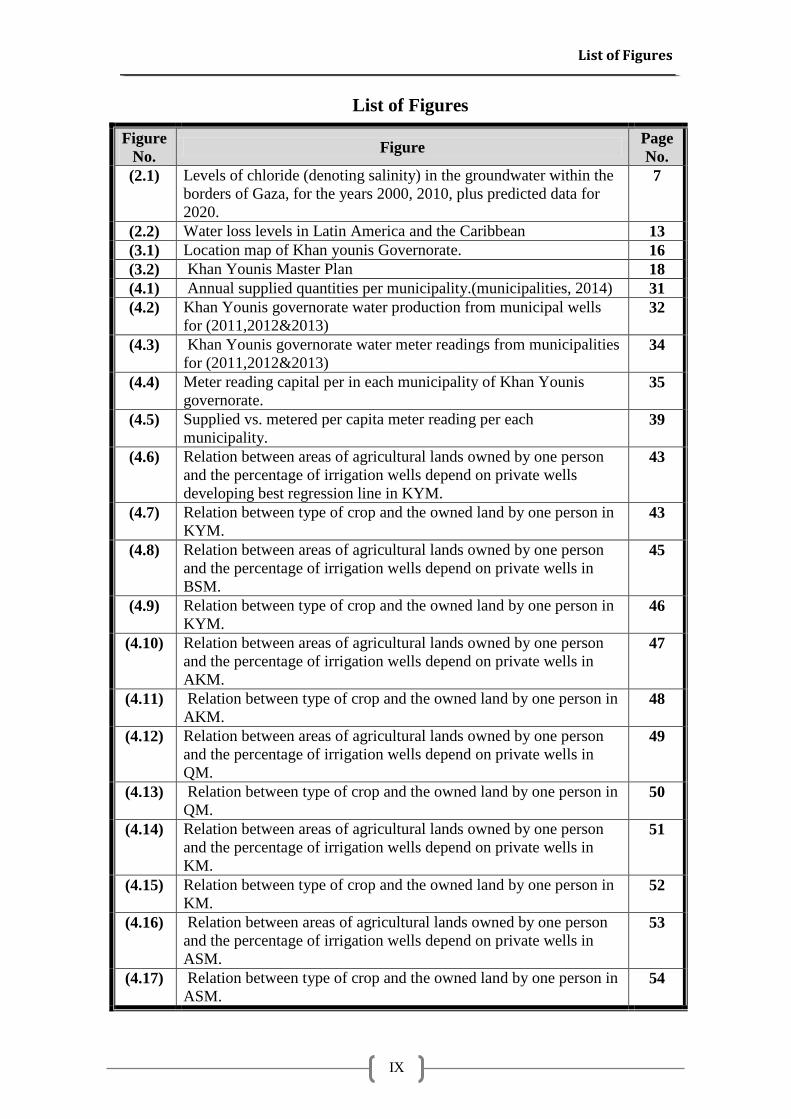
List of Figures
IX
List of Figures
Figure
No. Figure
Page
No.
(2.1) Levels of chloride (denoting salinity) in the groundwater within the
borders of Gaza, for the years 2000, 2010, plus predicted data for
2020.
7
(2.2) Water loss levels in Latin America and the Caribbean 13
(3.1) Location map of Khan younis Governorate. 16
(3.2) Khan Younis Master Plan 18
(4.1) Annual supplied quantities per municipality.(municipalities, 2014) 31
(4.2) Khan Younis governorate water production from municipal wells
for (2011,2012&2013) 32
(4.3) Khan Younis governorate water meter readings from municipalities
for (2011,2012&2013) 34
(4.4) Meter reading capital per in each municipality of Khan Younis
governorate. 35
(4.5) Supplied vs. metered per capita meter reading per each
municipality. 39
(4.6) Relation between areas of agricultural lands owned by one person
and the percentage of irrigation wells depend on private wells
developing best regression line in KYM.
43
(4.7) Relation between type of crop and the owned land by one person in
KYM. 43
(4.8) Relation between areas of agricultural lands owned by one person
and the percentage of irrigation wells depend on private wells in
BSM.
45
(4.9) Relation between type of crop and the owned land by one person in
KYM. 46
(4.10) Relation between areas of agricultural lands owned by one person
and the percentage of irrigation wells depend on private wells in
AKM.
47
(4.11) Relation between type of crop and the owned land by one person in
AKM. 48
(4.12) Relation between areas of agricultural lands owned by one person
and the percentage of irrigation wells depend on private wells in
QM.
49
(4.13) Relation between type of crop and the owned land by one person in
QM. 50
(4.14) Relation between areas of agricultural lands owned by one person
and the percentage of irrigation wells depend on private wells in
KM.
51
(4.15) Relation between type of crop and the owned land by one person in
KM. 52
(4.16) Relation between areas of agricultural lands owned by one person
and the percentage of irrigation wells depend on private wells in
ASM.
53
(4.17) Relation between type of crop and the owned land by one person in
ASM. 54
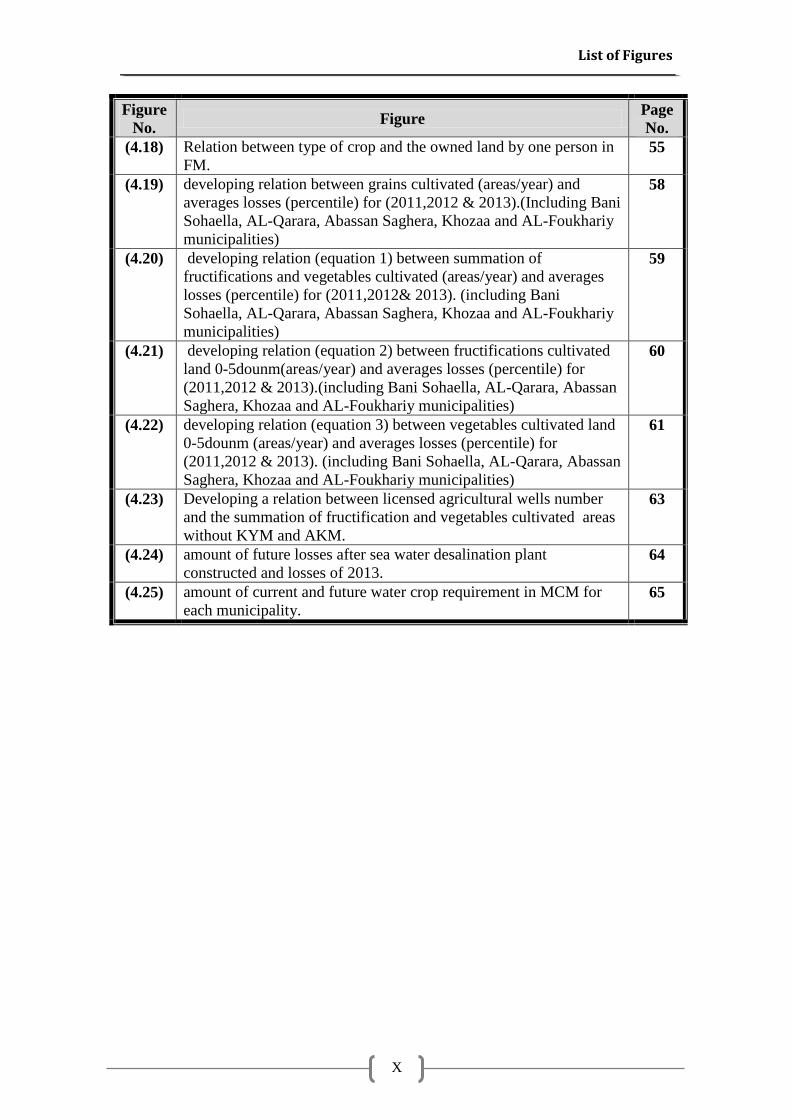
List of Figures
X
Figure
No. Figure
Page
No.
(4.18) Relation between type of crop and the owned land by one person in
FM. 55
(4.19) developing relation between grains cultivated (areas/year) and
averages losses (percentile) for (2011,2012 & 2013).(Including Bani
Sohaella, AL-Qarara, Abassan Saghera, Khozaa and AL-Foukhariy
municipalities)
58
(4.20) developing relation (equation 1) between summation of
fructifications and vegetables cultivated (areas/year) and averages
losses (percentile) for (2011,2012& 2013). (including Bani
Sohaella, AL-Qarara, Abassan Saghera, Khozaa and AL-Foukhariy
municipalities)
59
(4.21) developing relation (equation 2) between fructifications cultivated
land 0-5dounm(areas/year) and averages losses (percentile) for
(2011,2012 & 2013).(including Bani Sohaella, AL-Qarara, Abassan
Saghera, Khozaa and AL-Foukhariy municipalities)
60
(4.22) developing relation (equation 3) between vegetables cultivated land
0-5dounm (areas/year) and averages losses (percentile) for
(2011,2012 & 2013). (including Bani Sohaella, AL-Qarara, Abassan
Saghera, Khozaa and AL-Foukhariy municipalities)
61
(4.23) Developing a relation between licensed agricultural wells number
and the summation of fructification and vegetables cultivated areas
without KYM and AKM.
63
(4.24) amount of future losses after sea water desalination plant
constructed and losses of 2013. 64
(4.25) amount of current and future water crop requirement in MCM for
each municipality. 65
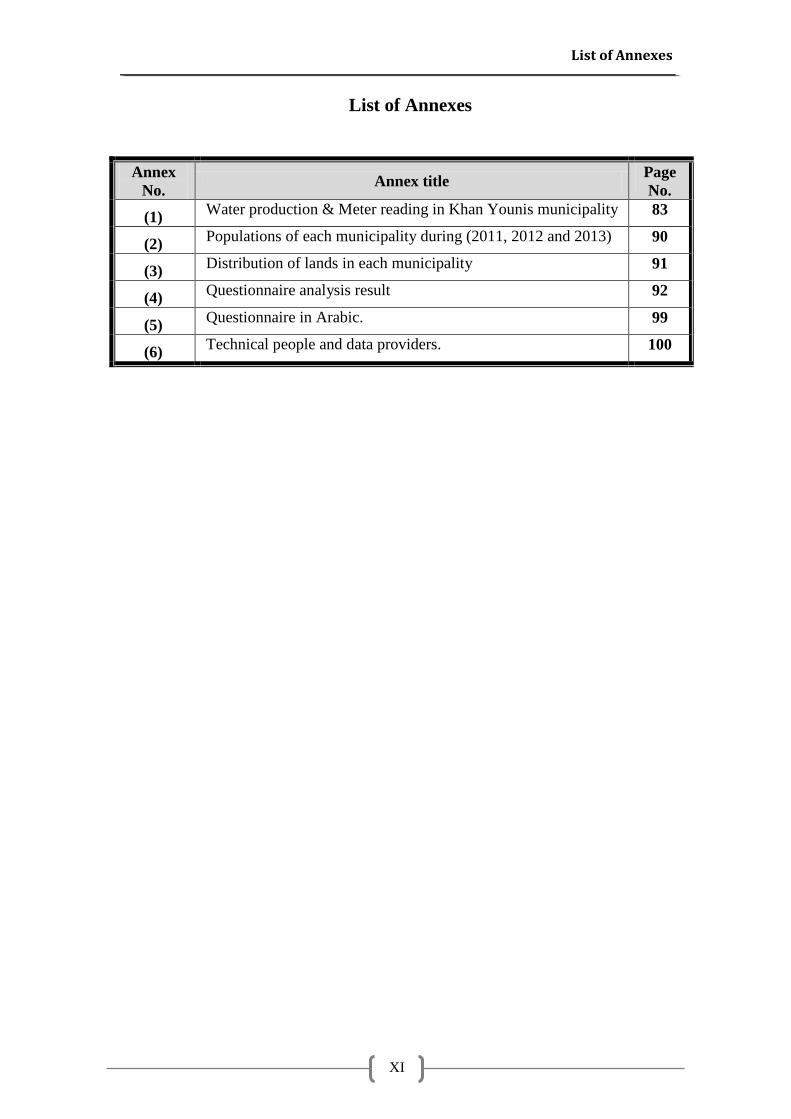
List of Annexes
XI
List of Annexes
Annex
No. Annex title
Page
No.
(1) Water production & Meter reading in Khan Younis municipality 83
(2) Populations of each municipality during (2011, 2012 and 2013) 90
(3) Distribution of lands in each municipality 91
(4) Questionnaire analysis result 92
(5) Questionnaire in Arabic. 99
(6) Technical people and data providers. 100
List of Abbreviations and Acronyms
XII
List of Abbreviations and Acronyms
AKM Abassan Kabera Municipality
ASM Abassan Saghera Municipality
BSM Bani Sohaella Municipality
CMWU Coastal Municipalities Water Utility
FAO Food & Agricultural Organization
FM Al-Foukhariy municipality
GSWDP Gaza Sea Water Desalination Plant
KM Khozaa Municipality
KYG Khan Younis Governorate
KYM Khan Younis Municipality
(L/c.d) Liter Per Capita Per Day
MCM Million Cubic Meters
MOA Ministry of Agriculture
MOLG Ministry of Local Governance
PCBS Palestinian Central Bureau Of Statistics
PWA Palestinian Water Authority
QM Al-Qarara Municipality
SWDP Sea Water Desalination Plant
UNDP/PAPP United Nations Development Program
WHO World Health Organization

Chapter 1: Introduction
1
1 Chapter 1: Introduction
Chapter 1: Introduction
2
Chapter 1: Introduction
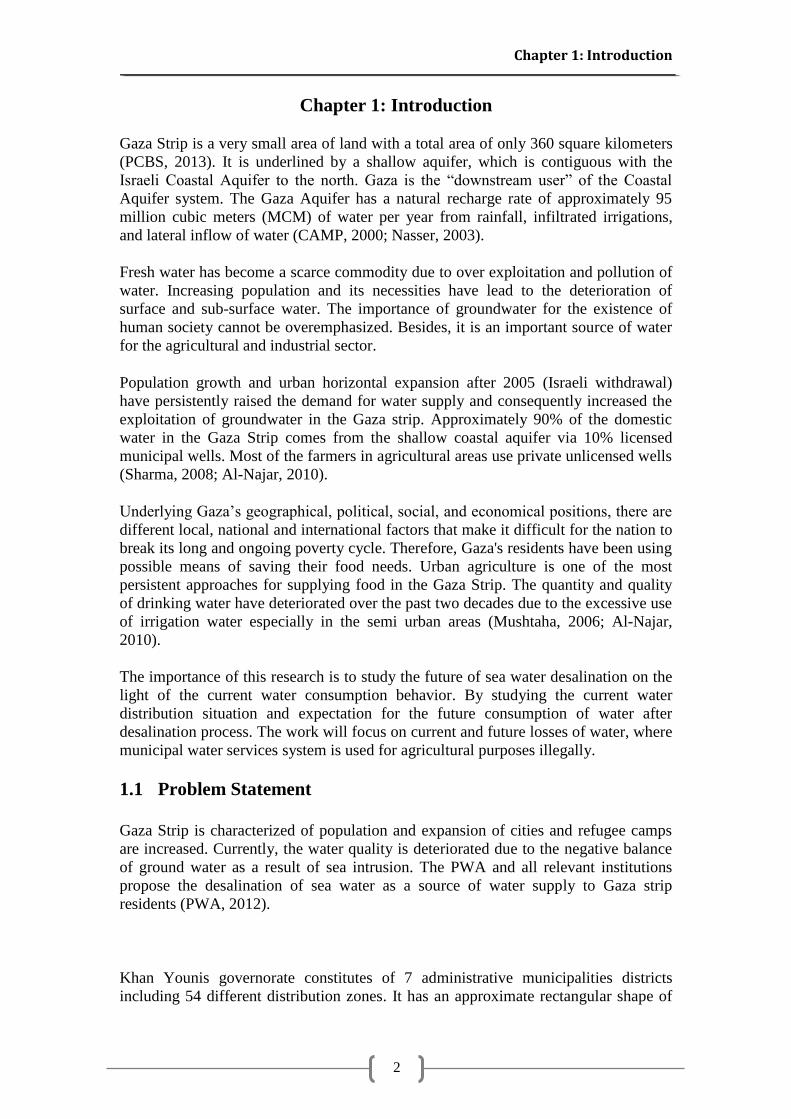
Gaza Strip is a very small area of land with a total area of only 360 square kilometers
(PCBS, 2013). It is underlined by a shallow aquifer, which is contiguous with the
Israeli Coastal Aquifer to the north. Gaza is the ―downstream user‖ of the Coastal
Aquifer system. The Gaza Aquifer has a natural recharge rate of approximately 95
million cubic meters (MCM) of water per year from rainfall, infiltrated irrigations,
and lateral inflow of water (CAMP, 2000; Nasser, 2003).
Fresh water has become a scarce commodity due to over exploitation and pollution of
water. Increasing population and its necessities have lead to the deterioration of
surface and sub-surface water. The importance of groundwater for the existence of
human society cannot be overemphasized. Besides, it is an important source of water
for the agricultural and industrial sector.
Population growth and urban horizontal expansion after 2005 (Israeli withdrawal)
have persistently raised the demand for water supply and consequently increased the
exploitation of groundwater in the Gaza strip. Approximately 90% of the domestic
water in the Gaza Strip comes from the shallow coastal aquifer via 10% licensed
municipal wells. Most of the farmers in agricultural areas use private unlicensed wells
(Sharma, 2008; Al-Najar, 2010).
Underlying Gaza‘s geographical, political, social, and economical positions, there are
different local, national and international factors that make it difficult for the nation to
break its long and ongoing poverty cycle. Therefore, Gaza's residents have been using
possible means of saving their food needs. Urban agriculture is one of the most
persistent approaches for supplying food in the Gaza Strip. The quantity and quality
of drinking water have deteriorated over the past two decades due to the excessive use
of irrigation water especially in the semi urban areas (Mushtaha, 2006; Al-Najar,
2010).
The importance of this research is to study the future of sea water desalination on the
light of the current water consumption behavior. By studying the current water
distribution situation and expectation for the future consumption of water after
desalination process. The work will focus on current and future losses of water, where
municipal water services system is used for agricultural purposes illegally.
1.1 Problem Statement
Gaza Strip is characterized of population and expansion of cities and refugee camps
are increased. Currently, the water quality is deteriorated due to the negative balance
of ground water as a result of sea intrusion. The PWA and all relevant institutions
propose the desalination of sea water as a source of water supply to Gaza strip
residents (PWA, 2012).
Khan Younis governorate constitutes of 7 administrative municipalities districts
including 54 different distribution zones. It has an approximate rectangular shape of
Chapter 1: Introduction
3
116 km2. The population recorded about 369,048 inhabitants in year 2013 (PCBS,
2013). It have a total of 295 wells. But only 38 wells serve the domestic water supply
in the area providing about 15,001,990 m3 while the meter readings accounted for
9,989,310 m3 in year 2013. It is obvious that unaccounted water equals 33.4% for all
municipalities. (Khan Younis Governorate municipalities, 2013). From Khan
Younis‘s water engineers points of view; this low efficiency might be due to:
1) The efficiency of the water pipe network system itself within the domestic area.
2) Unaccounted For Water (UFW) which is seen in the illegal connections from the
municipal networks towards the urban agricultural area of Khan Younis governorate
for agriculture purposes.
Khan Younis Governorate characterized by urban agriculture. The agricultural land
area in Khan Younis urban areas is about 37,806 dounms representing more than
32.8% of the Khan Younis Governorate total area. The absence of clear desegregation
between domestic and urban agriculture water consumption lead to uncertainty about
the system efficiency and the actual domestic consumption (Ministry of Agriculture,
2013). The urban agriculture influences the efficiency of water network because of its
needs of huge amount of water.
Additionally the agricultural production has reached to high limits of water
availability. At the same time, it confronted with the socio-economic demands related
to food insecurity and the needs for the coming generation (Sourani, 2005). Increasing
competition among urban needs makes water very limited resources (Shomar,2010).
This research focused on the unaccounted for water on light of the quality
improvements (desalination) and examining the main factor impacts on water losses
changes from the domestic municipal water. Either discussion the urban agriculture
crops water requirements and reflections after the sea water desalination plant would
exist. Furthermore, discussion the future socio-economical factor after quality
improvements.
1.2 Goal and Objectives
The goal of the current research is to identify the relation between unaccounted for
water and the urban agriculture among Khan Younis seven municipalities. Moreover,
identifying the urban agricultural changes on the light of improving water quality
(desalination). Defining its reflections on the unaccounted for water and the socio-
economic aspects such as the willing to pay. Leading to describe the main objectives
of the research which are;
1. Study the current situation of water distribution system.
2. Identify the main factors that lead to increase in the unaccounted for water
3. Study the current and expect future water consumption behavior on the light of
improved water supply quality (desalination).
4. Determine the future urban agriculture changes and the socio-economic aspect to
minimize the unaccounted for water.
Chapter 1: Introduction
4
1.3 Structure of the Thesis
The basic structure of the thesis is organized in six chapters, as follows:
Chapter One: Introduction
It provides a background on Khan Younis water crisis, summary on the problem
statement, research objectives, and structure of the research.
Chapter Two: Literature Reviews
It summarizes the literature reviews along with background information related to
water consumption, losses, observations from the past. And its potential impacts on
domestic water demand in the future, and if the desalination plant is existing.
Chapter Three: Study Area and Research Methodology
The study area describes the geographically with briefing about its water resources
and crisis, water system operation and maintenance, and historical metrological data
analysis. For the research methodology it deals with the methodology used to achieve
the objectives of the study, starting from assessing the potential impact of water
consumption, calculating UFW. Conducting the comparison between current situation
and expectation of water consumption and expectation of water consumption if the
desalination plant is existed and its impacts.
Chapter Four: Results and Discussions
It explains the findings, results and discussion on domestic water demand and the
expectation of water meter readings after the desalination plant is existed and its
impacts. These findings are to be compared with the current consumption and the
urban agriculture influence on domestic water demand. All of these findings will be
discussed and compared with local, regional, and international studies, moreover there
will be a looking over socio economic issue.
Chapter Five: Conclusion and Recommendations
It provides a brief summary of the research findings as a conclusion followed by
future recommendations for the best practices.
References contains the basic references, which have been reviewed by the
researcher.
Appendix contains the basic tables.

Chapter 2: Literature Review
5
2 Chapter 2: Literature Review
Chapter 2: Literature Review
6
Chapter 2: Literature Review
2.1 Introduction
The present situation in the water sector in Palestine and the challenges to be faced are
related to several factors. Including the extreme scarcity of water resources,
continuous growth of water demand due to population growth, economic development
and rising standards of living. Insufficient water supply and sanitation, inadequate
tariffs, insufficient control on water consumption, and excessive water losses. (PWA,
2004).
This chapter will illustrate the global and local literature reviews along with
background information related to groundwater and desalination in the light of current
situation. It will discuss the unaccounted for water, in addition to the potential impacts
on water demand for both domestic and agricultural sectors.
2.2 Ground Water Beneath the Gaza Strip
Gaza Strip is one of the semi-arid areas where rainfall is falling from October to
April. The rate of rainfall is varying in the Gaza Strip and ranges between 200
mm/year in the south to about 400 mm/year in the north. While the long term average
rainfall rate in all over the Gaza Strip is about 317 mm/year (Al-Najar, 2007, 2010).
Groundwater aquifer is considered the main source of water supply for all kinds of
human usage in Gaza Strip (domestic, commercial, agricultural and industrial). This
source has been faced a deterioration in both quality and quantity for many reasons,
e.g. low rainfall, increased in the urban areas which led to a decrease in the recharge
quantity of the aquifer, and increasing in the population. All of these factors deplete
the groundwater aquifer and led to seawater intrusion in some areas. As a result in
pressure differences between the groundwater elevation and sea water level
(Sharma,2009). Gaza Strip is one of the highest population intensity in the world
where the population has reached more than 1.85 Million inhabitants living within
365 Km2, and it is expected to reach more than 3.7 Million inhabitants by year 2035
(PCBS, 2013).
The groundwater underneath the Gaza Strip is limited to the Gaza Strip area, while the
coastal aquifer is extended from Haifa in the north to Sinai desert in the south, Hebron
Mountain in the east and the Mediterranean Sea in the west. Where the aquifer is
being recharged by different components such as rainfall, water networks leakage,
wastewater collection system leakage, agricultural return flow and from recharge
storm water ponds. The quantities of all those different components estimated to be on
average of about 170 to 185MCM yearly (IWA, 2012).
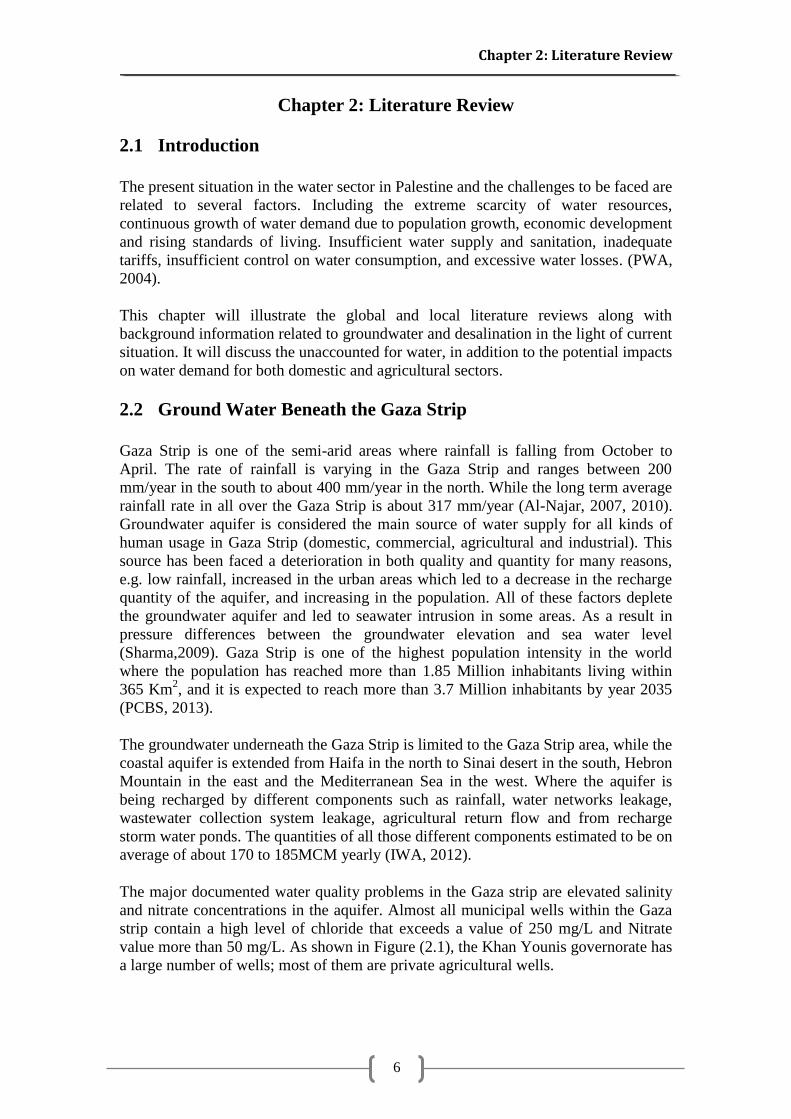
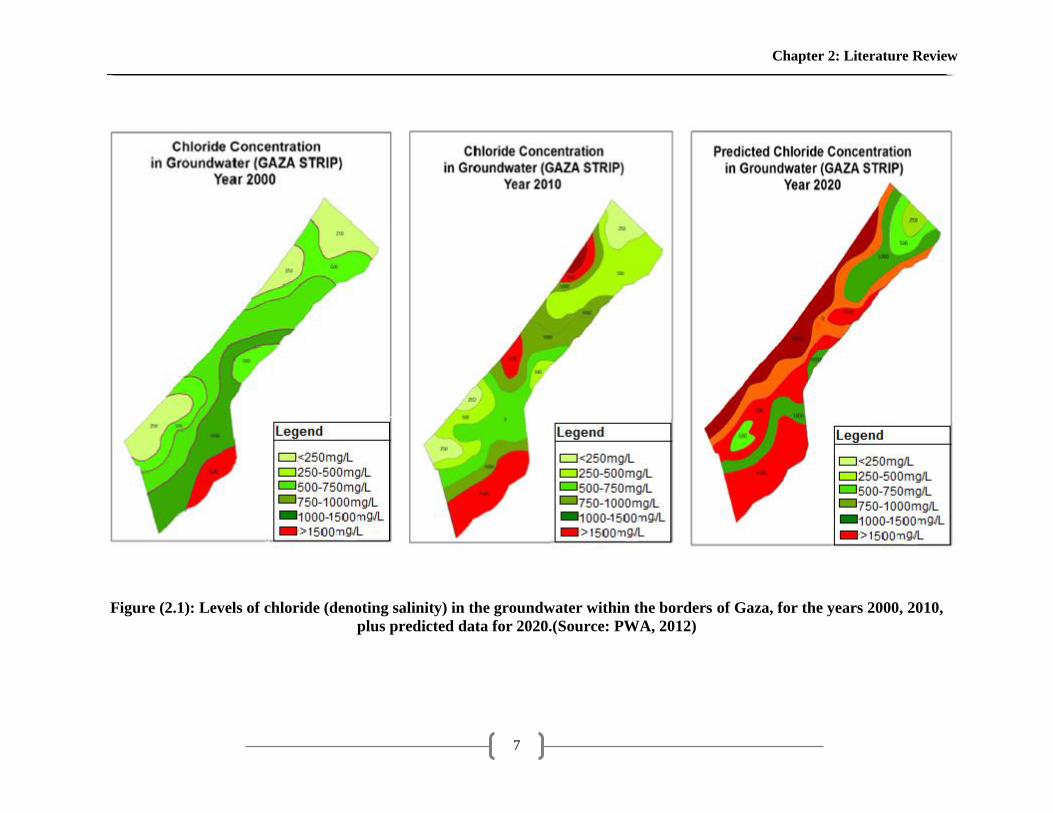
The major documented water quality problems in the Gaza strip are elevated salinity
and nitrate concentrations in the aquifer. Almost all municipal wells within the Gaza
strip contain a high level of chloride that exceeds a value of 250 mg/L and Nitrate
value more than 50 mg/L. As shown in Figure (2.1), the Khan Younis governorate has
a large number of wells; most of them are private agricultural wells.
Chapter 2: Literature Review
7
Figure (2.1): Levels of chloride (denoting salinity) in the groundwater within the borders of Gaza, for the years 2000, 2010,
plus predicted data for 2020.(Source: PWA, 2012)
Chapter 2: Literature Review
8
In general, the quality of water extracted from Gaza Strip coastal aquifer varies by
area and time and does not meet the World Health Organization (WHO) guidelines
values for drinking water quality (CMWU report ,2006, 2008, 2009,2010,2012).
Stalinization of groundwater may be caused by a number or combination of different
processes. Including seawater intrusion, migration of brines from the deeper parts of
the aquifer, dissolution of soluble salts in the aquifer (water-rock interaction). And
contribution from discharges from older formations surrounding the coastal aquifer.
In addition, potential man-induced (anthropogenic) sources include agricultural return
flows, wastewater seepage, and disposal of industrial wastes (Bartram, et. al.,1996).
The thickness of the saturated groundwater aquifer underneath the Gaza Strip ranges
from few meters in the eastern and south east of the Gaza Strip to about 120-150 m in
the west and along the Mediterranean Sea.
The aquifer is mainly composed of unconsolidated sand stone known as Kurkar
formation which overlaying the main source of water in Gaza Strip in the shallow
aquifer which is part of the coastal aquifer. Impermissible layer called Saqiya
formation which is considered as the bottom of the Gaza Coastal Aquifer with
thickness varies from 800-1000 m. (Isamil, 2003).The thickness of the unsaturated
aquifer which is the overlaying part of the saturated groundwater aquifer ranges from
70–80m in the eastern and south-eastern part of the Gaza Strip to about few meters in
the western and along the coast. (Metcalf and Eddy, 2000).
The available groundwater quantity could be identified if the saturated aquifer
reservoir thickness is known in addition to the hydrological parameters of the aquifer
such as effective porosity. The area of the groundwater reservoir is limited to the area
of the political border of the Gaza Strip. The area where the groundwater quantity
with chloride less than 250 mg/L is about 33.4 Km2 while it has been recorded in year
2009 to be about 44.8Km2. So it has been shrinking of about 10 Km
2(Al-Yaqubi, et.
al, 2011). In 2011, the recorded water abstracted from groundwater was around 86.7
MCM "Including UN wells", while agricultural water abstraction is assumed to be
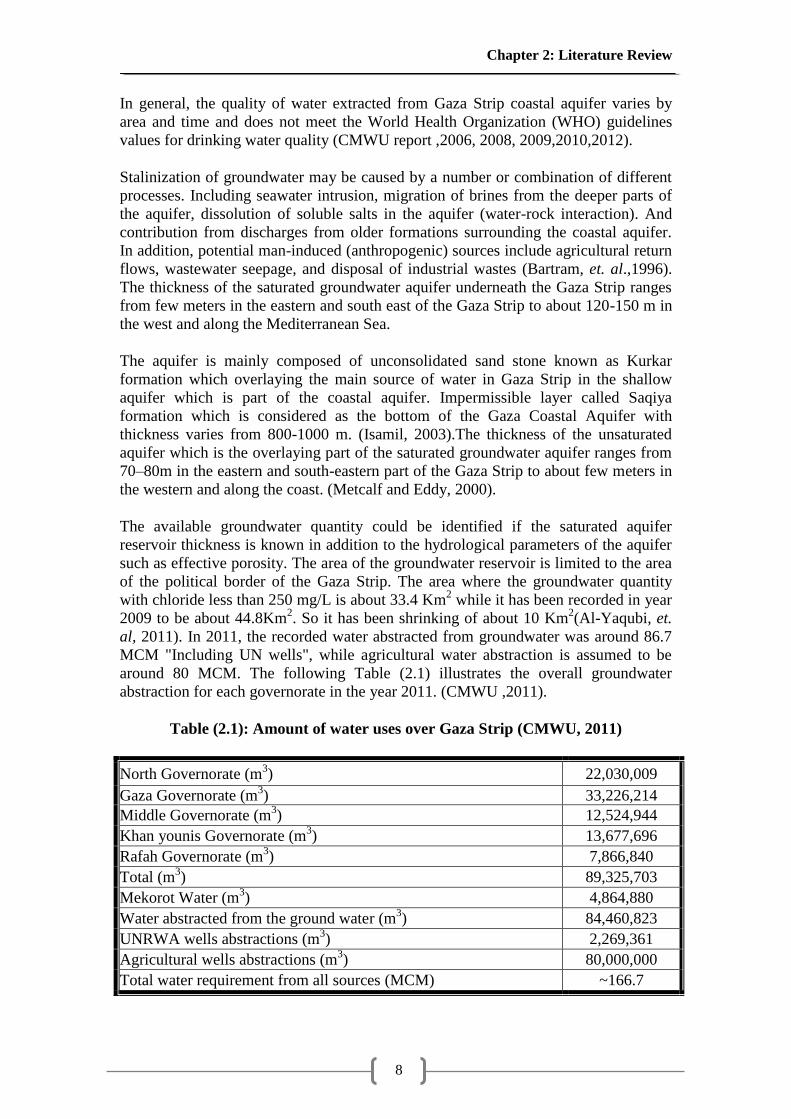
around 80 MCM. The following Table (2.1) illustrates the overall groundwater
abstraction for each governorate in the year 2011. (CMWU ,2011).
Table (2.1): Amount of water uses over Gaza Strip (CMWU, 2011)
North Governorate (m3) 22,030,009
Gaza Governorate (m3) 33,226,214
Middle Governorate (m3) 12,524,944
Khan younis Governorate (m3) 13,677,696
Rafah Governorate (m3) 7,866,840
Total (m3) 89,325,703
Mekorot Water (m3) 4,864,880
Water abstracted from the ground water (m3) 84,460,823
UNRWA wells abstractions (m3) 2,269,361
Agricultural wells abstractions (m3) 80,000,000
Total water requirement from all sources (MCM) ~166.7
Chapter 2: Literature Review
9
2.3 Agriculture in the Gaza Strip
Agriculture is the prevalent sector in Gaza's economy, which contributes to 32% of its
economic production. Over the last five years it‘s contribution to the national Gross
Domestic Production (GDP) has reduced from 9.1% in 2000 to about 7.0% in 2005.
while it increase during 2013 to reach 12.2% of gross domestic production which
means that the period of the study is located in economic growth due to the farmer
have been import seeds, fertilizers and pesticides from Egypt illegally (MOA, 2014).
Most of the agricultural areas are located within and surrounding of the denser
residential areas. Therefore, this type of agriculture could be classified as urban
agriculture due to its location. Moreover, some of the green houses are irrigated from
the municipal water network within the residential areas. Fruit trees are cultivated
within and close to the built up areas. On the other hand, rain fed crops occupying the
eastern area of the Gaza Strip. The agricultural area in Gaza Strip is estimated to be
about 176,000 dounms, and the total supply is estimated to be about 80.5 MCM
(PWA, 2013).
Gaza Strip is characterized of population and expansion of cities and refugee camps
are increased. The export-oriented agricultural production has reached to high limits
of water availability. Food insecurity is caused by the socio-economic factors leading
to expected huge demands for generations in the future. Increasing competition
among urban agricultural needs, soil and water in limited resources.
―Agriculture in Gaza is already more urban than rural‖ was one of the conclusions of
the Gaza Urban Agriculture Committee (GUAC) workshop in 2000, referring to the
high degree of urbanization of the area.
An official resource, the Ministry of Planning went further by stating that: ―All
agriculture in Gaza can be considered to be urban agriculture.‖. The main conclusion
of the workshop was that we cannot neglect the prevailing potentials problems in the
agricultural sector in Gaza Strip. The Palestinian Agricultural Relief Committees
(PARC) aims to wide-reaching strategy to carry out potentials problems by the active
participations of stakeholders at all levels of society. (Sourani, 2005)
Urban agriculture is not a new invention. However, recently urban agriculture has
become a systematic focus of research and development attention as its scale and
importance in the urbanizing world become increasingly recognized (Veenhuizen, et
al, 2010). A recent study by the United Nations Development Programme (UNDP)
indicated that about 800 million urban residents worldwide are involved in urban
agricultural activities as a survival strategy (CDM, 2011). Between 1993 and 2005,
urban agriculture could increase its share of world food production from 15% to 33%
(Smit, 2006). Accordingly, the urban agriculture will influence the efficiency of water
network because it needs a huge amount of water.
Because vegetables consume the highest water quota; water consumption for each
type is evaluated to investigate the feasibility of using the groundwater for irrigation.
In spite of the crops, which are cultivated in green houses, they consume the highest
quota of irrigated water especially carnation which consumes more than 1500
m3/dounm/year (one dounm =1000 m
2). The current water tariff which is considered
by the Ministry of Agriculture in the total cost of crop production is (0.16 $/m3). This
Chapter 2: Literature Review
10
value represents only the cost of pumps operation and fuel. Water, as an asset, is
never been evaluated on the light of Gaza water crisis. For instance; carnation and
strawberry are the two main agricultural export products from Gaza Strip (cash crops
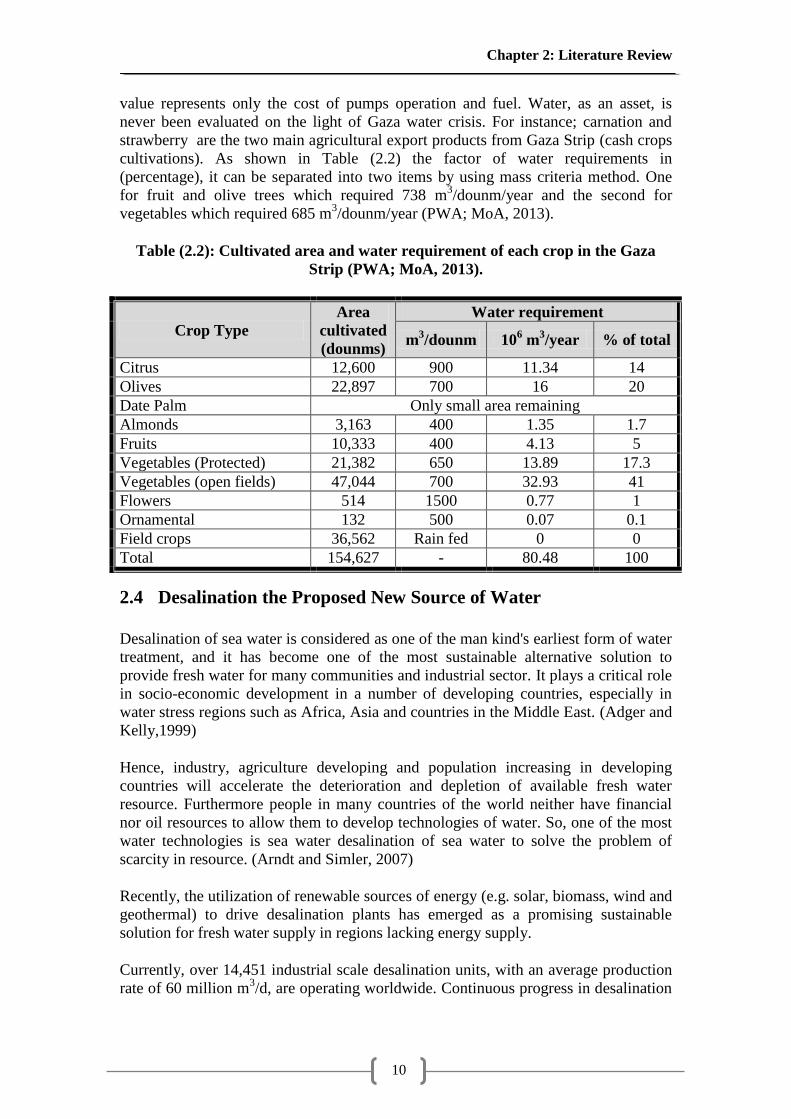
cultivations). As shown in Table (2.2) the factor of water requirements in
(percentage), it can be separated into two items by using mass criteria method. One
for fruit and olive trees which required 738 m3/dounm/year and the second for
vegetables which required 685 m3/dounm/year (PWA; MoA, 2013).
Table (2.2): Cultivated area and water requirement of each crop in the Gaza
Strip (PWA; MoA, 2013).
Crop Type
Area
cultivated
(dounms)
Water requirement
m3/dounm 10
6 m
3/year % of total
Citrus 12,600 900 11.34 14
Olives 22,897 700 16 20
Date Palm Only small area remaining
Almonds 3,163 400 1.35 1.7
Fruits 10,333 400 4.13 5
Vegetables (Protected) 21,382 650 13.89 17.3
Vegetables (open fields) 47,044 700 32.93 41
Flowers 514 1500 0.77 1
Ornamental 132 500 0.07 0.1
Field crops 36,562 Rain fed 0 0
Total 154,627 - 80.48 100
2.4 Desalination the Proposed New Source of Water
Desalination of sea water is considered as one of the man kind's earliest form of water
treatment, and it has become one of the most sustainable alternative solution to
provide fresh water for many communities and industrial sector. It plays a critical role
in socio-economic development in a number of developing countries, especially in
water stress regions such as Africa, Asia and countries in the Middle East. (Adger and
Kelly,1999)
Hence, industry, agriculture developing and population increasing in developing
countries will accelerate the deterioration and depletion of available fresh water
resource. Furthermore people in many countries of the world neither have financial
nor oil resources to allow them to develop technologies of water. So, one of the most
water technologies is sea water desalination of sea water to solve the problem of
scarcity in resource. (Arndt and Simler, 2007)
Recently, the utilization of renewable sources of energy (e.g. solar, biomass, wind and
geothermal) to drive desalination plants has emerged as a promising sustainable
solution for fresh water supply in regions lacking energy supply.
Currently, over 14,451 industrial scale desalination units, with an average production
rate of 60 million m3/d, are operating worldwide. Continuous progress in desalination
Chapter 2: Literature Review
11
technology makes it a primary, if not the only, candidate for alleviating severe water
shortages across the globe (Henthorne, 2009).
Moreover, desalination costs are competitive if compared with the operation and
maintenance costs of long-distance water transport systems. Desalination costs have
been continuously decreasing over the years as a result of advances in system design
and operating experience, the associated reductions in specific unit size, and specific
power consumption (Fritzmann, et. al., 2007).
2.4.1 Existing Desalination Plants in the Gaza Strip
In the beginning of the nineties, three pilot Reverse Osmosis (RO) desalination plants
were constructed as brackish water desalination; one plant in Deir El-Balah and two
plants in Khan Younis.
The average production per plant is about 30 to 40 m3/hour. Those plants aimed to
improve the public health of people and to secure partially accepted water for
drinkable usage in their areas.
By time the efficiency of the plants have decreased due to the increase of salinity of
the brackish water well and the lack of experience for the local staff in operation and
maintenance. However, using desalination water as an alternative source for drinkable
usage has developed and increased as a type of investment projects for the private
sector. Also, we will focus on the public sector in Gaza strip.
2.4.2 Proposed Gaza Sea Water Desalination Plant
The Feasibility Study (PWA and CDM, 2003) reported that the United States (US)
Government is working to fulfill future needs that have been established in
accordance with the provisions of Article 40, Interim Agreement between Palestine
and Israel. The agreement aims to strengthening cooperation which was established
by the Israeli- Palestinian-American Water Committee. So the US addressed the issue
of brackish or seawater desalination in the Gaza Strip. For this sake, the United State
Agency for International Development (USAID) has been committed to the
Palestinian National Authority to give grants for designing, constructing, and
supervising the reverse osmosis Gaza Sea Water Desalination Plant (GSWDP). The
production capacity of phase (I) is estimated at 60,000 m3/day (~ 20 MCM/year) and
the plant is assumed to be in operation by the year 2005. But now, and because of the
political conditions, this date may be postponed. The production phases are estimated
according to the PWA and CAMP report 2001 as follows:
1. Phase 1: 60,000 m3/day in operation by 2005.
2. Phase 2: 60,000 m3/day in operation by 2008.
3. Phase 3: 20,000 m3/day in operation by 2014.
4. Phase 4: 10,000 m3/day in operation by 2018.
The final target capacity shall be 150,000m3/day (~55MCM/year) by the year 2020.
But if it exists it won‘t serve as planned 100% of the usage.
Chapter 2: Literature Review
12
Seawater intake shall be employed to feed water to the plant. Samples were collected
from the Mediterranean Sea close to the proposed site intake one Km far from the
shore.
By the end of the construction phase of the GSWDP, the turnkey American contractor
will carry out the responsibility for Operation for three years in a contract with
USAID, and then the operation contract will be shifted to the Coastal Municipal
Water Utility (CMWU) instead of USAID for a possible period of seven years. Since
the operation cost of the plant will be a load on the CMWU during this extended
operation contract, the World Bank is expected to financially support the CMWU as
part of its obligations Gaza project. This large-scale plant will serve all people in
Gaza Strip through the Gaza Regional Carrier. The site of the plant lies in the middle
area of the strip, with total land area at 27,000 m2.
According to (PWA and CDM, 2003), the operation and maintenance costs will be
0.54 US$/m3 in the first phase and is estimated to drop to 0.42 US$/m
3 when the final
phase is completed based on energy costs of 0.055 US$/KWh. The master plan study
argues that the tariff structure is designed not only to encourage the water
conservation but also to allow an appropriate rate to support the expansion of
desalination facilities.
2.4.3 Cost of Cubic Meter of Desalinated Water
By the beginning of 1960s, water desalination technology has been started to be as an
alternative conventional water resource. The main challenge at that time was the high
cost of produced water. The limiting factor that is still affecting the price of cubic
meter is the power cost and the water quality of the produced water.
In the last decay, a rapid progress and high competition have occurred in the Reverse
Osmosis (RO) desalination technique and technology. The main aim of that is to
decrease the consumption power. New researches and Figures argue that in order to
produce one cubic meter of desalinated water, 3.5 KWh is needed.
In the feasibility study report (PWA and CDM, 2003) which was submitted by
USAID to PWA, the sections related to capital cost, operation and maintenance cost,
and financial analysis of GSWDP were intentionally left blank.
Regarding to water desalination market, Israel signed a Build, Operate, and Transfer
(BOT) contract with the international French water company VIVENDI in 2002 was
finished. This contract were aim to construct the RO seawater desalination plant at
Ashkelon / Israel, with a capacity of 100 MCM/year at production cost at 0.527
US$/m3 (IWA, 2012)
Thus, energy consumption is the main limited factor in the economic feasibility in the
determination of the cost of cubic meter of desalinated water. Energy devices are
critical to the cost effectiveness of today's seawater desalination plants. Those devices
aim to lower the net high- pressure power consumption.
Since GSWDP will not be a co-generation power plant, power costs are significant.
The facility (GSWDP) will be empowered by the new Gaza thermal power plant 140
Chapter 2: Literature Review
13
MW at that time assuming the electricity is working well. The bulk of operation costs
of the facility are in the energy costs, assessed to as high as 72% of total Operation
and Maintenance (O&M) costs.
The master plan indicates that those costs are based on fixed units of cost of power at
0.055 US$/m3 of consumption. The type of Operation and Maintenance (O&M) of a
desalination plant in general is a decisive factor in identifying cost per cubic meter.
By the year 2020, the total production in the final phase of the GSWDP is 150,000
m3/day which equals 55 MCM/year. At the same time, the total domestic water
consumption is estimated at 89 MCM/year by year 2020. The estimated cost of cubic
meter that is produced from GSWDP in phase (I) is at 0.54 US$/m3 and can drop to
0.42 US$/m3 at the final phase (PWA, 2009). Consequently, the consumer shall
charge for the production and pumping of the cubic meter around 0.75 US$/ m3 in
phase I (Ismail, 2003). So, families can afford for the water produced from GSWDP.
Al-Ghuraiz (2002) report argued that people in the Gaza Strip could afford to pay up
to US$ 0.7 per cubic meter with accepted water quality.
The PWA aimed to protect poor people by adopting a smart tariff setting and cross-
subsidies through lowering the first slid in the water tariff system.
2.5 Un-accounted for Water
Unaccounted-for water (UFW) represents the difference between "net production" and
"consumption" (the volume of water that can be accounted for by legitimate
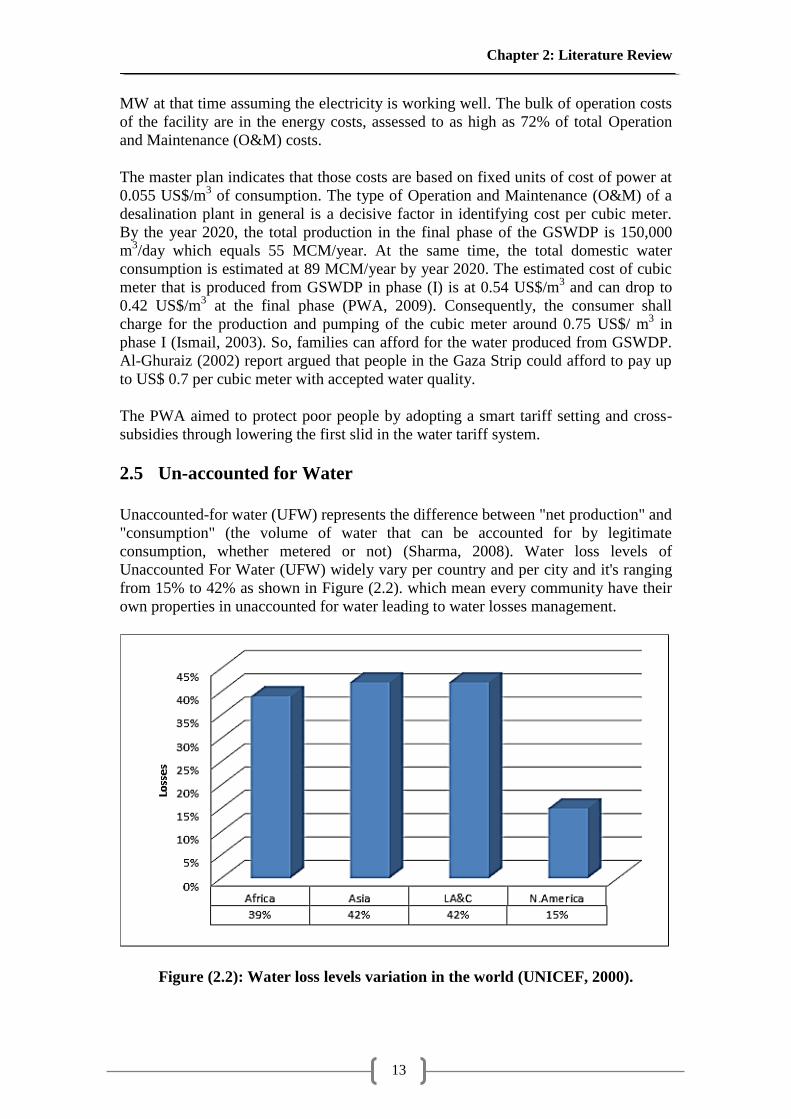
consumption, whether metered or not) (Sharma, 2008). Water loss levels of
Unaccounted For Water (UFW) widely vary per country and per city and it's ranging
from 15% to 42% as shown in Figure (2.2). which mean every community have their
own properties in unaccounted for water leading to water losses management.
Figure (2.2): Water loss levels variation in the world (UNICEF, 2000).
Chapter 2: Literature Review
14
Water loss of Unaccounted For Water (UFW) from a water distribution system is a
significant factor affecting water delivery to customers.
Water loss can be either:
1. The apparent losses due to meter inaccuracies or unauthorized consumption.
2. Real losses due to leakage at water service lines, breaks or leakage on mains and
hydrants at storage facilities (EPD, 2007)
2.5.1 Acceptable levels of Water Loss
Around the world there are many committees limited the unaccounted for water with
specific percentile. American Water Works Association (AWWA) leak detection and
Accountability Committee (1996) recommended 10% as a benchmark for
Unaccounted For Water (UFW). UFW levels and action needed are as follows
(Sharma, 2008).
< 10% Acceptable, monitoring and control
10-25% Intermediate, could be reduced
> 25% Matter of concern, reduction needed
Chapter 3: Study Area and Research Methodology
15
3 Chapter 3: Study Area and Research Methodology
Chapter 3: Study Area and Research Methodology
16
Chapter 3: Study Area and Research Methodology
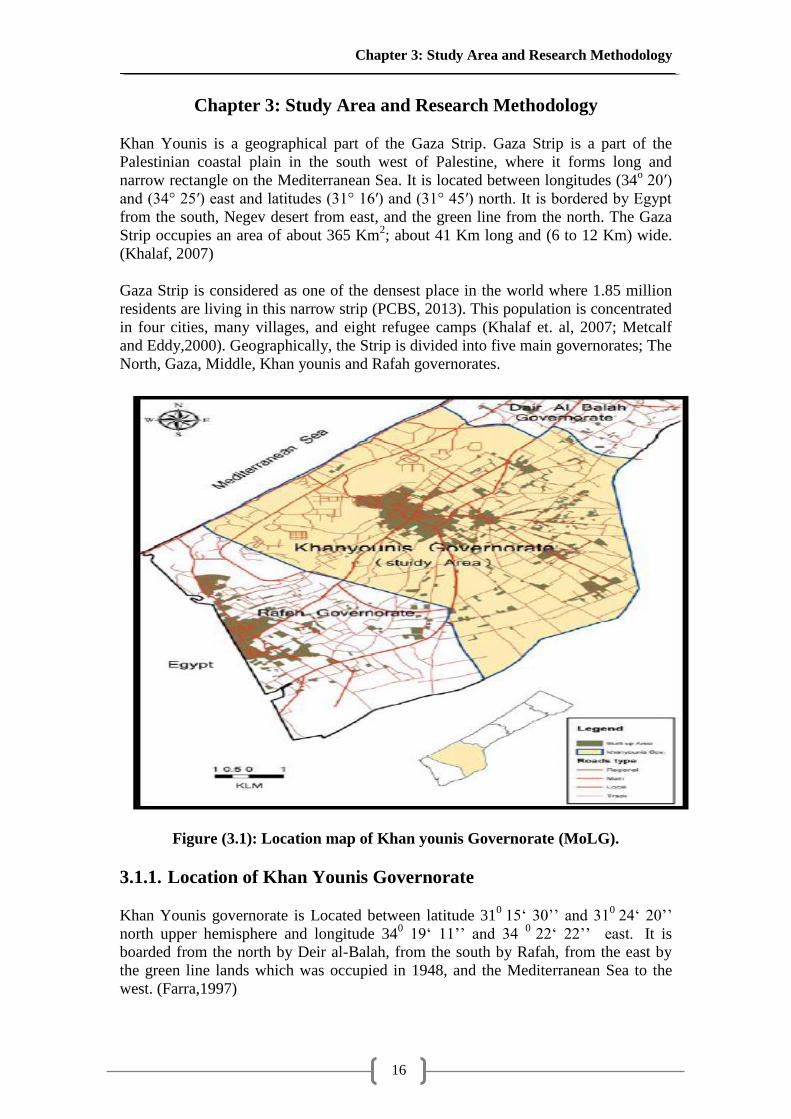
Khan Younis is a geographical part of the Gaza Strip. Gaza Strip is a part of the
Palestinian coastal plain in the south west of Palestine, where it forms long and
narrow rectangle on the Mediterranean Sea. It is located between longitudes (34o 20′)
and (34° 25′) east and latitudes (31° 16′) and (31° 45′) north. It is bordered by Egypt
from the south, Negev desert from east, and the green line from the north. The Gaza
Strip occupies an area of about 365 Km2; about 41 Km long and (6 to 12 Km) wide.
(Khalaf, 2007)
Gaza Strip is considered as one of the densest place in the world where 1.85 million
residents are living in this narrow strip (PCBS, 2013). This population is concentrated
in four cities, many villages, and eight refugee camps (Khalaf et. al, 2007; Metcalf
and Eddy,2000). Geographically, the Strip is divided into five main governorates; The
North, Gaza, Middle, Khan younis and Rafah governorates.
Figure (3.1): Location map of Khan younis Governorate (MoLG).
3.1.1. Location of Khan Younis Governorate
Khan Younis governorate is Located between latitude 310
15‗ 30‘‘ and 310
24‗ 20‘‘
north upper hemisphere and longitude 340 19‗ 11‘‘ and 34
0 22‗ 22‘‘ east. It is
boarded from the north by Deir al-Balah, from the south by Rafah, from the east by
the green line lands which was occupied in 1948, and the Mediterranean Sea to the
west. (Farra,1997)
Chapter 3: Study Area and Research Methodology
17
Khan Younis governorate area is about 116 square kilometers, which represents
30.59% of Gaza Strip area and over 0.41% of the area of historical Palestine. Khan
Younis governorate includes a number of towns; Bani Sohaella, Abassan Saghera,
Abassan Kabera, Khozaa, AL-Qarara and AL-Foukhariy. Khan Younis governorate
constitutes of 7 municipalities, one for each town. In addition to 3 camps for refugees
like north, south and west camp as the following:
1. Khan younis city municipality which includes (Downtown, Camp, AL-Amal,
AL-Baten AL-Samen, AL-Mahta, AL-Kateba, AL-Sattar, Quezan AL-Najar,
Quezan Abu-Rashwn, Sheikh Nasser, Maan, AL-Jalaa, AL-Tahreer, AL-
Mawassi, AL-Nasser, AL-Salam, AL-Manara, Goret AL-Lout andAL-Qureen).
2. Abassan Kabera town municipality.
3. Abassan Saghera town municipality.
4. AL- Foukhariy town municipality.
5. Bani Sohaella town municipality.
6. AL-Qarara town municipality.
7. Khozaa town municipality.
3.1.2. Land Use
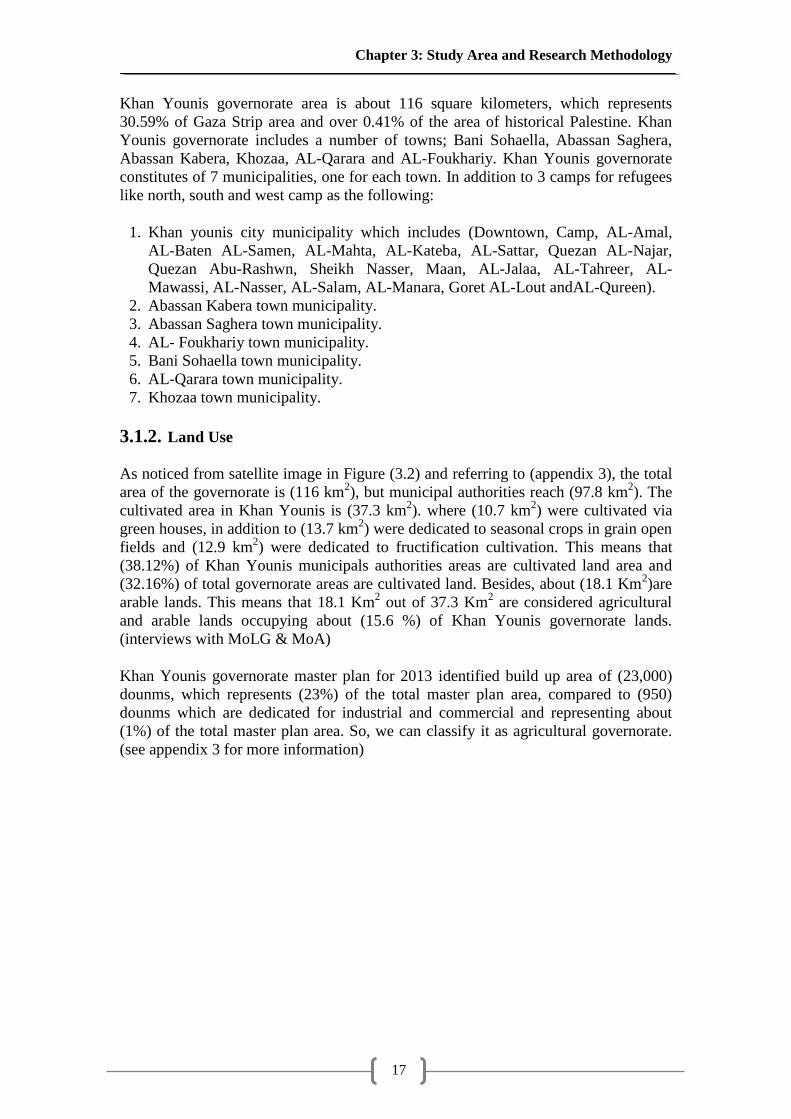
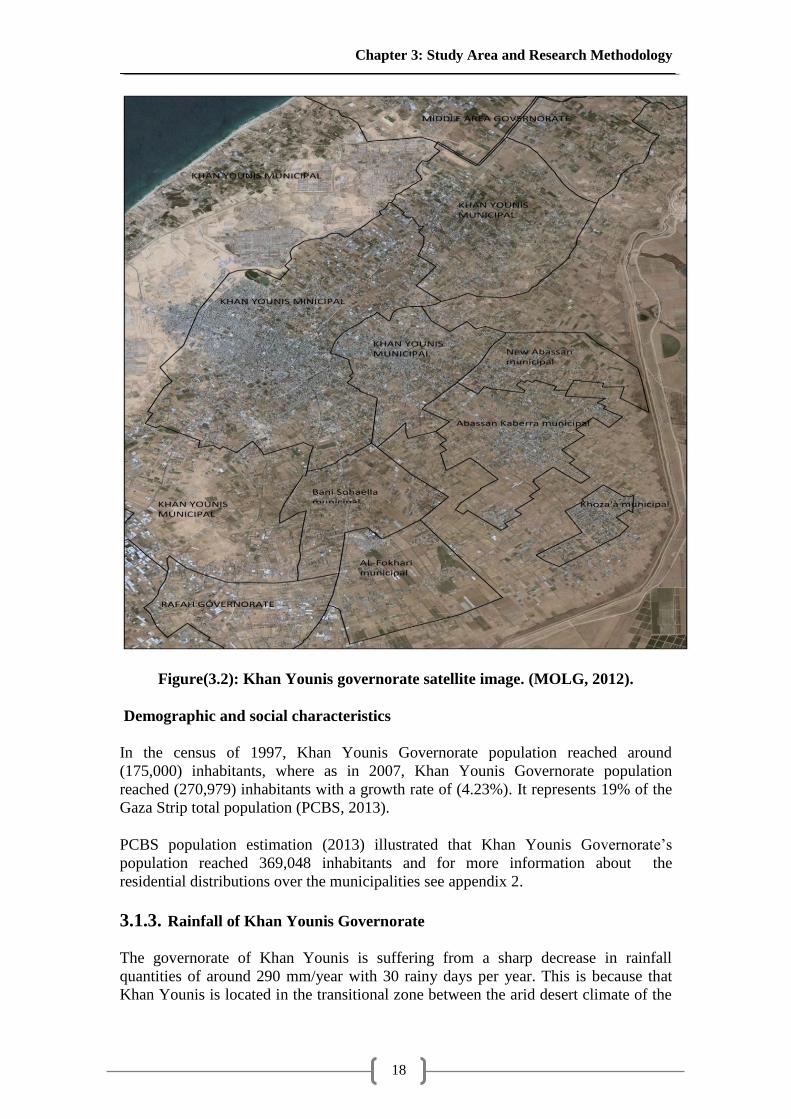
As noticed from satellite image in Figure (3.2) and referring to (appendix 3), the total
area of the governorate is (116 km2), but municipal authorities reach (97.8 km
2). The
cultivated area in Khan Younis is (37.3 km2). where (10.7 km
2) were cultivated via
green houses, in addition to (13.7 km2) were dedicated to seasonal crops in grain open
fields and (12.9 km2) were dedicated to fructification cultivation. This means that
(38.12%) of Khan Younis municipals authorities areas are cultivated land area and
(32.16%) of total governorate areas are cultivated land. Besides, about (18.1 Km2)are
arable lands. This means that 18.1 Km2 out of 37.3 Km
2 are considered agricultural
and arable lands occupying about (15.6 %) of Khan Younis governorate lands.
(interviews with MoLG & MoA)
Khan Younis governorate master plan for 2013 identified build up area of (23,000)
dounms, which represents (23%) of the total master plan area, compared to (950)
dounms which are dedicated for industrial and commercial and representing about
(1%) of the total master plan area. So, we can classify it as agricultural governorate.
(see appendix 3 for more information)
Chapter 3: Study Area and Research Methodology
18
Figure(3.2): Khan Younis governorate satellite image. (MOLG, 2012).
Demographic and social characteristics
In the census of 1997, Khan Younis Governorate population reached around
(175,000) inhabitants, where as in 2007, Khan Younis Governorate population
reached (270,979) inhabitants with a growth rate of (4.23%). It represents 19% of the
Gaza Strip total population (PCBS, 2013).
PCBS population estimation (2013) illustrated that Khan Younis Governorate‘s
population reached 369,048 inhabitants and for more information about the
residential distributions over the municipalities see appendix 2.
3.1.3. Rainfall of Khan Younis Governorate
The governorate of Khan Younis is suffering from a sharp decrease in rainfall
quantities of around 290 mm/year with 30 rainy days per year. This is because that
Khan Younis is located in the transitional zone between the arid desert climate of the
Chapter 3: Study Area and Research Methodology
19
Sinai Peninsula in Egypt and the temperate and semi-humid Mediterranean climate
along the coast (Ajjur, 2012).
Reference evapotranspiration value in Gaza Strip varies from 2 to 3.03 mm/d in
winter, and reaches its maximum value in summer at about 5.11 mm/d (Ajjur, 2012).
3.1.4. Khan Younis Governorate Water Distribution System Situation
The percentage of efficiency of Khan Younis governorate is (66%).This high
efficiency is reflecting two things in this area. The first thing is referring to the
efficiency of the water pipe network system within the domestic area which is
obvious in old city and old zones. The other thing is referring to the Unaccounted For
Water (UFW) which is seen in the illegal connections from the municipal wells
towards the agricultural area of Khan Younis governorate.
Water distribution system in Khan Younis comprises of main transmission pipes,
distribution pipelines, ground water storage tanks, wells, booster pump stations and
control valves. The supply scheme in Khan Younis is an intermittent water
distribution system which is prevalent in Gaza Strip, where the water distribution
cycle is completed every 48 hour to 72 hour in other areas; this is due to the
insufficient water infrastructure besides the scarce water sources. This system is
controlled by manual operated valves located at the main feeders in the water network
which may participate in worsening the network efficiency.
Quantity and quality are the main problems of drinking water in Khan Younis
governorate. The shortage of water in Khan Younis municipalities are mainly caused
by the distribution system losses which are estimated by (33 %) of the abstracted
water quantities by municipalities. Over (99.7%) of Khan Younis governorate
residents currently have access to water services, but unfortunately do not receive
appropriate water quantities or qualities (Interview with CMWU, 2013).
The water distribution system in new towns are in good conditions. It was installed
(15-23) years and most of the pipes in the network are made of steel, UPVC, and
polyethylene. Unfortunately, the municipal water network services in Khan Younis
city is poor condition. It was installed (25-45) years and the pipes in the network are
made of spastoes, steel, UPVC, and polyethylene. So, the efficiency is not sufficient
due to high rate of losses which are caused by leakage, illegal connections, and
misreading of counters flow meters (Interview with CMWU, 2013).
3.2. Research Methodology
3.2.1. Data Collection
Data was collected from different sources and using different tools as follows:
3.2.2. Metrological Data
Metrological data is one of the most critical and essential required information for the
research, where lots of literatures were reviewed including: scientific papers and
research, relevant MSc dissertations in addition to scientific websites. Unfortunately;
Chapter 3: Study Area and Research Methodology
20
Khan Younis have been suffered from data scarcity in addition to inappropriate
documentation. So, metrological data was collected from scattered resources
including Ministry of Agriculture (MOA), Coastal Municipalities Water Utility
(CMWU), Khan Younis Governorate and Khan Younis municipalities' engineers and
previous relevant researches.
3.2.3. Field Survey
During the study, the researcher used two deferent methodologies. The First was used
for municipality through interviews with relevant institutes engineers and managers,
to study the current water situation. The second was a questionnaire for farmers which
discussed the effect of changes in their crops in case after the sea water desalination
plant is existed. And to expect the future water consumption leading to understand the
future situation of water desalination.
3.2.3.1. Data Collection by Inspection
Primary data are those data which were directly collected by the researcher. It
included the direct observation during the field visits to: Khan Younis main water
pumping station, existing desalination plant, several agricultural lands, tracking water
distribution network operation, beside several interviews with farmers and operators.
3.2.3.2. Interview Data Collection
The essential data were the main stake for this research according to the unique nature
of its field and the obligation of utilizing whatever available sources. So, the
secondary data was collected from the relevant institutions such as: Palestinian
Central Bauru of Statistics (PCBS), Palestinian water authority (PWA), Ministry of
Local Government (MoLG), Ministry of Agriculture (MoA), Khan Younis
Governorate, Coastal Municipal Water Utility (CMWU) and Khan Younis
governorate municipalities.
3.2.3.3. Khan Younis Water Resource, Water Distribution Network and Meter
Reading
Khan Younis water supply and demand quantities were mainly collected from the
main responsible institutions for distributing water in the whole of the Gaza Strip
including Khan Younis, which are PWA, CMWU, MoLG (for maps and water
situation) and Khan Younis municipalities (for all data relevant to losses).
Water treatment and distribution in Khan Younis Governorate is being managed
directly by Khan Younis municipalities and operated by cooperation of municipalities
with CMWU. So, these two organizations had the main stake in providing all the
sufficient data about water distribution network. As one of the research objectives is
to assess the current water distribution systems on the per capita water consumption
from meter readings and comparing it to the expected future demand in existing of
desalination impacts, so, Khan Younis governorate water distribution system was
comprehensively studied in order to assess the gaps that influence the per capita
consumption.
Chapter 3: Study Area and Research Methodology
21
To find out the amounts of water that reaching Khan Younis households,
chronological data of water meter readings were obtained for the same period (2011-
2013). The water losses data assess the differences between the pumped quantities
and the meter readings reached to the households. So, comprehensive meetings were
held with several employees at collective departments in Khan Younis municipalities.
3.2.4. Questionnaire Design
After exposure to the unaccounted for water (UFW) with relevant engineers and
managers institutes, all of them reported that a huge part of water losses were used for
agriculture purposes. Noticed that Khan Younis governorate municipalities do not
grant any license for agricultural usage. So, farmers connected to the water municipal
networks illegally. In addition, high staff of relevant institutes proved these
assumption which is the detection of the agricultural illegal connections.
So the research oriented about relation between water losses percentage with
agricultural ownerships areas located in urban areas. As a result there was need to
make a questionnaire to find the relation connected between them.
To identify the agricultural water consumption of Khan Younis municipalities, the
researcher must study land use of the areas to define the urban areas that located
within municipal water networks borders. So; the researcher must study the water
distribution networks system maps, to identify the agricultural urban holdings. But in
the lack of actual maps, the researcher considered additional survey were taken from
local residents to located municipal water networks borders.
A 6 members helped to identify the areas that may be close to municipal water service
borders. They helped in identifying water municipals networks maps, and helped to
identify the samples places as the questionnaire was done in semi urban areas only.
Questionnaire studied the affect of freshness of desalinated water on ownerships
cultivated areas. The questionnaire for farmers related to the future situation after
existing of desalination plant.
As the Questionnaire studied the affect of freshness after the sea water desalination
plant existed, which is difficult for farmers to understand. The researcher made a
workshop for his volunteers in order to understand the questionnaire, saving time and
effort. Moreover, the researcher also conducted a structural interviews survey with
farmers using his volunteers, to make sure farmers are understand the questionnaire
well.
3.2.4.1. Water Distribution Zones in Khan Younis
As mentioned before, water distribution system of Khan Younis is an intermitted
supply. So, Khan Younis was divided into water distribution zones in order to cope
with the water scarcity. Due to the random spreading of the urban areas, in addition to
the nature of urban agriculture in Khan Younis; the existing water distribution map
was unclear. So, several interviews were held with Water Department and relevant
staff in order to prepare a map for water distribution zones. These maps have a major
Chapter 3: Study Area and Research Methodology
22
impact on easing the determination of the water losses in the water network in order
to determine the sample of questionnaire and location.
The water distribution networks maps of five municipalities, out of seven
municipalities are in old documentation system, where municipalities were used
papers not a new computerized programs for drawing their water networks.
Through the full cooperation from Khan Younis Municipalities with the researcher,
water distribution network maps for Khan Younis governorate in most zones were
developed utilizing hard copy. The network layout and characteristics were reviewed
including all water pipes, water wells, …etc. Khan Younis and Abassan Kabera were
the only two municipalities that have a moderate AutoCAD map that includes these
data which ease the task.
Several interviews survey were held with farmers as questionnaire and the MOA
relevant staff; in addition, to interviews with Khan Younis municipalities, to know
how the urban agriculture behavior for the current situation. Then to understand how
these regions are distributed in their agricultural activities, leading to identify future
agricultural consumptions on the light of current losses. Developing an equations to
expect the future situations depend on the cultivated areas.
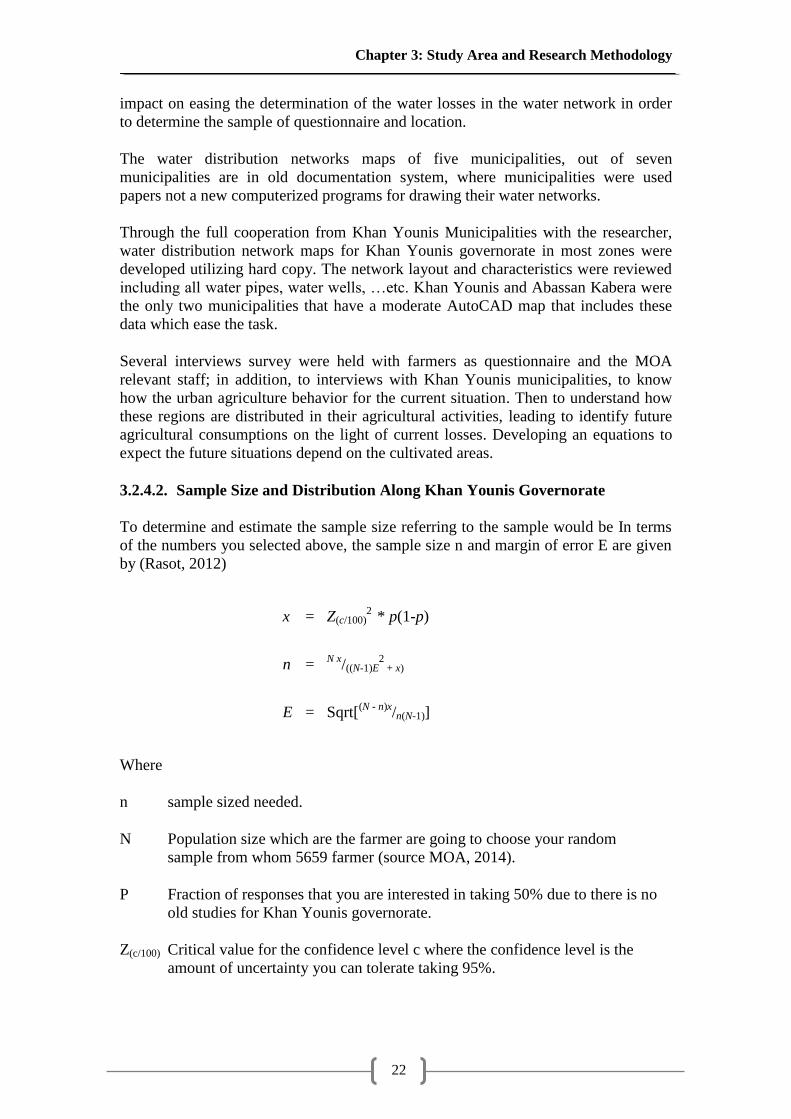
3.2.4.2. Sample Size and Distribution Along Khan Younis Governorate
To determine and estimate the sample size referring to the sample would be In terms
of the numbers you selected above, the sample size n and margin of error E are given
by (Rasot, 2012)
x = Z(c/100)2
* p(1-p)
n = N x
/((N-1)E2
+ x)
E = Sqrt[(N - n)x
/n(N-1)]
Where
n sample sized needed.
N Population size which are the farmer are going to choose your random
sample from whom 5659 farmer (source MOA, 2014).
P Fraction of responses that you are interested in taking 50% due to there is no
old studies for Khan Younis governorate.
Z(c/100) Critical value for the confidence level c where the confidence level is the
amount of uncertainty you can tolerate taking 95%.
Chapter 3: Study Area and Research Methodology
23
E Margin of error is the amount of error that you can tolerate taking 5% as most
common use for this equation.
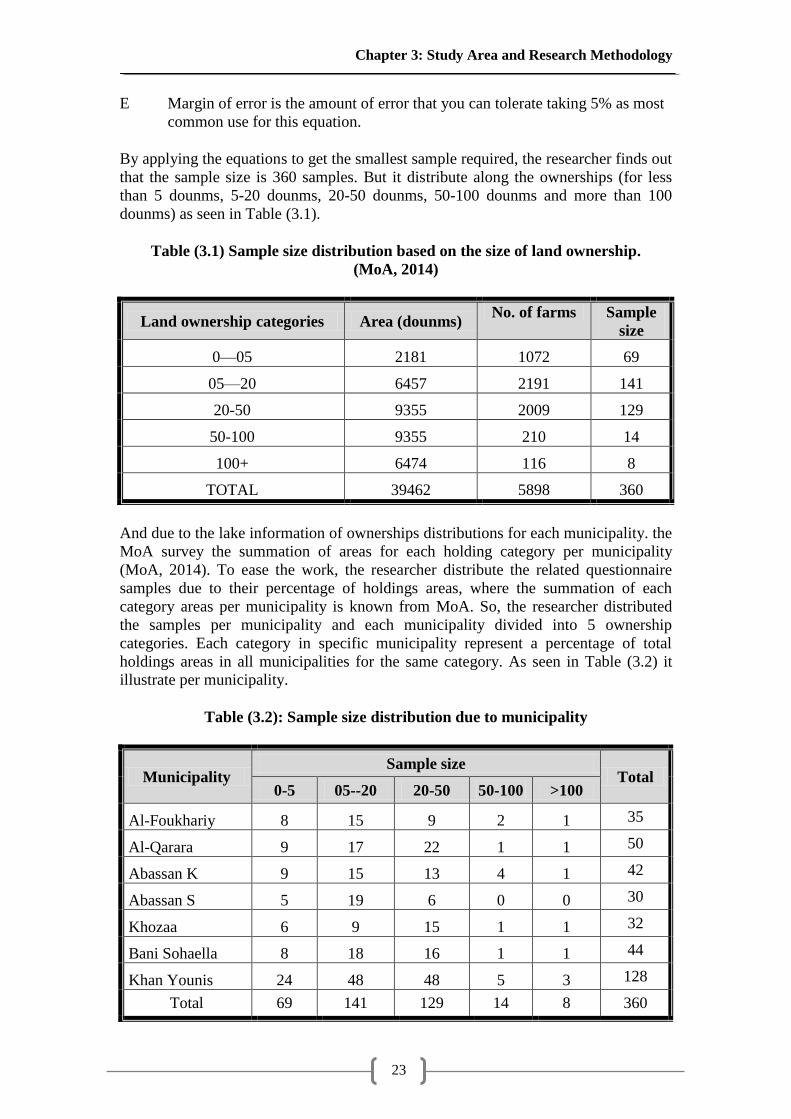
By applying the equations to get the smallest sample required, the researcher finds out
that the sample size is 360 samples. But it distribute along the ownerships (for less
than 5 dounms, 5-20 dounms, 20-50 dounms, 50-100 dounms and more than 100
dounms) as seen in Table (3.1).
Table (3.1) Sample size distribution based on the size of land ownership.
(MoA, 2014)
Land ownership categories Area (dounms) No. of farms Sample
size
0—05 2181 1072 69
05—20 6457 2191 141
20-50 9355 2009 129
50-100 9355 210 14
100+ 6474 116 8
TOTAL 39462 5898 360
And due to the lake information of ownerships distributions for each municipality. the
MoA survey the summation of areas for each holding category per municipality
(MoA, 2014). To ease the work, the researcher distribute the related questionnaire
samples due to their percentage of holdings areas, where the summation of each
category areas per municipality is known from MoA. So, the researcher distributed
the samples per municipality and each municipality divided into 5 ownership
categories. Each category in specific municipality represent a percentage of total
holdings areas in all municipalities for the same category. As seen in Table (3.2) it
illustrate per municipality.
Table (3.2): Sample size distribution due to municipality
Municipality Sample size
Total 0-5 05--20 20-50 50-100 >100
Al-Foukhariy 8 15 9 2 1 35
Al-Qarara 9 17 22 1 1 50
Abassan K 9 15 13 4 1 42
Abassan S 5 19 6 0 0 30
Khozaa 6 9 15 1 1 32
Bani Sohaella 8 18 16 1 1 44
Khan Younis 24 48 48 5 3 128
Total 69 141 129 14 8 360

Chapter 3: Study Area and Research Methodology
24
But, because there are some holding which does not represent the actually, the
researcher raised each holding in each municipality to 10 samples at least to be more
accurate. There are some municipalities that do not have specific holdings which
confused the questionnaire survey, moreover; the small number of samples does not
represent the sample in the municipalities. All of the above is according to the
research opinion, and the Table summations became 440 sample in order to be more
accurate and representative like the Table(3.3).
Table (3.3): Sample size distribution for each municipality of Khan Younis
Governorate
Municipality Sample size Total
0-5 05--20 20-50 50-100 >100
Al-Foukhariy 10 15 10 5 5 45
Al-Qarara 10 20 25 5 5 65
Abassan K 10 15 15 10 5 55
Abassan S 5 20 10 0 0 35
Khozaa 10 10 15 5 5 45
Bani Sohaella 10 20 20 5 5 60
Khan Younis 25 50 50 5 5 135
Total 80 150 145 35 30 440
3.2.4.3. Questionnaire Analysis with Software Program
The researcher used simple linear regression statistical model by Excel to analyze the
questionnaire data. And using where this soft program within the Features Excel are
Scheduled table data display, draw charts, multi- species and attractive. As a means of
expression and representation of the data in an easy, store, organize and retrieve data
easily (database).The Book of work can collect inside a large number of chips
Securities diverse worksheets, charts and papers and papers charts. The possibility of
adding all the shapes in the drawing toolbar in the worksheet. The researcher use
Excel in Analysis of the survey, and to draw graphs presentations in process of data
and drawing tools ease to the researcher developing and understand the relations.
(STATISTICA 10), the relationship between water losses percentile and cultivation
types areas per holdings can be theoretically defined. So, with the hypothesized UFW
scenarios, the different impacts on water losses indicated by the cubic meter where
agricultural areas by dounms.
STATISTICA is statistical software used around the world in more than 20 countries.
Stat Soft's STATISTIC line of software has gained unprecedented recognition by
users and reviewers. In addition to both basic and advanced statistics, STATISTICA
products offers specialized tools. where the researcher used the program to define the
relationship between water losses UFW and cultivation types areas per holdings
finding out the a linear regression relation. Also it enables statisticians and researchers
to conduct data mining in order to check their models‘ accuracy. One of the perfect
abilities of this statistical software is the high quality graphs.
Chapter 3: Study Area and Research Methodology
25
3.2.4.4. Expected Water Losses After the Sea Water Desalination plant
The researcher planned to make sure how the effect of farmer cultivations after the
sea water desalination plant constructed would affect the water balance which seemed
that the desalination is a solution for water problem. Moreover, the researcher needed
to know the behavior of user after the proposed desalination plant would construct
affecting by urban agriculture even the future impact of the yearly residential and
agricultural consumption regime can be obtained.
Evaluating the system without losses is the challenge for the researcher in which some
farmer thought that, if the residential usage from the ground water table is reduced to
reach low proportions, the ground water table will increased and the water will
become fresh of salts and pollutant. So, the water will become more fresh and
appropriate for new agricultural type.
3.2.4.5. Cost Analysis on The Light of UFW
Finally, Willingness to pay is a type of valuation technique for non-market goods.
Different survey methods are available for generating willingness to pay data.
However, cost evaluation per desalinated cubic meter is more difficult, where there
were two techniques of evaluation costs.
The first technique of cost analysis discuss two methods one of them mention that the
user pay 3 – 4 % of the individual yearly income. And the other related to the old cost
adding another limited cost for supporting by drinkable water referring to related
institutes, which will discuss the two methods later in chapter four. The second
technique of cost analysis also discuss two methods. One of them mention that the old
cost of undrinkable water which pumped to the municipal water distribution system
per cubic meter adding 25% of old cost to get the desalination cost per cubic meter.
And the second method of evaluation the cost of desalinated cubic meter related to
operation and maintaining costs, which discussed the two methods later in chapter
four.

Chapter 4: Results & Discussion
26
4 Chapter 4: Results & Discussion
Chapter 4: Results & Discussion
27
Chapter 4: Results & Discussion
4.1. Introduction
To achieve the objectives which mentioned in the first chapter; firstly it is important
to discuss and analyzing the municipal water meter readings and water supply. So,
several meetings, interviews and field visits were conducted with CMWU in both HQ
in Gaza City and its branch in Khan Younis city. Supplied water quantities were
calculated from the CMWU and Municipalities records. Meter reading quantities were
calculated by reviewing the recording meter quantities on special software managed
by the collection department in CMWU- Khan Younis, in addition to meetings with
Khan Younis Governorate Municipalities (Khan younis, Bani Sohaella, Abassan
Kabera, AL-Qarara, Khozaa, Abassan Saghera and AL-Foukhariy Municipalities).
The current meter readings behavior was identified by assessing the current water
losses situation. Water supply and meter readings behaviors were identified and
compared. The comparison included the water distribution network efficiency and
UFW for each municipality.
As agricultural activities form one of the basic income sources for Khan Younis‘s
population, in addition to being the largest water consumer. So current Agricultural
water consumption will be discussed, leading to develop general relation in between
urban agriculture areas and UFW to expect the future losses of municipal water after
the sea water desalination plant exist.
Water desalination process lay down as a solution for shortage of water which would
be discussed as expectation on the light of municipal water losses of the networks.
Expecting the future desalinated water losses behavior in most Khan Younis
governorate municipalities, connecting with expected future urban agriculture areas as
the result of the questionnaire which done on farmers in Khan Younis governorate
municipalities, specifying the future losses forecasting using the developed equation
from the current agricultural activities.
Finally, discussing the soci-economical factor as a studying the current bills situation
and expecting future costs after sea water desalination plant in terms of cubic meter
unit cost.
4.2. Khan Younis Water Distribution System
The production of Khan Younis wells was around 15 MCM in 2013 and the meter
readings was around 10 MCM, which means that the percentage of efficiency is 66%
(Municipalities, 2013). This bad efficiency is reflecting two things in this area; the
first thing refers to the efficiency of the water piped networks systems itself within the
domestic area which is obvious in the old city and old zones. The second reason refers
to the Unaccounted For Water (UFW) which is seen in the illegal connections from
the municipal networks for agricultural purposes.
Chapter 4: Results & Discussion
28
Quantity and quality are the problems of drinking water in Khan Younis, also The
water shortage of the networks are mainly caused by the distributions systems losses
which are estimated by 33% of the abstracted water by Khan Younis Municipalities.
Over 99.7% of Khan Younis residents currently have access to water networks
services, but unfortunately they are not receiving appropriate water quantities or
qualities.
As well as, the daily average per capita water production is 111 L/c.d but actually the
meter readings usage is 74L/c.d far below the World Health Organization
recommendations for urban populations (Municipalities and CMWU, 2013). Khan
Younis governorate water abstraction during 2013 reached 15 MCM, where the
monthly production of the governorate in the same year varied from 970,592 m3 to
1,472,354 m3. The general monthly average of Khan Younis‘s ground water
abstraction reaches 1,250,166 m3, which means that the average annual abstraction
will exceed 15 MCM.
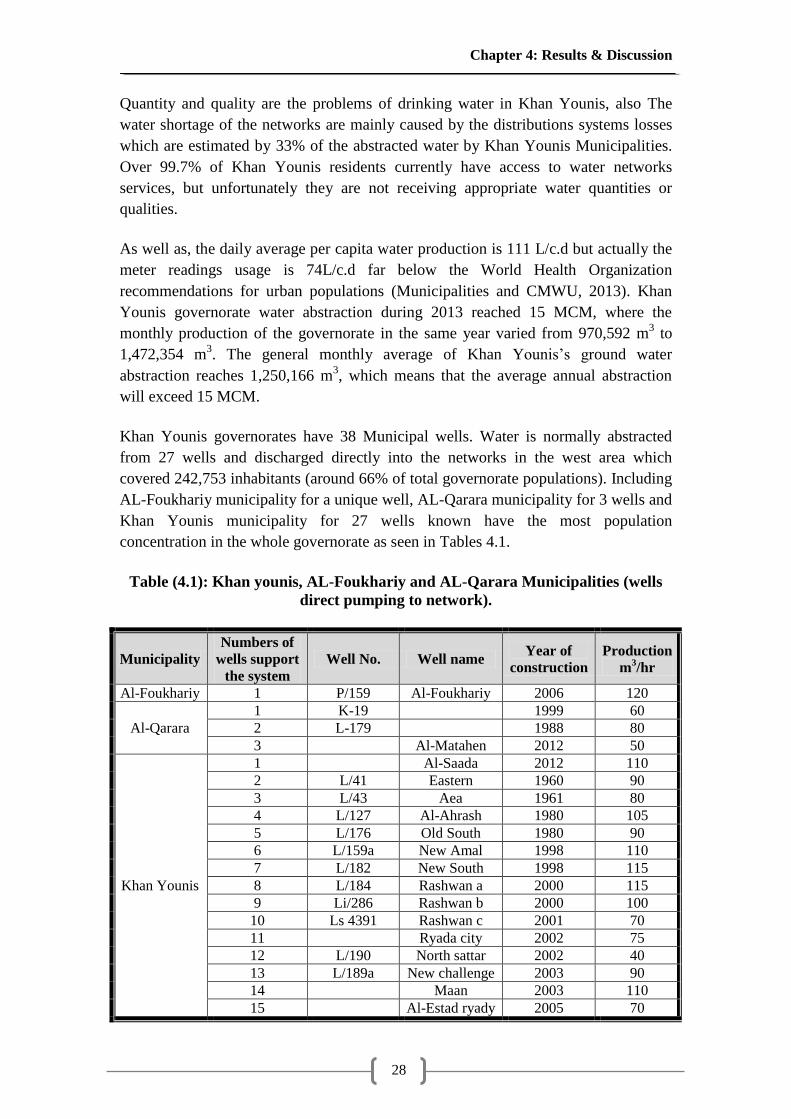
Khan Younis governorates have 38 Municipal wells. Water is normally abstracted
from 27 wells and discharged directly into the networks in the west area which
covered 242,753 inhabitants (around 66% of total governorate populations). Including
AL-Foukhariy municipality for a unique well, AL-Qarara municipality for 3 wells and
Khan Younis municipality for 27 wells known have the most population
concentration in the whole governorate as seen in Tables 4.1.
Table (4.1): Khan younis, AL-Foukhariy and AL-Qarara Municipalities (wells
direct pumping to network).
Municipality
Numbers of
wells support
the system
Well No. Well name Year of
construction
Production
m3/hr
Al-Foukhariy 1 P/159 Al-Foukhariy 2006 120
Al-Qarara
1 K-19
1999 60
2 L-179
1988 80
3
Al-Matahen 2012 50
Khan Younis
1
Al-Saada 2012 110
2 L/41 Eastern 1960 90
3 L/43 Aea 1961 80
4 L/127 Al-Ahrash 1980 105
5 L/176 Old South 1980 90
6 L/159a New Amal 1998 110
7 L/182 New South 1998 115
8 L/184 Rashwan a 2000 115
9 Li/286 Rashwan b 2000 100
10 Ls 4391 Rashwan c 2001 70
11
Ryada city 2002 75
12 L/190 North sattar 2002 40
13 L/189a New challenge 2003 90
14
Maan 2003 110
15
Al-Estad ryady 2005 70
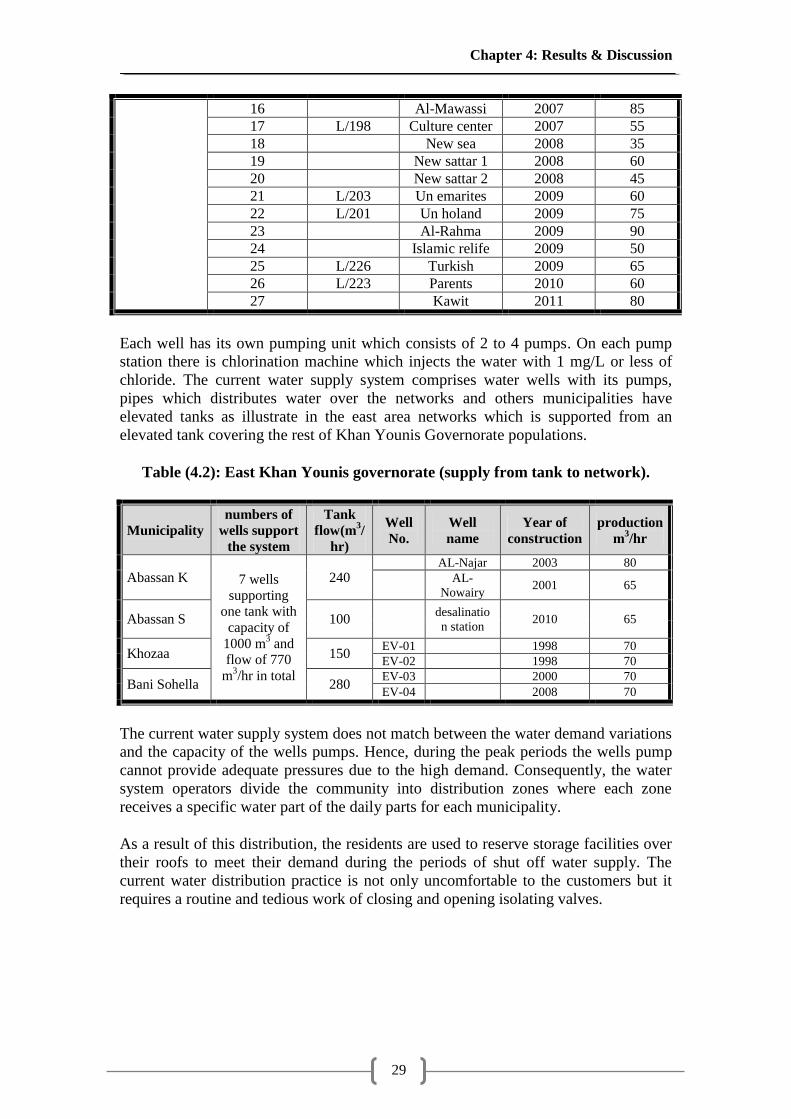
Chapter 4: Results & Discussion
29
16
Al-Mawassi 2007 85
17 L/198 Culture center 2007 55
18
New sea 2008 35
19
New sattar 1 2008 60
20
New sattar 2 2008 45
21 L/203 Un emarites 2009 60
22 L/201 Un holand 2009 75
23
Al-Rahma 2009 90
24
Islamic relife 2009 50
25 L/226 Turkish 2009 65
26 L/223 Parents 2010 60
27
Kawit 2011 80
Each well has its own pumping unit which consists of 2 to 4 pumps. On each pump
station there is chlorination machine which injects the water with 1 mg/L or less of
chloride. The current water supply system comprises water wells with its pumps,
pipes which distributes water over the networks and others municipalities have
elevated tanks as illustrate in the east area networks which is supported from an
elevated tank covering the rest of Khan Younis Governorate populations.
Table (4.2): East Khan Younis governorate (supply from tank to network).
Municipality
numbers of
wells support
the system
Tank
flow(m3/
hr)
Well
No.
Well
name
Year of
construction
production
m3/hr
Abassan K 7 wells
supporting
one tank with
capacity of
1000 m3 and
flow of 770
m3/hr in total
240
AL-Najar 2003 80
AL-
Nowairy 2001 65
Abassan S 100
desalinatio
n station 2010 65
Khozaa 150 EV-01
1998 70
EV-02
1998 70
Bani Sohella 280 EV-03
2000 70
EV-04
2008 70
The current water supply system does not match between the water demand variations
and the capacity of the wells pumps. Hence, during the peak periods the wells pump
cannot provide adequate pressures due to the high demand. Consequently, the water
system operators divide the community into distribution zones where each zone
receives a specific water part of the daily parts for each municipality.
As a result of this distribution, the residents are used to reserve storage facilities over
their roofs to meet their demand during the periods of shut off water supply. The
current water distribution practice is not only uncomfortable to the customers but it
requires a routine and tedious work of closing and opening isolating valves.
Chapter 4: Results & Discussion
30
4.2.1. Operating of Khan Younis Water Distribution System
Operating the water distribution system in Khan Younis Governorate is not that
difficult. Each member in each municipality needs to do his job to keep his eyes on
measurements of system performance whether the measurements are in the form of
pressure, flow or tank water levels.
Also, water system operations are inherently time-dependent and although the
operations of a water distribution system appear to be simple, it may require a great
deal of skill, especially if a system is complex especially in water and energy scarcity.
Water distribution systems can be operated either manually or automatically, but in
the whole of Khan Younis governorate, the systems have been operated manually for
years. Typically, operations are based on tank water levels. A liquid-level switch
senses the water level in the water storage tanks. So, the operator will either turn a
pump on or off depending on the water level in the tank. So, the ground water pump
station in Khan Younis Governorate has human operators whose primary function is
to monitor the pulse of the system and initiate actions based on system behavior. The
criteria that the operator uses to indicate whether the system is operating properly
largely depend on what is measured throughout the system.
Methods for distributing water networks depend on two methods of supporting the
network with water as the following methods illustrate:
1. Direct Supply from Wells (DSW): this distribution scheme is used in 3
Municipalities.
2. Water Tanks Supply (WTS): In this scheme the water is being abstracted from 7
different wells at different times. And there is a unique water tank, which is 1000
m3 in capacity and 770 in flow.
4.2.1.1. Operating Criteria
For all municipalities, operators operate pumps and valves so that wide pressures are
maintained within acceptable limits. Although it is considered to be acceptable may
vary from system to system, pressures in most cases should be kept above 207 kPa
(2.07 bar) and below 689 kPa (6.89 bar) during normal operations. Pressures much be
greater than 689 kPa tend to lose water through leaks and could damage residential
and commercial plumping systems or possibly cause main breaks. A pressure of 207
kPa allows water to be supplied only to the top floors of a multistory building.
Depending on the nature of the water supply system, minimum pressures greater than
207 kPa may have to be maintained at certain locations within the system. For
example, certain industries or hospitals may require a minimum pressure above 207
kPa so that equipment within the facility will function properly. If the water system
sells bulk amounts of water to an adjacent communities, that community will require
the water to be supplied at a minimum pressure of 345 kPa or higher. Operators must
consider such unique circumstances in their operating decisions.
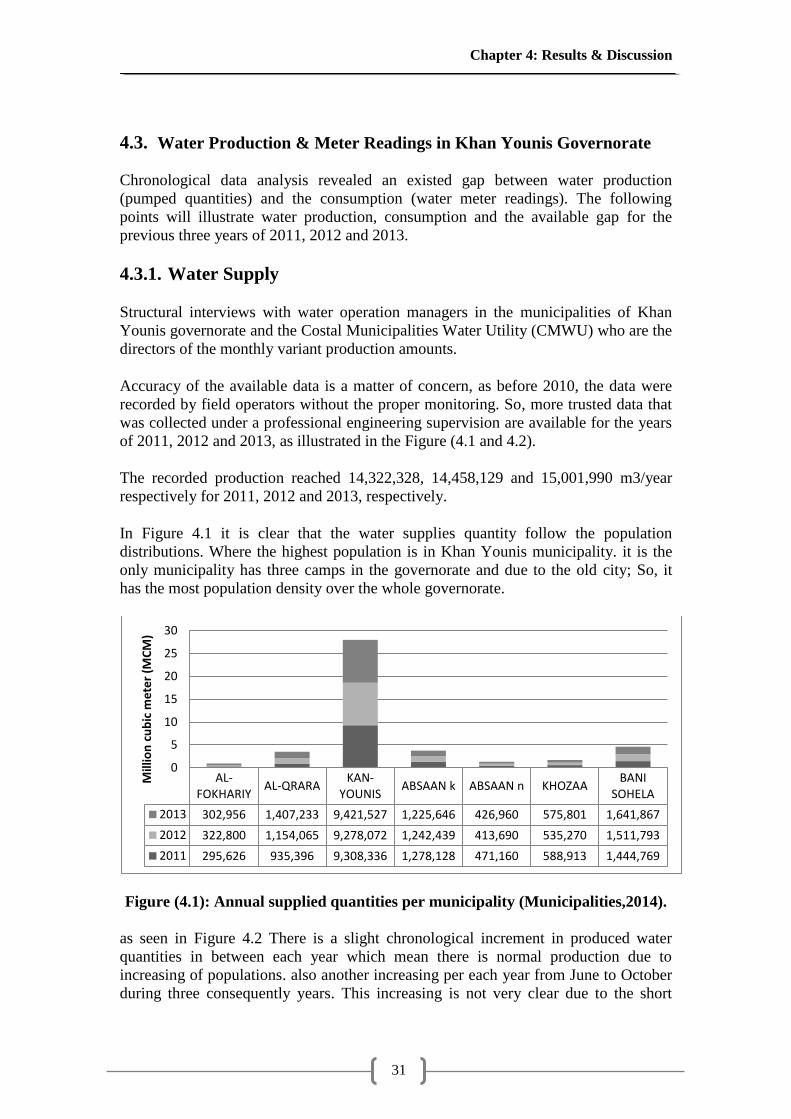
Chapter 4: Results & Discussion
31
4.3. Water Production & Meter Readings in Khan Younis Governorate
Chronological data analysis revealed an existed gap between water production
(pumped quantities) and the consumption (water meter readings). The following
points will illustrate water production, consumption and the available gap for the
previous three years of 2011, 2012 and 2013.
4.3.1. Water Supply
Structural interviews with water operation managers in the municipalities of Khan
Younis governorate and the Costal Municipalities Water Utility (CMWU) who are the
directors of the monthly variant production amounts.
Accuracy of the available data is a matter of concern, as before 2010, the data were
recorded by field operators without the proper monitoring. So, more trusted data that
was collected under a professional engineering supervision are available for the years
of 2011, 2012 and 2013, as illustrated in the Figure (4.1 and 4.2).
The recorded production reached 14,322,328, 14,458,129 and 15,001,990 m3/year
respectively for 2011, 2012 and 2013, respectively.
In Figure 4.1 it is clear that the water supplies quantity follow the population
distributions. Where the highest population is in Khan Younis municipality. it is the
only municipality has three camps in the governorate and due to the old city; So, it
has the most population density over the whole governorate.
Figure (4.1): Annual supplied quantities per municipality (Municipalities,2014).
as seen in Figure 4.2 There is a slight chronological increment in produced water
quantities in between each year which mean there is normal production due to
increasing of populations. also another increasing per each year from June to October
during three consequently years. This increasing is not very clear due to the short
AL-FOKHARIY
AL-QRARAKAN-
YOUNISABSAAN k ABSAAN n KHOZAA
BANISOHELA
2013 302,956 1,407,233 9,421,527 1,225,646 426,960 575,801 1,641,867
2012 322,800 1,154,065 9,278,072 1,242,439 413,690 535,270 1,511,793
2011 295,626 935,396 9,308,336 1,278,128 471,160 588,913 1,444,769
0
5
10
15
20
25
30
Mill
ion
cu
bic
me
ter
(MC
M)
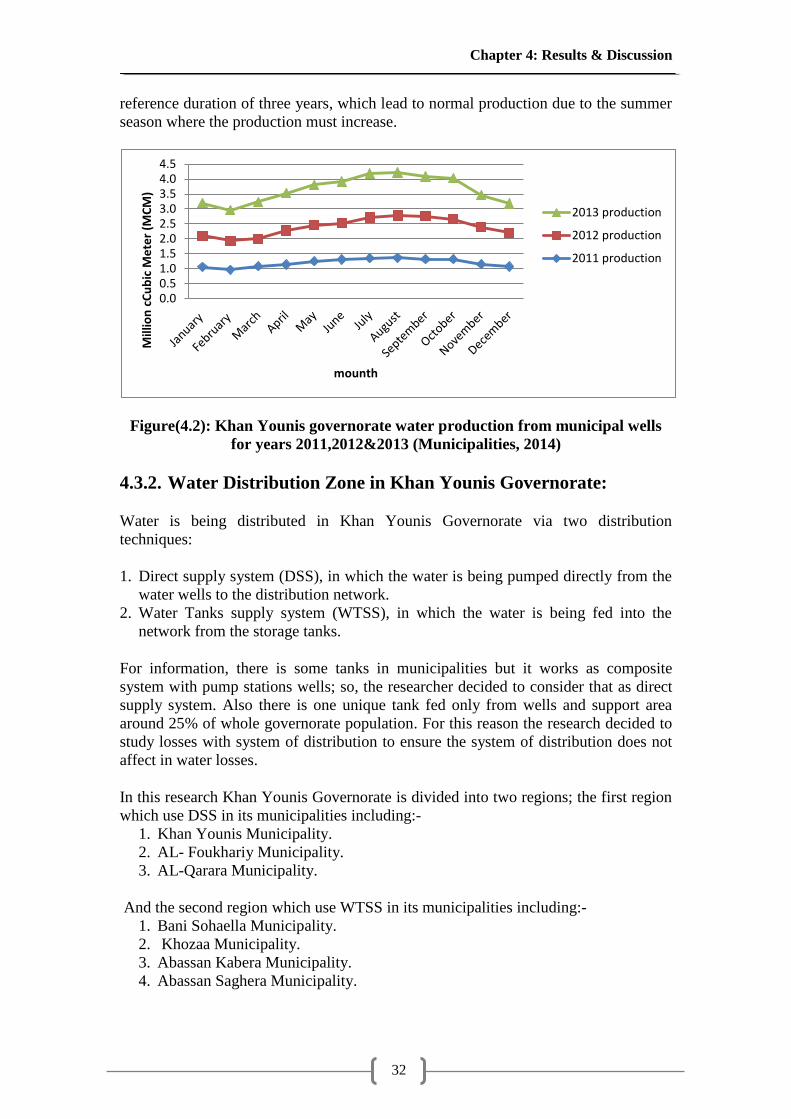
Chapter 4: Results & Discussion
32
reference duration of three years, which lead to normal production due to the summer
season where the production must increase.
Figure(4.2): Khan Younis governorate water production from municipal wells
for years 2011,2012&2013 (Municipalities, 2014)
4.3.2. Water Distribution Zone in Khan Younis Governorate:
Water is being distributed in Khan Younis Governorate via two distribution
techniques:
1. Direct supply system (DSS), in which the water is being pumped directly from the
water wells to the distribution network.
2. Water Tanks supply system (WTSS), in which the water is being fed into the
network from the storage tanks.
For information, there is some tanks in municipalities but it works as composite
system with pump stations wells; so, the researcher decided to consider that as direct
supply system. Also there is one unique tank fed only from wells and support area
around 25% of whole governorate population. For this reason the research decided to
study losses with system of distribution to ensure the system of distribution does not
affect in water losses.
In this research Khan Younis Governorate is divided into two regions; the first region
which use DSS in its municipalities including:-
1. Khan Younis Municipality.
2. AL- Foukhariy Municipality.
3. AL-Qarara Municipality.
And the second region which use WTSS in its municipalities including:-
1. Bani Sohaella Municipality.
2. Khozaa Municipality.
3. Abassan Kabera Municipality.
4. Abassan Saghera Municipality.
0.00.51.01.52.02.53.03.54.04.5
Mill
ion
cC
ub
ic M
ete
r (M
CM
)
mounth
2013 production
2012 production
2011 production
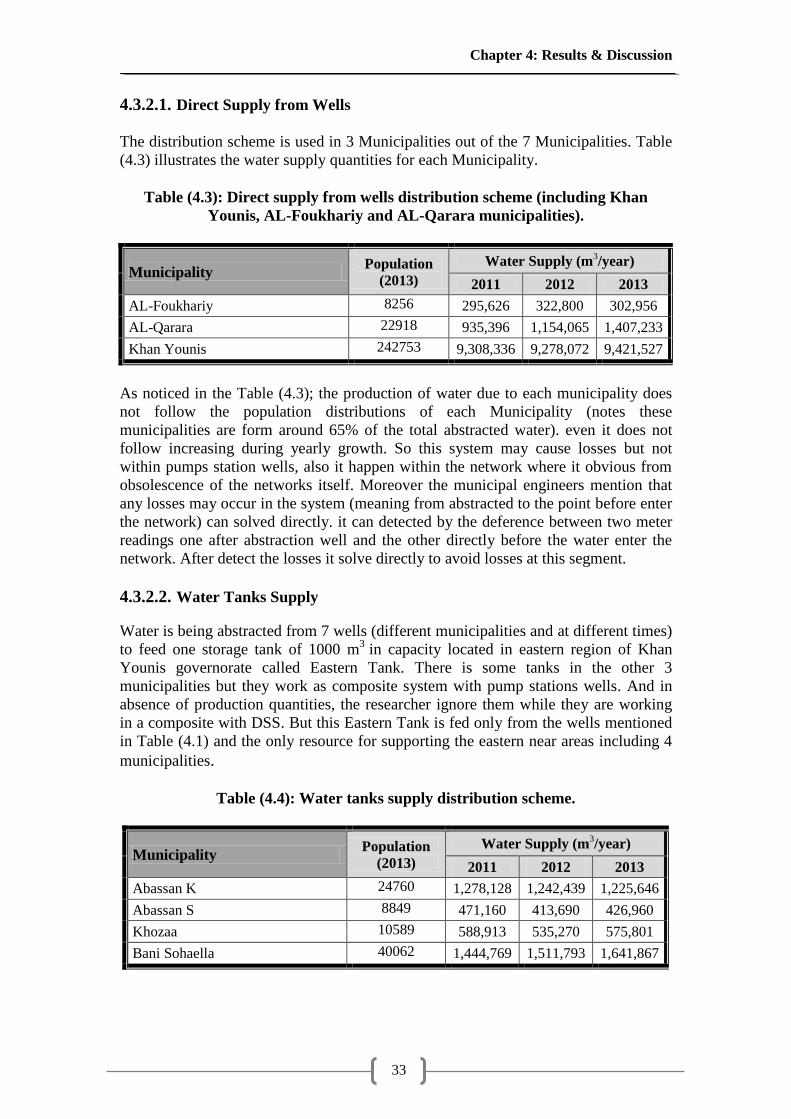
Chapter 4: Results & Discussion
33
4.3.2.1. Direct Supply from Wells
The distribution scheme is used in 3 Municipalities out of the 7 Municipalities. Table
(4.3) illustrates the water supply quantities for each Municipality.
Table (4.3): Direct supply from wells distribution scheme (including Khan
Younis, AL-Foukhariy and AL-Qarara municipalities).
Municipality Population
(2013)
Water Supply (m3/year)
2011 2012 2013
AL-Foukhariy 8256 295,626 322,800 302,956
AL-Qarara 22918 935,396 1,154,065 1,407,233
Khan Younis 242753 9,308,336 9,278,072 9,421,527
As noticed in the Table (4.3); the production of water due to each municipality does
not follow the population distributions of each Municipality (notes these
municipalities are form around 65% of the total abstracted water). even it does not
follow increasing during yearly growth. So this system may cause losses but not
within pumps station wells, also it happen within the network where it obvious from
obsolescence of the networks itself. Moreover the municipal engineers mention that
any losses may occur in the system (meaning from abstracted to the point before enter
the network) can solved directly. it can detected by the deference between two meter
readings one after abstraction well and the other directly before the water enter the
network. After detect the losses it solve directly to avoid losses at this segment.
4.3.2.2. Water Tanks Supply
Water is being abstracted from 7 wells (different municipalities and at different times)
to feed one storage tank of 1000 m3
in capacity located in eastern region of Khan
Younis governorate called Eastern Tank. There is some tanks in the other 3
municipalities but they work as composite system with pump stations wells. And in
absence of production quantities, the researcher ignore them while they are working
in a composite with DSS. But this Eastern Tank is fed only from the wells mentioned
in Table (4.1) and the only resource for supporting the eastern near areas including 4
municipalities.
Table (4.4): Water tanks supply distribution scheme.
Municipality Population
(2013)
Water Supply (m3/year)
2011 2012 2013
Abassan K 24760 1,278,128 1,242,439 1,225,646
Abassan S 8849 471,160 413,690 426,960
Khozaa 10589 588,913 535,270 575,801
Bani Sohaella 40062 1,444,769 1,511,793 1,641,867
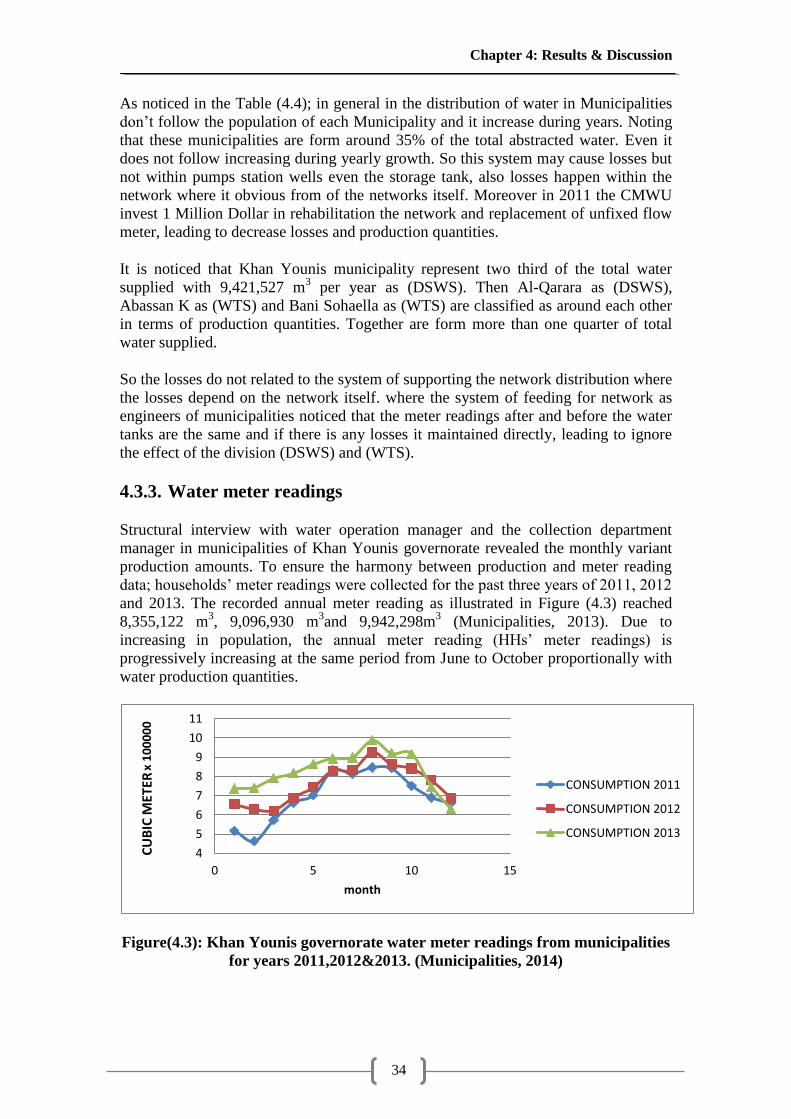
Chapter 4: Results & Discussion
34
As noticed in the Table (4.4); in general in the distribution of water in Municipalities
don‘t follow the population of each Municipality and it increase during years. Noting
that these municipalities are form around 35% of the total abstracted water. Even it
does not follow increasing during yearly growth. So this system may cause losses but
not within pumps station wells even the storage tank, also losses happen within the
network where it obvious from of the networks itself. Moreover in 2011 the CMWU
invest 1 Million Dollar in rehabilitation the network and replacement of unfixed flow
meter, leading to decrease losses and production quantities.
It is noticed that Khan Younis municipality represent two third of the total water
supplied with 9,421,527 m3 per year as (DSWS). Then Al-Qarara as (DSWS),
Abassan K as (WTS) and Bani Sohaella as (WTS) are classified as around each other
in terms of production quantities. Together are form more than one quarter of total
water supplied.
So the losses do not related to the system of supporting the network distribution where
the losses depend on the network itself. where the system of feeding for network as
engineers of municipalities noticed that the meter readings after and before the water
tanks are the same and if there is any losses it maintained directly, leading to ignore
the effect of the division (DSWS) and (WTS).
4.3.3. Water meter readings
Structural interview with water operation manager and the collection department
manager in municipalities of Khan Younis governorate revealed the monthly variant
production amounts. To ensure the harmony between production and meter reading
data; households‘ meter readings were collected for the past three years of 2011, 2012
and 2013. The recorded annual meter reading as illustrated in Figure (4.3) reached
8,355,122 m3, 9,096,930 m
3and 9,942,298m
3 (Municipalities, 2013). Due to
increasing in population, the annual meter reading (HHs‘ meter readings) is
progressively increasing at the same period from June to October proportionally with
water production quantities.
Figure(4.3): Khan Younis governorate water meter readings from municipalities
for years 2011,2012&2013. (Municipalities, 2014)
4
5
6
7
8
9
10
11
0 5 10 15
CU
BIC
MET
ER x
10
00
00
month
CONSUMPTION 2011
CONSUMPTION 2012
CONSUMPTION 2013

Chapter 4: Results & Discussion
35
Figure (4.4) illustrates the variant per capita consumed in terms of water meter
readings quantity per each municipality. Khozaa is the municipality with the highest
per capita meter reading during 2011, 2012 and 2013 with 126 L/c.d, 119 L/c.d and
106 L/c.d, respectively. And Khan Younis has the lowest per capita supply during
2011 and 2012 with 57 L/c.d and 65 L/c.d respectively, and AL-Qarara municipality
has the lowest per capita supply of 60 L/c.d in 2013. All the lowest per capita meter
reading is far below the world health organization.
Figure (4.4): Meter reading per capital in each municipality of Khan Younis
governorate municipalities.
Whereby these findings in Figure (4.4), match with the daily water supply rate in the
developing countries, which is very low compared to the industrial world. In India, it
ranges from 16 to 300 liters per day depending on the municipality and the economic
strata (Singh, 2000), whereas. It ranges from 100 to 600 liters per day in the
developed countries. Other populations that are not served by piped water supply
receive even smaller amount of water.
4.3.4. Water Production vs. Meter Reading
Data analysis revealed that meter reading quantities verified by Households‘ water
meter readings for the past three years in a way below the pumped quantities. The
max average yearly gap between the produced and the actual meter reading quantities
reached 5,967,206 m3 in 2011, while 5,361,199 m
3in 2012 and 5,059,693 m
3 in 2013
Table (4.5).
This gap is considered as water losses which seems to be not really ok that amount is
decreased along the increase of population and land use area; but all of this decreasing
refer to CMWU investment over 4,500,000 US$ in all municipalities as engineer‘s
notes.
The water losses reached 39.14% of the average produced water quantities during the
three reference years over the governorate. So, domestic water consumers are
receiving only 60.86% of their water entitlements.
0
20
40
60
80
100
120
140
(L/c
.d)
Municipality
meter reading for (2011)
meter reading for (2012)
meter reading for (2013)
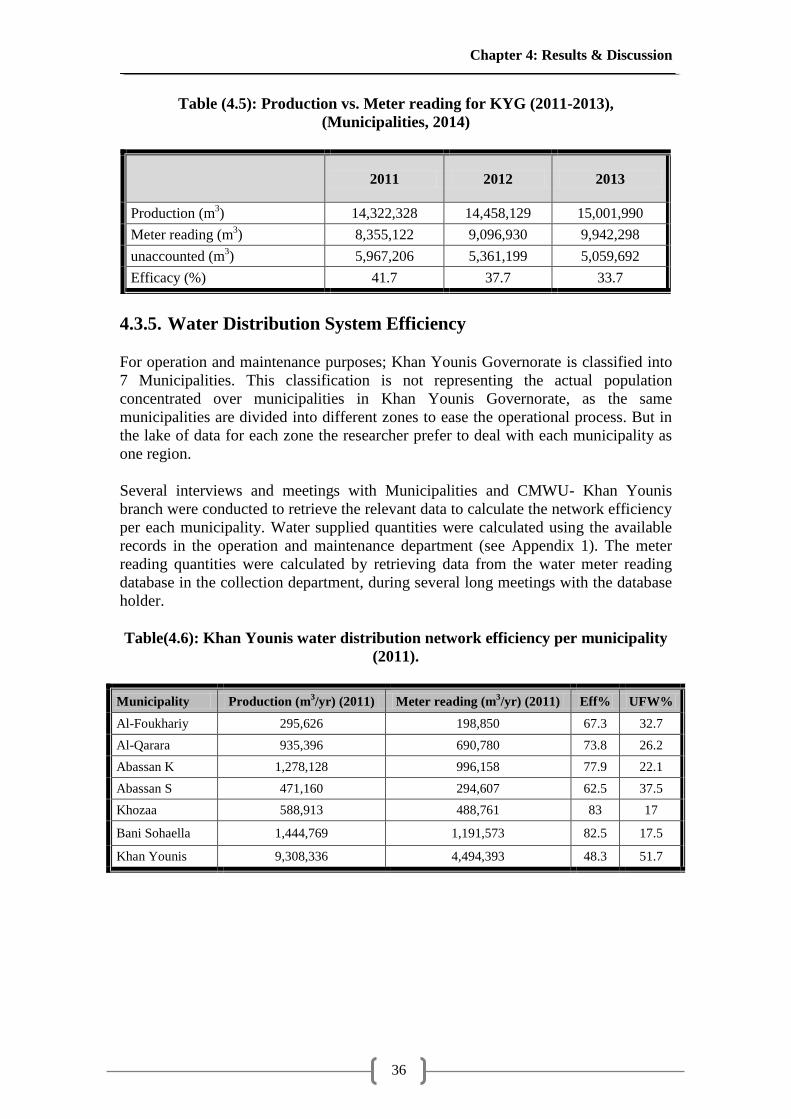
Chapter 4: Results & Discussion
36
Table (4.5): Production vs. Meter reading for KYG (2011-2013),
(Municipalities, 2014)
2011 2012 2013
Production (m3) 14,322,328 14,458,129 15,001,990
Meter reading (m3) 8,355,122 9,096,930 9,942,298
unaccounted (m3) 5,967,206 5,361,199 5,059,692
Efficacy (%) 41.7 37.7 33.7
4.3.5. Water Distribution System Efficiency
For operation and maintenance purposes; Khan Younis Governorate is classified into
7 Municipalities. This classification is not representing the actual population
concentrated over municipalities in Khan Younis Governorate, as the same
municipalities are divided into different zones to ease the operational process. But in
the lake of data for each zone the researcher prefer to deal with each municipality as
one region.
Several interviews and meetings with Municipalities and CMWU- Khan Younis
branch were conducted to retrieve the relevant data to calculate the network efficiency
per each municipality. Water supplied quantities were calculated using the available
records in the operation and maintenance department (see Appendix 1). The meter
reading quantities were calculated by retrieving data from the water meter reading
database in the collection department, during several long meetings with the database
holder.
Table(4.6): Khan Younis water distribution network efficiency per municipality
(2011).
Municipality Production (m3/yr) (2011) Meter reading (m
3/yr) (2011) Eff% UFW%
Al-Foukhariy 295,626 198,850 67.3 32.7
Al-Qarara 935,396 690,780 73.8 26.2
Abassan K 1,278,128 996,158 77.9 22.1
Abassan S 471,160 294,607 62.5 37.5
Khozaa 588,913 488,761 83 17
Bani Sohaella 1,444,769 1,191,573 82.5 17.5
Khan Younis 9,308,336 4,494,393 48.3 51.7
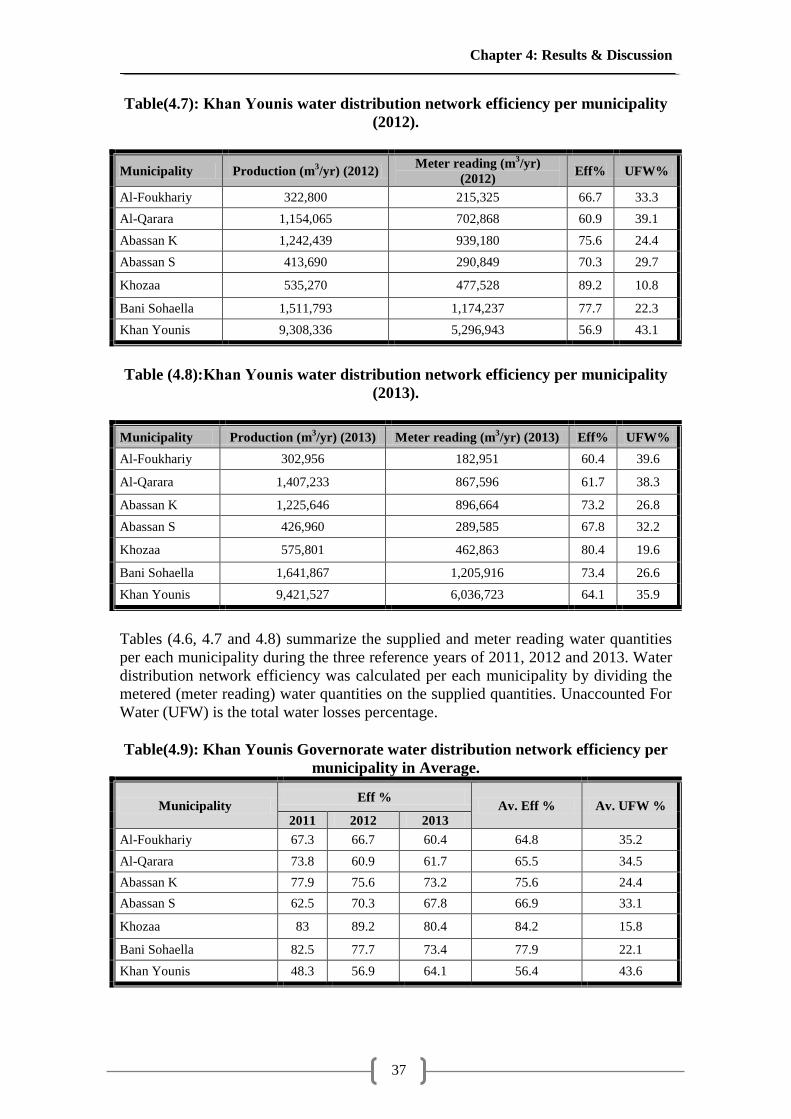
Chapter 4: Results & Discussion
37
Table(4.7): sinaoY nahK water distribution network efficiency per municipality
(2012).
Municipality Production (m3/yr) (2012)
Meter reading (m3/yr)
(2012) Eff% UFW%
Al-Foukhariy 322,800 215,325 66.7 33.3
Al-Qarara 1,154,065 702,868 60.9 39.1
Abassan K 1,242,439 939,180 75.6 24.4
Abassan S 413,690 290,849 70.3 29.7
Khozaa 535,270 477,528 89.2 10.8
Bani Sohaella 1,511,793 1,174,237 77.7 22.3
Khan Younis 9,308,336 5,296,943 56.9 43.1
Table (4.8):sinaoY nahK water distribution network efficiency per municipality
(2013).
Municipality Production (m3/yr) (2013) Meter reading (m
3/yr) (2013) Eff% UFW%
Al-Foukhariy 302,956 182,951 60.4 39.6
Al-Qarara 1,407,233 867,596 61.7 38.3
Abassan K 1,225,646 896,664 73.2 26.8
Abassan S 426,960 289,585 67.8 32.2
Khozaa 575,801 462,863 80.4 19.6
Bani Sohaella 1,641,867 1,205,916 73.4 26.6
Khan Younis 9,421,527 6,036,723 64.1 35.9
Tables (4.6, 4.7 and 4.8) summarize the supplied and meter reading water quantities
per each municipality during the three reference years of 2011, 2012 and 2013. Water
distribution network efficiency was calculated per each municipality by dividing the
metered (meter reading) water quantities on the supplied quantities. Unaccounted For
Water (UFW) is the total water losses percentage.
Table(4.9): Khan Younis Governorate water distribution network efficiency per
municipality in Average.
Municipality Eff %
Av. Eff % Av. UFW % 2011 2012 2013
Al-Foukhariy 67.3 66.7 60.4 64.8 35.2
Al-Qarara 73.8 60.9 61.7 65.5 34.5
Abassan K 77.9 75.6 73.2 75.6 24.4
Abassan S 62.5 70.3 67.8 66.9 33.1
Khozaa 83 89.2 80.4 84.2 15.8
Bani Sohaella 82.5 77.7 73.4 77.9 22.1
Khan Younis 48.3 56.9 64.1 56.4 43.6
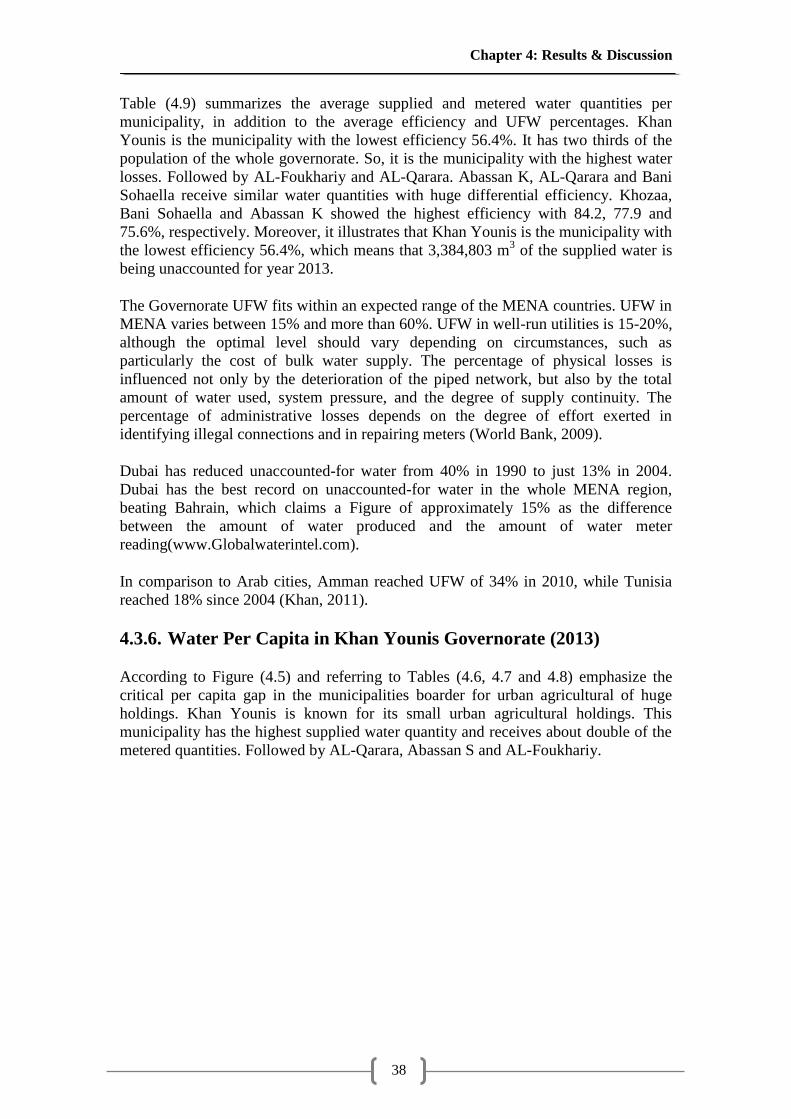
Chapter 4: Results & Discussion
38
Table (4.9) summarizes the average supplied and metered water quantities per
municipality, in addition to the average efficiency and UFW percentages. Khan
Younis is the municipality with the lowest efficiency 56.4%. It has two thirds of the
population of the whole governorate. So, it is the municipality with the highest water
losses. Followed by AL-Foukhariy and AL-Qarara. Abassan K, AL-Qarara and Bani
Sohaella receive similar water quantities with huge differential efficiency. Khozaa,
Bani Sohaella and Abassan K showed the highest efficiency with 84.2, 77.9 and
75.6%, respectively. Moreover, it illustrates that Khan Younis is the municipality with
the lowest efficiency 56.4%, which means that 3,384,803 m3 of the supplied water is
being unaccounted for year 2013.
The Governorate UFW fits within an expected range of the MENA countries. UFW in
MENA varies between 15% and more than 60%. UFW in well-run utilities is 15-20%,
although the optimal level should vary depending on circumstances, such as
particularly the cost of bulk water supply. The percentage of physical losses is
influenced not only by the deterioration of the piped network, but also by the total
amount of water used, system pressure, and the degree of supply continuity. The
percentage of administrative losses depends on the degree of effort exerted in
identifying illegal connections and in repairing meters (World Bank, 2009).
Dubai has reduced unaccounted-for water from 40% in 1990 to just 13% in 2004.
Dubai has the best record on unaccounted-for water in the whole MENA region,
beating Bahrain, which claims a Figure of approximately 15% as the difference
between the amount of water produced and the amount of water meter
reading(www.Globalwaterintel.com).
In comparison to Arab cities, Amman reached UFW of 34% in 2010, while Tunisia
reached 18% since 2004 (Khan, 2011).
4.3.6. Water Per Capita in Khan Younis Governorate (2013)
According to Figure (4.5) and referring to Tables (4.6, 4.7 and 4.8) emphasize the
critical per capita gap in the municipalities boarder for urban agricultural of huge
holdings. Khan Younis is known for its small urban agricultural holdings. This
municipality has the highest supplied water quantity and receives about double of the
metered quantities. Followed by AL-Qarara, Abassan S and AL-Foukhariy.
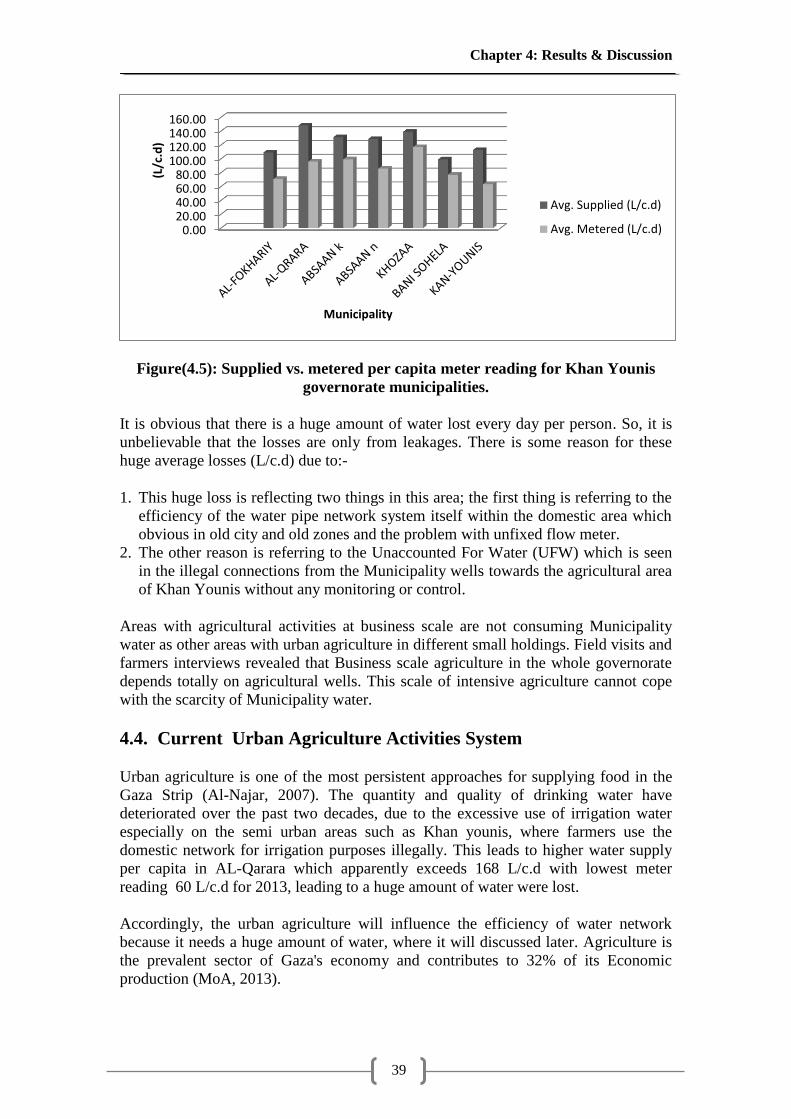
Chapter 4: Results & Discussion
39
Figure(4.5): Supplied vs. metered per capita meter reading for Khan Younis
governorate municipalities.
It is obvious that there is a huge amount of water lost every day per person. So, it is
unbelievable that the losses are only from leakages. There is some reason for these
huge average losses (L/c.d) due to:-
1. This huge loss is reflecting two things in this area; the first thing is referring to the
efficiency of the water pipe network system itself within the domestic area which
obvious in old city and old zones and the problem with unfixed flow meter.
2. The other reason is referring to the Unaccounted For Water (UFW) which is seen
in the illegal connections from the Municipality wells towards the agricultural area
of Khan Younis without any monitoring or control.
Areas with agricultural activities at business scale are not consuming Municipality
water as other areas with urban agriculture in different small holdings. Field visits and
farmers interviews revealed that Business scale agriculture in the whole governorate
depends totally on agricultural wells. This scale of intensive agriculture cannot cope
with the scarcity of Municipality water.
4.4. Current Urban Agriculture Activities System
Urban agriculture is one of the most persistent approaches for supplying food in the
Gaza Strip (Al-Najar, 2007). The quantity and quality of drinking water have
deteriorated over the past two decades, due to the excessive use of irrigation water
especially on the semi urban areas such as Khan younis, where farmers use the
domestic network for irrigation purposes illegally. This leads to higher water supply
per capita in AL-Qarara which apparently exceeds 168 L/c.d with lowest meter
reading 60 L/c.d for 2013, leading to a huge amount of water were lost.
Accordingly, the urban agriculture will influence the efficiency of water network
because it needs a huge amount of water, where it will discussed later. Agriculture is
the prevalent sector of Gaza's economy and contributes to 32% of its Economic
production (MoA, 2013).
0.0020.0040.0060.0080.00
100.00120.00140.00160.00
(L/c
.d)
Municipality
Avg. Supplied (L/c.d)
Avg. Metered (L/c.d)
Chapter 4: Results & Discussion
40
―Agriculture in Gaza Strip is already more urban than rural‖ which was one of the
conclusions of the Gaza Urban Agriculture Committee (GUAC) workshop in 2000,
referring to the high degree of urbanization of the area, the potentials for urban
agriculture in Gaza simply cannot be neglected.
Most of the agricultural areas are located within and surrounding the denser
residential areas. Therefore, this type of agriculture could be classified as urban
agriculture due to its location.
Moreover for Gaza Strip, olive and fruit trees (including:- Citrus and Fruits),
vegetables and green houses are together cultivated close to the built up areas.
Whereby the majority of irrigated area in Gaza Strip is estimated to be about 176,000
dounms and the total supply is estimated to be about 85MCM (Al-Najar, 2007).
This emphasized that, In the Gaza Strip irrigation practices are only based on the
farmer‘s own experience. They determine when and how to irrigate crops based on
the appearance of the soil. So, the irrigation practice exceeds the irrigation water
requirement by 30% leading to overexploitation of groundwater and increasing the
operational cost of water supply network (Al-Najar, 2011).
Gaza is still characterized by a rapid increase of population, expansion of cities and
refugee camps. Large-scale export-oriented agricultural production has reached its
limits of land-use availability At the same time, it confronted with the socio-economic
demands related to food insecurity and the need for the coming generation.
Chemically intensive, unsustainable farming practices are leading to soil degradation,
depletion and contamination of the vulnerable water resources. Increasing competition
among urban needs makes soil and especially water very limited resources.
The municipalities of Khan Younis have not a clear map showing the water
distribution districts and the location of the wells. The proposed district division has
been redrawn on the structure map of the municipalities.
All water wells were also redrawn on the structural map of whole municipalities. This
map was not available for all municipalities on portable matter like arch map (GIS
application) nor Auto Cade to the municipalities, but available in old documentation
system with its final old constitutions and when the researcher tried to draw in
familiar program some municipalities get ready but the data in that maps wasn‘t
enough to get the aim specifying of agricultural holdings with their location.
So, using a team of 6 members selected from the urban areas to the survey. The team
has good knowledge of urban and rural area. Using old Google map 2010 just to
inform the team members and the helping of municipalities engineers. During the
survey, the agricultural land in the areas each municipality water distribution has been
well known by the team members and engineers of each municipality. Surveyed
100% of urban agriculture to make sure that it would be well distributed, known that
the urban area does not depend on how far from residential. But if the area has
reached a piping water services from the municipality or not, and Vice versa.
Determination of water distributions system have a significant impact in defining the
water losses regions in the municipal water networks, leading to develops map for
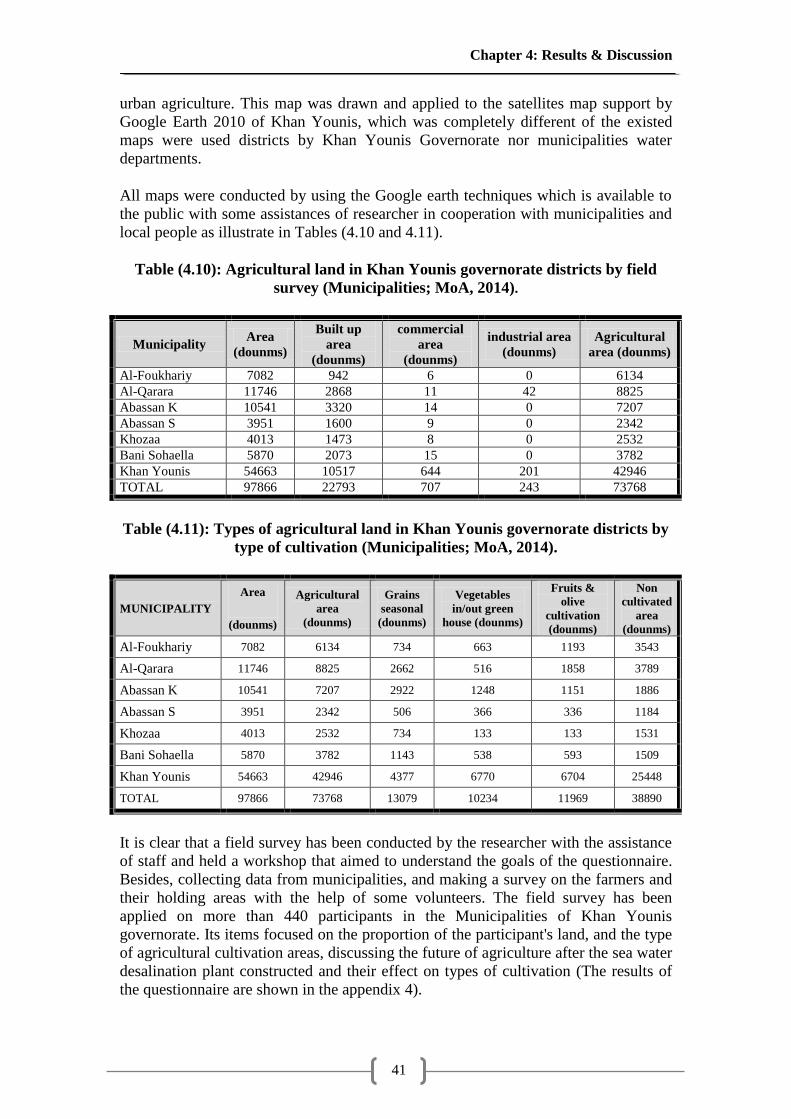
Chapter 4: Results & Discussion
41
urban agriculture. This map was drawn and applied to the satellites map support by
Google Earth 2010 of Khan Younis, which was completely different of the existed
maps were used districts by Khan Younis Governorate nor municipalities water
departments.
All maps were conducted by using the Google earth techniques which is available to
the public with some assistances of researcher in cooperation with municipalities and
local people as illustrate in Tables (4.10 and 4.11).
Table (4.10): Agricultural land in Khan Younis governorate districts by field
survey (Municipalities; MoA, 2014).
Municipality Area
(dounms)
Built up
area
(dounms)
commercial
area
(dounms)
industrial area
(dounms)
Agricultural
area (dounms)
Al-Foukhariy 7082 942 6 0 6134
Al-Qarara 11746 2868 11 42 8825
Abassan K 10541 3320 14 0 7207
Abassan S 3951 1600 9 0 2342
Khozaa 4013 1473 8 0 2532
Bani Sohaella 5870 2073 15 0 3782
Khan Younis 54663 10517 644 201 42946
TOTAL 97866 22793 707 243 73768
Table (4.11): Types of agricultural land in Khan Younis governorate districts by
type of cultivation (Municipalities; MoA, 2014).
MUNICIPALITY
Area
(dounms)
Agricultural
area
(dounms)
Grains
seasonal
(dounms)
Vegetables
in/out green
house (dounms)
Fruits &
olive
cultivation
(dounms)
Non
cultivated
area
(dounms)
Al-Foukhariy 7082 6134 734 663 1193 3543
Al-Qarara 11746 8825 2662 516 1858 3789
Abassan K 10541 7207 2922 1248 1151 1886
Abassan S 3951 2342 506 366 336 1184
Khozaa 4013 2532 734 133 133 1531
Bani Sohaella 5870 3782 1143 538 593 1509
Khan Younis 54663 42946 4377 6770 6704 25448
TOTAL 97866 73768 13079 10234 11969 38890
It is clear that a field survey has been conducted by the researcher with the assistance
of staff and held a workshop that aimed to understand the goals of the questionnaire.
Besides, collecting data from municipalities, and making a survey on the farmers and
their holding areas with the help of some volunteers. The field survey has been
applied on more than 440 participants in the Municipalities of Khan Younis
governorate. Its items focused on the proportion of the participant's land, and the type
of agricultural cultivation areas, discussing the future of agriculture after the sea water
desalination plant constructed and their effect on types of cultivation (The results of
the questionnaire are shown in the appendix 4).
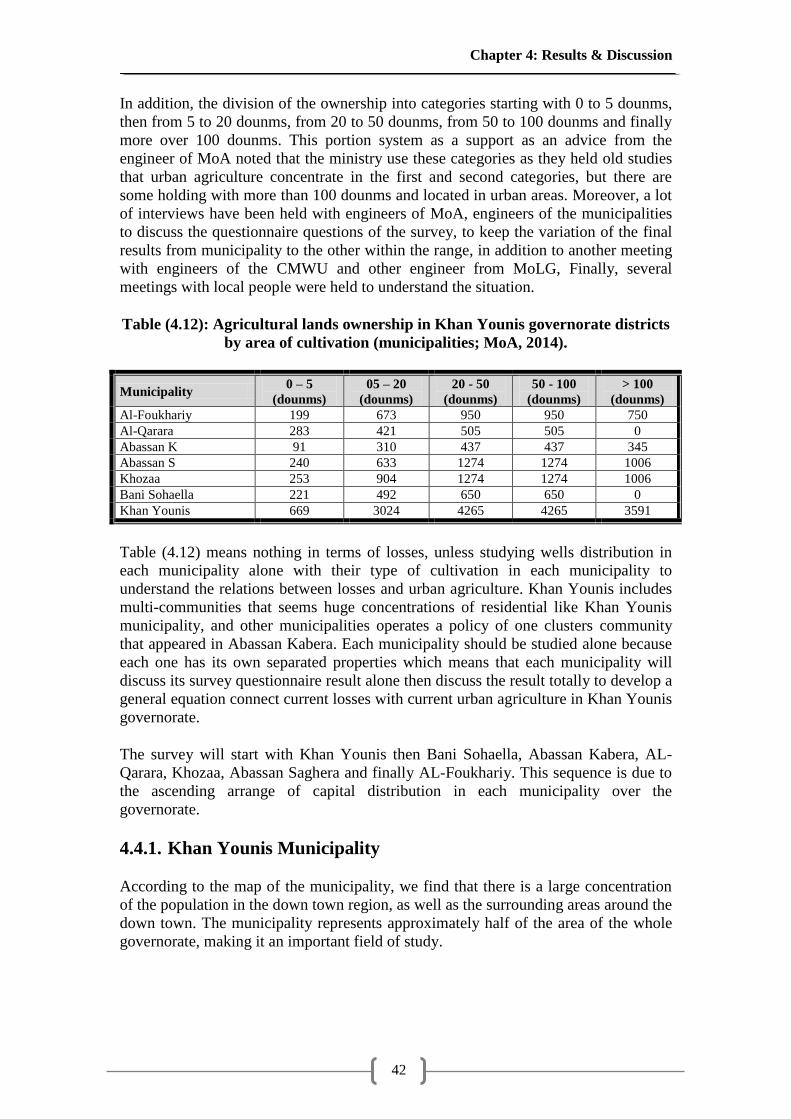
Chapter 4: Results & Discussion
42
In addition, the division of the ownership into categories starting with 0 to 5 dounms,
then from 5 to 20 dounms, from 20 to 50 dounms, from 50 to 100 dounms and finally
more over 100 dounms. This portion system as a support as an advice from the
engineer of MoA noted that the ministry use these categories as they held old studies
that urban agriculture concentrate in the first and second categories, but there are
some holding with more than 100 dounms and located in urban areas. Moreover, a lot
of interviews have been held with engineers of MoA, engineers of the municipalities
to discuss the questionnaire questions of the survey, to keep the variation of the final
results from municipality to the other within the range, in addition to another meeting
with engineers of the CMWU and other engineer from MoLG, Finally, several
meetings with local people were held to understand the situation.
Table (4.12): Agricultural lands ownership in Khan Younis governorate districts
by area of cultivation (municipalities; MoA, 2014).
Municipality 0 – 5
(dounms)
05 – 20
(dounms)
20 - 50
(dounms)
50 - 100
(dounms)
> 100
(dounms)
Al-Foukhariy 199 673 950 950 750
Al-Qarara 283 421 505 505 0
Abassan K 91 310 437 437 345
Abassan S 240 633 1274 1274 1006
Khozaa 253 904 1274 1274 1006
Bani Sohaella 221 492 650 650 0
Khan Younis 669 3024 4265 4265 3591
Table (4.12) means nothing in terms of losses, unless studying wells distribution in
each municipality alone with their type of cultivation in each municipality to
understand the relations between losses and urban agriculture. Khan Younis includes
multi-communities that seems huge concentrations of residential like Khan Younis
municipality, and other municipalities operates a policy of one clusters community
that appeared in Abassan Kabera. Each municipality should be studied alone because
each one has its own separated properties which means that each municipality will
discuss its survey questionnaire result alone then discuss the result totally to develop a
general equation connect current losses with current urban agriculture in Khan Younis
governorate.
The survey will start with Khan Younis then Bani Sohaella, Abassan Kabera, AL-
Qarara, Khozaa, Abassan Saghera and finally AL-Foukhariy. This sequence is due to
the ascending arrange of capital distribution in each municipality over the
governorate.
4.4.1. Khan Younis Municipality
According to the map of the municipality, we find that there is a large concentration
of the population in the down town region, as well as the surrounding areas around the
down town. The municipality represents approximately half of the area of the whole
governorate, making it an important field of study.
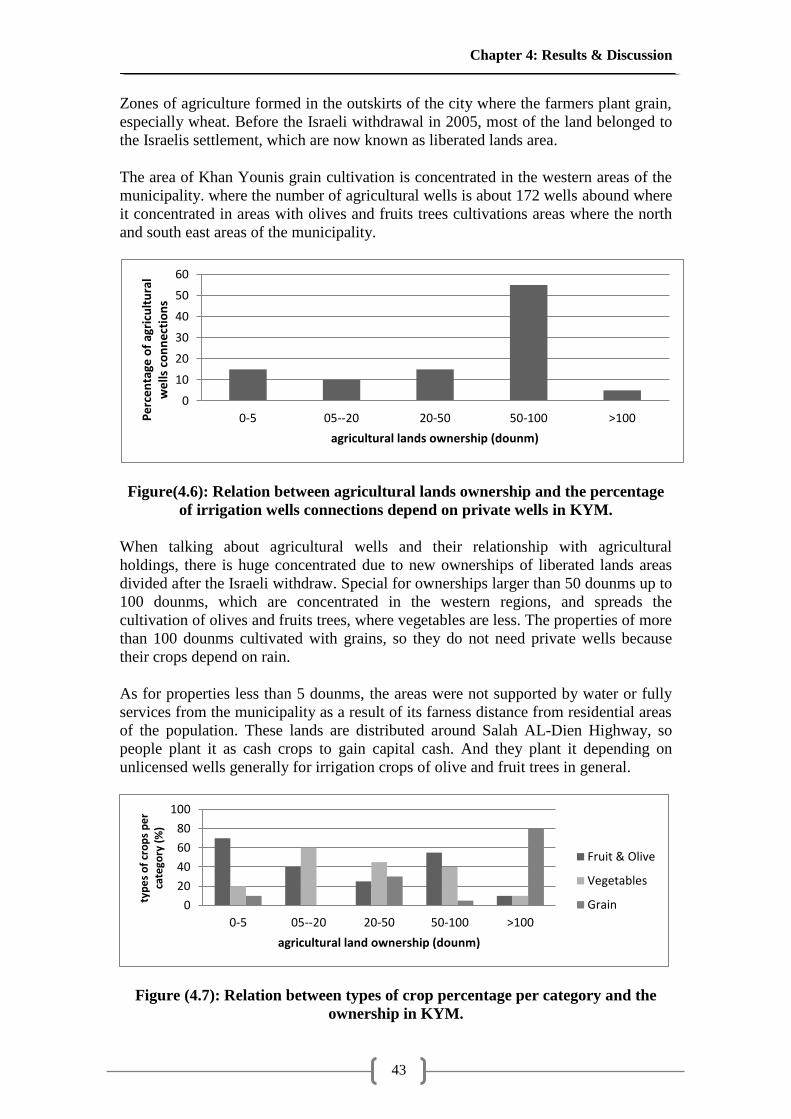
Chapter 4: Results & Discussion
43
Zones of agriculture formed in the outskirts of the city where the farmers plant grain,
especially wheat. Before the Israeli withdrawal in 2005, most of the land belonged to
the Israelis settlement, which are now known as liberated lands area.
The area of Khan Younis grain cultivation is concentrated in the western areas of the
municipality. where the number of agricultural wells is about 172 wells abound where
it concentrated in areas with olives and fruits trees cultivations areas where the north
and south east areas of the municipality.
Figure(4.6): Relation between agricultural lands ownership and the percentage
of irrigation wells connections depend on private wells in KYM.
When talking about agricultural wells and their relationship with agricultural
holdings, there is huge concentrated due to new ownerships of liberated lands areas
divided after the Israeli withdraw. Special for ownerships larger than 50 dounms up to
100 dounms, which are concentrated in the western regions, and spreads the
cultivation of olives and fruits trees, where vegetables are less. The properties of more
than 100 dounms cultivated with grains, so they do not need private wells because
their crops depend on rain.
As for properties less than 5 dounms, the areas were not supported by water or fully
services from the municipality as a result of its farness distance from residential areas
of the population. These lands are distributed around Salah AL-Dien Highway, so
people plant it as cash crops to gain capital cash. And they plant it depending on
unlicensed wells generally for irrigation crops of olive and fruit trees in general.
Figure (4.7): Relation between types of crop percentage per category and the
ownership in KYM.
0
10
20
30
40
50
60
0-5 05--20 20-50 50-100 >100Pe
rce
nta
ge o
f ag
ricu
ltu
ral
we
lls c
on
ne
ctio
ns
agricultural lands ownership (dounm)
0
20
40
60
80
100
0-5 05--20 20-50 50-100 >100
typ
es
of
cro
ps
pe
r ca
tego
ry (
%)
agricultural land ownership (dounm)
Fruit & Olive
Vegetables
Grain
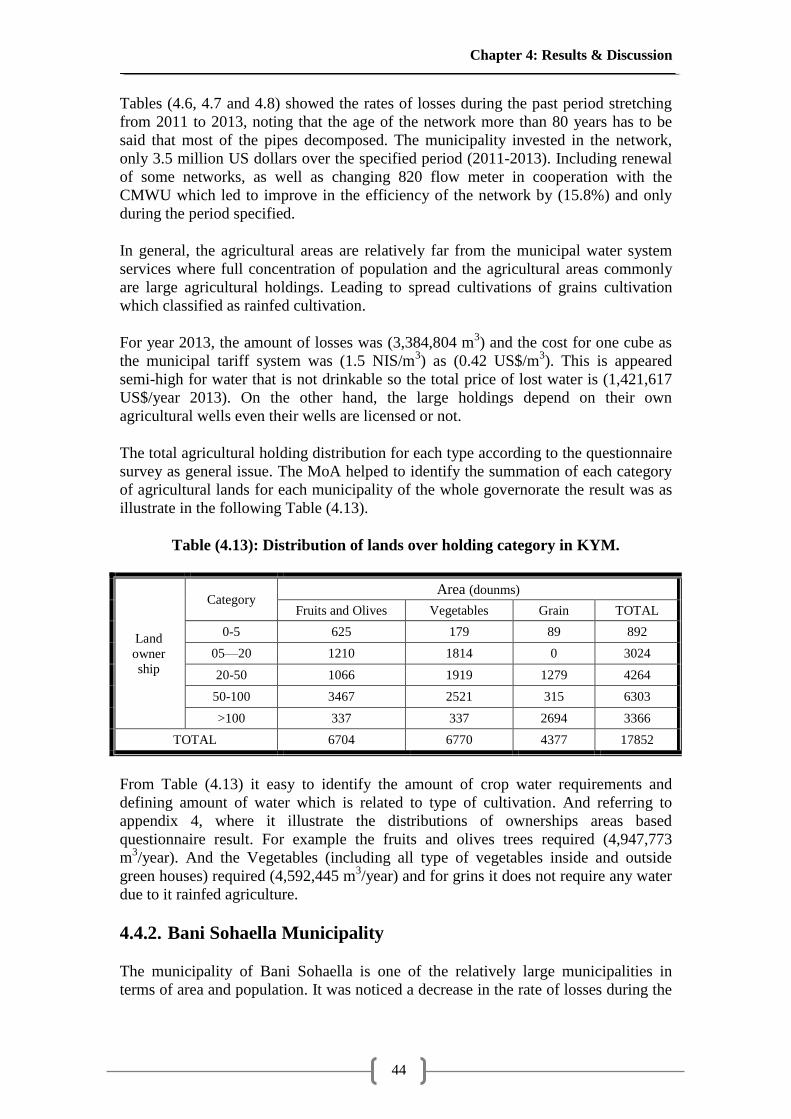
Chapter 4: Results & Discussion
44
Tables (4.6, 4.7 and 4.8) showed the rates of losses during the past period stretching
from 2011 to 2013, noting that the age of the network more than 80 years has to be
said that most of the pipes decomposed. The municipality invested in the network,
only 3.5 million US dollars over the specified period (2011-2013). Including renewal
of some networks, as well as changing 820 flow meter in cooperation with the
CMWU which led to improve in the efficiency of the network by (15.8%) and only
during the period specified.
In general, the agricultural areas are relatively far from the municipal water system
services where full concentration of population and the agricultural areas commonly
are large agricultural holdings. Leading to spread cultivations of grains cultivation
which classified as rainfed cultivation.
For year 2013, the amount of losses was (3,384,804 m3) and the cost for one cube as
the municipal tariff system was (1.5 NIS/m3) as (0.42 US$/m
3). This is appeared
semi-high for water that is not drinkable so the total price of lost water is (1,421,617
US$/year 2013). On the other hand, the large holdings depend on their own
agricultural wells even their wells are licensed or not.
The total agricultural holding distribution for each type according to the questionnaire
survey as general issue. The MoA helped to identify the summation of each category
of agricultural lands for each municipality of the whole governorate the result was as
illustrate in the following Table (4.13).
Table (4.13): Distribution of lands over holding category in KYM.
Land
owner
ship
Category Area (dounms)
Fruits and Olives Vegetables Grain TOTAL
0-5 625 179 89 892
05—20 1210 1814 0 3024
20-50 1066 1919 1279 4264
50-100 3467 2521 315 6303
>100 337 337 2694 3366
TOTAL 6704 6770 4377 17852
From Table (4.13) it easy to identify the amount of crop water requirements and
defining amount of water which is related to type of cultivation. And referring to
appendix 4, where it illustrate the distributions of ownerships areas based
questionnaire result. For example the fruits and olives trees required (4,947,773
m3/year). And the Vegetables (including all type of vegetables inside and outside
green houses) required (4,592,445 m3/year) and for grins it does not require any water
due to it rainfed agriculture.
4.4.2. Bani Sohaella Municipality
The municipality of Bani Sohaella is one of the relatively large municipalities in
terms of area and population. It was noticed a decrease in the rate of losses during the
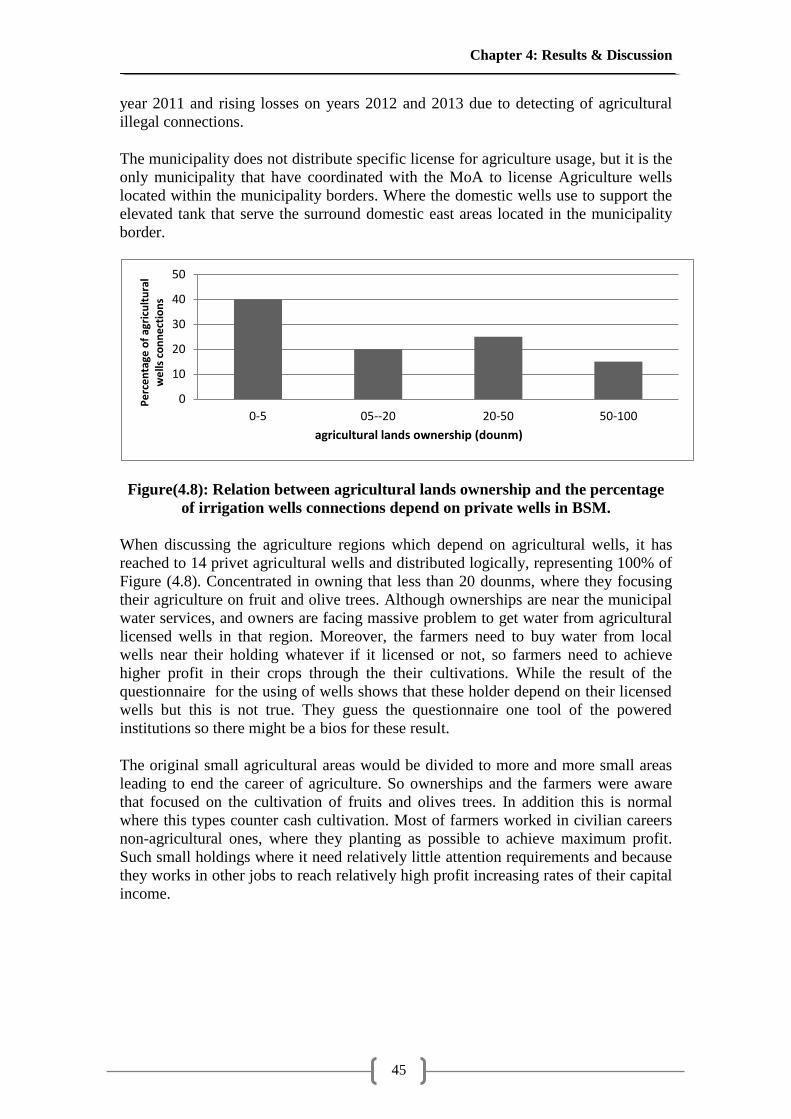
Chapter 4: Results & Discussion
45
year 2011 and rising losses on years 2012 and 2013 due to detecting of agricultural
illegal connections.
The municipality does not distribute specific license for agriculture usage, but it is the
only municipality that have coordinated with the MoA to license Agriculture wells
located within the municipality borders. Where the domestic wells use to support the
elevated tank that serve the surround domestic east areas located in the municipality
border.
Figure(4.8): Relation between agricultural lands ownership and the percentage
of irrigation wells connections depend on private wells in BSM.
When discussing the agriculture regions which depend on agricultural wells, it has
reached to 14 privet agricultural wells and distributed logically, representing 100% of
Figure (4.8). Concentrated in owning that less than 20 dounms, where they focusing
their agriculture on fruit and olive trees. Although ownerships are near the municipal
water services, and owners are facing massive problem to get water from agricultural
licensed wells in that region. Moreover, the farmers need to buy water from local
wells near their holding whatever if it licensed or not, so farmers need to achieve
higher profit in their crops through the their cultivations. While the result of the
questionnaire for the using of wells shows that these holder depend on their licensed
wells but this is not true. They guess the questionnaire one tool of the powered
institutions so there might be a bios for these result.
The original small agricultural areas would be divided to more and more small areas
leading to end the career of agriculture. So ownerships and the farmers were aware
that focused on the cultivation of fruits and olives trees. In addition this is normal
where this types counter cash cultivation. Most of farmers worked in civilian careers
non-agricultural ones, where they planting as possible to achieve maximum profit.
Such small holdings where it need relatively little attention requirements and because
they works in other jobs to reach relatively high profit increasing rates of their capital
income.
0
10
20
30
40
50
0-5 05--20 20-50 50-100
Pe
rce
nta
ge o
f ag
ricu
ltu
ral
we
lls c
on
ne
ctio
ns
agricultural lands ownership (dounm)
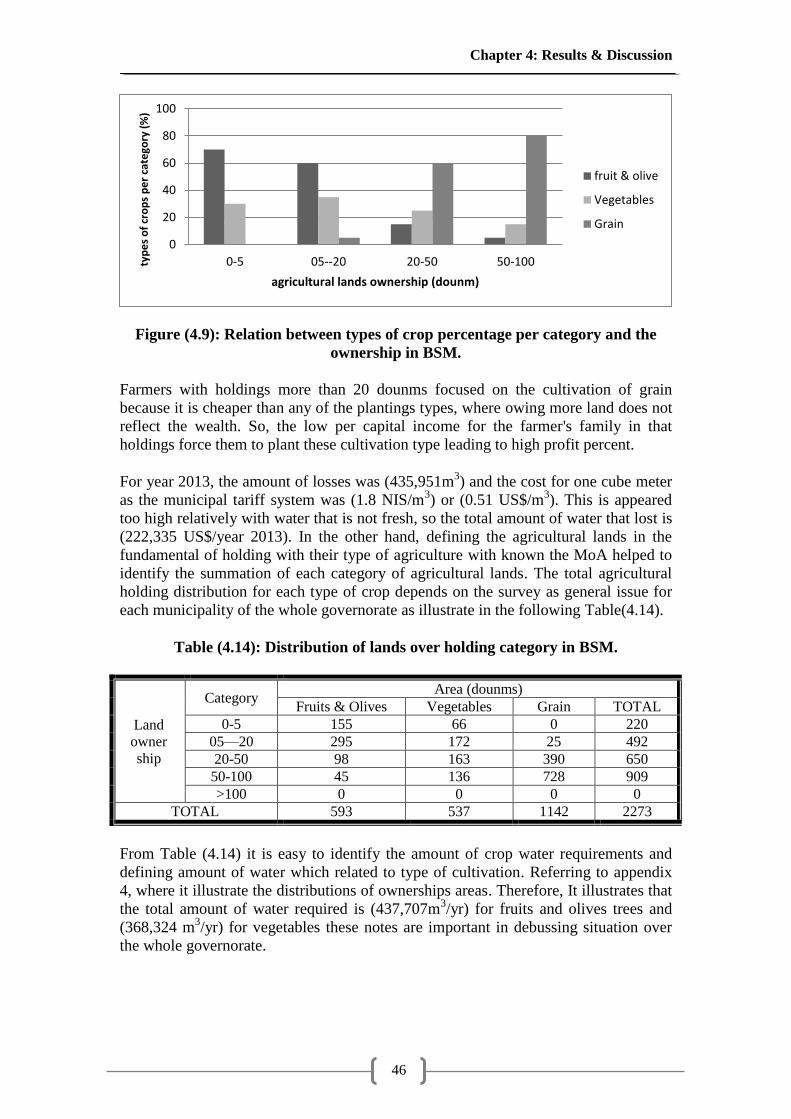
Chapter 4: Results & Discussion
46
Figure (4.9): Relation between types of crop percentage per category and the
ownership in BSM.
Farmers with holdings more than 20 dounms focused on the cultivation of grain
because it is cheaper than any of the plantings types, where owing more land does not
reflect the wealth. So, the low per capital income for the farmer's family in that
holdings force them to plant these cultivation type leading to high profit percent.
For year 2013, the amount of losses was (435,951m3) and the cost for one cube meter
as the municipal tariff system was (1.8 NIS/m3) or (0.51 US$/m
3). This is appeared
too high relatively with water that is not fresh, so the total amount of water that lost is
(222,335 US$/year 2013). In the other hand, defining the agricultural lands in the
fundamental of holding with their type of agriculture with known the MoA helped to
identify the summation of each category of agricultural lands. The total agricultural
holding distribution for each type of crop depends on the survey as general issue for
each municipality of the whole governorate as illustrate in the following Table(4.14).
Table (4.14): Distribution of lands over holding category in BSM.
Land
owner
ship
Category Area (dounms)
Fruits & Olives Vegetables Grain TOTAL
0-5 155 66 0 220
05—20 295 172 25 492
20-50 98 163 390 650
50-100 45 136 728 909
>100 0 0 0 0
TOTAL 593 537 1142 2273
From Table (4.14) it is easy to identify the amount of crop water requirements and
defining amount of water which related to type of cultivation. Referring to appendix
4, where it illustrate the distributions of ownerships areas. Therefore, It illustrates that
the total amount of water required is (437,707m3/yr) for fruits and olives trees and
(368,324 m3/yr) for vegetables these notes are important in debussing situation over
the whole governorate.
0
20
40
60
80
100
0-5 05--20 20-50 50-100typ
es
of
cro
ps
pe
r ca
tego
ry (
%)
agricultural lands ownership (dounm)
fruit & olive
Vegetables
Grain
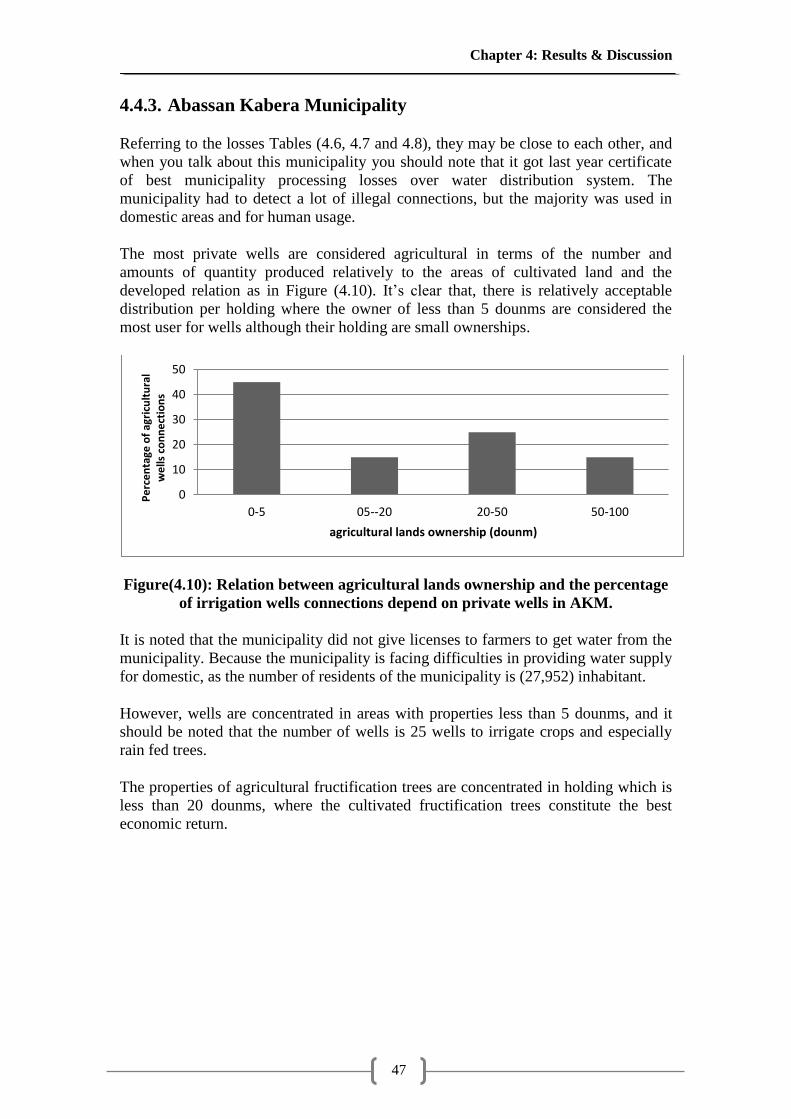
Chapter 4: Results & Discussion
47
4.4.3. Abassan Kabera Municipality
Referring to the losses Tables (4.6, 4.7 and 4.8), they may be close to each other, and
when you talk about this municipality you should note that it got last year certificate
of best municipality processing losses over water distribution system. The
municipality had to detect a lot of illegal connections, but the majority was used in
domestic areas and for human usage.
The most private wells are considered agricultural in terms of the number and
amounts of quantity produced relatively to the areas of cultivated land and the
developed relation as in Figure (4.10). It‘s clear that, there is relatively acceptable
distribution per holding where the owner of less than 5 dounms are considered the
most user for wells although their holding are small ownerships.
Figure(4.10): Relation between agricultural lands ownership and the percentage
of irrigation wells connections depend on private wells in AKM.
It is noted that the municipality did not give licenses to farmers to get water from the
municipality. Because the municipality is facing difficulties in providing water supply
for domestic, as the number of residents of the municipality is (27,952) inhabitant.
However, wells are concentrated in areas with properties less than 5 dounms, and it
should be noted that the number of wells is 25 wells to irrigate crops and especially
rain fed trees.
The properties of agricultural fructification trees are concentrated in holding which is
less than 20 dounms, where the cultivated fructification trees constitute the best
economic return.
0
10
20
30
40
50
0-5 05--20 20-50 50-100
Pe
rce
nta
ge o
f ag
ricu
ltu
ral
we
lls c
on
ne
ctio
ns
agricultural lands ownership (dounm)
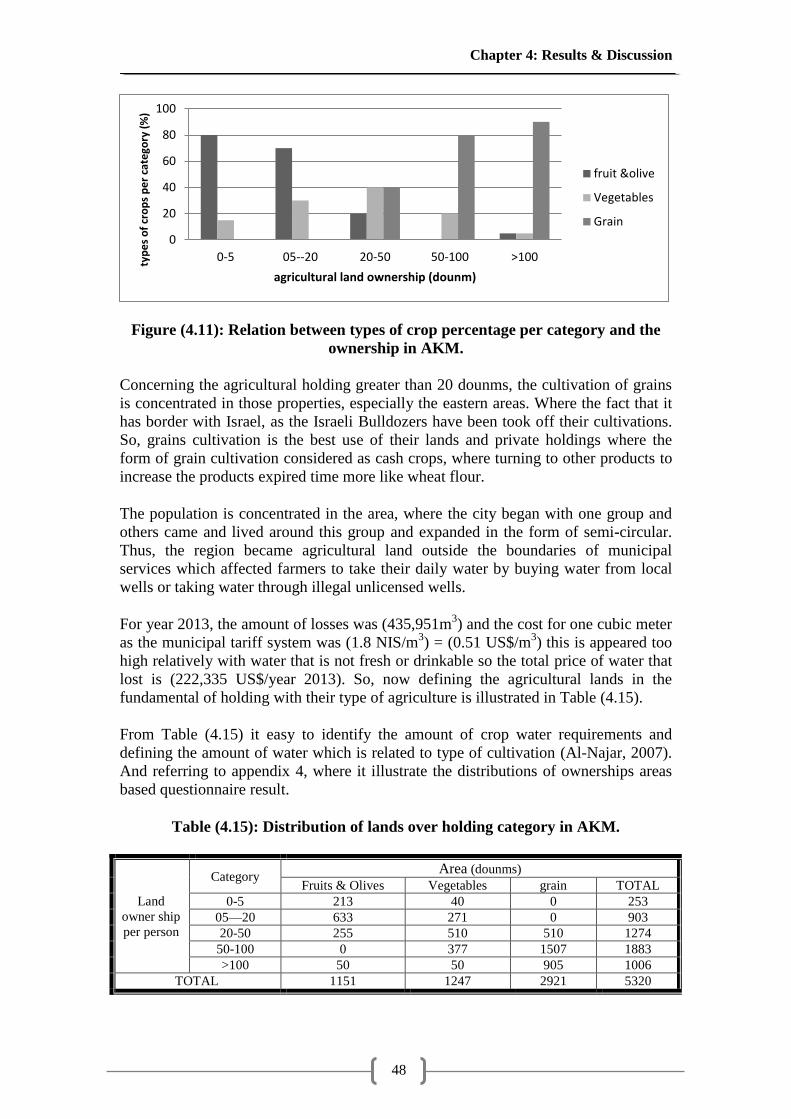
Chapter 4: Results & Discussion
48
Figure (4.11): Relation between types of crop percentage per category and the
ownership in AKM.
Concerning the agricultural holding greater than 20 dounms, the cultivation of grains
is concentrated in those properties, especially the eastern areas. Where the fact that it
has border with Israel, as the Israeli Bulldozers have been took off their cultivations.
So, grains cultivation is the best use of their lands and private holdings where the
form of grain cultivation considered as cash crops, where turning to other products to
increase the products expired time more like wheat flour.
The population is concentrated in the area, where the city began with one group and
others came and lived around this group and expanded in the form of semi-circular.
Thus, the region became agricultural land outside the boundaries of municipal
services which affected farmers to take their daily water by buying water from local
wells or taking water through illegal unlicensed wells.
For year 2013, the amount of losses was (435,951m3) and the cost for one cubic meter
as the municipal tariff system was (1.8 NIS/m3) = (0.51 US$/m
3) this is appeared too
high relatively with water that is not fresh or drinkable so the total price of water that
lost is (222,335 US$/year 2013). So, now defining the agricultural lands in the
fundamental of holding with their type of agriculture is illustrated in Table (4.15).
From Table (4.15) it easy to identify the amount of crop water requirements and
defining the amount of water which is related to type of cultivation (Al-Najar, 2007).
And referring to appendix 4, where it illustrate the distributions of ownerships areas
based questionnaire result.
Table (4.15): Distribution of lands over holding category in AKM.
Land
owner ship
per person
Category Area (dounms)
Fruits & Olives Vegetables grain TOTAL
0-5 213 40 0 253
05—20 633 271 0 903
20-50 255 510 510 1274
50-100 0 377 1507 1883
>100 50 50 905 1006
TOTAL 1151 1247 2921 5320
0
20
40
60
80
100
0-5 05--20 20-50 50-100 >100typ
es
of
cro
ps
pe
r ca
tego
ry (
%)
agricultural land ownership (dounm)
fruit &olive
Vegetables
Grain
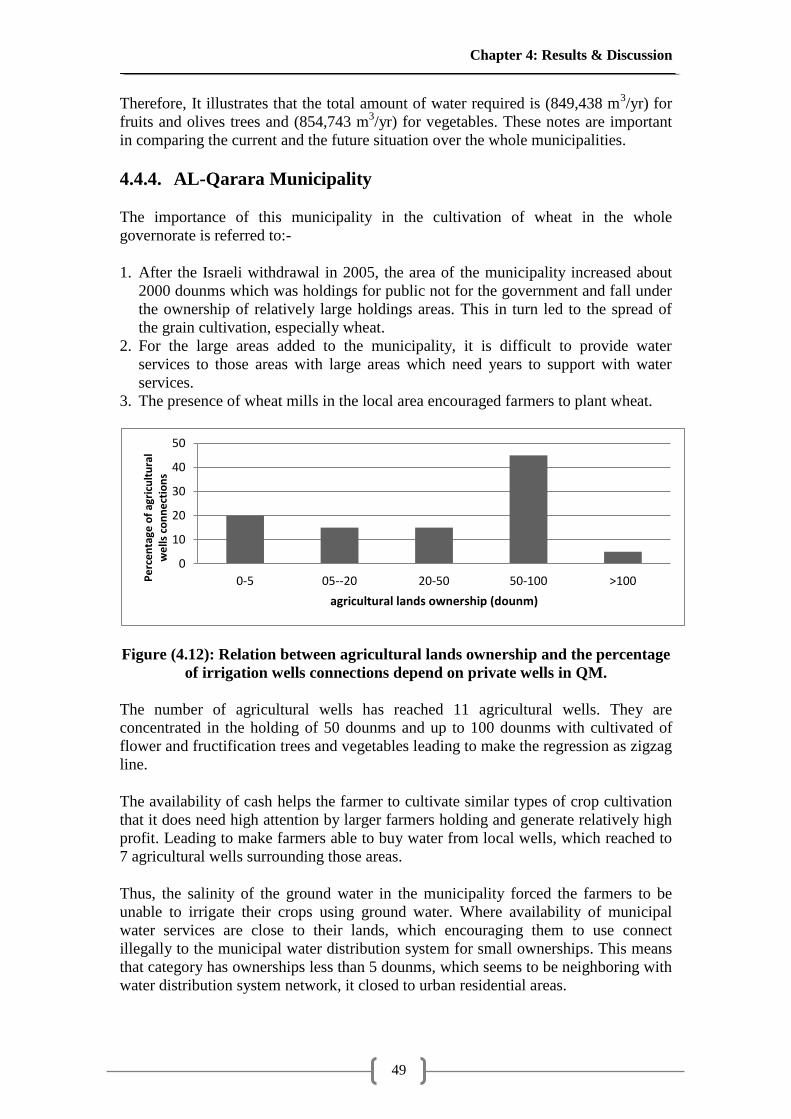
Chapter 4: Results & Discussion
49
Therefore, It illustrates that the total amount of water required is (849,438 m3/yr) for
fruits and olives trees and (854,743 m3/yr) for vegetables. These notes are important
in comparing the current and the future situation over the whole municipalities.
4.4.4. AL-Qarara Municipality
The importance of this municipality in the cultivation of wheat in the whole
governorate is referred to:-
1. After the Israeli withdrawal in 2005, the area of the municipality increased about
2000 dounms which was holdings for public not for the government and fall under
the ownership of relatively large holdings areas. This in turn led to the spread of
the grain cultivation, especially wheat.
2. For the large areas added to the municipality, it is difficult to provide water
services to those areas with large areas which need years to support with water
services.
3. The presence of wheat mills in the local area encouraged farmers to plant wheat.
Figure (4.12): Relation between agricultural lands ownership and the percentage
of irrigation wells connections depend on private wells in QM.
The number of agricultural wells has reached 11 agricultural wells. They are
concentrated in the holding of 50 dounms and up to 100 dounms with cultivated of
flower and fructification trees and vegetables leading to make the regression as zigzag
line.
The availability of cash helps the farmer to cultivate similar types of crop cultivation
that it does need high attention by larger farmers holding and generate relatively high
profit. Leading to make farmers able to buy water from local wells, which reached to
7 agricultural wells surrounding those areas.
Thus, the salinity of the ground water in the municipality forced the farmers to be
unable to irrigate their crops using ground water. Where availability of municipal
water services are close to their lands, which encouraging them to use connect
illegally to the municipal water distribution system for small ownerships. This means
that category has ownerships less than 5 dounms, which seems to be neighboring with
water distribution system network, it closed to urban residential areas.
0
10
20
30
40
50
0-5 05--20 20-50 50-100 >100Pe
rce
nta
ge o
f ag
ricu
ltu
ral
we
lls c
on
ne
ctio
ns
agricultural lands ownership (dounm)
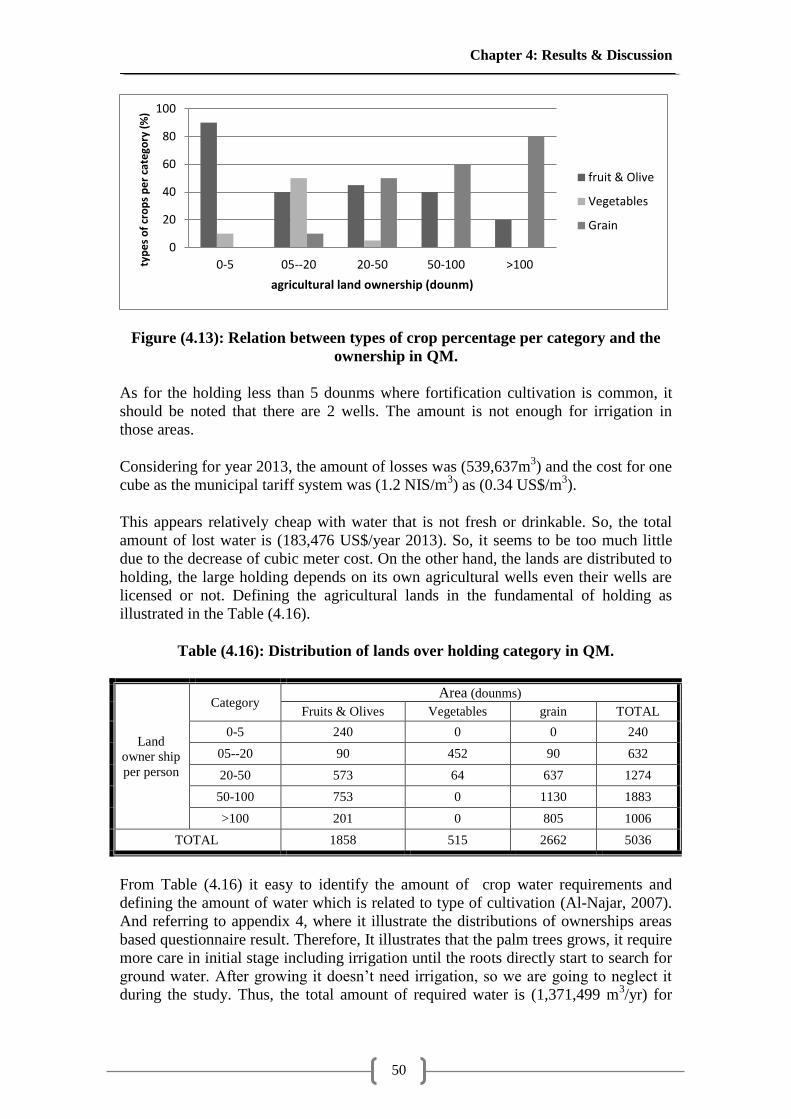
Chapter 4: Results & Discussion
50
Figure (4.13): Relation between types of crop percentage per category and the
ownership in QM.
As for the holding less than 5 dounms where fortification cultivation is common, it
should be noted that there are 2 wells. The amount is not enough for irrigation in
those areas.
Considering for year 2013, the amount of losses was (539,637m3) and the cost for one
cube as the municipal tariff system was (1.2 NIS/m3) as (0.34 US$/m
3).
This appears relatively cheap with water that is not fresh or drinkable. So, the total
amount of lost water is (183,476 US$/year 2013). So, it seems to be too much little
due to the decrease of cubic meter cost. On the other hand, the lands are distributed to
holding, the large holding depends on its own agricultural wells even their wells are
licensed or not. Defining the agricultural lands in the fundamental of holding as
illustrated in the Table (4.16).
Table (4.16): Distribution of lands over holding category in QM.
Land
owner ship
per person
Category Area (dounms)
Fruits & Olives Vegetables grain TOTAL
0-5 240 0 0 240
05--20 90 452 90 632
20-50 573 64 637 1274
50-100 753 0 1130 1883
>100 201 0 805 1006
TOTAL 1858 515 2662 5036
From Table (4.16) it easy to identify the amount of crop water requirements and
defining the amount of water which is related to type of cultivation (Al-Najar, 2007).
And referring to appendix 4, where it illustrate the distributions of ownerships areas
based questionnaire result. Therefore, It illustrates that the palm trees grows, it require
more care in initial stage including irrigation until the roots directly start to search for
ground water. After growing it doesn‘t need irrigation, so we are going to neglect it
during the study. Thus, the total amount of required water is (1,371,499 m3/yr) for
0
20
40
60
80
100
0-5 05--20 20-50 50-100 >100typ
es
of
cro
ps
pe
r ca
tego
ry (
%)
agricultural land ownership (dounm)
fruit & Olive
Vegetables
Grain
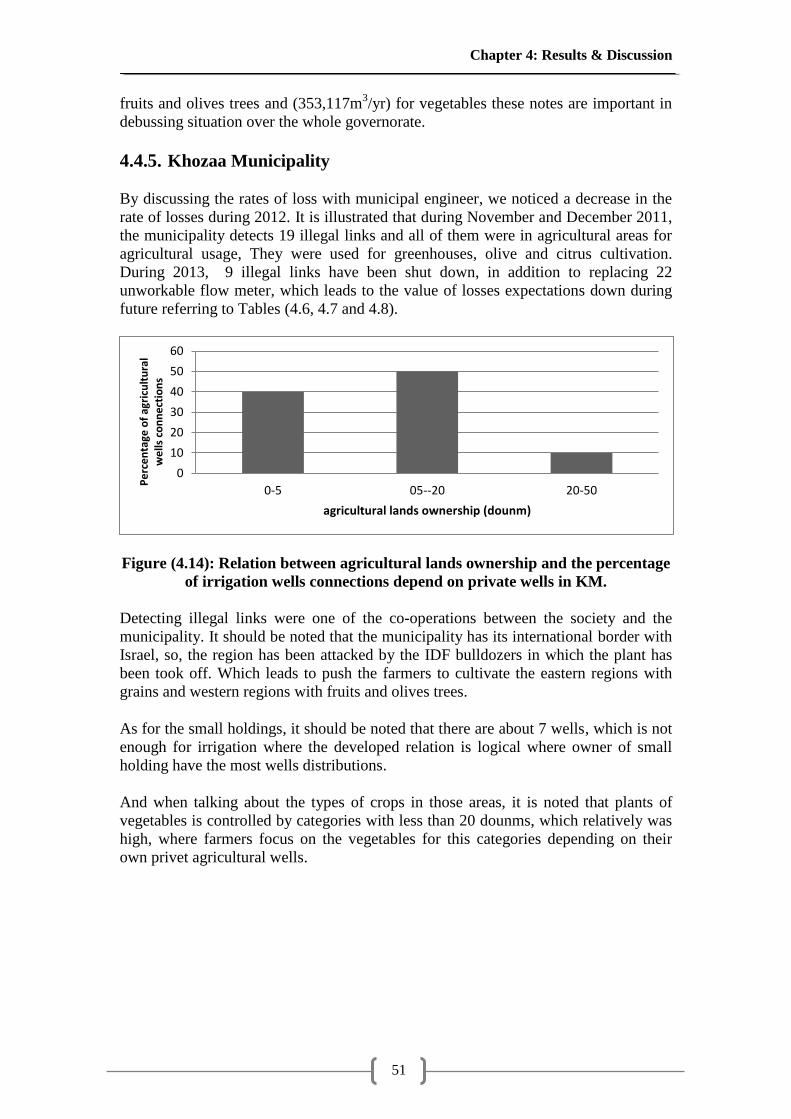
Chapter 4: Results & Discussion
51
fruits and olives trees and (353,117m3/yr) for vegetables these notes are important in
debussing situation over the whole governorate.
4.4.5. Khozaa Municipality
By discussing the rates of loss with municipal engineer, we noticed a decrease in the
rate of losses during 2012. It is illustrated that during November and December 2011,
the municipality detects 19 illegal links and all of them were in agricultural areas for
agricultural usage, They were used for greenhouses, olive and citrus cultivation.
During 2013, 9 illegal links have been shut down, in addition to replacing 22
unworkable flow meter, which leads to the value of losses expectations down during
future referring to Tables (4.6, 4.7 and 4.8).
Figure (4.14): Relation between agricultural lands ownership and the percentage
of irrigation wells connections depend on private wells in KM.
Detecting illegal links were one of the co-operations between the society and the
municipality. It should be noted that the municipality has its international border with
Israel, so, the region has been attacked by the IDF bulldozers in which the plant has
been took off. Which leads to push the farmers to cultivate the eastern regions with
grains and western regions with fruits and olives trees.
As for the small holdings, it should be noted that there are about 7 wells, which is not
enough for irrigation where the developed relation is logical where owner of small
holding have the most wells distributions.
And when talking about the types of crops in those areas, it is noted that plants of
vegetables is controlled by categories with less than 20 dounms, which relatively was
high, where farmers focus on the vegetables for this categories depending on their
own privet agricultural wells.
0
10
20
30
40
50
60
0-5 05--20 20-50
Pe
rce
nta
ge o
f ag
ricu
ltu
ral
we
lls c
on
ne
ctio
ns
agricultural lands ownership (dounm)
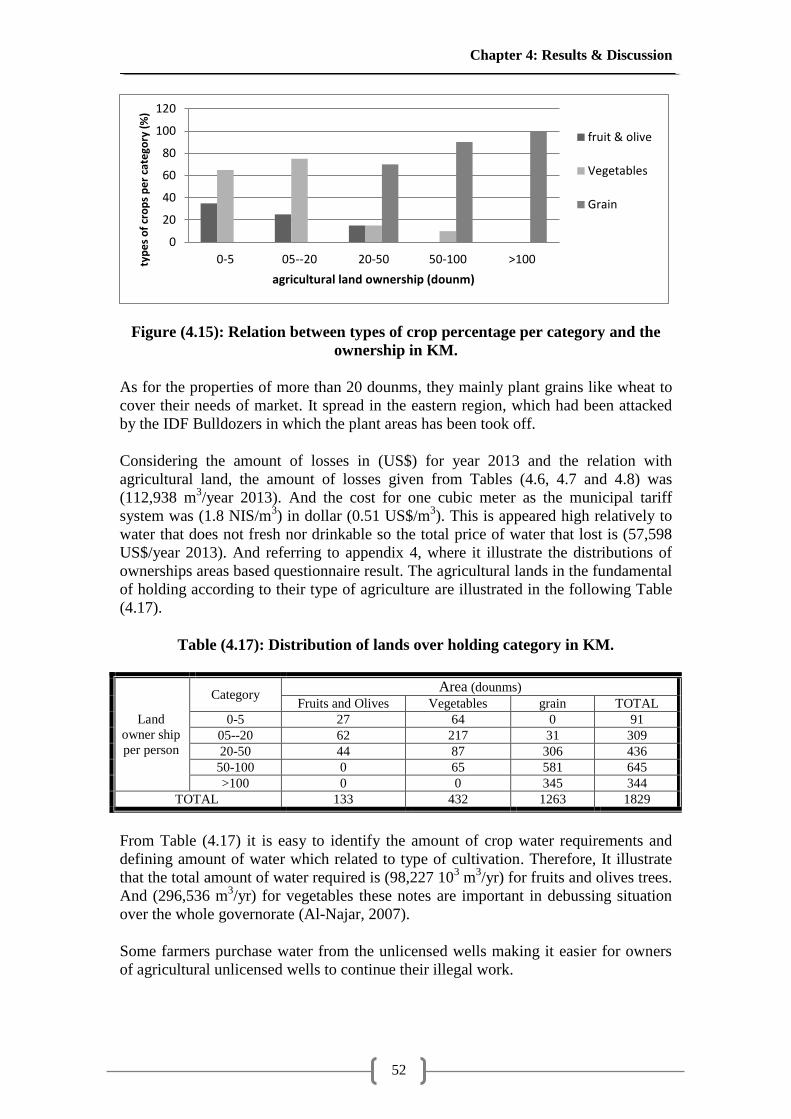
Chapter 4: Results & Discussion
52
Figure (4.15): Relation between types of crop percentage per category and the
ownership in KM.
As for the properties of more than 20 dounms, they mainly plant grains like wheat to
cover their needs of market. It spread in the eastern region, which had been attacked
by the IDF Bulldozers in which the plant areas has been took off.
Considering the amount of losses in (US$) for year 2013 and the relation with
agricultural land, the amount of losses given from Tables (4.6, 4.7 and 4.8) was
(112,938 m3/year 2013). And the cost for one cubic meter as the municipal tariff
system was (1.8 NIS/m3) in dollar (0.51 US$/m
3). This is appeared high relatively to
water that does not fresh nor drinkable so the total price of water that lost is (57,598
US$/year 2013). And referring to appendix 4, where it illustrate the distributions of
ownerships areas based questionnaire result. The agricultural lands in the fundamental
of holding according to their type of agriculture are illustrated in the following Table
(4.17).
Table (4.17): Distribution of lands over holding category in KM.
Land
owner ship
per person
Category Area (dounms)
Fruits and Olives Vegetables grain TOTAL
0-5 27 64 0 91
05--20 62 217 31 309
20-50 44 87 306 436
50-100 0 65 581 645
>100 0 0 345 344
TOTAL 133 432 1263 1829
From Table (4.17) it is easy to identify the amount of crop water requirements and
defining amount of water which related to type of cultivation. Therefore, It illustrate
that the total amount of water required is (98,227 103 m
3/yr) for fruits and olives trees.
And (296,536 m3/yr) for vegetables these notes are important in debussing situation
over the whole governorate (Al-Najar, 2007).
Some farmers purchase water from the unlicensed wells making it easier for owners
of agricultural unlicensed wells to continue their illegal work.
0
20
40
60
80
100
120
0-5 05--20 20-50 50-100 >100typ
es
of
cro
ps
pe
r ca
tego
ry (
%)
agricultural land ownership (dounm)
fruit & olive
Vegetables
Grain
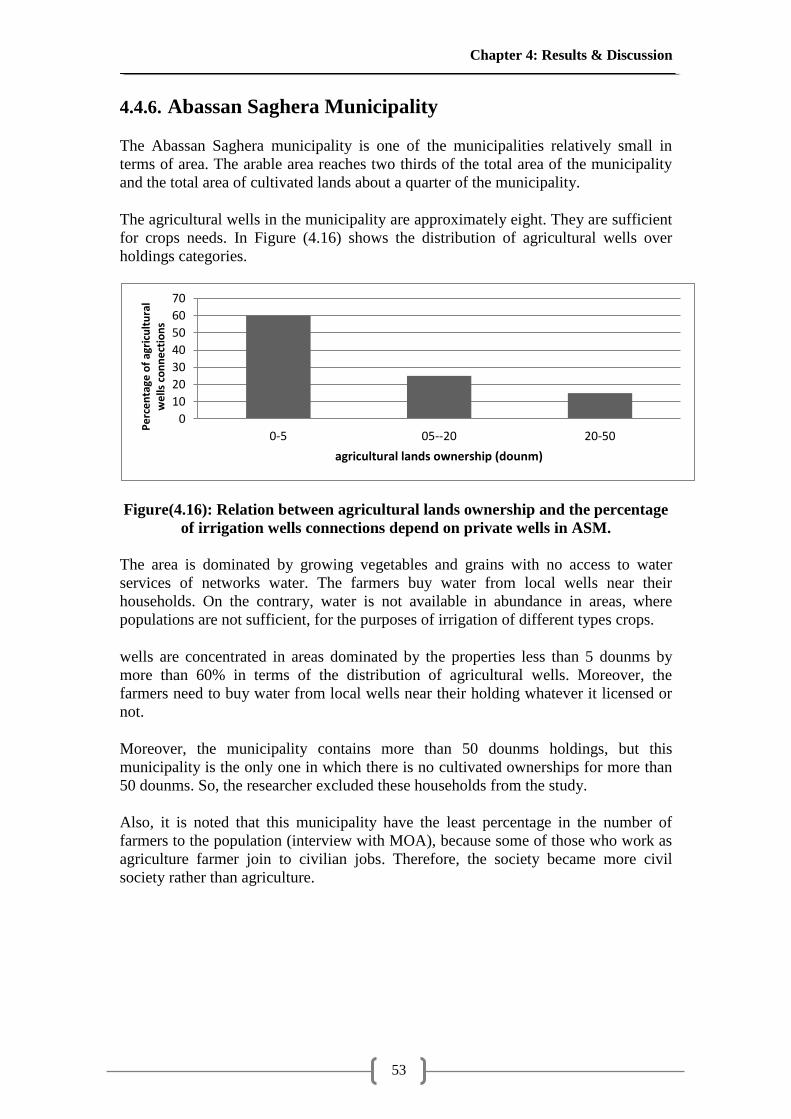
Chapter 4: Results & Discussion
53
4.4.6. Abassan Saghera Municipality
The Abassan Saghera municipality is one of the municipalities relatively small in
terms of area. The arable area reaches two thirds of the total area of the municipality
and the total area of cultivated lands about a quarter of the municipality.
The agricultural wells in the municipality are approximately eight. They are sufficient
for crops needs. In Figure (4.16) shows the distribution of agricultural wells over
holdings categories.
Figure(4.16): Relation between agricultural lands ownership and the percentage
of irrigation wells connections depend on private wells in ASM.
The area is dominated by growing vegetables and grains with no access to water
services of networks water. The farmers buy water from local wells near their
households. On the contrary, water is not available in abundance in areas, where
populations are not sufficient, for the purposes of irrigation of different types crops.
wells are concentrated in areas dominated by the properties less than 5 dounms by
more than 60% in terms of the distribution of agricultural wells. Moreover, the
farmers need to buy water from local wells near their holding whatever it licensed or
not.
Moreover, the municipality contains more than 50 dounms holdings, but this
municipality is the only one in which there is no cultivated ownerships for more than
50 dounms. So, the researcher excluded these households from the study.
Also, it is noted that this municipality have the least percentage in the number of
farmers to the population (interview with MOA), because some of those who work as
agriculture farmer join to civilian jobs. Therefore, the society became more civil
society rather than agriculture.
0
10
20
30
40
50
60
70
0-5 05--20 20-50
Pe
rce
nta
ge o
f ag
ricu
ltu
ral
we
lls c
on
ne
ctio
ns
agricultural lands ownership (dounm)
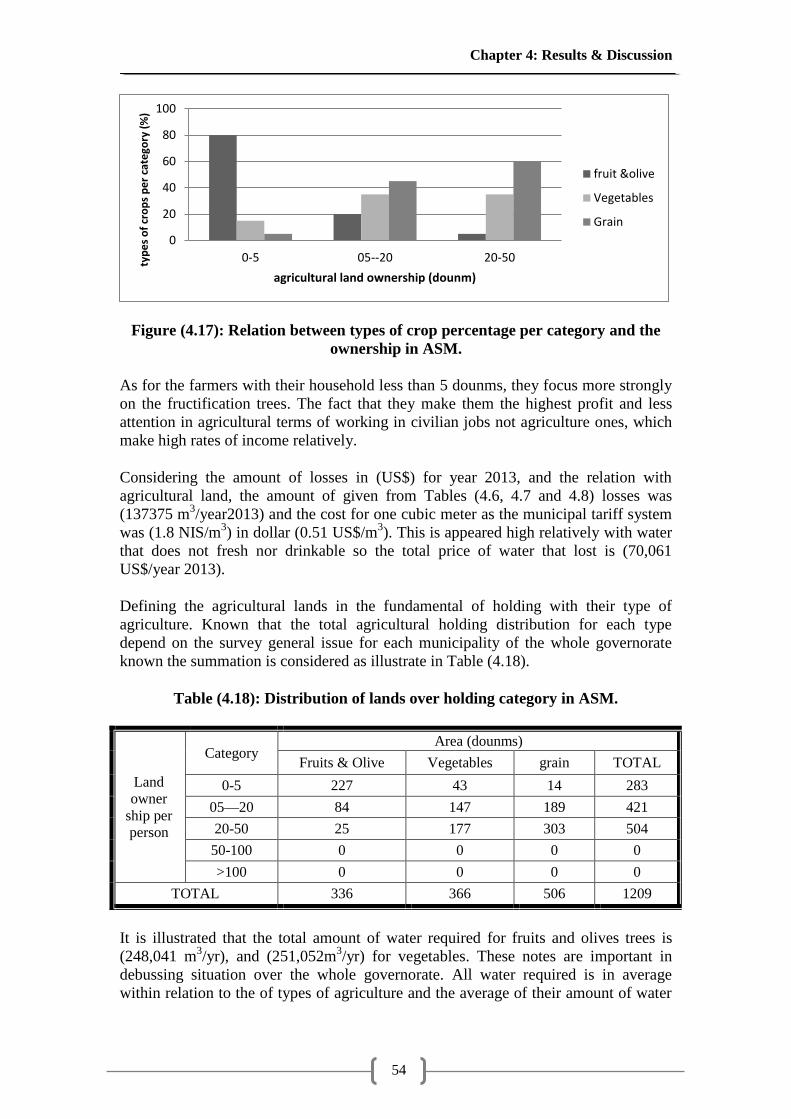
Chapter 4: Results & Discussion
54
Figure (4.17): Relation between types of crop percentage per category and the
ownership in ASM.
As for the farmers with their household less than 5 dounms, they focus more strongly
on the fructification trees. The fact that they make them the highest profit and less
attention in agricultural terms of working in civilian jobs not agriculture ones, which
make high rates of income relatively.
Considering the amount of losses in (US$) for year 2013, and the relation with
agricultural land, the amount of given from Tables (4.6, 4.7 and 4.8) losses was
(137375 m3/year2013) and the cost for one cubic meter as the municipal tariff system
was (1.8 NIS/m3) in dollar (0.51 US$/m
3). This is appeared high relatively with water
that does not fresh nor drinkable so the total price of water that lost is (70,061
US$/year 2013).
Defining the agricultural lands in the fundamental of holding with their type of
agriculture. Known that the total agricultural holding distribution for each type
depend on the survey general issue for each municipality of the whole governorate
known the summation is considered as illustrate in Table (4.18).
Table (4.18): Distribution of lands over holding category in ASM.
Land
owner
ship per
person
Category Area (dounms)
Fruits & Olive Vegetables grain TOTAL
0-5 227 43 14 283
05—20 84 147 189 421
20-50 25 177 303 504
50-100 0 0 0 0
>100 0 0 0 0
TOTAL 336 366 506 1209
It is illustrated that the total amount of water required for fruits and olives trees is
(248,041 m3/yr), and (251,052m
3/yr) for vegetables. These notes are important in
debussing situation over the whole governorate. All water required is in average
within relation to the of types of agriculture and the average of their amount of water
0
20
40
60
80
100
0-5 05--20 20-50typ
es
of
cro
ps
pe
r ca
tego
ry (
%)
agricultural land ownership (dounm)
fruit &olive
Vegetables
Grain
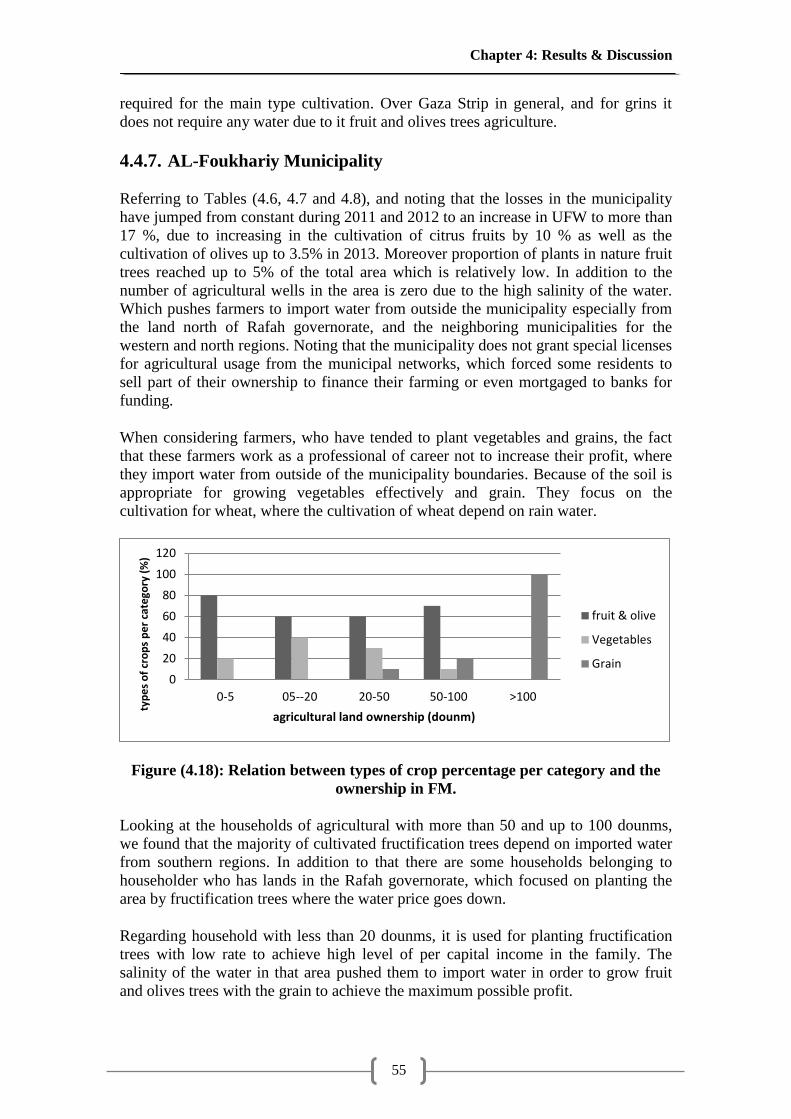
Chapter 4: Results & Discussion
55
required for the main type cultivation. Over Gaza Strip in general, and for grins it
does not require any water due to it fruit and olives trees agriculture.
4.4.7. AL-Foukhariy Municipality
Referring to Tables (4.6, 4.7 and 4.8), and noting that the losses in the municipality
have jumped from constant during 2011 and 2012 to an increase in UFW to more than
17 %, due to increasing in the cultivation of citrus fruits by 10 % as well as the
cultivation of olives up to 3.5% in 2013. Moreover proportion of plants in nature fruit
trees reached up to 5% of the total area which is relatively low. In addition to the
number of agricultural wells in the area is zero due to the high salinity of the water.
Which pushes farmers to import water from outside the municipality especially from
the land north of Rafah governorate, and the neighboring municipalities for the
western and north regions. Noting that the municipality does not grant special licenses
for agricultural usage from the municipal networks, which forced some residents to
sell part of their ownership to finance their farming or even mortgaged to banks for
funding.
When considering farmers, who have tended to plant vegetables and grains, the fact
that these farmers work as a professional of career not to increase their profit, where
they import water from outside of the municipality boundaries. Because of the soil is
appropriate for growing vegetables effectively and grain. They focus on the
cultivation for wheat, where the cultivation of wheat depend on rain water.
Figure (4.18): Relation between types of crop percentage per category and the
ownership in FM.
Looking at the households of agricultural with more than 50 and up to 100 dounms,
we found that the majority of cultivated fructification trees depend on imported water
from southern regions. In addition to that there are some households belonging to
householder who has lands in the Rafah governorate, which focused on planting the
area by fructification trees where the water price goes down.
Regarding household with less than 20 dounms, it is used for planting fructification
trees with low rate to achieve high level of per capital income in the family. The
salinity of the water in that area pushed them to import water in order to grow fruit
and olives trees with the grain to achieve the maximum possible profit.
0
20
40
60
80
100
120
0-5 05--20 20-50 50-100 >100
typ
es
of
cro
ps
pe
r ca
tego
ry (
%)
agricultural land ownership (dounm)
fruit & olive
Vegetables
Grain
Chapter 4: Results & Discussion
56
After presenting these results to the engineers of the municipality, they confirmed that
there is an annual rate for the detection of illegal links over 5 illegally links giving the
impression that there are a lot of illegal links remaining without detection. Noting that
the municipality is similar to the municipalities of the Gaza Strip which do not grant
licenses for agricultural usage. Tables (4.6, 4.7 and 4.8) show that the amount of
losses in (US$) and the relation with agricultural land, for year 2013 the amount of
losses was (120,005 m3) and the cost for one cubic meter as the municipal tariff
system was (0.6 NIS/m3) as (0.17 US$/m
3). This appeared high relatively to water that
is not fresh nor drinkable so the total amount of water that lost is (20,400 US$/year
2013). It seems to be too much little due to the decrease of cube cost, in the other
hand, the large holding depend on their own agricultural wells even their wells are
licensed or not. The total agricultural holding distribution for each type depend on the
survey general issue for each municipality of the whole governorate as illustrated in
Table(4.19).
Table (4.19): Distribution of lands over holding category in FM.
Land
owner
ship per
person
Category Area (dounms)
Fruits and Olives Vegetables grain TOTAL
0-5 159 40 0 198
05--20 404 269 0 673
20-50 475 285 190 949
50-100 983 140 281 1403
>100 0 0 750 749
TOTAL 2020 734 1220 3975
From Table (4.19) it is easy to identify the amount of crop water requirements and
defining amount of water which related to type of cultivation. And referring to
appendix 4, where it illustrate the distributions of ownerships areas based
questionnaire result. Therefore, It illustrated that the palm tree requires in initial stage
for more care including irrigation but later the roots directly start to search for ground
water. After growing it doesn‘t need for irrigation, so we are going to neglect it during
the study. The total amount of water required is (1,490,98 m3/yr) for fruits and olives
trees and (502,995 m3/yr) for vegetables, these notes are important in debussing
situation over the whole governorate. (Al-Najar, 2007)
4.5. The Relation Between Urban Agriculture Area & the UFW
All the above interpretations lead to the conclusion that urban agriculture in small
holdings is consuming huge amount of municipal water which is pumped for domestic
usage. Such a water meter reading behavior, considering domestic water scarcity lead
to threats of Khan Younis domestic water future.
In other expression, irrigating small urban agricultural holdings by the municipal
water deprive residential from their right to achieve water quantities required.
Figures (4.19, 4.20, 4.21 and 4.22) illustrates the influence of the cultivation type's
areas on the water losses regime. Due to the high profession of municipalities, water
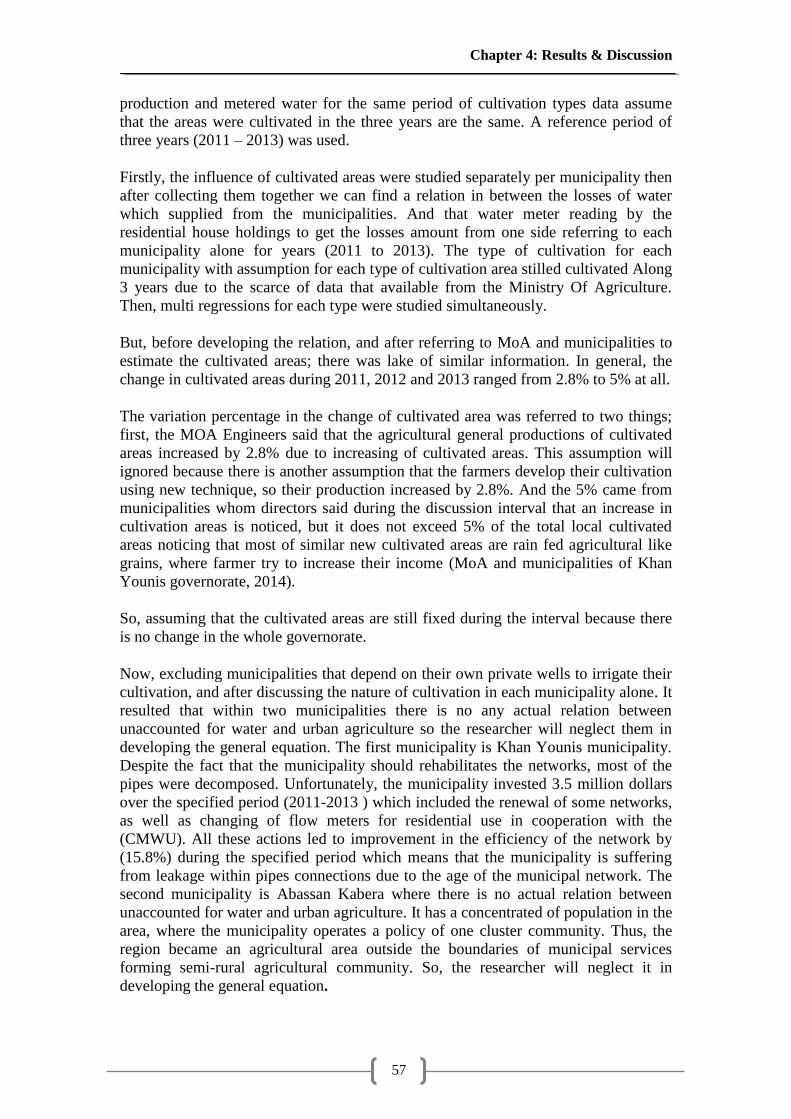
Chapter 4: Results & Discussion
57
production and metered water for the same period of cultivation types data assume
that the areas were cultivated in the three years are the same. A reference period of
three years (2011 – 2013) was used.
Firstly, the influence of cultivated areas were studied separately per municipality then
after collecting them together we can find a relation in between the losses of water
which supplied from the municipalities. And that water meter reading by the
residential house holdings to get the losses amount from one side referring to each
municipality alone for years (2011 to 2013). The type of cultivation for each
municipality with assumption for each type of cultivation area stilled cultivated Along
3 years due to the scarce of data that available from the Ministry Of Agriculture.
Then, multi regressions for each type were studied simultaneously.
But, before developing the relation, and after referring to MoA and municipalities to
estimate the cultivated areas; there was lake of similar information. In general, the
change in cultivated areas during 2011, 2012 and 2013 ranged from 2.8% to 5% at all.
The variation percentage in the change of cultivated area was referred to two things;
first, the MOA Engineers said that the agricultural general productions of cultivated
areas increased by 2.8% due to increasing of cultivated areas. This assumption will
ignored because there is another assumption that the farmers develop their cultivation
using new technique, so their production increased by 2.8%. And the 5% came from
municipalities whom directors said during the discussion interval that an increase in
cultivation areas is noticed, but it does not exceed 5% of the total local cultivated
areas noticing that most of similar new cultivated areas are rain fed agricultural like
grains, where farmer try to increase their income (MoA and municipalities of Khan
Younis governorate, 2014).
So, assuming that the cultivated areas are still fixed during the interval because there
is no change in the whole governorate.
Now, excluding municipalities that depend on their own private wells to irrigate their
cultivation, and after discussing the nature of cultivation in each municipality alone. It
resulted that within two municipalities there is no any actual relation between
unaccounted for water and urban agriculture so the researcher will neglect them in
developing the general equation. The first municipality is Khan Younis municipality.
Despite the fact that the municipality should rehabilitates the networks, most of the
pipes were decomposed. Unfortunately, the municipality invested 3.5 million dollars
over the specified period (2011-2013 ) which included the renewal of some networks,
as well as changing of flow meters for residential use in cooperation with the
(CMWU). All these actions led to improvement in the efficiency of the network by
(15.8%) during the specified period which means that the municipality is suffering
from leakage within pipes connections due to the age of the municipal network. The
second municipality is Abassan Kabera where there is no actual relation between
unaccounted for water and urban agriculture. It has a concentrated of population in the
area, where the municipality operates a policy of one cluster community. Thus, the
region became an agricultural area outside the boundaries of municipal services
forming semi-rural agricultural community. So, the researcher will neglect it in
developing the general equation.
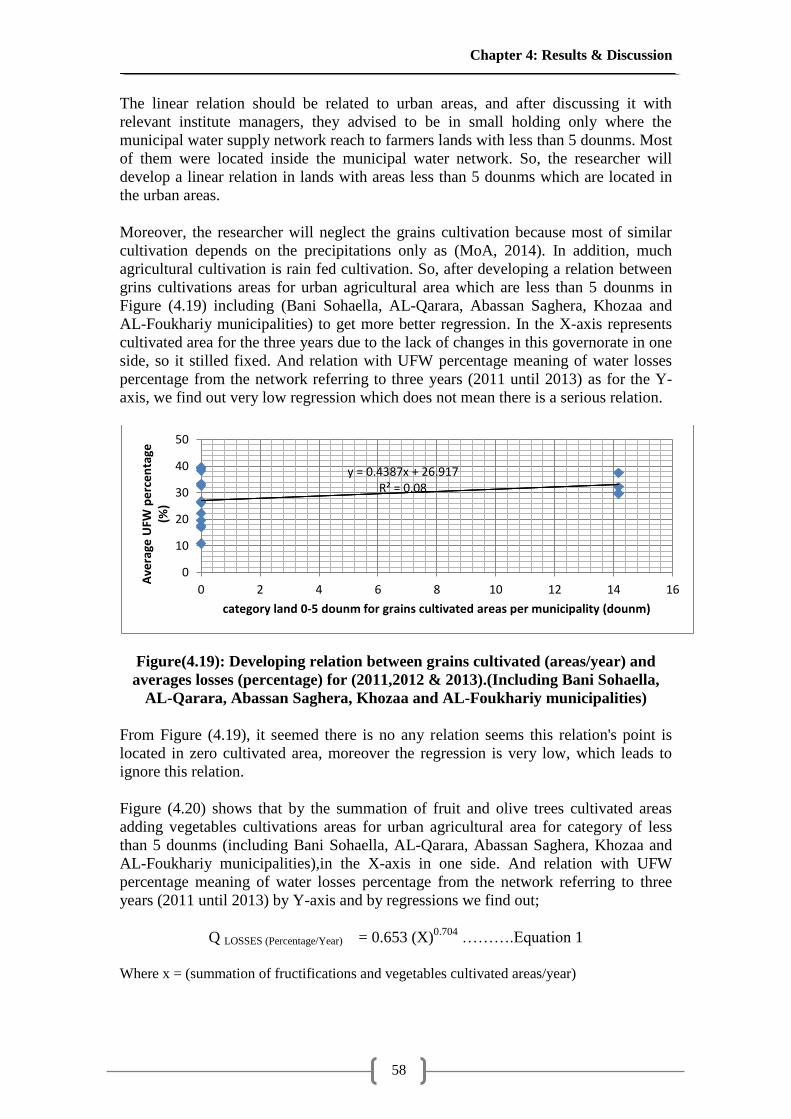
Chapter 4: Results & Discussion
58
The linear relation should be related to urban areas, and after discussing it with
relevant institute managers, they advised to be in small holding only where the
municipal water supply network reach to farmers lands with less than 5 dounms. Most
of them were located inside the municipal water network. So, the researcher will
develop a linear relation in lands with areas less than 5 dounms which are located in
the urban areas.
Moreover, the researcher will neglect the grains cultivation because most of similar
cultivation depends on the precipitations only as (MoA, 2014). In addition, much
agricultural cultivation is rain fed cultivation. So, after developing a relation between
grins cultivations areas for urban agricultural area which are less than 5 dounms in
Figure (4.19) including (Bani Sohaella, AL-Qarara, Abassan Saghera, Khozaa and
AL-Foukhariy municipalities) to get more better regression. In the X-axis represents
cultivated area for the three years due to the lack of changes in this governorate in one
side, so it stilled fixed. And relation with UFW percentage meaning of water losses
percentage from the network referring to three years (2011 until 2013) as for the Y-
axis, we find out very low regression which does not mean there is a serious relation.
Figure(4.19): Developing relation between grains cultivated (areas/year) and
averages losses (percentage) for (2011,2012 & 2013).(Including Bani Sohaella,
AL-Qarara, Abassan Saghera, Khozaa and AL-Foukhariy municipalities)
From Figure (4.19), it seemed there is no any relation seems this relation's point is
located in zero cultivated area, moreover the regression is very low, which leads to
ignore this relation.
Figure (4.20) shows that by the summation of fruit and olive trees cultivated areas
adding vegetables cultivations areas for urban agricultural area for category of less
than 5 dounms (including Bani Sohaella, AL-Qarara, Abassan Saghera, Khozaa and
AL-Foukhariy municipalities),in the X-axis in one side. And relation with UFW
percentage meaning of water losses percentage from the network referring to three
years (2011 until 2013) by Y-axis and by regressions we find out;
Q LOSSES (Percentage/Year) = 0.653 (X)0.704
……….Equation 1
Where x = (summation of fructifications and vegetables cultivated areas/year)
y = 0.4387x + 26.917 R² = 0.08
0
10
20
30
40
50
0 2 4 6 8 10 12 14 16
Ave
rage
UFW
pe
rce
nta
ge
(%)
category land 0-5 dounm for grains cultivated areas per municipality (dounm)
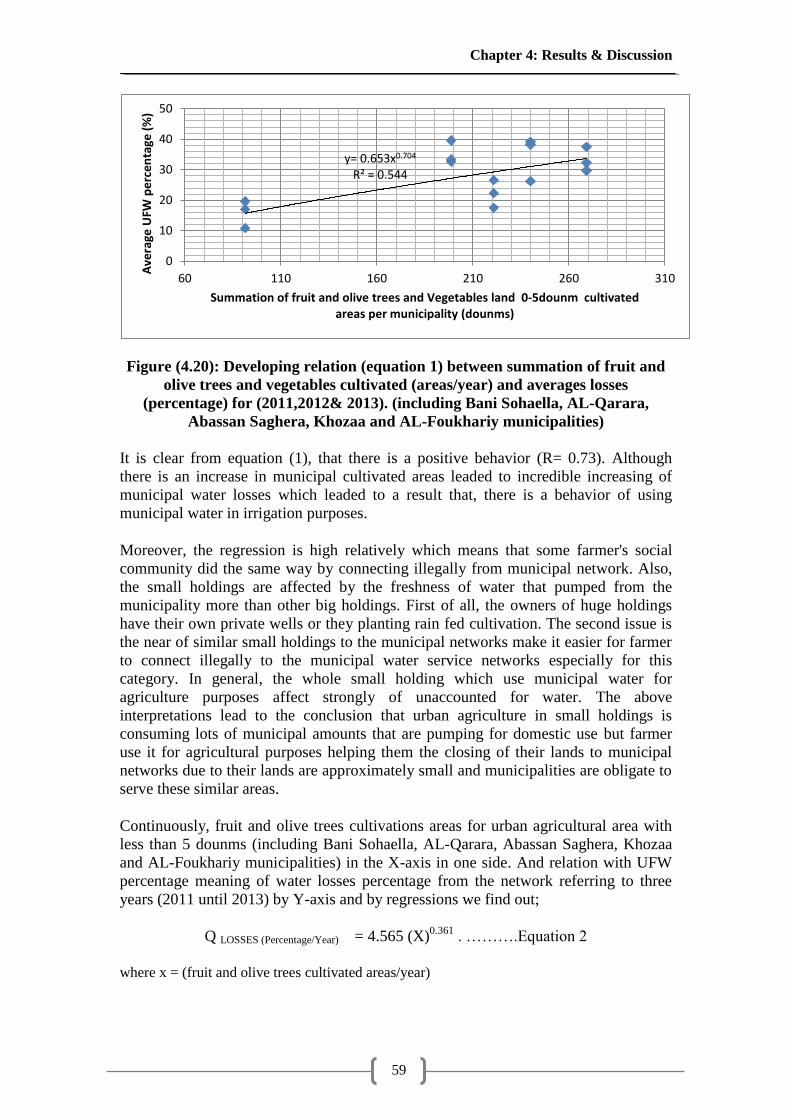
Chapter 4: Results & Discussion
59
Figure (4.20): Developing relation (equation 1) between summation of fruit and
olive trees and vegetables cultivated (areas/year) and averages losses
(percentage) for (2011,2012& 2013). (including Bani Sohaella, AL-Qarara,
Abassan Saghera, Khozaa and AL-Foukhariy municipalities)
It is clear from equation (1), that there is a positive behavior (R= 0.73). Although
there is an increase in municipal cultivated areas leaded to incredible increasing of
municipal water losses which leaded to a result that, there is a behavior of using
municipal water in irrigation purposes.
Moreover, the regression is high relatively which means that some farmer's social
community did the same way by connecting illegally from municipal network. Also,
the small holdings are affected by the freshness of water that pumped from the
municipality more than other big holdings. First of all, the owners of huge holdings
have their own private wells or they planting rain fed cultivation. The second issue is
the near of similar small holdings to the municipal networks make it easier for farmer
to connect illegally to the municipal water service networks especially for this
category. In general, the whole small holding which use municipal water for
agriculture purposes affect strongly of unaccounted for water. The above
interpretations lead to the conclusion that urban agriculture in small holdings is
consuming lots of municipal amounts that are pumping for domestic use but farmer
use it for agricultural purposes helping them the closing of their lands to municipal
networks due to their lands are approximately small and municipalities are obligate to
serve these similar areas.
Continuously, fruit and olive trees cultivations areas for urban agricultural area with
less than 5 dounms (including Bani Sohaella, AL-Qarara, Abassan Saghera, Khozaa
and AL-Foukhariy municipalities) in the X-axis in one side. And relation with UFW
percentage meaning of water losses percentage from the network referring to three
years (2011 until 2013) by Y-axis and by regressions we find out;
Q LOSSES (Percentage/Year) = 4.565 (X)0.361
. ……….Equation 2
where x = (fruit and olive trees cultivated areas/year)
y= 0.653x0.704 R² = 0.544
0
10
20
30
40
50
60 110 160 210 260 310
Ave
rage
UFW
pe
rce
nta
ge (
%)
Summation of fruit and olive trees and Vegetables land 0-5dounm cultivated areas per municipality (dounms)
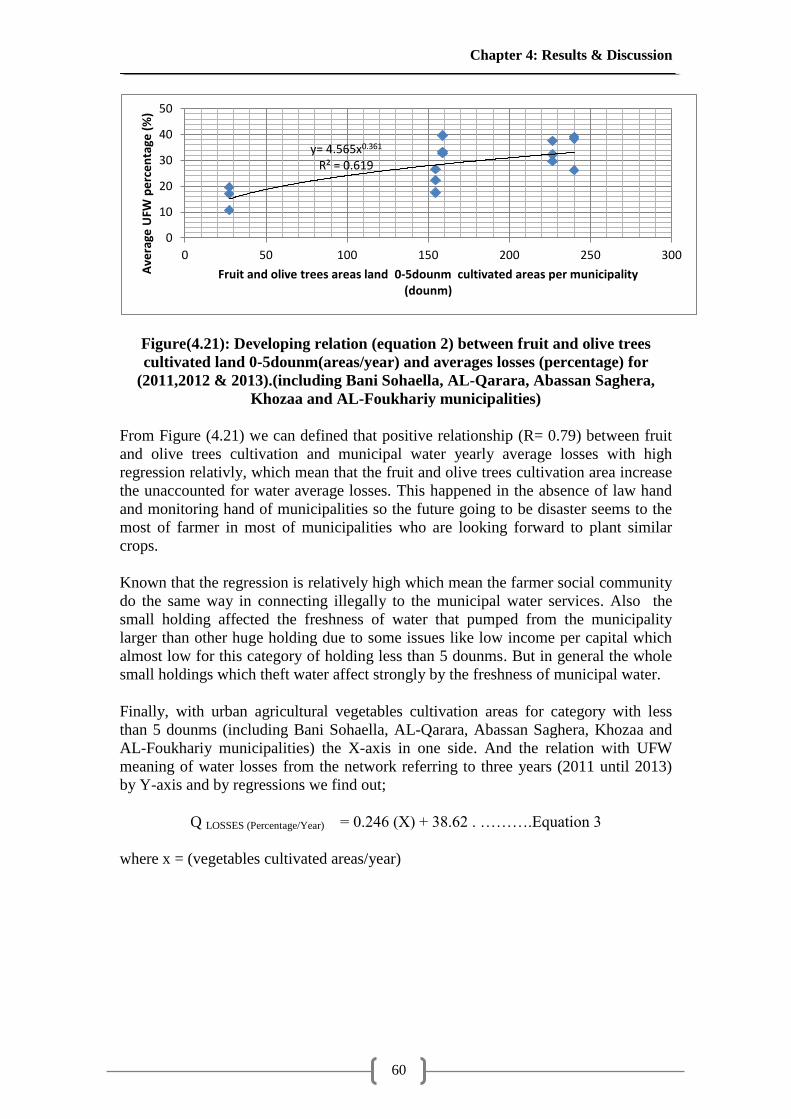
Chapter 4: Results & Discussion
60
Figure(4.21): Developing relation (equation 2) between fruit and olive trees
cultivated land 0-5dounm(areas/year) and averages losses (percentage) for
(2011,2012 & 2013).(including Bani Sohaella, AL-Qarara, Abassan Saghera,
Khozaa and AL-Foukhariy municipalities)
From Figure (4.21) we can defined that positive relationship (R= 0.79) between fruit
and olive trees cultivation and municipal water yearly average losses with high
regression relativly, which mean that the fruit and olive trees cultivation area increase
the unaccounted for water average losses. This happened in the absence of law hand
and monitoring hand of municipalities so the future going to be disaster seems to the
most of farmer in most of municipalities who are looking forward to plant similar
crops.
Known that the regression is relatively high which mean the farmer social community
do the same way in connecting illegally to the municipal water services. Also the
small holding affected the freshness of water that pumped from the municipality
larger than other huge holding due to some issues like low income per capital which
almost low for this category of holding less than 5 dounms. But in general the whole
small holdings which theft water affect strongly by the freshness of municipal water.
Finally, with urban agricultural vegetables cultivation areas for category with less
than 5 dounms (including Bani Sohaella, AL-Qarara, Abassan Saghera, Khozaa and
AL-Foukhariy municipalities) the X-axis in one side. And the relation with UFW
meaning of water losses from the network referring to three years (2011 until 2013)
by Y-axis and by regressions we find out;
Q LOSSES (Percentage/Year) = 0.246 (X) + 38.62 . ……….Equation 3
where x = (vegetables cultivated areas/year)
y= 4.565x0.361 R² = 0.619
0
10
20
30
40
50
0 50 100 150 200 250 300
Ave
rage
UFW
pe
rce
nta
ge (
%)
Fruit and olive trees areas land 0-5dounm cultivated areas per municipality (dounm)
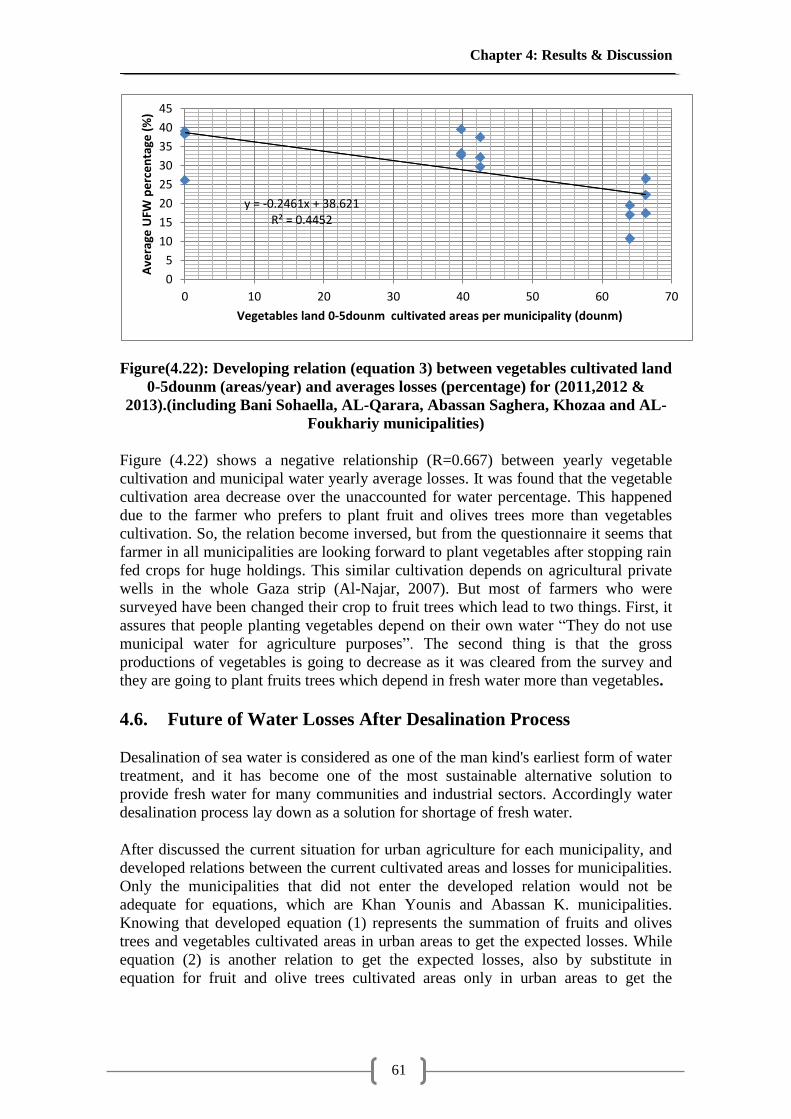
Chapter 4: Results & Discussion
61
Figure(4.22): Developing relation (equation 3) between vegetables cultivated land
0-5dounm (areas/year) and averages losses (percentage) for (2011,2012 &
2013).(including Bani Sohaella, AL-Qarara, Abassan Saghera, Khozaa and AL-
Foukhariy municipalities)
Figure (4.22) shows a negative relationship (R=0.667) between yearly vegetable
cultivation and municipal water yearly average losses. It was found that the vegetable
cultivation area decrease over the unaccounted for water percentage. This happened
due to the farmer who prefers to plant fruit and olives trees more than vegetables
cultivation. So, the relation become inversed, but from the questionnaire it seems that
farmer in all municipalities are looking forward to plant vegetables after stopping rain
fed crops for huge holdings. This similar cultivation depends on agricultural private
wells in the whole Gaza strip (Al-Najar, 2007). But most of farmers who were
surveyed have been changed their crop to fruit trees which lead to two things. First, it
assures that people planting vegetables depend on their own water ―They do not use
municipal water for agriculture purposes‖. The second thing is that the gross
productions of vegetables is going to decrease as it was cleared from the survey and
they are going to plant fruits trees which depend in fresh water more than vegetables.
4.6. Future of Water Losses After Desalination Process
Desalination of sea water is considered as one of the man kind's earliest form of water
treatment, and it has become one of the most sustainable alternative solution to
provide fresh water for many communities and industrial sectors. Accordingly water
desalination process lay down as a solution for shortage of fresh water.
After discussed the current situation for urban agriculture for each municipality, and
developed relations between the current cultivated areas and losses for municipalities.
Only the municipalities that did not enter the developed relation would not be
adequate for equations, which are Khan Younis and Abassan K. municipalities.
Knowing that developed equation (1) represents the summation of fruits and olives
trees and vegetables cultivated areas in urban areas to get the expected losses. While
equation (2) is another relation to get the expected losses, also by substitute in
equation for fruit and olive trees cultivated areas only in urban areas to get the
y = -0.2461x + 38.621 R² = 0.4452
0
5
10
15
20
25
30
35
40
45
0 10 20 30 40 50 60 70
Ave
rage
UFW
pe
rce
nta
ge (
%)
Vegetables land 0-5dounm cultivated areas per municipality (dounm)
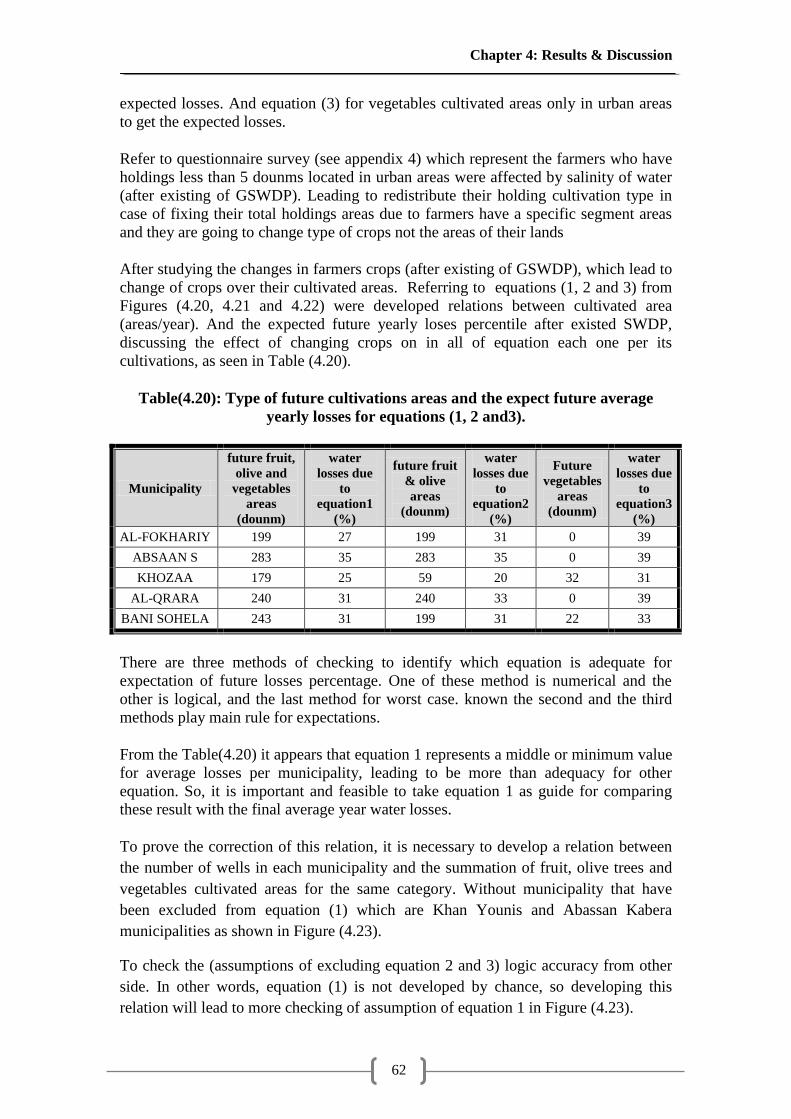
Chapter 4: Results & Discussion
62
expected losses. And equation (3) for vegetables cultivated areas only in urban areas
to get the expected losses.
Refer to questionnaire survey (see appendix 4) which represent the farmers who have
holdings less than 5 dounms located in urban areas were affected by salinity of water
(after existing of GSWDP). Leading to redistribute their holding cultivation type in
case of fixing their total holdings areas due to farmers have a specific segment areas
and they are going to change type of crops not the areas of their lands
After studying the changes in farmers crops (after existing of GSWDP), which lead to
change of crops over their cultivated areas. Referring to equations (1, 2 and 3) from
Figures (4.20, 4.21 and 4.22) were developed relations between cultivated area
(areas/year). And the expected future yearly loses percentile after existed SWDP,
discussing the effect of changing crops on in all of equation each one per its
cultivations, as seen in Table (4.20).
Table(4.20): Type of future cultivations areas and the expect future average
yearly losses for equations (1, 2 and3).
Municipality
future fruit,
olive and
vegetables
areas
(dounm)
water
losses due
to
equation1
(%)
future fruit
& olive
areas
(dounm)
water
losses due
to
equation2
(%)
Future
vegetables
areas
(dounm)
water
losses due
to
equation3
(%)
AL-FOKHARIY 199 27 199 31 0 39
ABSAAN S 283 35 283 35 0 39
KHOZAA 179 25 59 20 32 31
AL-QRARA 240 31 240 33 0 39
BANI SOHELA 243 31 199 31 22 33
There are three methods of checking to identify which equation is adequate for
expectation of future losses percentage. One of these method is numerical and the
other is logical, and the last method for worst case. known the second and the third
methods play main rule for expectations.
From the Table(4.20) it appears that equation 1 represents a middle or minimum value
for average losses per municipality, leading to be more than adequacy for other
equation. So, it is important and feasible to take equation 1 as guide for comparing
these result with the final average year water losses.
To prove the correction of this relation, it is necessary to develop a relation between
the number of wells in each municipality and the summation of fruit, olive trees and
vegetables cultivated areas for the same category. Without municipality that have
been excluded from equation (1) which are Khan Younis and Abassan Kabera
municipalities as shown in Figure (4.23).
To check the (assumptions of excluding equation 2 and 3) logic accuracy from other
side. In other words, equation (1) is not developed by chance, so developing this
relation will lead to more checking of assumption of equation 1 in Figure (4.23).
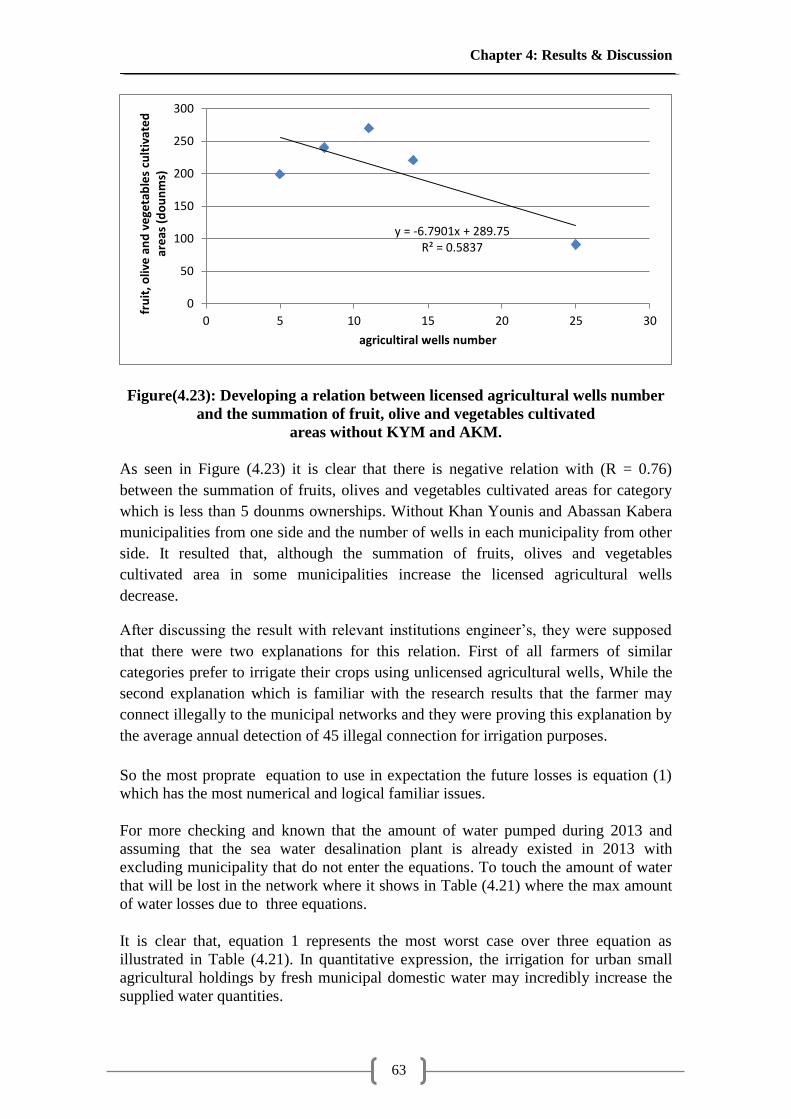
Chapter 4: Results & Discussion
63
Figure(4.23): Developing a relation between licensed agricultural wells number
and the summation of fruit, olive and vegetables cultivated
areas without KYM and AKM.
As seen in Figure (4.23) it is clear that there is negative relation with (R = 0.76)
between the summation of fruits, olives and vegetables cultivated areas for category
which is less than 5 dounms ownerships. Without Khan Younis and Abassan Kabera
municipalities from one side and the number of wells in each municipality from other
side. It resulted that, although the summation of fruits, olives and vegetables
cultivated area in some municipalities increase the licensed agricultural wells
decrease.
After discussing the result with relevant institutions engineer‘s, they were supposed
that there were two explanations for this relation. First of all farmers of similar
categories prefer to irrigate their crops using unlicensed agricultural wells, While the
second explanation which is familiar with the research results that the farmer may
connect illegally to the municipal networks and they were proving this explanation by
the average annual detection of 45 illegal connection for irrigation purposes.
So the most proprate equation to use in expectation the future losses is equation (1)
which has the most numerical and logical familiar issues.
For more checking and known that the amount of water pumped during 2013 and
assuming that the sea water desalination plant is already existed in 2013 with
excluding municipality that do not enter the equations. To touch the amount of water
that will be lost in the network where it shows in Table (4.21) where the max amount
of water losses due to three equations.
It is clear that, equation 1 represents the most worst case over three equation as
illustrated in Table (4.21). In quantitative expression, the irrigation for urban small
agricultural holdings by fresh municipal domestic water may incredibly increase the
supplied water quantities.
y = -6.7901x + 289.75 R² = 0.5837
0
50
100
150
200
250
300
0 5 10 15 20 25 30
fru
it, o
live
an
d v
ege
tab
les
cult
ivat
ed
ar
eas
(d
ou
nm
s)
agricultiral wells number

Chapter 4: Results & Discussion
64
Table(4.21): Amount of losses due to equ.1, 2 & 3 (CM) for (2013).
Municipality
water losses due
to equation1
(m3)
water losses due
to equation2
(m3)
water losses
due to
equation3 (m3)
max amount of
losses due to
equ.1, 2 & 3 (m3)
AL-FOUKHARIY 117002 81798 93435 117002
ABASSAN S 543473 408098 493305 543473
KHOZAA 376839 294155 244486 376839
AL-QARARA 164892 119549 140963 164892
BANI SOHELLA 544853 443304 506454 544853
Now comparing the future situation assuming that the sea water desalination plant is
already existed in 2013 to touch the amount of water that losses in the network by
illegal urban agricultural connections as illustrated in Figure (4.24). It is clear that
most municipalities which use municipal water for irrigation like Abassan Saghera
reaching 3 times in comparing with losses in 2013 around 112,938m3. But if the
desalination plant existed in the same year it would reach 543,473m3. But other
municipalities like Al-Qarara the losses will decrease one third if the desalination
plant existed reaching 164,892m3.
Figure (4.24): Amount of future losses after sea water desalination plant
constructed and losses of 2013.
After calculating the differences between unaccounted for water in 2013 as seen in
Figure (4.24) and the expected future losses after the sea water desalination plant exist
there are 508,122 m3 are considered as additional losses fixing current and future
losses in Khan Younis and Abassan Kabera municipalities due to that municipality are
considered out of relations, leading to additional 10.1% of the total losses during 2013
which was 5,012,680 m3 For the whole governorate.
AL-FOKHARIY
ABSAAN S KHOZAA AL-QRARABANI
SOHELA
max amount of losses due toequ.1, 2 & 3 (CM)
117002 543473 376839 164892 544853
water losses 2013 (CM) 120,005 137,375 112,938 539,637 328,982
0
1
2
3
4
5
6
Cu
bic
Me
ter
X 1
00
,00
0
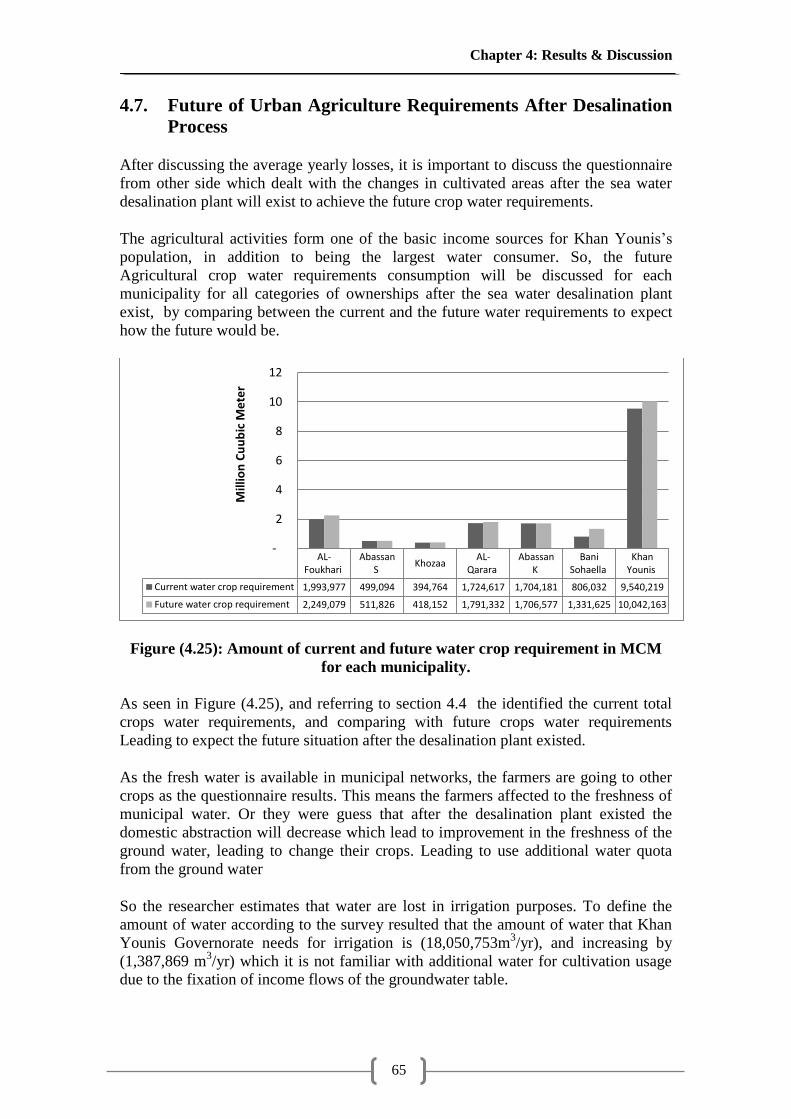
Chapter 4: Results & Discussion
65
4.7. Future of Urban Agriculture Requirements After Desalination
Process
After discussing the average yearly losses, it is important to discuss the questionnaire
from other side which dealt with the changes in cultivated areas after the sea water
desalination plant will exist to achieve the future crop water requirements.
The agricultural activities form one of the basic income sources for Khan Younis‘s
population, in addition to being the largest water consumer. So, the future
Agricultural crop water requirements consumption will be discussed for each
municipality for all categories of ownerships after the sea water desalination plant
exist, by comparing between the current and the future water requirements to expect
how the future would be.
Figure (4.25): Amount of current and future water crop requirement in MCM
for each municipality.
As seen in Figure (4.25), and referring to section 4.4 the identified the current total
crops water requirements, and comparing with future crops water requirements
Leading to expect the future situation after the desalination plant existed.
As the fresh water is available in municipal networks, the farmers are going to other
crops as the questionnaire results. This means the farmers affected to the freshness of
municipal water. Or they were guess that after the desalination plant existed the
domestic abstraction will decrease which lead to improvement in the freshness of the
ground water, leading to change their crops. Leading to use additional water quota
from the ground water
So the researcher estimates that water are lost in irrigation purposes. To define the
amount of water according to the survey resulted that the amount of water that Khan
Younis Governorate needs for irrigation is (18,050,753m3/yr), and increasing by
(1,387,869 m3/yr) which it is not familiar with additional water for cultivation usage
due to the fixation of income flows of the groundwater table.
AL-Foukhari
AbassanS
Khozaa AL-
Qarara Abassan
K Bani
Sohaella KhanYounis
Current water crop requirement 1,993,977 499,094 394,764 1,724,617 1,704,181 806,032 9,540,219
Future water crop requirement 2,249,079 511,826 418,152 1,791,332 1,706,577 1,331,625 10,042,163
-
2
4
6
8
10
12
Mill
ion
Cu
ub
ic M
ete
r
Chapter 4: Results & Discussion
66
To study the effect of additional quota, known that the farmers use agricultural wells
to irrigate their crop so it is important to study the effect of the ground water table.
Known that Gaza Strip uses only the ground water, so it is important to study the
Gaza Strip ground water table in general. The renewable amount of Gaza Strip ground
water is about 91 MCM in 2009, where 40 MCM comes from direct infiltration of
rainfall. The remaining amount (51 MCM) comes from irrigation return flow, leakage
from non-sewered areas and brackish trans-boundary flow that crosses the eastern
side of the Gaza Strip (PWA, 2010).
Total recharge was at 91MCM/year and the total agriculture use 80MCM/year for
irrigation purpose. Known that after existing of future desalination plant the
groundwater table will support by (10MCM/year) for domestic usage. This means that
the amount of ground table which supply the agriculture is still the same amount of
water supported for agricultural irrigations. While the changing in cultivation increase
the crops water requirements by 8.5%, which mean there would be a defects in the
ground water table. In order to identify the amount of water which would be used
after the desalination plant is constructed.
4.8. Soci-Economic Analysis
The Gaza Strip has over 45 years of unstable political conditions due to the Israeli
occupation, which is reflected directly on the social life. People practiced a type of
survival life. Also the economy of the Gaza strip is linked directly with Israel; the
standard of living in the Strip is deteriorating due to boarder closures and opening
restrictions. As a result, the number of unemployed people increases. Other
requirements such as housing, health care, water and wastewater services are mostly
below the minimum of international standards.
The municipal water pumped to people in Khan Younis has high concentration of
chloride and nitrate that exceeds the international standards. So, water quality in terms
of nitrate and chloride has negative significant impacts on people life and
development.
The responsibility of the PWA with relevant Palestinian institutions is to provide
people with an accepted quantity and quality of water at affordable price. This can be
achieved through desalination projects such as sea water desalination plant with the
participation of the public sector. As discussed before the unaccounted for water leads
to disaster, so there is a need to discuss and evaluate its reflection on the project.
Municipalities of the Gaza Strip do not grant license and links for agricultural usage
because of fact that water scarce and the high cost of the withdrawal of water from the
aquifer makes it difficult to provide water. Leading to cancels license for agricultural
use.
Even the municipalities facing difficulties in bells cost collection from the participant
of the networks in all municipalities which the main reason that threat the sea water
desalination project.

Chapter 4: Results & Discussion
67
For traded commodities, the money valuation of welfare gains or losses is generally
observable via prices paid in day- to- day transactions for goods and services.
However, for non-traded goods, including health care, the trade-offs that
appropriately reflect the money value that people attach to specified improvements in
welfare are usually non-observable in market transaction.
Finally, Willingness to pay is a type of valuation technique for non-market goods.
Different survey methods are available for generating willingness to pay data.
However, cost evaluation per desalinated cubic meter is more difficult, where there
were two techniques of evaluation costs.
The first technique of cost analysis discuss two methods one of them mention that the
user pay 3-4% of the individual yearly income. And the other related to family
income where defined the old cost adding another limited cost for supporting by
drinkable water referring to related institutes.
And the second technique of cost analysis also discuss two methods one of them
mention that the old cost of undrinkable water which pumped to the municipal water
distribution system. Adding 25% of old cost to get the desalination cost per cubic
meter. And the second method of evaluation the cost of desalinated cubic meter
related to operation and maintaining costs.
Now discussing the first technique of cost analysis, discussing the first method of
paying 3 – 4 % of the individual yearly income. But for residential consumed meter
readings there will be increasing of 9% of the original water meter reading after
desalination. But all of these additional quantities would cover from the residential
(Morin, 1999).
The following calculations test the individual capability to afford for water that is
produced after the sea water desalination plant construct. The result that individual
with annual income 400 US$/year can afford 7.4 % to 43% extra of the current
municipal water tariffs as shown in Table (4.22).
Table (4.22): Pricing as per individual after the sea water desalination
plant existed.
Description Qualitative Expression
Average cost of the current municipal water tariffs 0.335 US$/M3
Gross Domestic Product (GDP) /2002 400 US$/individual/year
3% -4% of annual income is paid for the water bill
(WB assumption)
Cost of the municipal water bill 12
US$/year to 16 US$/year
Per individual water consumption 90.5 L/c.d (in average+9%)
Total individual water consumption 33.03 M3 /year
Cost of M3 0.36 US$ to 0.48 US$
And the other related to family income where defined the old cost adding another
limited cost for supporting by drinkable water referring to related institutes.
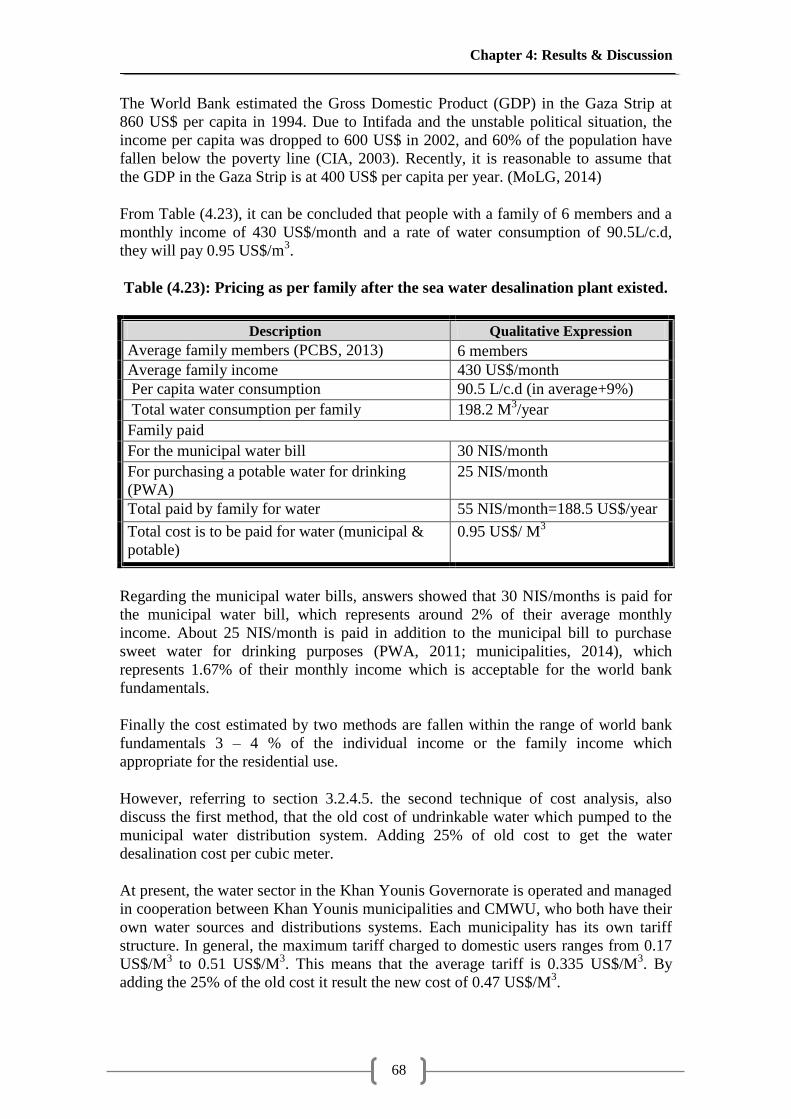
Chapter 4: Results & Discussion
68
The World Bank estimated the Gross Domestic Product (GDP) in the Gaza Strip at
860 US$ per capita in 1994. Due to Intifada and the unstable political situation, the
income per capita was dropped to 600 US$ in 2002, and 60% of the population have
fallen below the poverty line (CIA, 2003). Recently, it is reasonable to assume that
the GDP in the Gaza Strip is at 400 US$ per capita per year. (MoLG, 2014)
From Table (4.23), it can be concluded that people with a family of 6 members and a
monthly income of 430 US$/month and a rate of water consumption of 90.5L/c.d,
they will pay 0.95 US$/m3.
Table (4.23): Pricing as per family after the sea water desalination plant existed.
Description Qualitative Expression
Average family members (PCBS, 2013) 6 members
Average family income 430 US$/month
Per capita water consumption 90.5 L/c.d (in average+9%)
Total water consumption per family 198.2 M3/year
Family paid
For the municipal water bill 30 NIS/month
For purchasing a potable water for drinking
(PWA)
25 NIS/month
Total paid by family for water 55 NIS/month=188.5 US$/year
Total cost is to be paid for water (municipal &
potable)
0.95 US$/ M3
Regarding the municipal water bills, answers showed that 30 NIS/months is paid for
the municipal water bill, which represents around 2% of their average monthly
income. About 25 NIS/month is paid in addition to the municipal bill to purchase
sweet water for drinking purposes (PWA, 2011; municipalities, 2014), which
represents 1.67% of their monthly income which is acceptable for the world bank
fundamentals.
Finally the cost estimated by two methods are fallen within the range of world bank
fundamentals 3 – 4 % of the individual income or the family income which
appropriate for the residential use.
However, referring to section 3.2.4.5. the second technique of cost analysis, also
discuss the first method, that the old cost of undrinkable water which pumped to the
municipal water distribution system. Adding 25% of old cost to get the water
desalination cost per cubic meter.
At present, the water sector in the Khan Younis Governorate is operated and managed
in cooperation between Khan Younis municipalities and CMWU, who both have their
own water sources and distributions systems. Each municipality has its own tariff
structure. In general, the maximum tariff charged to domestic users ranges from 0.17
US$/M3 to 0.51 US$/M
3. This means that the average tariff is 0.335 US$/M
3. By
adding the 25% of the old cost it result the new cost of 0.47 US$/M3.
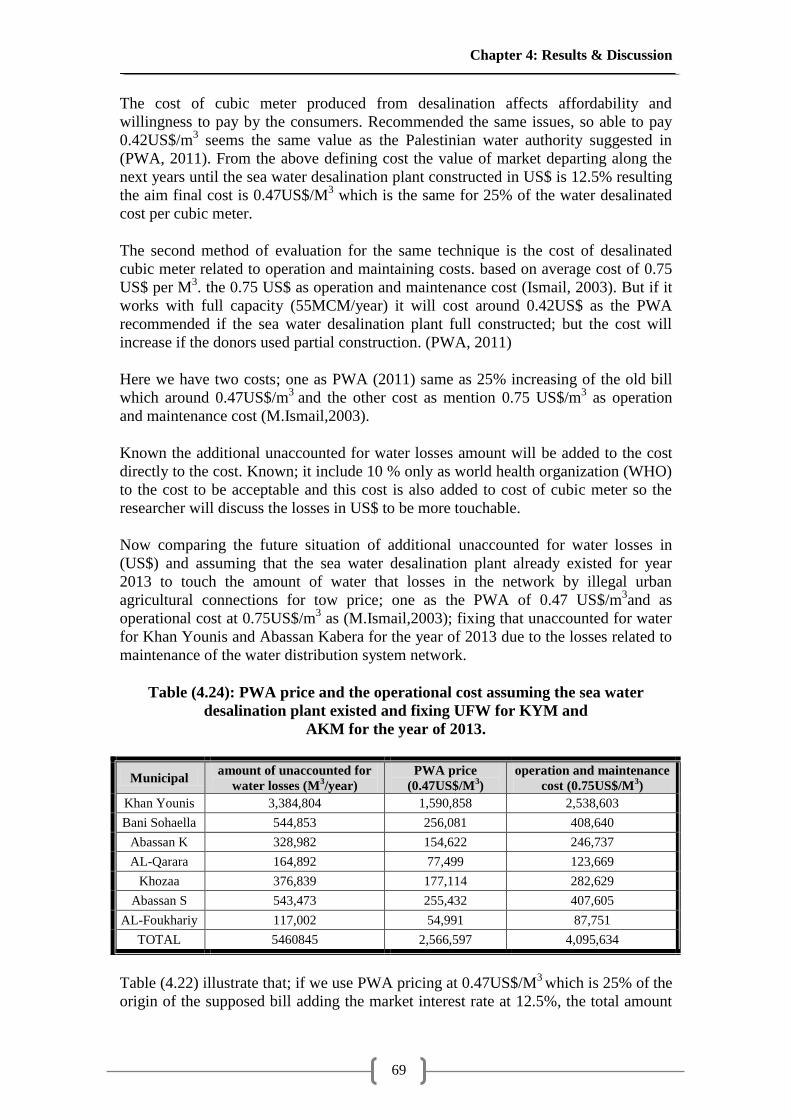
Chapter 4: Results & Discussion
69
The cost of cubic meter produced from desalination affects affordability and
willingness to pay by the consumers. Recommended the same issues, so able to pay
0.42US$/m3 seems the same value as the Palestinian water authority suggested in
(PWA, 2011). From the above defining cost the value of market departing along the
next years until the sea water desalination plant constructed in US$ is 12.5% resulting
the aim final cost is 0.47US$/M3 which is the same for 25% of the water desalinated
cost per cubic meter.
The second method of evaluation for the same technique is the cost of desalinated
cubic meter related to operation and maintaining costs. based on average cost of 0.75
US$ per M3. the 0.75 US$ as operation and maintenance cost (Ismail, 2003). But if it
works with full capacity (55MCM/year) it will cost around 0.42US$ as the PWA
recommended if the sea water desalination plant full constructed; but the cost will
increase if the donors used partial construction. (PWA, 2011)
Here we have two costs; one as PWA (2011) same as 25% increasing of the old bill
which around 0.47US$/m3
and the other cost as mention 0.75 US$/m3 as operation
and maintenance cost (M.Ismail,2003).
Known the additional unaccounted for water losses amount will be added to the cost
directly to the cost. Known; it include 10 % only as world health organization (WHO)
to the cost to be acceptable and this cost is also added to cost of cubic meter so the
researcher will discuss the losses in US$ to be more touchable.
Now comparing the future situation of additional unaccounted for water losses in
(US$) and assuming that the sea water desalination plant already existed for year
2013 to touch the amount of water that losses in the network by illegal urban
agricultural connections for tow price; one as the PWA of 0.47 US$/m3and as
operational cost at 0.75US$/m3 as (M.Ismail,2003); fixing that unaccounted for water
for Khan Younis and Abassan Kabera for the year of 2013 due to the losses related to
maintenance of the water distribution system network.
Table (4.24): PWA price and the operational cost assuming the sea water
desalination plant existed and fixing UFW for KYM and
AKM for the year of 2013.
Municipal amount of unaccounted for
water losses (M3/year)
PWA price
(0.47US$/M3)
operation and maintenance
cost (0.75US$/M3)
Khan Younis 3,384,804 1,590,858 2,538,603
Bani Sohaella 544,853 256,081 408,640
Abassan K 328,982 154,622 246,737
AL-Qarara 164,892 77,499 123,669
Khozaa 376,839 177,114 282,629
Abassan S 543,473 255,432 407,605
AL-Foukhariy 117,002 54,991 87,751
TOTAL 5460845 2,566,597 4,095,634
Table (4.22) illustrate that; if we use PWA pricing at 0.47US$/M3 which is 25% of the
origin of the supposed bill adding the market interest rate at 12.5%, the total amount

Chapter 4: Results & Discussion
70
of unaccounted for water losses is (2,566,597 US$) and for the cost of water by the
operation and maintenance cost at (0.75 US$/M3) was (4.095634 US$). This would
make a gap over (1,529,037 US$), This mean the sea water desalination plant should
constructed fully construction directly or there will be double the amount of losses in
US$ and there would be less willing to pay the bill.
Chapter 5: Conclusion & Recommendations
71
5 Chapter 5: Conclusion & Recommendations
Chapter 5: Conclusion & Recommendations
72
Chapter 5: Conclusion & Recommendations
5.1. Conclusion
The following points conclude the research main data and findings are divided into 4
main parts:
The first conclusion – and one of the most important – from the experience of survey
is that the continuation of the status in the water sector in Khan Younis Governorate
as illustrate in these points:-
In Khan Younis Governorate there is 37 well with total production around 15
Million Cubic Meter in 2013, and the meter readings was 10 MCM, which means
that the percentage of efficiency is (66%). Over (99.7%) of Khan Younis residents
currently have access to water services, but unfortunately not receiving
appropriate water quantities or qualities. As a result of this distribution, the
residents are used to reserve storage facilities over their roofs to meet their
demand during the periods of shut off water supply. Water is normally abstracted
from wells and discharged directly into the network in the west area which
covered 242,753 inhabitants (around 66% of total population). And the rest of the
inhabitants were located in the east area of the municipality, which used to use a
unique water tanks to supply the network with municipal water. In this scheme the
water is being abstracted from 7 different wells in different times, this water tanks
have 1000 m3 in capacity and 770 m
3 /hr in flow.
The recorded production for Khan Younis Governorate reached (14,322,328),
(14,458,129) and (15,001,990) m3/year for 2011, 2012 and 2013 respectively.
Where the recorded annual meter reading reached (8,355,122), (9,096,930) and
(9,942,298) m3/year for 2011, 2012 and 2013 respectively. As illustrated due to
increasing in population, the annual meter reading is progressively increased.
Where the max average monthly gap between the produced and the actual meter
reading quantities reached 5,967,206 m3 in 2011, 5,361,199 m
3 in 2012 and
5,059,693 m3 in 2013. The water losses reached 39.14% of the average produced
water quantities during the three reference years. So, domestic water consumers
are receiving only (60.86%) of their water entitlements.
To summarize the average supplied and metered water quantities per municipality,
in addition to the average efficiency and UFW percentages. Khan Younis is the
municipality with the lowest efficiency (56.4%) while It has two thirds of the
population of the whole governorate. So, it is the municipality with the highest
water losses. Followed by AL-Foukhariy then AL-Qarara, Abassan S, Abassan K
and Bani Sohaella at the efficiency range of 64% - 77.9 %.
As well, the daily average per capita water production is (111 L/c.d) but actually
the real usage is (74 L/c.d) far below the World Health Organization (WHO)
recommendations for urban populations. As illustrated the variant per capita
supplied water quantity per each municipality. Al-Qarara is the municipality with
the highest per capita supply during 2012 and 2013 and Khozaa has the highest
per capita supply during 2011 and Khan-Younis has the lowest per capita supply
of 99 L/c.d.
Khozaa is the municipality with the highest per capita meter reading during 2011,
2012 and 2013 with 126, 119 and 106 L/c.d, respectively. And Khan Younis has
the lowest per capita supply during 2011 and 2012 with 57 L/c.d and 65 L/c.d
Chapter 5: Conclusion & Recommendations
73
respectively, and AL-Qarara municipality has the lowest per capita supply of 60
L/c.d in 2013. All the lowest per capita meter reading is far below the world
health organization (WHO).
This bad efficiency is reflecting two things in this area; the first thing refers to the
efficiency of the water pipe network system itself within the domestic area which
is obvious in the old city and old zones. The second reason refers to the
Unaccounted For Water which is seen in the illegal connections from the
Municipality wells towards the agricultural area of Khan Younis without any
monitoring or control which is clear in the relations between fructifications trees
agricultural and the problem with unfixed flow meter.
The 2nd
conclusion part –The problems with leakage and infiltration are much less
intractable in Khan Younis municipalities in relation to the agricultural use of
groundwater, compared to domestic water supply. There are several reasons as
illustrate in these points:-
The urban agriculture will influence the efficiency of water network because it
needs a huge amount of water, where farmers may use the domestic network for
irrigation purposes illegally. This leads to higher water supply per capita as
illustrate in AL-Qarara which apparently exceeds (168 L/c.d).
The municipalities of Khan Younis have not a clear map showing the water
distribution districts and the locations of the wells. So, using a team of 6 members
selected from the urban areas to the survey who have known well of the area with
helping from the engineers of municipalities. The cultivated area in Khan Younis
is 37.306 km2, where 10.702 km
2 were cultivated via green houses, in addition to
13.709 km2 were dedicated to grains crops in open fields and 12.896 km
2 were
dedicated to fruit and olives trees cultivation.
The ownerships are divided into categories starting with 0 to 5 dounms with total
area of 669 dounms, then from 5 to 20 dounms with total area of 3024 dounms,
from 20 to 50 dounms with total area of 4265 dounms, from 50 to 100 dounms
with total area of 4265 dounms and finally more over 100 dounms with total area
of 3591 dounms.
The field survey has been conducted by the researcher with the assistance of staff
and held a workshop that aimed to understand the goals of the questionnaire. The
field survey has been applied to more than 440 participants in the Municipalities
of Khan Younis governorate. Its items focused on the proportion of the
participant's current lands, and the type of agricultural cultivation areas,
discussing the future of agriculture after the sea water desalination plant
constructed and their effect on types of cultivation.
The researcher achieve to fixed the areas were cultivated in the three years are the
same as nothing change in affective issues (like policy, social issue, …etc). a
reference period of three years (2010 – 2013) was used, finding a relation in
between the losses percentile for years (2011 - 2013) and type of cultivation areas
for each municipality for the same period. During developing the relation, and
after referring to MoA and municipalities there were excluded for municipalities
that depend on their own private wells to irrigate their cultivation like Khan
Younis and Abassan K municipalities. The linear relation should be related to
urban areas, and after discussing it with relevant institute managers, they advised
to be in small holding only where the municipal water supply network reach to
Chapter 5: Conclusion & Recommendations
74
farmers lands with less than 5 dounms. Most of them were located inside the
municipal water network.
The above conclusion indicated that there is a serious relation between the
summation of fruits and olives trees and vegetables cultivated areas in urban areas
to get the expected losses in urban agriculture areas. Considering domestic water
scarcity lead to threats of Khan Younis domestic water future specially after the
sea water desalination plant existed.
The 3rd
conclusion part –The problems with desalination of sea water future
expectation of losses and the water crops requirements and effects with ground water
table. There are several points to illustrate the expectations:-
Discussing the yearly future average losses in case of existing of SWDP with
reference to questionnaire survey. And after substitutes in developed equation 1
for municipalities. It result that the losses were 27%, 35%, 25%, 31% and 31% for
AL-Foukhariy, Abassan Saghera, Khozaa, and Bani Sohaella municipalities
respectively. Which mean that it is look like bad future for desalination. In
quantitative expression, the irrigation for urban small agricultural holdings by
Municipal domestic water may incredibly increase the per capita supplied water
quantities. But, for residential consumed meter reading there would be increasing
of 9% of the original water meter reading, but all of these additional quantities
would be covered from the bills directly. It is clear that most municipalities which
use municipal water for irrigation like Abassan Saghera double 3 times in
comparing with losses in 2013 reaching 543,473 m3. But other municipalities like
Al-Qarara the losses will decrease to one third which mean that farmers are not
affected by freshness of water while they are mainly depend on grains in their
cultivations.
The crops water requirements was important to discuss for the future Agricultural
crops water requirements consumption for all categories of ownerships after the
sea water desalination plant exist. When it is important to expect the groundwater
table future situation by comparing between the current and the future water
requirements to expect the future. It would be increasing in the crops water
requirement by 8.5%, which mean there would be defects in the ground water
table.
Gaza Strip have total recharge at 91 MCM/year where agriculture use 80
MCM/year for irrigation purpose. Known that after existing of future desalination
plant the groundwater table will support by 10MCM/year for domestic. This
means that the amount of ground table which supply the agriculture is still the
same amount of water supported for agricultural irrigations while the changing in
cultivation.
Finally, the 4th
conclusion part –The discussing the socio-economic factor
The researcher discussed the socio-economic factor and used two techniques. One
technique divided into two methods, it depend of the users would pay 2-3% of
their individual income leading to 0.36 – 0.48 US$/M3, the other related to the
familial income reaching 0.59 US$/M3. Both achieve surround pricing. The other
technique either divided into two method one for operation and maintenance cost
leading to 0.75 US$/M3
and the other method for additional 25 % of old cost
reaching 0.47 US$/M3.
Chapter 5: Conclusion & Recommendations
75
After compared the future situation for unaccounted for water in US$ assuming
the sea water desalination plant already existed for year 2013 to touch the amount
of water that losses in the network by illegal urban agricultural connections for
tow price one as the PWA and the researcher achieved 0.47US$ per desalinated
cube of water and as operational cost 0.75US$ per desalinated cube of water.
After discussion these two cost method the researcher achieved to shortage of
collection bells and the Deficiency is 2,566,597 US$ cost at 0.47 US$/M3 and the
cost of water by the operation and maintenance cost at 0.75 US$/M3 was 4.095634
US$ this would make a gap over 1,529,037 US$.
5.2. Recommendations:
The research recommendations are stated on the light of all the discussions above, as
follows:
1. Increase the consciousness for community and increase the power of law in
detection of illegal connections specially for agricultural purposes.
2. The research can be utilized by the relevant authorities and institutions in
prioritizing their focus on the problems.
3. Support the agricultural sector by uncongenial water source to avoid agricultural
illegal connection to the municipal water networks.
4. For water operators in Khan Younis Governorate (CMWU & Khan Younis
Municipalities) It is recommended to conduct a detailed field survey in order to
identify the exact holdings in urban areas and developing a new familiar
municipal water networks maps, which will provide a decision support system for
the policy makers.
5. The sea water desalination plant should be constructed fully construction directly,
while the proposed project must be finished in 2015. Moreover there will be
double the amount of losses in US$ and there would be less willing to pay the
bills, in order to decreasing of desalinated water amount will increase the bill cost.
6. Close monitoring to the water distribution network is recommended, especially for
district with low efficiency and higher portion of the supplied water.
7. It is recommended to consider modifying the current water distribution schedule
to ensure equal access to domestic water for all governorate citizens.
8. Governmental and Non-Governmental organizations should promote the culture
of reusing of grey water for irrigation purposes after adequate treatment inside the
household.
9. This research applies decision support system for planners, designers and
technicians in Khan Younis municipalities to address uncertainties about water
losses and which municipalities are suffer from thefts helping to detect these
illegal connections.
10. Integration on local level between the regulatory parties (Palestinian Water
Authority, Ministry of Health and Environment Quality Authority and Khan
Younis municipalities) is crucial and vital in order to regulate and organize the
desalination industry. Moreover, cooperation, data exchange and experience are
required between relevant institutions.
11. Desalination projects need high capital investment; for this purpose integrated
cooperation between public and private sector is highly recommended in order to
increase the efficiency of water supply operational conditions, which will reflect
positively on customers.
References
76
References
1. Abu-Mayla, Y., Abu-Jabbal, M. and El-Baba, M. (1998). "Water Resources
Management and Development in Gaza Strip-Palestine". Paper Presented at the
Conference of Water and Food Security in the Middle East 20-23 April 1998.
Nicosia, Cyprus.
2. Abu-Meri M. (2012). Water Meter reading Behavior in Semi Urban Areas
BeitLahya Town as a Case Study, M.SC thesis. IUG, Gaza, Palestine, 2012.
3. Agricultural Relief Committees, Gaza, Palestine.
4. Al-Khatib M. and H. Al-Najar (2011). Hydro-geo-chemical characteristics of
groundwater beneath the Gaza Strip. Journal of Water Resources and Protection. 3
(5): 341-348.
5. Al-Khatib, I., Arafat H. (2009). Chemical and microbiological quality of
desalinated water, groundwater and rain-fed cisterns in the Gaza strip, Palestine.
Published by Elsevier B.V. doi:10.1016/j.desal.2009.01.038
6. Alpert, P. (2004). The water crisis in the E. Mediterranean – and relation to global
warming. Water in the Middle East and North Africa. Berlin, Germany:
Springer,pp55-61.
7. Alpert, P. (2008). Climatic trends to extremes employing regional modeling and
statistical interpretation over the E. Mediterranean. Global and Planetary Change
63, pp. 163–170.
8. Al-Najar H. and Adeloye A. J. (2005). The Effect of Urban Expansion on
Groundwater as a Renewable Resource in the Gaza Strip, RICS Research, Vol. 5,
No. 8, 2005, pp.7-21.
9. Al-Najar H. (2007). Urban agriculture and Eco-sanitation: The strategic potential
toward poverty alleviation in the Gaza Strip. RICS Research 7(7): 9-22 (FAO)
10. Al-Najar, H. (2010). Urban agriculture and Eco-sanitation: the strategic potential
toward poverty alleviation in the Gaza Strip.
11. Amnesty International (2009). Troubled Waters – Palestinians Denied Fairy
Access To Water.
12. Applied Research Institute –ARIJ (2007). Israel Re-strategizes its Occupation of
the Gaza Strip.
13. Arndt, C. and K.R. Simler (2007). Consistent Poverty Comparisons and Inference,
Agricultural Economics 37:133-143
14. Al-Yaqubi, A. (2008). Gaza Strip: Sustainable Yield of the Coastal Aquifer.
Unpublished report. Gaza City. Palestinian Water Authority.
References
77
15. Al-Yaqubi, A.; Aliewi, A. and Mimi, Z. (2007). Bridging the Domestic Water
Demand Gapin Gaza Strip-Palestine. Water International, Vol. 32, Number 2, P.
219-229.
16. Buros, O.K. (2000). The ABCs of Desalting, International Desalination
Association.
17. CAMP (2000). Integrated Aquifer Management Plan, Coastal Aquifer
Management Program. Metcalf & Eddy in cooperation with the Palestinian Water
Authority (PWA). United States Agency for International Development, May
2000.
18. Coastal aquifer management plan (CAMP) (2000). Gaza Coastal Aquifer
Management Program, Volume 1, Task 3.
19. Coastal aquifer management plan (CAMP) (2000). Coastal Aquifer Management
Program. Volume I. Integrated Aquifer Management Program, Task 3. Gaza, May
2000.
20. Choe, K., Varley, R., and Bilani, H. (1996). Coping with Intermittent Water
Supply; Problems and Prospects, Environmental Health Project. Activity Report
No. 26, USAID, USA
21. Clean development mechanism (CDM) (2011). Light on water supply safty of
Gaza Strip and Gaza sea water desalination plant report.
22. CMWU, ( 2003-2012). meter reading records (water meters recording software).
23. Costal municipalities water utility (CMWU) (2008). Water Safety Report.
24. Costal municipalities water utility (CMWU) reports (2009,2010 and 2011).
25. CMWU (2011). Annual Report on Water Status in the Gaza Strip – Summary
about Water and Wastewater Situation in Gaza Strip.
26. CMWU supply records (2010 - 2012).
27. EPD Guidance Document, (2007). water loss control program.
28. European Community (EC), (1993). Prospects for Brackish Water Desalination in
Gaza. The Commission of the European Communities-Director General for
External Relations. March 1993.pp.13-22.
29. FAO (2003). World Agriculture Twoards 2015/2030. Rome, Italy.
30. General of Resources and Planning, Palestinian Water Authority.
31. Govindaraju R. S. (2000). Artificial neural network in hydrology. Journal of
Hydrologic Engineering, 5(2), 124-137.
32. Hamdan S. and M. Muheisen (2003). Rainfall and Groundwater in the Gaza Strip .
References
78
33. Hamdan, S. (2012). Artificial Recharge of Groundwater with Storm water as a
New Water Resource -Case Study of the Gaza Strip, Palestine. PH.D thesis von
derFakultat VI – PlanenBauenUmwelt der TechnischenUniversitat Berlin.
34. I. Pankratov and H. Ranaan (2005). Sources of salinity and boron in the Gaza
Strip: Natural contaminant flow in the southern Mediterranean coastal aquifer.
Water Resources Research 41(1).
35. Israeli Water Authority IWA (2012). Evaluation of Ashkelon sea water
desalination plant. water supply report (2012).
36. Kutner M. H., Nachtsheim C. J., and Neter J. (2004). Applied Linear Regression
Models, 4th ed., McGraw-Hill/Irwin, Boston (p. 25)
37. Ismail Mahmoud, (2003). Prospects of Water Desalination in the Gaza Strip,
Vol.1, pp. 47-81.
38. Al-Jamal K. and Al-Yaqubi A., 2010. Water Resources and Management
Issues(Gaza Strip/Palestine). Palestinian Water Authority.
39. Khalaf A., Al-Najar H. and Hamad J. (2006). Assessment of Rainwater Runoff
due to the Proposed Regional Plan for Gaza Governorate, Journal of Applied
Science, Vol. 6, No. 13, 2006, pp. 2693-2704.
40. Krishna, H. J. (1989). Virgin islands Water Resources Conference, Proc. Editor,
University of the Virgin Islands and U.S. Geological Survey.
41. Lisa Henthorne (2009). The Current State of Desalination. International
Desalination Association. Retrieved 05-09-2011.
42. Metcalf & Eddy, (2000). Costal Aquifer Management Program, Final Report:
Modeling of Gaza Strip Aquifer. The program is funded by US Agency for
International Development (USAID) and owned by the Palestinian Water
Authority (PWA). Gaza, Palestine.
43. Mimi, Z., Ziara M., and Nigim H. (2003). Water conservation and its perception
in Palestine: a case study.
44. Ministry of Local Governorates (MOLG) (2004). records and Maps of Urban
Development of Gaza Governorates in 2004, Department of Urban Planning.
Gaza, Palestinian National Authority (Unpublished).
45. Ministry of Agriculture (MoA) (2013). Cultivated areas records Gaza, PNA.
46. MoA Rainfall Records (2010-2013).
47. MoA/ Khan Younis Directorate Records (2012).
48. Morin CM, Colecchi C, Stone J, Sood R, Brink D.JAMA, (1999). Nonpharmacological treatment of late-life insomnia. a randomized controlled trial.
References
79
49. Mushtaha, A.M and J.Y. Al-Dadah, 2006. Agricultural and Municipal Water
Demand in Gaza Governorates for May.
50. Nasser, Y. (2003). Palestinian Water Needs and Rights in the Context of Past and
Future Development, In Water in Palestine: Problems — Politics — Prospects.
Palestinian Academic Society for the Study of International Affairs (PASSIA),
Jerusalem.
51. Oslo II, Article 40. (1995). Water Agreement: Water and Sewage, Principles1,
2,3. PWA, Gaza. September 18, pp. 213-216.
52. Palestinian Central Bureau of Statistics (PCBS), Reports (2005, 2006, 2007, 2011,
2012 and2013). PCBS Publications, Palestine.
53. Palestinian Central Bureau of Statistics (PCBS) (2006). Summary Statistics, Gaza
Strip, (1997-2015).
54. PCBS, P. C. (2007). Preliminary Results for the Census of Population and
Inhabitants. Palestinian Central Beurou of Statistics, Ramallh)
55. Palestinian Central Bureau of Statistics (PCBS) and Ministry of Agriculture
(MoA), (Nov. 2011).
56. Palestinian Water authority (2007). Guiding Information Towards Domestic
Groundwater Supply Management in the Gaza Strip Governorates-Palestine.
57. Palestinian Water Authority (2007). Rainfall Data in Gaza Strip. PWA, Ramallah,
PNA.
58. Palestinian Water Authority, (2000). Coastal Aquifer Management Program
(CAMP), Final Model Report , PWA, Palestine.
59. Palestinian Hydrology Group, PHG. (2002)
60. Palestinian Water Authority (PWA) (2000, 2003, 2004). PWA publications,
61. PWA (2003). Quantities of Water Supply in the West Bank Governorates
Directorate
62. Palestinian water Authority PWA, (2005). Agricultural and Municipal Water
Demand in Gaza Governorates for 2004. Strategic Planning Department ,Water
Resource and Planning Directorate, Gaza, Palestine.
63. Palestinian water Authority PWA (2007). Agricultural and municipal water
demand in Gaza for the year 2006, Gaza, September 2007.
64. Palestinian water Authority PWA, (2010). Municipal wells in the Gaza
Governorates Evaluation and Assessment, Water Resources and Planning
Department, Hydrology Section Gaza, Palestine.
65. Palestinian Water Authority (2011). Agricultural and Municipal Water Demand in
Gaza Governorates for 2011, Strategic Planning Directorate, September 2011.
References
80
66. Palestinian Water Authority final report (2011). The Gaza Emergency Technical
Assistance Programme (GETAP) on Water Supply to the Gaza Strip, Component
1 – The Comparative Study of Options for an Additional Supply of Water for the
Gaza Strip (CSO-G)
67. Palestinian Water Authority (2012). Salinity Management in Agriculture:
Problems, Palestinian Water Authority 2012, water supply report (2010), (march
2012)
68. Qahman, M. (2004). Aspects of Hydrogeology, Modeling, and Management of
Seawater Intrusion for Gaza Aquifer - Palestine. (PhD dissertation). University
Mohamed V –AgdalEcoleMohammadiaD'ingenieurs, Rabat, Maroc.
69. Shaheen, S. (2007). Nitrate pollution and groundwater modeling of Wastewater
Plant in Rafah area, Gaza Strip, Palestine. (Unpublished Master‘s
Thesis).UniversiteitGent VrijeUniversiteitBrusselVrijeUniversiteitBrussel ,
Belgium.
70. Sharma, S. (2008). Performance Indicators of Water Losses in Distribution
System.
71. Shomar, B. (2009). Politics and environment, Gaza Strip.
72. Shomar, B. (2010). Groundwater contaminations and health perspectives in
developing world case study: Gaza Strip.
73. Shomar B., Abu Fakher S. and A. Yahya (2010). Assessment of Groundwater
Quality in the Gaza Strip, Palestine Using GIS Mapping. Journal of Water
Resource and Protection, 2, 93-114.
74. Singh, N. (2000).Tapping Traditional Systems of Resource Management, Habitat
Debate, UNCHS, Vol.6, No.3.
75. Smit, J. (1996). Urban Agriculture - Food, Jobs and Sustainable Cities, UNDP
76. Sourani, A. (2005). Urban agriculture in the Gaza Strip report. Palestinian
77. Stockholm International Water Institute, SIWI, (2009). Background Report to
Seminar on Water and Energy Linkages in the Middle East Water, Authors:
Anders Jägerskog, Jakob Granit, Rebecca Löfgren and ElinWeyler from SIWI and
Andy Bullock, George de Gooijer and Stuart Pettigrew, consultants.
78. Thompson, J., Porras, I. T., Tumwine, J. K., Mujwahuzi, M. R., Katui-Katua, M.,
Johnstone, N. and Wood, L. (2001). Drawers of Water II. International Institute
for Environment and Development, London, UK.
79. Van Veenhuizen, R. Prain, G. and De Zeewu, H. (2001). Appropriate Methods:
Research, Planning, Implementation and Evaluation for Urban Agriculture. Urban
Agriculture Magazine. Vol. 1. No. 5.
80. World Bank (2009). Assessment of restrictions on Palestinian water sector
development- west bank and Gaza Strip.
References
81
81. Zhou, Y., and R. S. J. Tol (2005). Evaluating the Costs of Desalination and Water
Transport, Water Resources Res.
Electronic References:
1. http://www.ipcc.ch/publications_and_data/ar4/syr/en/mains1.html (18/03/2013)
2. http://www.fao.org/documents/show_cdr.asp?url_file=/docrep/004/y3557e/y3557e
00.htm. 3. http://ourwikiworld.blogspot.com/2010/07/amazing-facts-about-gaza-never-
known.html(15/12/2012)
4. http://www.wafainfo.ps/atemplate.aspx?id=3294(15/12/2012)
5. http://www.idsc.gov.ps/arabic/geography/Location.html (29/12/2012)
6. http://www.murafah.ps/ar/?op=article_com&view=article&id=1(29/12/2012) 7. Total http://www.pmd.ps/ar/ehsa2eatmna5eh.php (15/05/2013)

Annexes
82
Annexes
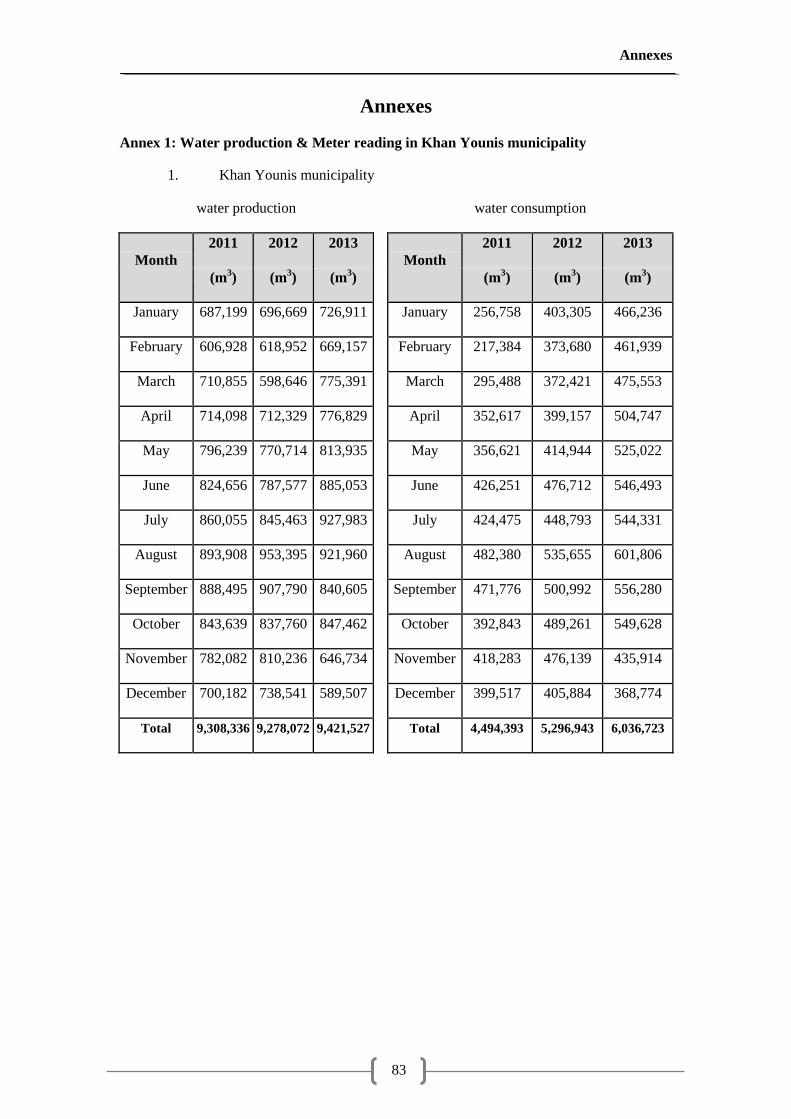
Annexes
83
Annexes
Annex 1: Water production & Meter reading in Khan Younis municipality
1. Khan Younis municipality
water production water consumption
Month
2011 2012 2013
Month
2011 2012 2013
(m3) (m
3) (m
3) (m
3) (m
3) (m
3)
January 687,199 696,669 726,911 January 256,758 403,305 466,236
February 606,928 618,952 669,157 February 217,384 373,680 461,939
March 710,855 598,646 775,391 March 295,488 372,421 475,553
April 714,098 712,329 776,829 April 352,617 399,157 504,747
May 796,239 770,714 813,935 May 356,621 414,944 525,022
June 824,656 787,577 885,053 June 426,251 476,712 546,493
July 860,055 845,463 927,983 July 424,475 448,793 544,331
August 893,908 953,395 921,960 August 482,380 535,655 601,806
September 888,495 907,790 840,605 September 471,776 500,992 556,280
October 843,639 837,760 847,462 October 392,843 489,261 549,628
November 782,082 810,236 646,734 November 418,283 476,139 435,914
December 700,182 738,541 589,507 December 399,517 405,884 368,774
Total 9,308,336 9,278,072 9,421,527 Total 4,494,393 5,296,943 6,036,723
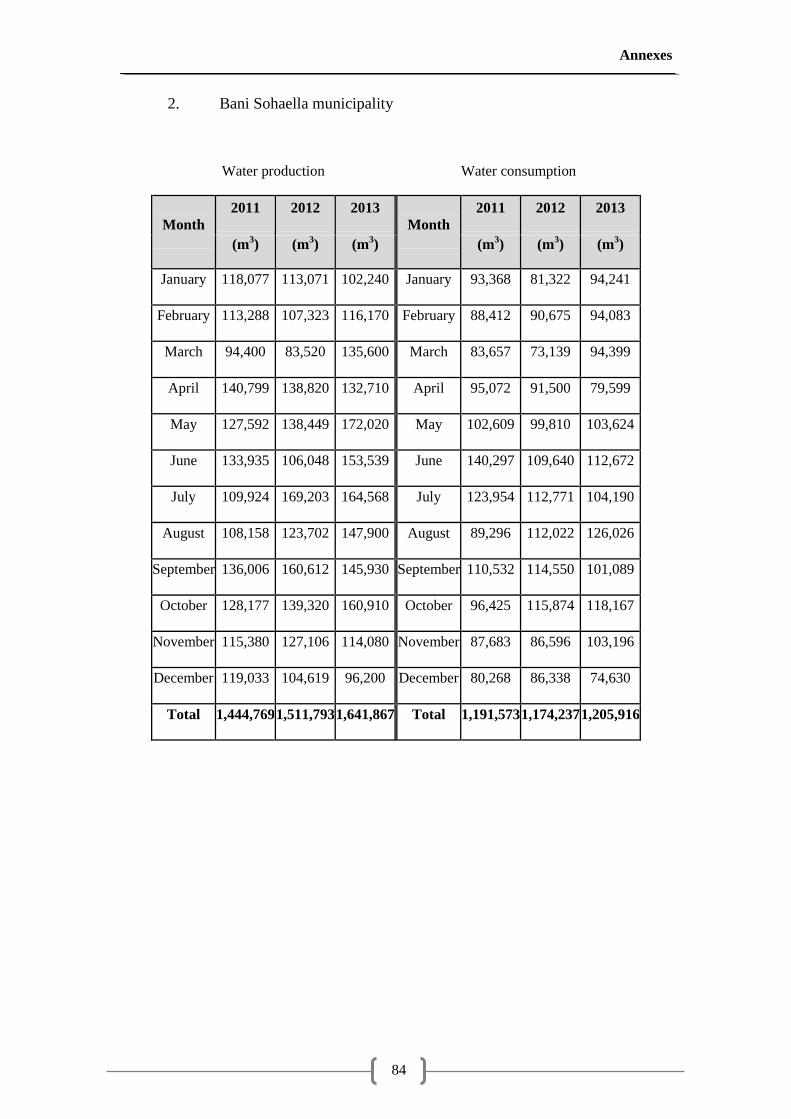
Annexes
84
2. Bani Sohaella municipality
Water production Water consumption
Month
2011 2012 2013
Month
2011 2012 2013
(m3) (m
3) (m
3) (m
3) (m
3) (m
3)
January 118,077 113,071 102,240 January 93,368 81,322 94,241
February 113,288 107,323 116,170 February 88,412 90,675 94,083
March 94,400 83,520 135,600 March 83,657 73,139 94,399
April 140,799 138,820 132,710 April 95,072 91,500 79,599
May 127,592 138,449 172,020 May 102,609 99,810 103,624
June 133,935 106,048 153,539 June 140,297 109,640 112,672
July 109,924 169,203 164,568 July 123,954 112,771 104,190
August 108,158 123,702 147,900 August 89,296 112,022 126,026
September 136,006 160,612 145,930 September 110,532 114,550 101,089
October 128,177 139,320 160,910 October 96,425 115,874 118,167
November 115,380 127,106 114,080 November 87,683 86,596 103,196
December 119,033 104,619 96,200 December 80,268 86,338 74,630
Total 1,444,769 1,511,793 1,641,867 Total 1,191,573 1,174,237 1,205,916
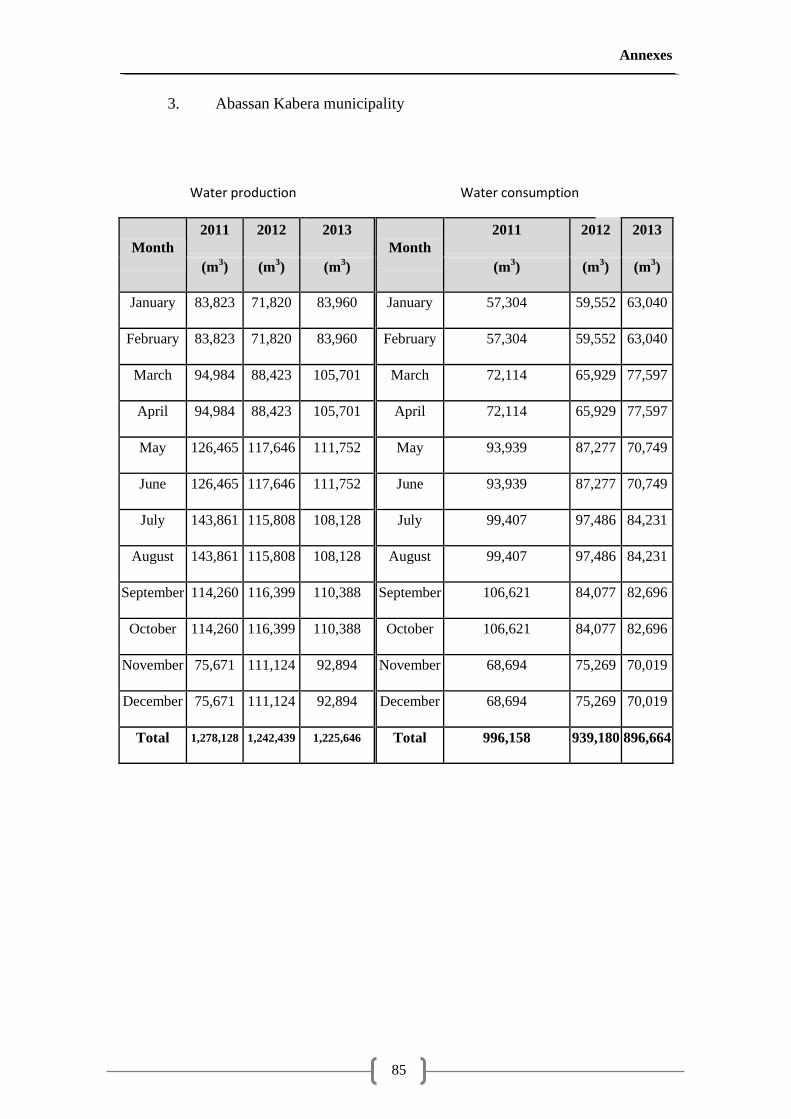
Annexes
85
3. Abassan Kabera municipality
Water production Water consumption
Month
2011 2012 2013 Month
2011 2012 2013
(m3) (m
3) (m
3) (m
3) (m
3) (m
3)
January 83,823 71,820 83,960 January 57,304 59,552 63,040
February 83,823 71,820 83,960 February 57,304 59,552 63,040
March 94,984 88,423 105,701 March 72,114 65,929 77,597
April 94,984 88,423 105,701 April 72,114 65,929 77,597
May 126,465 117,646 111,752 May 93,939 87,277 70,749
June 126,465 117,646 111,752 June 93,939 87,277 70,749
July 143,861 115,808 108,128 July 99,407 97,486 84,231
August 143,861 115,808 108,128 August 99,407 97,486 84,231
September 114,260 116,399 110,388 September 106,621 84,077 82,696
October 114,260 116,399 110,388 October 106,621 84,077 82,696
November 75,671 111,124 92,894 November 68,694 75,269 70,019
December 75,671 111,124 92,894 December 68,694 75,269 70,019
Total 1,278,128 1,242,439 1,225,646 Total 996,158 939,180 896,664

Annexes
86
4. Al-Qarara municipality
Water production Water consumption
Month
2011 2012 2013
Month
2011 2012 2013
(m3) (m
3) (m
3) (m
3) (m
3) (m
3)
January 76,925 77,405 91,900 January 46,962 49,255 52,490
February 74,342 76,500 87,510 February 46,377 47,698 64,886
March 74,896 78,707 126,580 March 56,447 53,122 76,651
April 68,875 100,343 131,810 April 64,877 62,177 79,856
May 81,592 81,790 131,414 May 63,534 58,998 80,000
June 83,665 95,000 142,540 June 68,583 60,558 73,044
July 92,969 120,000 142,490 July 67,055 70,089 79,537
August 92,690 84,870 139,140 August 66,735 65,446 81,652
September 47,380 126,000 105,089 September 55,093 64,000 89,535
October 89,311 126,700 118,710 October 60,545 62,342 73,169
November 72,511 93,310 106,160 November 45,200 54,823 61,216
December 80,240 93,440 83,890 December 49,372 54,360 55,560
Total 935,396 1,154,065 1,407,233 Total 690,780 702,868 867,596

Annexes
87
5. Khozaa municipality
Water production Water consumption
Month
2011 2012 2013
Month
2011 2012 2013
(m3) (m
3) (m
3) (m
3) (m
3) (m
3)
January 37,560 32,320 37,350 January 29,256 26,179 29,640
February 35,690 33,490 35,050 February 27,528 27,064 26,939
March 45,020 30,270 38,540 March 35,053 27,276 34,221
April 44,020 52,910 48,000 April 38,366 35,707 40,950
May 47,320 51,620 50,270 May 42,347 41,635 41,712
June 59,430 40,330 45,690 June 53,137 45,917 42,937
July 62,833 55,290 55,530 July 48,078 51,034 38,090
August 51,370 63,480 50,180 August 49,610 58,106 48,691
September 62,100 56,880 55,960 September 56,071 48,153 43,968
October 66,200 47,390 52,269 October 44,772 38,684 46,359
November 39,110 36,260 53,481 November 34,015 46,256 38,965
December 38,260 35,030 53,481 December 30,528 31,517 30,391
Total 588,913 535,270 575,801 Total 488,761 477,528 462,863
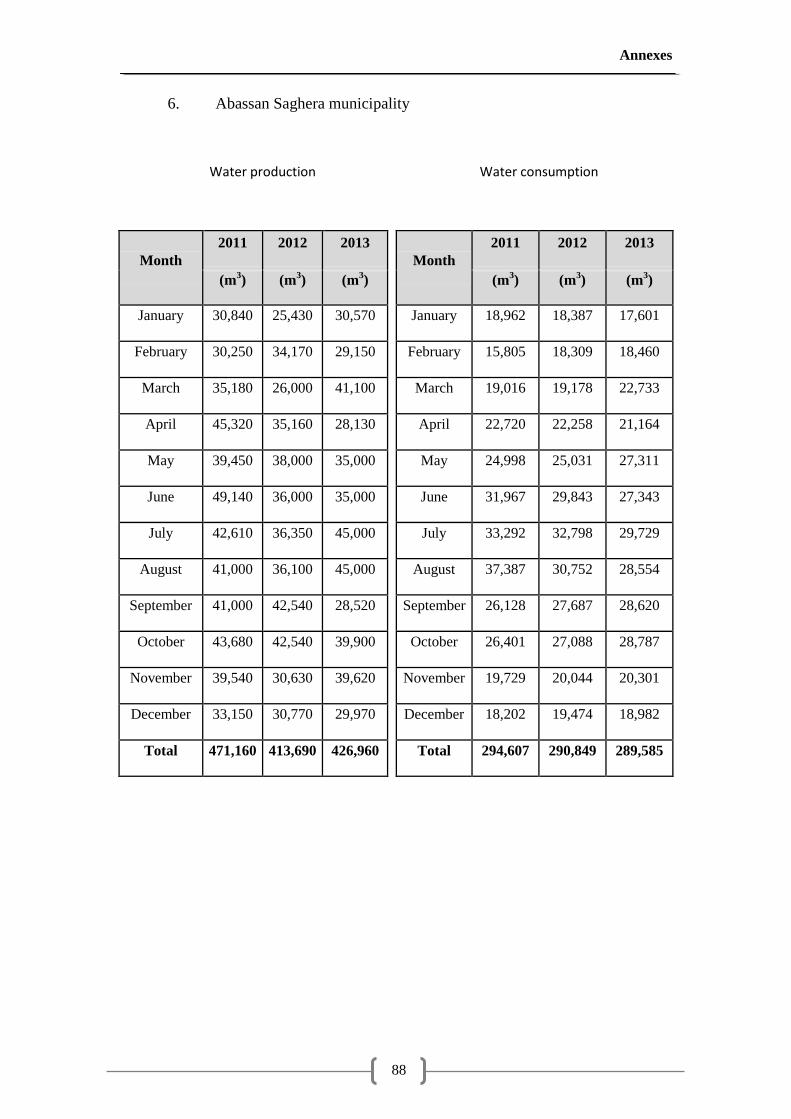
Annexes
88
6. Abassan Saghera municipality
Water production Water consumption
Month
2011 2012 2013 Month
2011 2012 2013
(m3) (m
3) (m
3) (m
3) (m
3) (m
3)
January 30,840 25,430 30,570 January 18,962 18,387 17,601
February 30,250 34,170 29,150 February 15,805 18,309 18,460
March 35,180 26,000 41,100 March 19,016 19,178 22,733
April 45,320 35,160 28,130 April 22,720 22,258 21,164
May 39,450 38,000 35,000 May 24,998 25,031 27,311
June 49,140 36,000 35,000 June 31,967 29,843 27,343
July 42,610 36,350 45,000 July 33,292 32,798 29,729
August 41,000 36,100 45,000 August 37,387 30,752 28,554
September 41,000 42,540 28,520 September 26,128 27,687 28,620
October 43,680 42,540 39,900 October 26,401 27,088 28,787
November 39,540 30,630 39,620 November 19,729 20,044 20,301
December 33,150 30,770 29,970 December 18,202 19,474 18,982
Total 471,160 413,690 426,960 Total 294,607 290,849 289,585
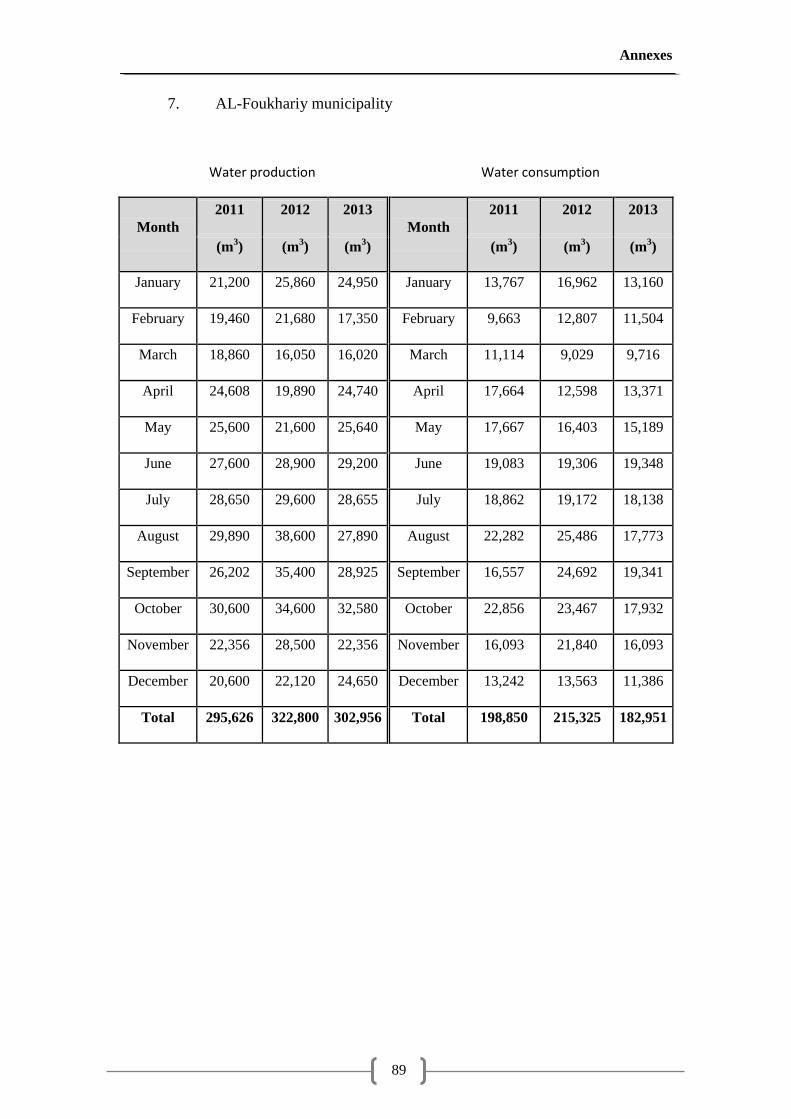
Annexes
89
7. AL-Foukhariy municipality
Water production Water consumption
Month
2011 2012 2013 Month
2011 2012 2013
(m3) (m
3) (m
3) (m
3) (m
3) (m
3)
January 21,200 25,860 24,950 January 13,767 16,962 13,160
February 19,460 21,680 17,350 February 9,663 12,807 11,504
March 18,860 16,050 16,020 March 11,114 9,029 9,716
April 24,608 19,890 24,740 April 17,664 12,598 13,371
May 25,600 21,600 25,640 May 17,667 16,403 15,189
June 27,600 28,900 29,200 June 19,083 19,306 19,348
July 28,650 29,600 28,655 July 18,862 19,172 18,138
August 29,890 38,600 27,890 August 22,282 25,486 17,773
September 26,202 35,400 28,925 September 16,557 24,692 19,341
October 30,600 34,600 32,580 October 22,856 23,467 17,932
November 22,356 28,500 22,356 November 16,093 21,840 16,093
December 20,600 22,120 24,650 December 13,242 13,563 11,386
Total 295,626 322,800 302,956 Total 198,850 215,325 182,951
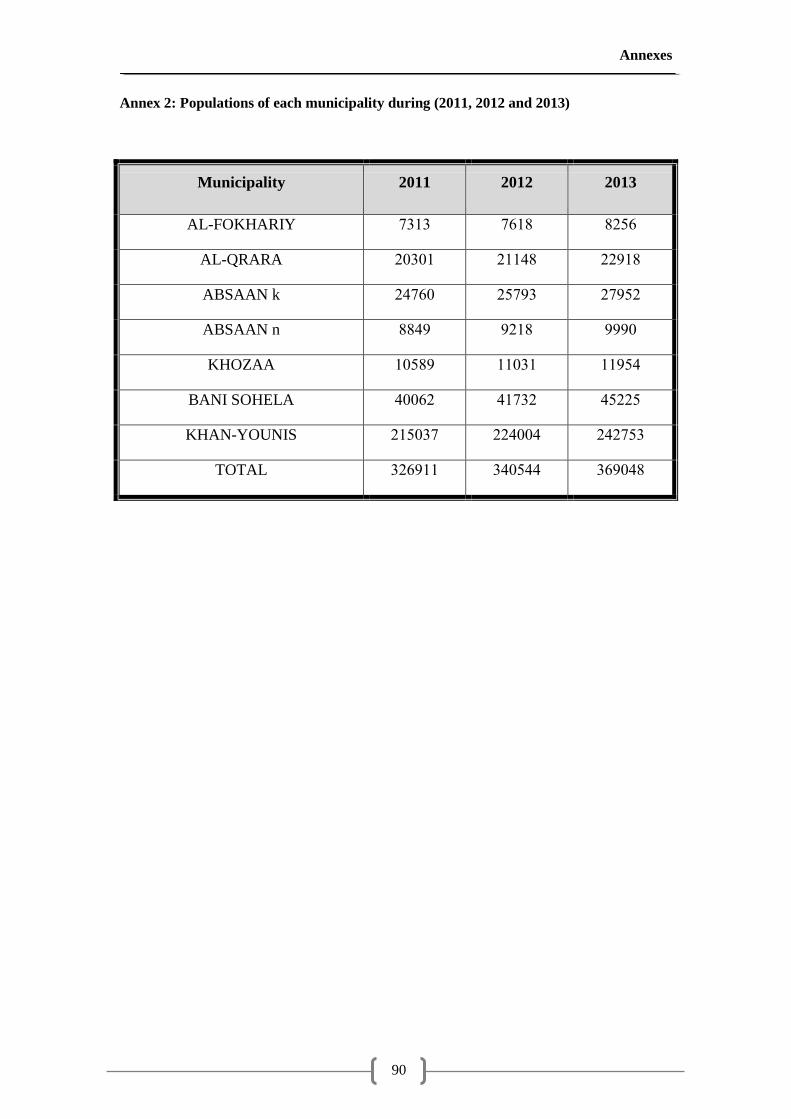
Annexes
90
Annex 2: Populations of each municipality during (2011, 2012 and 2013)
Municipality 2011 2012 2013
AL-FOKHARIY 7313 7618 8256
AL-QRARA 20301 21148 22918
ABSAAN k 24760 25793 27952
ABSAAN n 8849 9218 9990
KHOZAA 10589 11031 11954
BANI SOHELA 40062 41732 45225
KHAN-YOUNIS 215037 224004 242753
TOTAL 326911 340544 369048
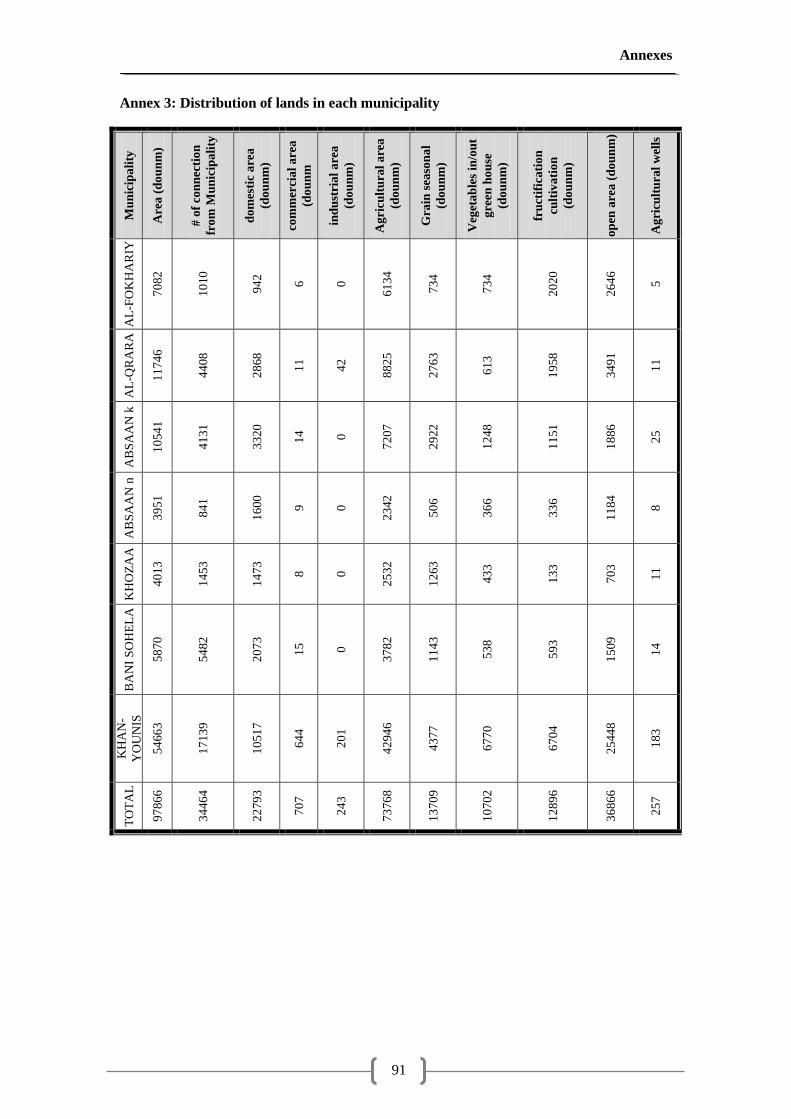
Annexes
91
Annex 3: Distribution of lands in each municipality
Mu
nic
ipa
lity
Are
a (
do
un
m)
# o
f co
nn
ecti
on
fro
m M
un
icip
ali
ty
do
mes
tic
are
a
(do
un
m)
com
mer
cia
l a
rea
(do
un
m
ind
ust
ria
l a
rea
(do
un
m)
Ag
ricu
ltu
ral
are
a
(do
un
m)
Gra
in s
easo
na
l
(do
un
m)
Veg
eta
ble
s in
/ou
t
gre
en h
ou
se
(do
un
m)
fru
ctif
ica
tio
n
cult
iva
tio
n
(do
un
m)
op
en a
rea
(d
ou
nm
)
Ag
ricu
ltu
ral
wel
ls
AL
-FO
KH
AR
IY
70
82
10
10
94
2
6
0
61
34
73
4
73
4
20
20
26
46
5
AL
-QR
AR
A
11
74
6
44
08
28
68
11
42
88
25
27
63
61
3
19
58
34
91
11
AB
SA
AN
k
10
54
1
41
31
33
20
14
0
72
07
29
22
12
48
11
51
18
86
25
AB
SA
AN
n
39
51
84
1
16
00
9
0
23
42
50
6
36
6
33
6
11
84
8
KH
OZ
AA
40
13
14
53
14
73
8
0
25
32
12
63
43
3
13
3
70
3
11
BA
NI
SO
HE
LA
58
70
54
82
20
73
15
0
37
82
11
43
53
8
59
3
15
09
14
KH
AN
-
YO
UN
IS
54
66
3
17
13
9
10
51
7
64
4
20
1
42
94
6
43
77
67
70
67
04
25
44
8
18
3
TO
TA
L
97
86
6
34
46
4
22
79
3
70
7
24
3
73
76
8
13
70
9
10
70
2
12
89
6
36
86
6
25
7
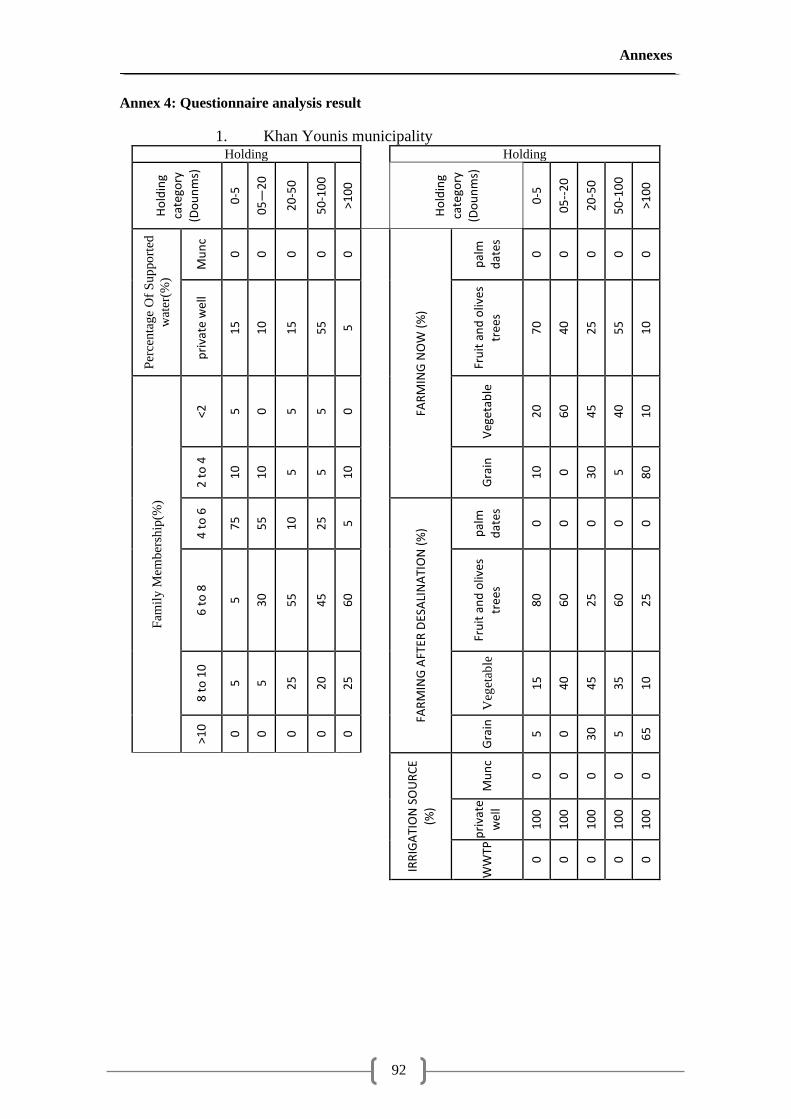
Annexes
92
Annex 4: Questionnaire analysis result
1. Khan Younis municipality Holding
Holding
Ho
ldin
g
cate
gory
(Do
un
ms)
0-5
05—
20
20
-50
50
-10
0
>10
0
Ho
ldin
g
cate
gory
(Do
un
ms)
0-5
05
--2
0
20
-50
50
-10
0
>10
0
Per
cen
tag
e O
f S
up
po
rted
wat
er(%
)
Mu
nc
0
0
0
0
0
FAR
MIN
G N
OW
(%
)
pal
m
dat
es
0
0
0
0
0
pri
vate
wel
l
15
10
15
55
5
Fru
it a
nd
oliv
es
tree
s
70
40
25
55
10
Fam
ily
Mem
ber
ship
(%)
<2
5
0
5
5
0
Veg
etab
le
20
60
45
40
10
2 t
o 4
10
10
5
5
10
Gra
in
10
0
30
5
80
4 t
o 6
75
55
10
25
5
FAR
MIN
G A
FTER
DES
ALI
NA
TIO
N (
%) pal
m
dat
es
0
0
0
0
0
6 t
o 8
5
30
55
45
60
Fru
it a
nd
oliv
es
tree
s
80
60
25
60
25
8 t
o 1
0
5
5
25
20
25
Veg
etab
le
15
40
45
35
10
>10
0
0
0
0
0
Gra
in
5
0
30
5
65
IRR
IGA
TIO
N S
OU
RC
E
(%)
Mu
nc
0
0
0
0
0
pri
vate
wel
l
10
0
10
0
10
0
10
0
10
0
WW
TP
0
0
0
0
0
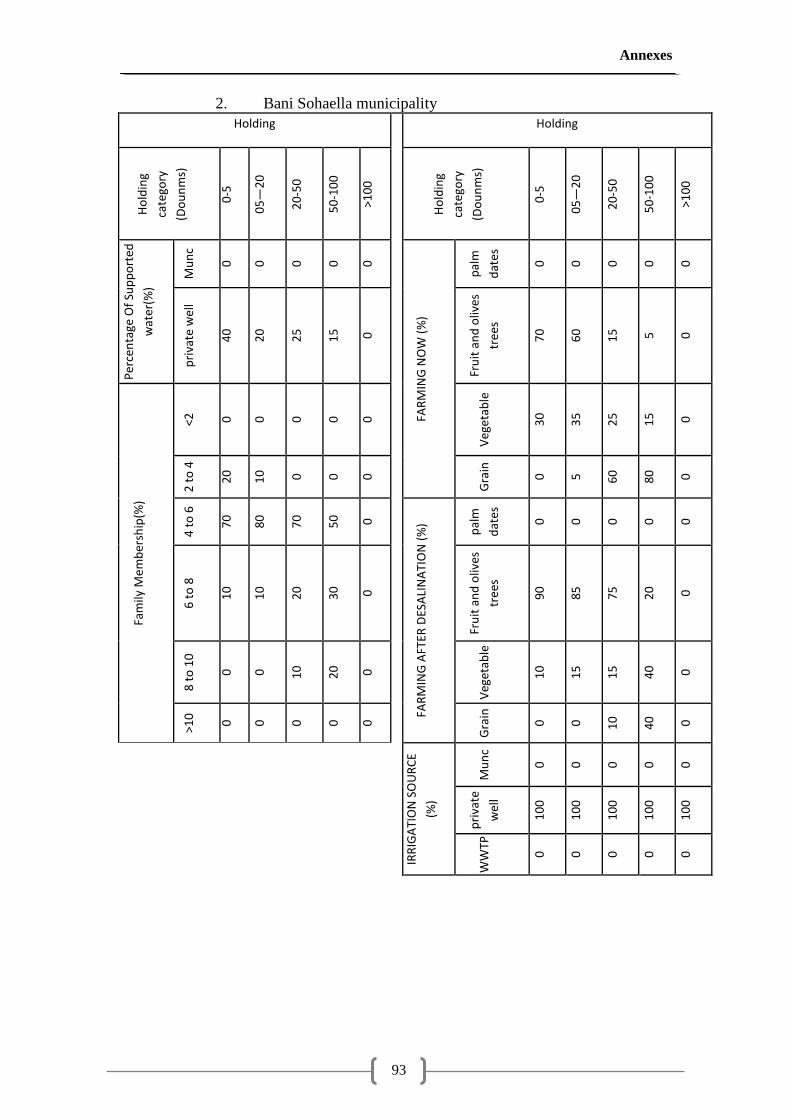
Annexes
93
2. Bani Sohaella municipality
Holding
Holding
Ho
ldin
g
cate
gory
(Do
un
ms)
0-5
05—
20
20
-50
50
-10
0
>10
0
Ho
ldin
g
cate
gory
(Do
un
ms)
0-5
05—
20
20
-50
50
-10
0
>10
0
Per
cen
tage
Of
Sup
po
rted
wat
er(%
)
Mu
nc
0
0
0
0
0
FAR
MIN
G N
OW
(%
)
pal
m
dat
es
0
0
0
0
0
pri
vate
wel
l
40
20
25
15
0
Fru
it a
nd
oliv
es
tree
s
70
60
15
5
0
Fam
ily M
em
ber
ship
(%)
<2
0
0
0
0
0
Veg
etab
le
30
35
25
15
0
2 t
o 4
20
10
0
0
0
Gra
in
0
5
60
80
0
4 t
o 6
70
80
70
50
0
FAR
MIN
G A
FTER
DES
ALI
NA
TIO
N (
%)
pal
m
dat
es
0
0
0
0
0
6 t
o 8
10
10
20
30
0
Fru
it a
nd
oliv
es
tree
s
90
85
75
20
0
8 t
o 1
0
0
0
10
20
0
Veg
etab
le
10
15
15
40
0
>10
0
0
0
0
0
Gra
in
0
0
10
40
0
IR
RIG
ATI
ON
SO
UR
CE
(%)
Mu
nc
0
0
0
0
0
pri
vate
wel
l
10
0
10
0
10
0
10
0
10
0
WW
TP
0
0
0
0
0
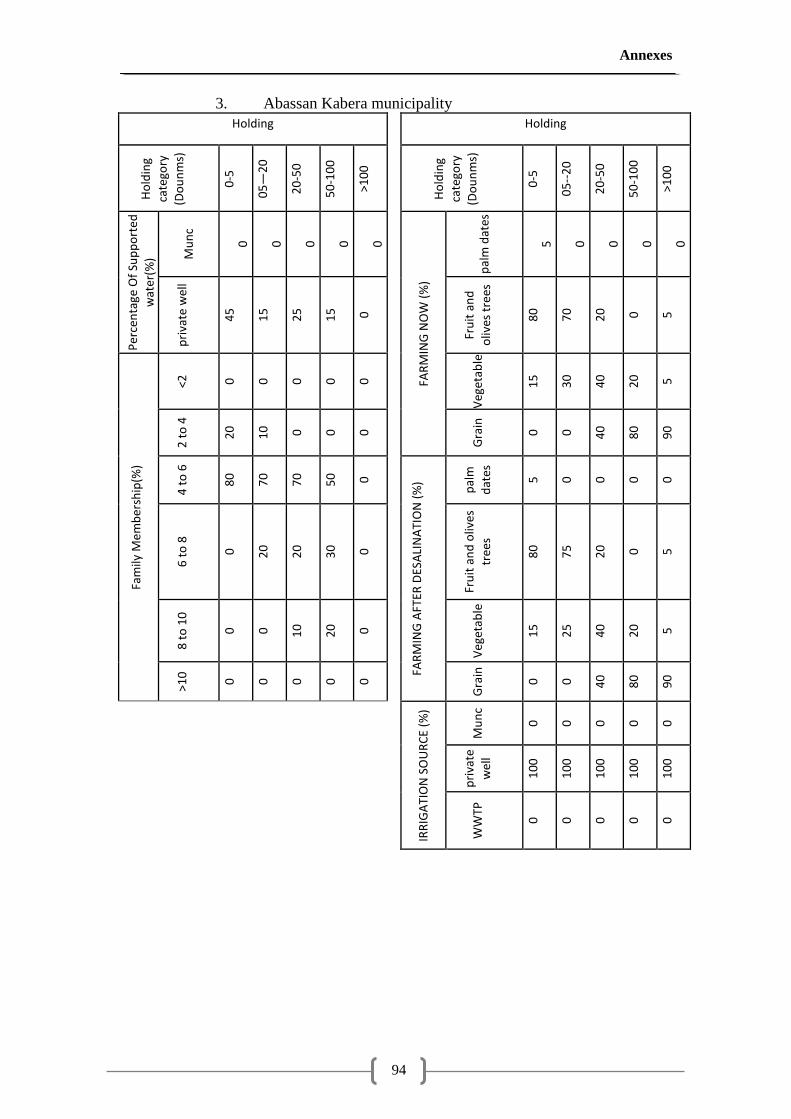
Annexes
94
3. Abassan Kabera municipality
Holding
Holding
Ho
ldin
g
cate
gory
(Do
un
ms)
0-5
05—
20
20
-50
50
-10
0
>10
0
Ho
ldin
g
cate
gory
(Do
un
ms)
0-5
05
--2
0
20
-50
50
-10
0
>10
0
Per
cen
tage
Of
Sup
po
rted
wat
er(%
) Mu
nc
0
0
0
0
0
FA
RM
ING
NO
W (
%)
pal
m d
ates
5
0
0
0
0
pri
vate
wel
l
45
15
25
15
0
Fru
it a
nd
oliv
es t
rees
80
70
20
0
5
Fam
ily M
em
ber
ship
(%)
<2
0
0
0
0
0
Veg
etab
le
15
30
40
20
5
2 t
o 4
20
10
0
0
0
Gra
in
0
0
40
80
90
4 t
o 6
80
70
70
50
0
FA
RM
ING
AFT
ER D
ESA
LIN
ATI
ON
(%
)
pal
m
dat
es
5
0
0
0
0
6 t
o 8
0
20
20
30
0
Fru
it a
nd
oliv
es
tree
s
80
75
20
0
5
8 t
o 1
0
0
0
10
20
0
Veg
etab
le
15
25
40
20
5
>10
0
0
0
0
0
Gra
in
0
0
40
80
90
IRR
IGA
TIO
N S
OU
RC
E (%
)
Mu
nc
0
0
0
0
0
p
riva
te
wel
l
10
0
10
0
10
0
10
0
10
0
WW
TP
0
0
0
0
0
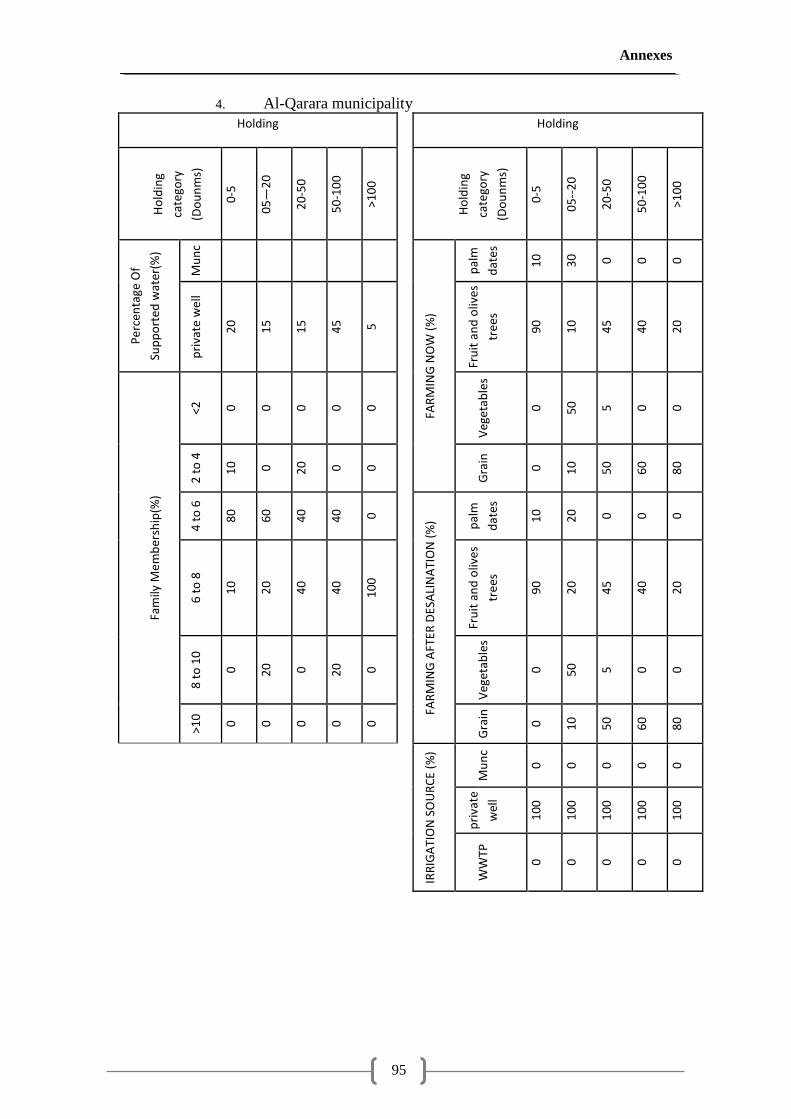
Annexes
95
4. Al-Qarara municipality
Holding
Holding
Ho
ldin
g
cate
gory
(Do
un
ms)
0-5
05—
20
20
-50
50
-10
0
>10
0
Ho
ldin
g
cate
gory
(Do
un
ms)
0-5
05
--2
0
20
-50
50
-10
0
>10
0
Per
cen
tage
Of
Sup
po
rted
wat
er(%
)
Mu
nc
FA
RM
ING
NO
W (
%)
pal
m
dat
es
10
30
0
0
0
pri
vate
wel
l
20
15
15
45
5
Fru
it a
nd
oliv
es
tree
s
90
10
45
40
20
Fam
ily M
em
ber
ship
(%)
<2
0
0
0
0
0
Veg
etab
les
0
50
5
0
0
2 t
o 4
10
0
20
0
0
Gra
in
0
10
50
60
80
4 t
o 6
80
60
40
40
0
FAR
MIN
G A
FTER
DES
ALI
NA
TIO
N (
%) pal
m
dat
es
10
20
0
0
0
6 t
o 8
10
20
40
40
10
0
Fru
it a
nd
oliv
es
tree
s
90
20
45
40
20
8 t
o 1
0
0
20
0
20
0
Veg
etab
les
0
50
5
0
0
>10
0
0
0
0
0
Gra
in
0
10
50
60
80
IR
RIG
ATI
ON
SO
UR
CE
(%)
Mu
nc
0
0
0
0
0
pri
vate
wel
l
10
0
10
0
10
0
10
0
10
0
WW
TP
0
0
0
0
0
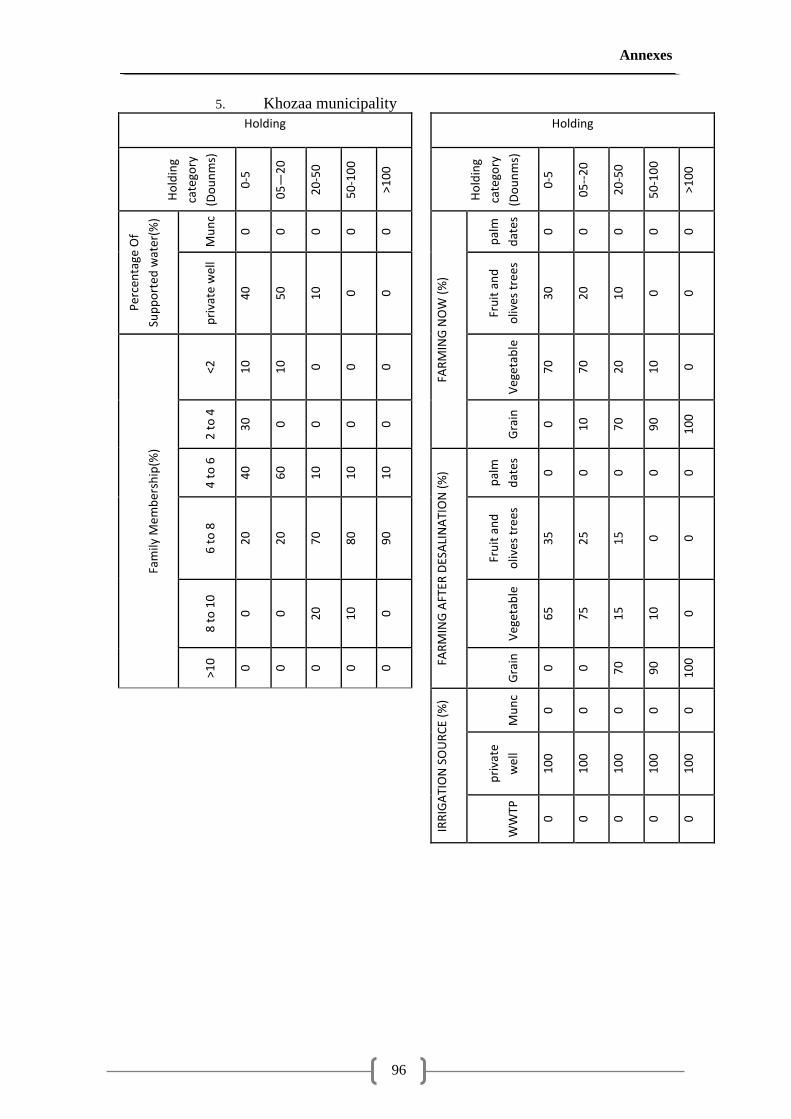
Annexes
96
5. Khozaa municipality
Holding
Holding
Ho
ldin
g
cate
gory
(Do
un
ms)
0-5
05—
20
20
-50
50
-10
0
>10
0
Ho
ldin
g
cate
gory
(Do
un
ms)
0-5
05
--2
0
20
-50
50
-10
0
>10
0
Per
cen
tage
Of
Sup
po
rted
wat
er(%
)
Mu
nc
0
0
0
0
0
FA
RM
ING
NO
W (
%)
pal
m
dat
es
0
0
0
0
0
pri
vate
wel
l
40
50
10
0
0
Fru
it a
nd
oliv
es t
rees
30
20
10
0
0
Fam
ily M
em
ber
ship
(%)
<2
10
10
0
0
0
Veg
etab
le
70
70
20
10
0
2 t
o 4
30
0
0
0
0
Gra
in
0
10
70
90
10
0
4 t
o 6
40
60
10
10
10
FA
RM
ING
AFT
ER D
ESA
LIN
ATI
ON
(%
)
pal
m
dat
es
0
0
0
0
0
6 t
o 8
20
20
70
80
90
Fru
it a
nd
oliv
es t
rees
35
25
15
0
0
8 t
o 1
0
0
0
20
10
0
Veg
etab
le
65
75
15
10
0
>10
0
0
0
0
0
Gra
in
0
0
70
90
10
0
IR
RIG
ATI
ON
SO
UR
CE
(%)
Mu
nc
0
0
0
0
0
pri
vate
wel
l
10
0
10
0
10
0
10
0
10
0
WW
TP
0
0
0
0
0
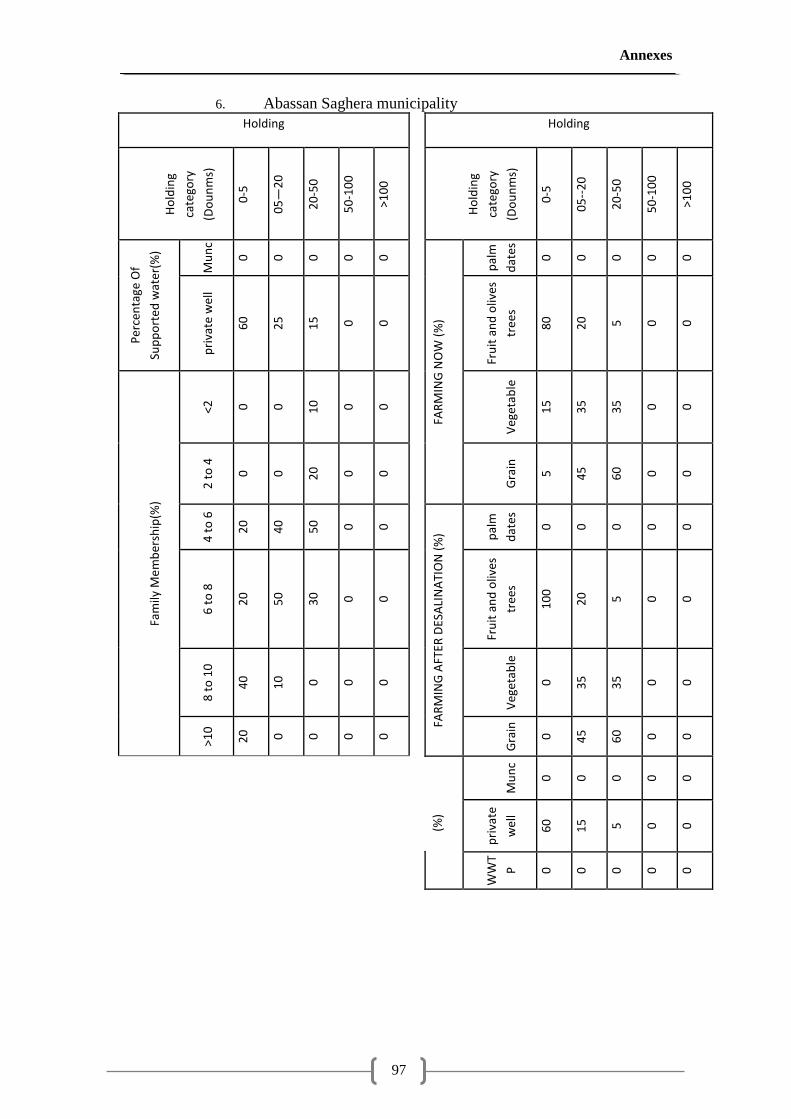
Annexes
97
6. Abassan Saghera municipality
Holding
Holding
Ho
ldin
g
cate
gory
(Do
un
ms)
0-5
05—
20
20
-50
50
-10
0
>10
0
Ho
ldin
g
cate
gory
(Do
un
ms)
0-5
05
--2
0
20
-50
50
-10
0
>10
0
Per
cen
tage
Of
Sup
po
rte
d w
ater
(%)
Mu
nc
0
0
0
0
0
FA
RM
ING
NO
W (
%)
pal
m
dat
es
0
0
0
0
0
pri
vate
wel
l
60
25
15
0
0
Fru
it a
nd
oliv
es
tree
s
80
20
5
0
0
Fam
ily M
em
ber
ship
(%)
<2
0
0
10
0
0
Veg
etab
le
15
35
35
0
0
2 t
o 4
0
0
20
0
0
Gra
in
5
45
60
0
0
4 t
o 6
20
40
50
0
0
FA
RM
ING
AFT
ER D
ESA
LIN
ATI
ON
(%
) pal
m
dat
es
0
0
0
0
0
6 t
o 8
20
50
30
0
0
Fru
it a
nd
oliv
es
tree
s
10
0
20
5
0
0
8 t
o 1
0
40
10
0
0
0
Veg
etab
le
0
35
35
0
0
>10
20
0
0
0
0
Gra
in
0
45
60
0
0
IRR
IGA
TIO
N S
OU
RC
E
(%)
Mu
nc
0
0
0
0
0
p
riva
te
wel
l
60
15
5
0
0
W
WT
P
0
0
0
0
0
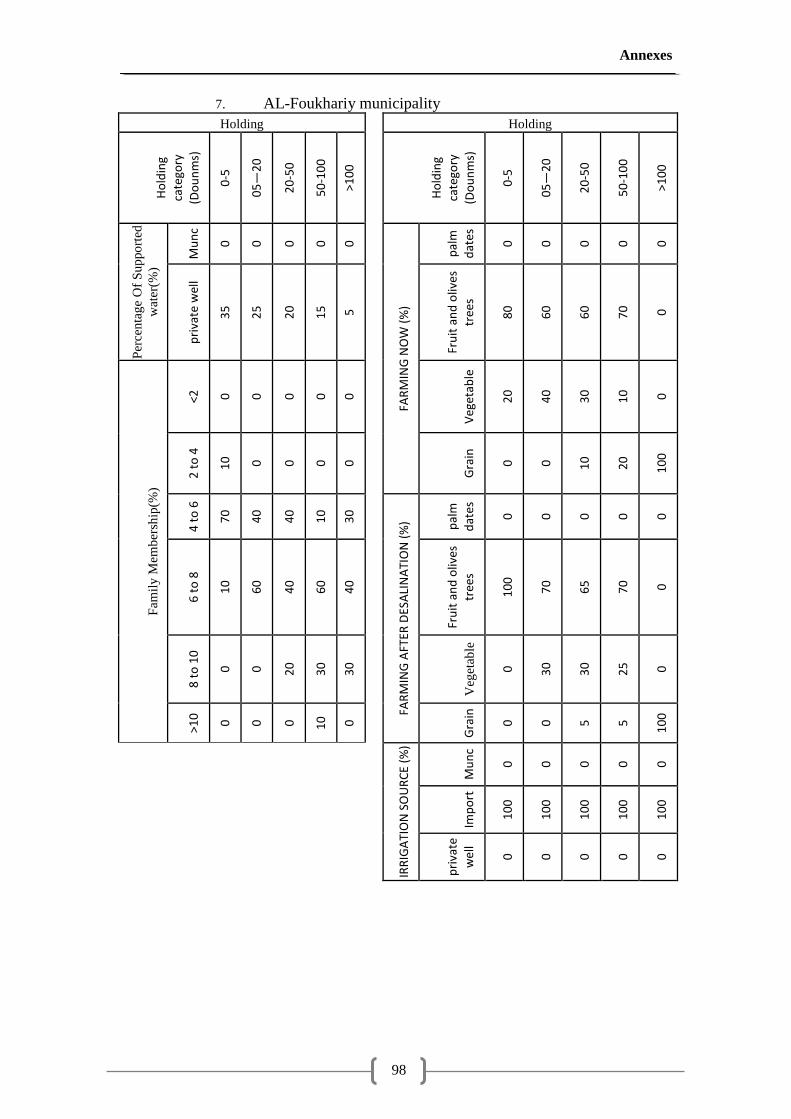
Annexes
98
7. AL-Foukhariy municipality
Holding
Holding
Ho
ldin
g
cate
gory
(Do
un
ms)
0-5
05—
20
20
-50
50
-10
0
>10
0
Ho
ldin
g
cate
gory
(Do
un
ms)
0-5
05—
20
20
-50
50
-10
0
>10
0
Per
cen
tag
e O
f S
up
po
rted
wat
er(%
)
Mu
nc
0
0
0
0
0
FAR
MIN
G N
OW
(%
)
pal
m
dat
es
0
0
0
0
0
pri
vate
wel
l
35
25
20
15
5
Fru
it a
nd
oliv
es
tree
s
80
60
60
70
0
Fam
ily
Mem
ber
ship
(%)
<2
0
0
0
0
0
Veg
etab
le
20
40
30
10
0
2 t
o 4
10
0
0
0
0
Gra
in
0
0
10
20
10
0
4 t
o 6
70
40
40
10
30
FAR
MIN
G A
FTER
DES
ALI
NA
TIO
N (
%) pal
m
dat
es
0
0
0
0
0
6 t
o 8
10
60
40
60
40
Fru
it a
nd
oliv
es
tree
s
10
0
70
65
70
0
8 t
o 1
0
0
0
20
30
30
Veg
etab
le
0
30
30
25
0
>10
0
0
0
10
0
Gra
in
0
0
5
5
10
0
IRR
IGA
TIO
N S
OU
RC
E (%
)
Mu
nc
0
0
0
0
0
Imp
ort
10
0
10
0
10
0
10
0
10
0
pri
vate
wel
l
0
0
0
0
0
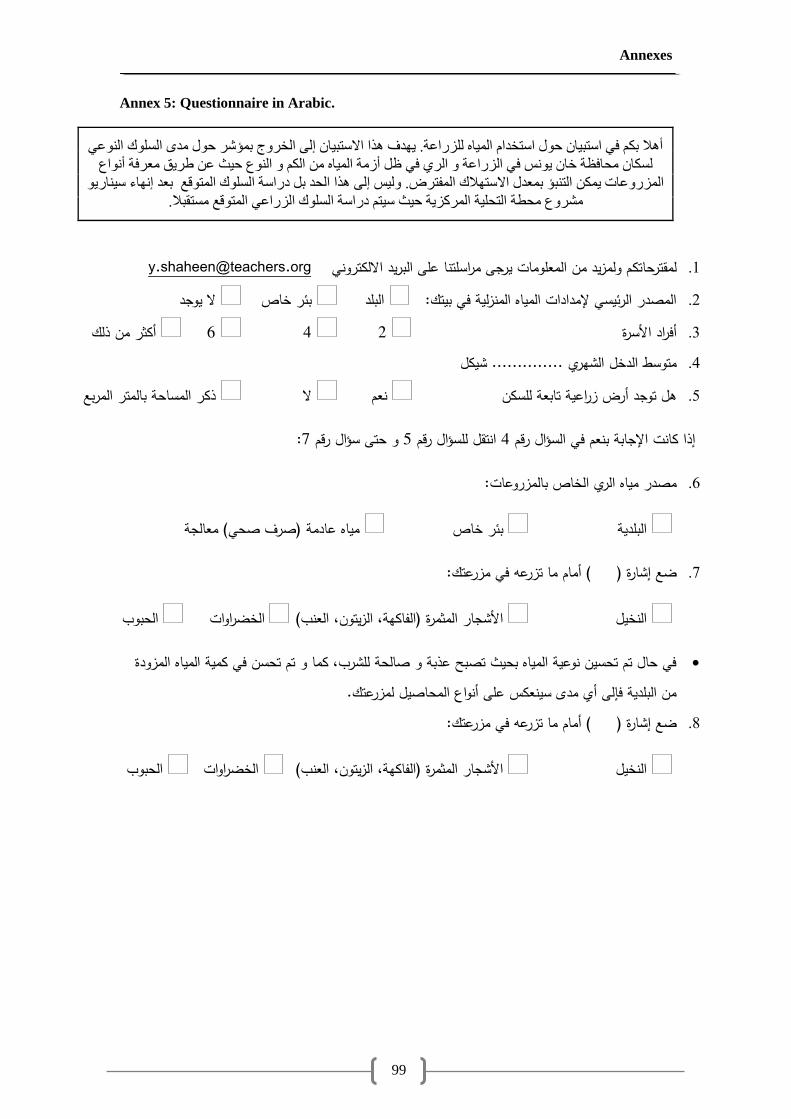
Annexes
99
Annex 5: Questionnaire in Arabic.
أال ثن ف اسزجب زه اسزخذا اىب ىيضساػخ. ذف زا االسزجب إى اىخشج ثؤشش زه ذ اىسيك اىػ
ظو أصخ اىب اىن اىع زث ػ طشق ؼشفخ أاع ىسنب سبفظخ خب س ف اىضساػخ اىش ف
اىضسػبد ن اىزجؤ ثؼذه االسزالك اىفزشض. ىس إى زا اىسذ ثو دساسخ اىسيك اىزقغ ثؼذ إبء سبس
ششع سطخ اىزسيخ اىشمضخ زث سز دساسخ اىسيك اىضساػ اىزقغ سزقجال.
[email protected]م ولمزيد من المعمومات يرجى مراسمتنا عمى البريد االلكتروني لمقترحاتك .1 ال يوجد بئر خاص البمد :المصدر الرئيسي إلمدادات المياه المنزلية في بيتك .2 أكثر من ذلك 6 4 2 أفراد األسرة .3 .............. شيكل متوسط الدخل الشيري .4 ذكر المساحة بالمتر المربع ال نعم ىل توجد أرض زراعية تابعة لمسكن .5
:7و حتى سؤال رقم 5انتقل لمسؤال رقم 4إذا كانت اإلجابة بنعم في السؤال رقم
:مصدر مياه الري الخاص بالمزروعات .6
)صرف صحي( معالجة مياه عادمة بئر خاص البمدية
:( أمام ما تزرعو في مزرعتك ضع إشارة ) .7
الحبوب الخضراوات العنب( الزيتون، )الفاكية، األشجار المثمرة النخيل
في حال تم تحسين نوعية المياه بحيث تصبح عذبة و صالحة لمشرب، كما و تم تحسن في كمية المياه المزودة .من البمدية فإلى أي مدى سينعكس عمى أنواع المحاصيل لمزرعتك
:( أمام ما تزرعو في مزرعتك ضع إشارة ) .8
الحبوب الخضراوات العنب( الزيتون، )الفاكية، األشجار المثمرة النخيل
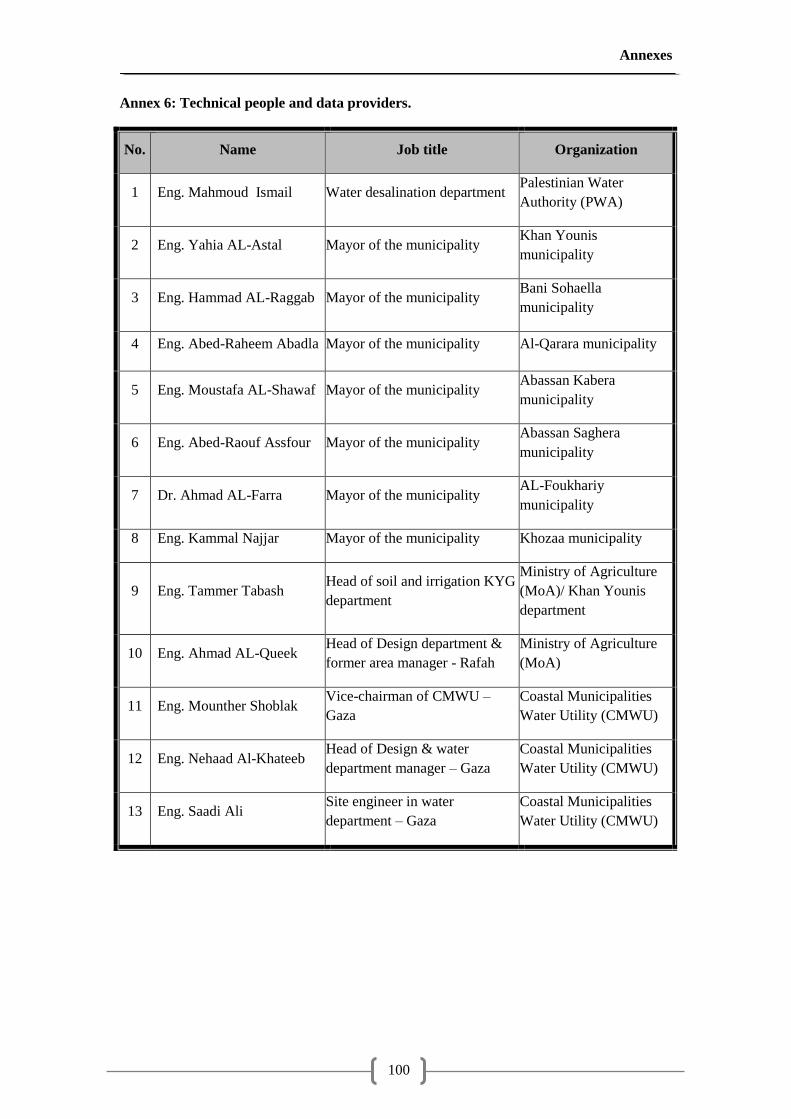
Annexes
100
Annex 6: Technical people and data providers.
No. Name Job title Organization
1 Eng. Mahmoud Ismail Water desalination department Palestinian Water
Authority (PWA)
2 Eng. Yahia AL-Astal Mayor of the municipality Khan Younis
municipality
3 Eng. Hammad AL-Raggab Mayor of the municipality Bani Sohaella
municipality
4 Eng. Abed-Raheem Abadla Mayor of the municipality Al-Qarara municipality
5 Eng. Moustafa AL-Shawaf Mayor of the municipality Abassan Kabera
municipality
6 Eng. Abed-Raouf Assfour Mayor of the municipality Abassan Saghera
municipality
7 Dr. Ahmad AL-Farra Mayor of the municipality AL-Foukhariy
municipality
8 Eng. Kammal Najjar Mayor of the municipality Khozaa municipality
9 Eng. Tammer Tabash Head of soil and irrigation KYG
department
Ministry of Agriculture
(MoA)/ Khan Younis
department
10 Eng. Ahmad AL-Queek Head of Design department &
former area manager - Rafah
Ministry of Agriculture
(MoA)
11 Eng. Mounther Shoblak Vice-chairman of CMWU –
Gaza
Coastal Municipalities
Water Utility (CMWU)
12 Eng. Nehaad Al-Khateeb Head of Design & water
department manager – Gaza
Coastal Municipalities
Water Utility (CMWU)
13 Eng. Saadi Ali Site engineer in water
department – Gaza
Coastal Municipalities
Water Utility (CMWU)


