ISED Methodology Sheets - International Centre for...
87
united nations educational, scientific the s international centre for theoretical physics international atomic energy agency SMR 1406/3 WORKSHOP ON INDICATORS FOR SUSTAINABLE ENERGY DEVELOPMENT 13 -17 May 2002 ISED Methodology Sheets These are preliminary lecture notes, intended only for distribution to participants. strada costiera, I I - 34014 trieste italy - tel. +39 040 2240 III fax +39 040 224163 - [email protected] . www.ictp.trieste.it
-
Upload
nguyendiep -
Category
Documents
-
view
213 -
download
0
Transcript of ISED Methodology Sheets - International Centre for...
united nationseducational, scientific
thesinternational centre for theoretical physics
international atomicenergy agency
SMR 1406/3
WORKSHOP ONINDICATORS FOR SUSTAINABLE ENERGY DEVELOPMENT
13 -17 May 2002
ISEDMethodology Sheets
These are preliminary lecture notes, intended only for distribution to participants.
strada costiera, I I - 3 4 0 1 4 tr ieste italy - tel . +39 040 2 2 4 0 I I I fax + 3 9 040 224163 - [email protected] . www.ictp.tr ieste.it

Indicators for Sustainable Energy Development
ISEDMethodology Sheets
May 2002


POPULATION: TOTAL AND PERCENTAGE IN URBAN AREASDimension
Economic
Agenda 21
Chapter 5. Demographic dynamics and
sustainability;Chapter 7. Promoting sustainable human
settlement development: Promotingsustainable energy and transport systems in
human settlements
Placement in the CSD Theme/Sub-theme
Social/Population/Populationchange/ Population growth andPopulation of Urban Formal andInformal Settlements
1. INDICATOR (#1)
(a) Name: Population: total and percentage in urban areas.
(b) Brief Definition: The whole number of people or inhabitants in a country or region; and theratio of population living in defined urban areas to total country population.
(c) Unit of Measurement: million for total population and % for its percentage in urban areas.
(d) Correspondence with other ISD:
OECD
TSD El: Population growth
EU/EUROSTAT
MPTMSE: Populationgrowth rate (SOC20)
UN-DSD/DESA Provisionallist for Chapter 4
None
2. POLICY RELEVANCE:
(a) Purpose: The indicator is a basic socio-economic indicator and measures the size ofpopulation in a country or region. Knowing the size of a country's population, its changing rate,and share of urban population is important for evaluating the welfare of the country's citizens,assessing the productive capacity of its economy, and estimating the quantity of goods andservices produced per each inhabitant. Thus governments, businesses, and anyone interested inanalyzing economic performance must have accurate population estimates; and in particular itsshare in urban area, which measures the size of formal and informal urban settlements by theirpopulation.
(b) Relevance to Sustainable/Unsustainable Development: Change in population size definesthe population growth, which according to Agenda 21 is identified as one of the critical elementsaffecting long-term sustainability. Total population, at both national and sub-national levels,represents a fundamental indicator for national decision makers.
Agenda 21 calls as well for a balance between urban and rural development patterns. Urbanareas have distinctive characteristics reflecting the social fabric and density of their population,and the nature and scale of economic activities. Urbanization has profound socioeconomicimplications that extend beyond the urban boundaries. It affects environmental anddevelopmental problems such as housing shortages, traffic congestion, air and water pollution,and waste. Urban areas promise economic efficiency and potential for development derivingfrom concentration of population, business and industries.
(c) International Conventions and Agreements: None.
(d) Linkages to other indicators: There are close linkages between the total population andother demographic and social indicators (for example Population growth rate), as well as all
ISED Methodology Sheets Population: total and percentage in urban areasPage 1 of4
indicators expressed in per capita terms (for example, GDP per capita, energy consumption percapita).
As far as the percentage of population in urban areas is concerned it is linked to some of witheconomic and social indicators such as shares of sectors in value added, distance traveled percapita, fractions of households heavily dependent on non-conventional energy and withoutelectricity. Urbanization is also linked to some environmental indicators, ambient concentrationof pollutants in urban areas are of particular relevance to urban settings.
(e) International Targets/Recommended Standards: No international targets have beenestablished for this indicator.
3. METHODOLOGICAL DESCRIPTION
(a) Underlying Definitions and Concepts: Total population of an economy may compriseeither all usual residents (de jure population) or all persons present in the country (de factopopulation) at the time of the census regardless of legal status or citizenship— except forrefugees not permanently settled in the country of asylum, who are generally considered part ofthe population of their country of origin. Some particular groups, such as the armed forces orother populations living in institutions, nomadic people, etc. may be excluded. For purposes ofinternational comparisons, the de facto definition is recommended.
By definition, the percentage of population in urban areas is calculated as the population ofurban areas divided by total population of a country or area. The demarcation of urban areas isusually defined by countries as part of census procedures, and is usually based on the size oflocalities, classification of areas as administrative centers, or classification of areas according tospecial criteria such as population density or type of economic activity of residents
(b) Measurement Methods: Population estimates are usually based on national populationcensuses, but the frequency and quality of these vary by country. Most countries conduct acomplete enumeration no more than once a decade. Pre-census and post-census estimates areinterpolations or extrapolations based on demographic models. Errors and undercounting occureven in high-income countries; in developing countries such errors may be substantial because oflimits on the transport, communications, and other resources required to conduct a full census.
The number of inhabitants in formal and informal settlements is generally measured in censuses.Informal settlements do not cover dwelling units which have been regularized, that is those unitsfor which land titles, leases or occupancy permits have been granted. They should only includethose units which presently occupy land illegally and/ or housing units which are not incompliance with current regulation.
(c) The Indicator in the DSR Framework: It is assigned as Indirect Driving Force ofEconomic dimension, but it also could serve as a demographic State indicator of SocialDimension.
(d) Limitations of the Indicator: More-over, the international comparability of populationindicators is limited by differences in the concepts, definitions, data collection procedures, andestimation methods used by national statistical agencies and other organizations that collectpopulation data. The correctness of a census, along with the availability of complementary datafrom surveys or registration systems, is one of many objective ways to judge the quality ofdemographic data. In some European countries registration systems offer complete informationon population in the absence of a census. Current population estimates for developing countries
ISED Methodology Sheets Population: total and percentage in urban areasPage 2 of4

that lack recent census-based data, and pre- and post-census estimates for countries with censusdata, are provided by national statistical offices, the United Nations Population Division, or otheragencies. The standard estimation method requires fertility, mortality, and net migration data,which are often collected from sample surveys, some of which may be small or limited incoverage. These estimates are the product of demographic modeling and so are also susceptibleto biases and errors because of shortcomings of the model as well as the data. The quality andreliability of official demographic data are also affected by the public trust in the government,the government's commitment to full and accurate enumeration, the confidentiality andprotection against misuse accorded to census data, and the independence of census agencies fromundue political influence.
(e) Status of the Methodology: Under development.
(f) Alternative Definitions/Indicators: A variation of the indicator could be the annual growthof total population, which is derived by computing the annual or period growth rate ofpopulation.
4. ASSESSMENT OF DATA
(a) Data Needed to Compile the Indicator: Data from census data and calculation fromregistration data (births, deaths and migrants). The United Nations recommends that countriestake censuses every 10 years. In recent decades most countries have carried out censuses and iswidely available. For example, 204 countries or areas carried out a census during the 1990census decade (1985 to 1994). Data on births, deaths and migrants may come from nationalregistration systems or from special questions in demographic surveys and censuses.
(b) National and International Data Availability: National and sub-national census data, aswell as data on births, deaths and migrants, are available for the large majority of countries fromnational sources and publications; as well as from special country questionnaires sent to nationalstatistical offices from the Statistical Division, UN Department of Economics and SocialInformation and Policy Analysis (DESIPA). For all countries, census and registration data areevaluated and, if necessary, adjusted for incompleteness by the Population Division, DESIPA aspart of its preparations of the official United Nations population estimates and projections.
(c) Data Reference: Past, current and projected total population numbers rates are prepared forall countries by the Population Division, DESIPA and appear in the United Nations publication,World Population Prospects: The 1998 Revision (see item 6, below).
The World Bank's population estimates are produced by its Human Development Network andDevelopment Data Group in consultation with its operational staff and resident missions.Important inputs to the World Bank's demographic work come from the following sources:census reports and other statistical publications from country statistical offices; demographic andhealth surveys conducted by national agencies, Macro International, and the U.S. Centers forDisease Control and Prevention; United Nations Statistics Division, Population and VitalStatistics Report (quarterly); United Nations Population Division, World Population Prospects:The 1998 Revision; Eurostat, Demographic Statistics (various years); South Pacific Commission,Pacific Island Populations Data Sheet 1999; and U.S. Bureau of the Census, InternationalDatabase.
ISED Methodology Sheets Population: total and percentage in urban areasPage 3 of4

5. AGENCIES INVOLVED IN THE DEVELOPMENT OF THE INDICATOR
(a) Lead Agency: The lead organization are (1) The United Nations Department for Economicand Social Information and Policy Analysis (DESIPA). The contact point is the Director,Population Division, DESIPA; fax no. (1 211) 963 2147; and (2) The United Nation Centre forHuman Settlements (Habitat). The contact point is the Head, Urban Secretariat, UNCHS(Habitat); fax no. (254 2) 623080.
(b) Other Contributing Organizations: World Bank
6. REFERENCES
(a) Readings:
DESIPA. (1993), Demographic Yearbook. Statistical Division. United Nations SalesNo.E/F.95.XIII
DESIRA. World Population Prospects: The 1994 Revision. United Nations publication Sales NoE.95.XIII.16, New York, 1995
DESIPA (2000), World Population Prospects. The 2000 Revision (United Nations publication,forthcoming)
DESIPA (1995), World Urbanization Prospects: The 1994 Revision. Population Division. UnitedNations Sales No. E.95.XIII.12. New York,.
World Bank, (1993), Housing: Enabling Markets to Work. A World Bank Policy Paper.The World Bank, Washington D. C.
UNCHS (Habitat) and The World Bank (1993), The Housing Indicators Programme. Report ofthe Executive Director (Volume I). UNCHS, Nairobi.
UNCHS (1995), Habitat Monitoring the Shelter Sector. Housing Indicators Review. UNCHS,Nairobi.
(b) Internet site:UN: http://www.un.org/Depts/unsd/index.htm;
http://www.un.org/esa/population
http ://www.un. org/Depts/unsd/social/hum- set.htm
UNCHS (Habitat)home page: http:// www. urbanobservatory.org/indicators/ database;
ISED Methodology Sheets Population: total and percentage in urban areasPage 4 of4

GDP PER CAPITADimension
EconomicAgenda 21
Chapter 2: International cooperationto accelerate sustainable developmentin developing countries and relateddomestic policies
Placement in the CSD Theme/Sub-theme list
Economic Structure/ EconomicPerformance: GDP per capita
1. INDICATOR (#2)
(a) Name: Gross domestic product (GDP) per capita.
(b) Brief Definition: Levels of GDP per capita are obtained by dividing annual or period GDPboth at current market prices and/or prices based on purchasing power parity by population. Avariation of the indicator could be the growth of real GDP per capita which is derived bycomputing the annual or period growth rate of GDP in constant basic producers' or purchasers'prices divided by corresponding population.
(c) Unit of Measurement: $US of the base 1990 year per capita.
(d) Correspondence with other ISD:
OECD
TSD El: GDP, in total and per capita
EU/EUROSTAT
MPTMSE: Per capita GDP (ECON1)
UN-DSD/DESA Provisionallist for Chapter 4
None
2. POLICY RELEVANCE
(a) Purpose: The indicator is a basic economic growth indicator and measures the level andextent of total economic output. It reflects changes in total production of goods and services.
(b) Relevance to Sustainable/Unsustainable Development: Growth in the production of goodsand services is a basic determinant of how the economy fares. By allocating total production toeach unit of population, the extent to which the rate of individual output contributes to thedevelopment process can be measured. It indicates the pace of per capita income growth and alsothe rate that resources are used up. As a single composite indicator of economic growth, it is amost powerful summary indicator of the economic state of development in its many aspects andthe economic wellbeing of their residents. It does not directly measure sustainable developmentbut it is a very important measure for the economic and developmental aspects of sustainabledevelopment, including people's consumption patterns and the use of renewable resources.
(c) International Conventions and Agreements: The 1993 System of National Accounts(SNA) provides international standards for national accounts.
(d) International Targets/Recommended Standards: National targets are generally orientedtowards priorities, availability of resources and, in large measure, to historical economicperformance. International targets are most often established by financial institutions andinternational organizations only for the purposes of inter-country comparison of economicperformance in determining the direction of aid distribution or resource allocation projects.Country groupings to form economic entities, for example, the European Community,Organization of Petroleum Exporting Countries (OPEC), and the Benelux countries, also setinternational targets among constituent members to serve as guidelines in national policy prioritysetting. Moreover, the United Nations uses average world per capita income as a threshold in
ISED Methodology Sheets GDP per capitaPage 1 of4

setting the level of relief allowance for countries with large population in its formulation of thescale of assessments of member states.
(e) Linkages to Other Indicators: As a highly aggregated composite measure, this indicator hasclose links with many, more disaggregated indicators. Examples would include population growth,other GDP indicators, shares of sectors in GDP value added
3. METHODOLOGICAL DESCRIPTION
(a) Underlying Definitions and Concepts: GDP as defined in the 1993 SNA can be defined inthree ways: Firstly, it is the sum total value- added of all production units including all taxes andsubsidies on products which are not included in the valuation of output. It is also equal to thesum of final uses of goods and services (except intermediate consumption) measured inpurchasers' prices, less the value of imports of goods and services. Finally, it can be measured asthe sum of primary incomes distributed by resident producer units. Gross domestic product iscalculated without making deductions for depreciation of fabricated assets or for depletion anddegradation of natural resources.
(b) Measurement Methods: The current price estimates of GDP (Nominal GDP) are adjusted toGDP at constant prices in base year (Real GDP) with the use of price deflators. The 1990 ischosen as a base year. Population estimates enable the conversion of total GDP to per capitalevels, while exchange rates and other conversion factors are used to arrive at values based on acommon unit of currency. Real GDP is derived by extrapolating total value- added in the baseyear with production indicators in physical terms or by deflating current price values by a pricedeflator.
(c) The Indicator in the DSR Framework: GDP per capita deals with the processes andpatterns of economic forces. As such, it is recognized as a composite Indirect Driving Forceindicator of Economic dimension. However, it can also be regarded as a measure of the State of acountry's economy in relation to population.
(d) Limitations of the Indicator: As a necessary condition to being a key economicperformance indicator of sustainable development, one of the often-cited limitations of GDP isthat it does not account for the social and environmental costs of production; it therefore is not agood measure of the level of over-all well being. For example, GDP per capital reveals nothingconcerning energy and material interactions with the environment. GDP is also not considered agood measure of sustainable consumption because it does not allow for the capital used up in theproduction process. There may exist some differences in national accounting and demographicreporting procedures and practices between countries. One other possible drawback could lie inthe comparability of price information used in deflating current price data and technicaldifferences in the choice of base year for the original data. Additionally, a considered basiclimitation lies in the conversion of GDP into a common denomination as a result of currentmisalignments in exchange rates for some countries vis-a-vis the comparator currency (USdollar) particularly for those countries in transition whose market exchange rates produceunrealistic levels of GDP, making any meaningful inter-country interpretation difficult.
The conversion rates used by the UN Statistics Division (UNSD) are normally the market orblended rates of exchange obtained from the International Monetary Fund (IMF). In some cases,use is made of UN operational rates which are established primarily for the settlement ofadministrative transactions between host countries and the UN. In many unique circumstances
ISED Methodology Sheets GDP per capitaPage 2 of4

the use of purchasing power parities (PPP) or price-adjusted rates of exchange (PARE) isnecessary. The World Bank also uses a special exchange rate where the official exchange rateproduces distortion in the dollar levels of GDP.
(e) Status of the Methodology: The 1993 System of National Accounts (SNA) providesinternational standards for national accounts. There may exist some differences in nationalaccounting and demographic reporting procedures and practices between countries. One possibledrawback could lie in the comparability of price information used in deflating current priceconsidered basic limitation lies in the conversion of GDP into a common denominations a resultof current misalignments in exchange rates for some countries vis-a-vis the comparator currency(US dollar) particularly for those countries in transition whose market exchange rates produceunrealistic levels of GDP, making any meaningful inter-country interpretation difficult.
(f) Alternative Definitions/Indicators: Economic indicators that measure the achievement ofhigher levels of goods and services more efficiently are better indicators of sustainabledevelopment. Consumption trends are better reflected by such indicators as PersonalConsumption expenditures as used in the USA. This indicator can be derived from the SNA.Gross national product is another alternative of GDP, while GNP = GDP + Net factor incomefrom abroad.
4. ASSESSMENT OF DATA
(a) Data Needed to Compile the Indicator: The conversion rates used by the UN StatisticsDivision (UNSD) are normally the market or blended rates of exchange obtained from theInternational Monetary Fund (IMF). For international comparisons, economic indicators areconverted from local currencies into a common currency, such as dollars. Traditionally, marketexchange rates are used to make these conversions. In theory, exchange rates adjust through theaction of the market so that the local currency prices of a group of identical goods and servicesrepresent equivalent value in every nation. In practice, however, such adjustments can lag farbehind rapidly changing economic circumstances. Government actions, such as currencycontrols, influence over interest rates, import tariffs, and export subsidies, may further distort theaccuracy of market- based exchange rates at any given time. Moreover, many goods and servicesare not traded in international commerce; market-based exchange rates may not reflect therelative values of such goods, even in theory. Thus, international comparisons based on marketexchange rates can greatly over- or understate the value of a nation's economic activity.
An alternative approach is based on estimates of the purchasing power of different currencies,rather than their market exchange rates. On the basis of comparisons of prices and expendituresfor several hundred goods and services by the International Comparison Project (ICP) in a largenumber of participating countries, the relative values of local currencies are adjusted to reflectPPP or equivalence. In effect, the PPP currency values reflect the number of units of a country'scurrency required to buy the same quantity of comparable goods and services in the local marketas one U.S. dollar would buy in an average country.
The World Bank now presents estimates of per capita GDP converted to a common currencyusing PPP equivalents, in addition to values converted using market exchange rates. GDP valuesmeasured in dollars tend to be higher for developing and transitional countries than market-basedexchange rates (i.e., their currencies are undervalued), while some developed countries'currencies appear to be overvalued relative to the U.S. dollar. From a PPP perspective, the
ISED Methodology Sheets GDP per capitaPage 3 of4

developing world's share of economic activity is larger than is reflected in market-basedexchange rates (although market-based measures may be more relevant for some purposes, suchas assessing trade potential). For purposes of cross-country comparisons the use of PPP or price-adjusted rates of exchange (PARE) is necessary.
(b) National and International Data Availability: The indicator has no serious limitations interms of data availability. The principal data elements for a majority of countries are mostly andregularly available from national and international sources on a historical basis. Internationallyaccepted conceptual guidelines, are also available to assist with the compilation of the indicator.Annual GDP data in current and constant prices are generally reported by national statisticaloffices or central banks in the United Nations (UN) National Accounts questionnaire andsupplemented by estimates prepared by the UN as well as other international organizations suchas the World Bank and the IMF. The Organization for Economic Co- operation andDevelopment (OECD) compiles quarterly GDP estimates for its Members. Population data aremainly obtained either through censuses or surveys. These are supplemented by growth estimatesprepared by the UN Population Division.
(c) Data Reference Comprehensive national accounts statistics are published by the UN in theseries National Accounts Statistics: Main Aggregates and Detailed Tables. A historical series ofGDP is available from the national accounts database of the UN Statistics Division. Populationdata and projections are available in the World Population Prospects published by the PopulationDivision of the UN Department of Economic and Social Affairs. Exchange rates are publishedby the IMF in International Financial Statistics.
5. AGENCIES INVOLVED IN THE DEVELOPMENT OF THE INDICATOR
(a) Lead Agency: The lead agency is the United Nations Department of Economic and SocialAffairs (DESA)
(b) Other Contributing Organizations: None
6. REFERENCES
(e) Readings: The 1993 SNA provides international standards on national accounts and is theproduct of collaborative efforts between EUROSTAT, IMF, OECD, UN and the World Bank; 3.
The World Bank (1993), Purchasing Power of Currencies: Comparing National Incomes UsingICP Data (Socio-Economic Data Division, International Economics Department, The WorldBank, Washington, D.C.
(f) Internet site:
United Nations Statistics Division: http:7www.un.org/Depts/unsd
ISED Methodology Sheets GDP per capitaPage 4 of4
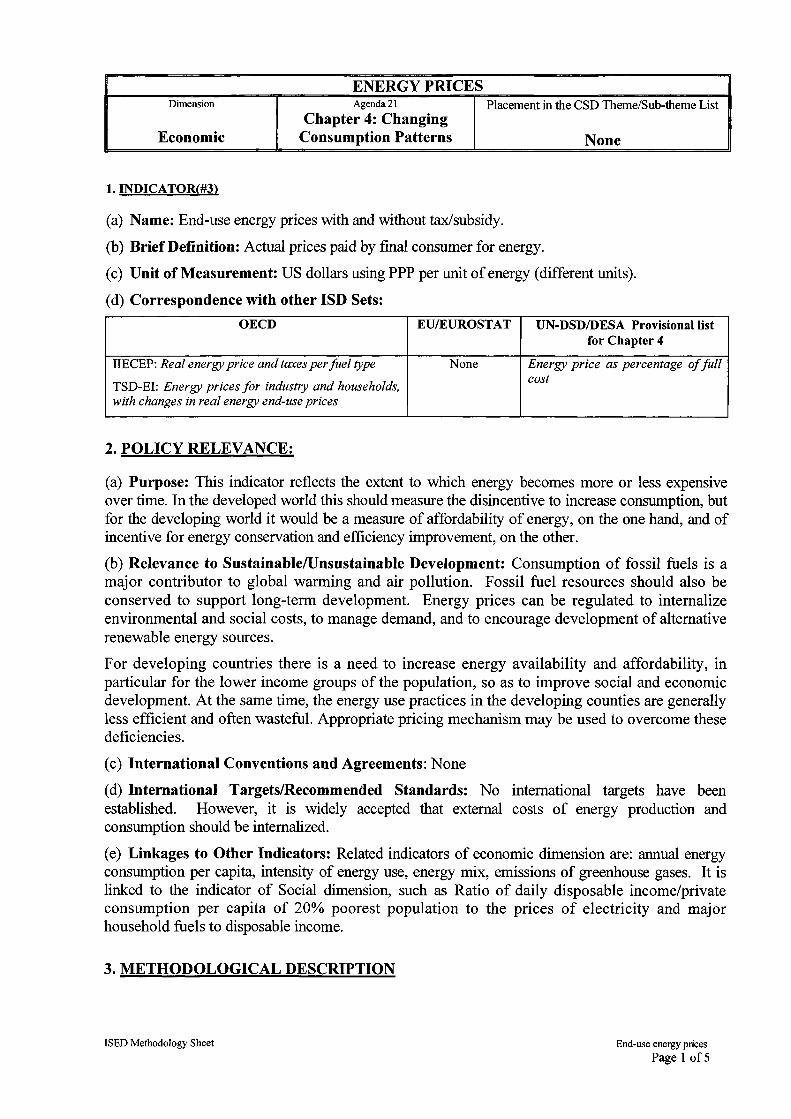
ENERGY PRICESDimension
Economic
Agenda 21
Chapter 4: ChangingConsumption Patterns
Placement in the CSD Theme/Sub-theme List
None
1. INDICATORS
(a) Name: End-use energy prices with and without tax/subsidy.
(b) Brief Definition: Actual prices paid by final consumer for energy.
(c) Unit of Measurement: US dollars using PPP per unit of energy (different units).
(d) Correspondence with other ISD Sets:
OECD
IIECEP: Real energy price and taxes per fuel type
TSD-EI: Energy prices for industry and households,with changes in real energy end-use prices
EU/EUROSTAT
None
UN-DSD/DESA Provisional listfor Chapter 4
Energy price as percentage of fullcost
2. POLICY RELEVANCE:
(a) Purpose: This indicator reflects the extent to which energy becomes more or less expensiveover time. In the developed world this should measure the disincentive to increase consumption, butfor the developing world it would be a measure of affordability of energy, on the one hand, and ofincentive for energy conservation and efficiency improvement, on the other.
(b) Relevance to Sustainable/Unsustainable Development: Consumption of fossil fuels is amajor contributor to global warming and air pollution. Fossil fuel resources should also beconserved to support long-term development. Energy prices can be regulated to internalizeenvironmental and social costs, to manage demand, and to encourage development of alternativerenewable energy sources.
For developing countries there is a need to increase energy availability and affordability, inparticular for the lower income groups of the population, so as to improve social and economicdevelopment. At the same time, the energy use practices in the developing counties are generallyless efficient and often wasteful. Appropriate pricing mechanism may be used to overcome thesedeficiencies.
(c) International Conventions and Agreements: None
(d) International Targets/Recommended Standards: No international targets have beenestablished. However, it is widely accepted that external costs of energy production andconsumption should be internalized.
(e) Linkages to Other Indicators: Related indicators of economic dimension are: annual energyconsumption per capita, intensity of energy use, energy mix, emissions of greenhouse gases. It islinked to the indicator of Social dimension, such as Ratio of daily disposable income/privateconsumption per capita of 20% poorest population to the prices of electricity and majorhousehold fuels to disposable income.
3. METHODOLOGICAL DESCRIPTION
ISED Methodology Sheet End-use energy pricesPage 1 of5

(a) Underlying Definitions and Concepts: This indicator should reflect the actual price paid byfinal consumers for various energy products. Prices should include all regular charges linked tothe supply of energy to the customer. For example, for electricity and gas, the data should includenot only the price per kWh or cubic meter, but also any standing charges and meter rentalcharges. Initial charges for connection to the electricity or gas network should not be included.For other products, any delivery charge should be included.
Different prices are often charged to different types of consumers. Therefore prices data shouldbe collected for the main fuels, which may differ from one country to another, and for differenttypes of consumer, e.g. domestic or industrial.
An underlying principle of tracking price data over time is that the product for which the price istracked remains the same throughout the period. This is clear in the case of, say, gasoline, wherethe data to be collected is always the price at the pump of one liter or gallon of gasoline.However for other products such as electricity or gas it is less straightforward, as the price perkWh paid will vary depending on the amount delivered. Therefore it is necessary to define oneor more standard consumers, representative of consumers in that country, whose consumptionpattern does not vary from one year to another, in order to track changes in price paid.
(b) Measurement Methods: Because prices change through the year, the data collected mustrefer to a fixed date: 1 January of each year is proposed.
Three price levels should be distinguished: prices including all taxes; prices excludingdeductible taxes (normally only deductible for industry); and prices excluding all taxes. Ifpossible, subsidies for different consumers should also be identified, though in practice thiscan prove to be extremely difficult, as the subsidies are often hidden in complicated tariffsystems.
In general, prices are collected in national currencies and converted to a common unit, usuallyUS dollars. Exceptions would be fuels such as aviation fuel, which is often billed directly inUS dollars. A further refinement is to deflate prices to allow for inflation. In order to deflatethe price series, the Consumer Price Indices should be used for household prices, includingpump prices of gasoline and diesel, and the Industrial Price Indices (or GDP, as an alternative,if Industrial Indices are not available) should be used for industrial prices.
Prices should be collected for the following products, in so far as these are commonlyavailable on the market in the country.
Petroleum products
Units:
- Automotive fuel
Premium unleaded gasoline (95 RON)
Premium leaded gasoline (95 RON)
Automotive gasoil (diesel): international dollars/1000 litre
- Heavy fuel oil (residual fuel oil), for industry: international dollars/tonne
- Light fuel oil (heating gasoil), for households: international dollars/1000 litre
Kerosene, for households: international dollars/1000 litre
- Liquefied petroleum gas (LPG), for households: international dollars/1000 litre.
Measurement: Average price charged by the main distributors on 1 January.
ISED Methodology Sheet Energy pricesPage 2 of5

Prices for gasoline and diesel should be pump prices. For heating gasoil and residual fuel oil, astandard offtakes or delivery must be defined since in general the price is cheaper for largerdeliveries. Standard offtakes should be defined for domestic consumers and for industrialconsumers; for example in the EU countries, prices are collected for- Heating gasoil: deliveries of 2,000 to 5,000 litres,
Heavy fuel oil: offtakes less than 2,000 tonnes per month or less than 24,000 tonnes peryear.
• Coal
Units:
- Steam coal, for industry and for households: international dollar/tonne
- Coking coal, for industry: international dollar/tonne.
Measurement: In many countries the main users of coal are electricity generators and thesteel industry. These often directly import coal to meet their own needs, in which case it issufficient to collect data on coal import prices.
Coal producing countries often have more extensive domestic markets for coal, in which caseaverage prices should be collected for typical deliveries for domestic and industrialconsumers, in the same way as proposed for petroleum products.
• Electricity, district heat, and piped gas
For electricity, heat, and gas, a similar alternative is to use industry and household surveys tocollect information on quantities of electricity, heat, and gas purchased and amounts charged,and to calculate average expenditure per unit purchased. This is strictly speaking not a trueprice, but rather a weighted price, where the weighting varies from one year to another.However it is preferable to the average revenue method, below.
The average revenue method, commonly used for lack of a better alternative, is based on datafrom utilities on average revenue per unit delivered. However it is generally not possible todistinguish sales to domestic or industrial customers, and data is skewed towards industry asthe major consumers. Moreover, revenue data often includes charges for connecting newcustomers to the network and for repairs, as well as income from sales of appliances.
Units:
- Electricity, for industry and for households: international dollar s/kWh
Natural Gas, for industry and for households: international dollars/1000 cub.m
Heat, for industry and for households: international dollars/GJ.
(c) The Indicator in the DSR Framework: This indicator represents an Indirect DrivingForce within economy.
(d) Limitation of the Indicator: The wide variety of energy products available on the marketmeans a large number of prices need to be collected. For example for road transport, leadedand unleaded 95 octane petrol, leaded and unleaded 98 octane petrol, diesel fuel, LPG andliquefied natural gas can all be found on the market. Normally only a selection of thoseconsidered most representative can be taken into account.
Further problems include differing prices for different locations throughout the country, e.g.prices in remote rural areas are often much higher than in major cities. As mentioned above, forsome forms of energy, in particular electricity and gas, the price per unit will depend on a variety
ISED Methodology Sheet Energy pricesPage 3 of5

of delivery conditions. The indicator can therefore only be indicative of the price paid by a typicalor standard consumer and cannot reflect the full spectrum of consumer types and locations.
(e) Status of the Methodology: Not available.
(f) Alternative Definitions / Indicators:
• Petroleum Products and Coal
In practice the method proposed above may prove difficult for industry when no 'list price'exists, and industries negotiate individual supply contracts with the coal producer or oilcompany. In this case, the only solution is to carry out a sample survey of industry costs and tocalculate average unit prices defined as total cost/quantity purchased.
4. ASSESSMENT OF DATA
(a) Data Needed to Compile the Indicator: Energy prices.
(b) National and International Data Availability: For coal and petroleum products, exceptaviation fuel, prices in developed countries are generally available, both nationally andinternationally (OECD, Euros tat). For gas and electricity the availability of price data variesfrom one country to another.
(c) Data References:
OECD: Energy Prices, annually
Eurostat: Energy Prices, 1980-1997
Eurostat: Electricity Prices, 1990-1997
Eurostat Gas Prices 1990-1997
Eurostat (1997): Electricity Prices: Price systems
Eurostat (1997): Gas Prices: Price systems
IEA: Energy Prices & Taxes, quarterly/
5. AGENCIES INVOLVED IN THE DEVELOPMENT OF THE INDICATOR
(a) Lead Agency: Eurostat (the Statistical Office of the European Communities). The contactpoint is Mr. Mario Ronconi (e-mail: [email protected]; tel. 0035 2 4301 35532, fax0035 2 430137316)
(b) Other Contributing Organizations: The IAEA.
6. REFERENCES
a) Readings:
OECD (1998): Towards sustainable Development- Environmental Indicators
b) Internet site:
Eurostat: http://europa.eu.int/eurostat.html
OECD: http://www.oecd.org
IEA: http://www.iea.org
ISED Methodology Sheet Energy pricesPage 4 of5

ADDENDUM TO THE METHODOLOGY SHEET: ADDITIONAL INFORMATION
1. TREND INDICATORS
To allow the analysis over time, some trend indicators could be selected, using real priceseries as a basis:
(a) Prices versus consumption
A simple analysis between price and consumption trends of each commodity can be carriedout by comparing the variations in the reference period and measuring how the consumptionchanges relative to price changes. The usual measure for this is "price elasticity," which isdefined as the percentage change in consumption for one percent change in price, providedthat income remains constant.
Price elasticity measures the impact of price variations on the quantities demanded orconsumed. Normally, it has a negative value and a higher consumption should be expectedwhen prices fall and a lower consumption should be expected when prices rise.
Broadly speaking, an inverse relationship can be expected between prices and consumption:the higher the price, the lower consumption and vice versa. However, there is a point wherefurther price increases do not reduce the energy consumption if the "minimum level" neededfor normal functioning of the economic system is reached. Energy consumption is alsoinfluenced by other factors (for example: climate variations, possibility to substitute energysources, etc.).
The taxes levied by product can be included by using in the Price Elasticity formula thevariations of prices with and without taxes and comparing the results.
2. SPECIFIC PATTERNS OF ENERGY MARKETS
(a) Quality differences by product:
Variations in qualitative features determine several unit prices for the same energy product.
(b) "Administrative price" and "Taxation price" pattern
In some countries, energy prices are fixed administratively and do not reflect effective marketprices. Normally, administrative price fixing implies application of specific administrativecomponents (negative and/or positive) to a price reflecting production factors and marketdemand ("economic price"). The so-called "taxation price" concept, i.e. the amount of taxlevied per unit, could also be applied to most energy prices. Ideally, at the macro level ofeconomic accounts, three distinct price components should be considered:
- Taxes on products: Prices have to be reported including and excluding all taxes and, in thecase of industrial prices, excluding only deductible taxes (e.g. VAT).
- Subsidies on products (applied in order to facilitate the supply to specific categories ofconsumers, e.g. industries or households); information on subsidies per unit price could bedifficult to obtain;
- VAT on product
(c) Other criteria of price fixation
It is useful to consider also the following patterns, which directly influence consumption andeffective prices for energy (and interact with the administrative fixation pattern):
price discrimination: different prices by sellers to different purchasers for identical goods
parallel markets: as a result of reaction to shortages or administrative controls.
ISED Methodology Sheet Energy pricesPage 5 of5

SHARES OF SECTORS IN GDP VALUE-ADDEDDimension Chapter in Agenda 21 Placement in the CSD Theme/Sub-theme Set
Economic Chapter 4: Changing Consumption NoneAnd Production Patterns
1. INDICATOR (#4)
(a) Name: Shares of sectors in GDP value added.
(b) Brief Definition: This indicator measures the contribution of the various economic sectorsin total production. It is obtained by dividing the value added in a specific sector by the totalGDP value-added at the constant 1990 prices.
(c) Unit of Measurement: %.
(d) Correspondence with other ISD Sets:
OECD
TSD El: Structure of GDP
EU/EUROSTAT
MPTMSE: Value added by main sector(ECON3)
UN-DSD/DESA Provisionallist for Chapter 4
2. POLICY RELEVANCE:
(a) Purpose: The relative size of sectors is a significant indicator of the state of the economy.The relative size of manufacturing also hints at basic driving forces associated with sustainabledevelopment.
(b) Relevance to Sustainable/Unsustainable Development: The sectoral shares of economicoutput reflect the stage of country development in terms of availability of human resources andcapital, both essential requirements in the drive towards sustainable development. Economicactivities also draw from a wide range of energy and other resources and, like them, may depletefossil fuel and degrade natural assets. Share of manufacturing is an important indicator ofeconomic development and it is seen as a key indicator of sustainable development progress bymany developing countries.
(c) International Conventions and Agreements: Not available.
(d) International Targets/Recommended Standards: National targets for the share of sector toGDP, in particular manufacturing, are usually included in policy making as a basis for budgets,funding programmes, and for priority-setting exercises.
(e) Linkages to other indicators: This indicator is closely related to other economic andenvironmental indicators reflecting the level of development and use of energy resources, suchas share of energy intensive industries in manufacturing, depletion of energy resources. Indeveloping countries it is also linked to the indicators reflecting dependence on non-commercialfuel.
3. METHODOLOGICAL DESCRIPTION
(a) Underlying Definitions and Concepts: Data on sectoral value-added (output) are presentlycompiled in accordance with the UN International Standard Industrial Classification (ISIC)revision 3. The following sectors have to be distinguished:
(i) Agriculture. An energy-consuming sector that consists of all facilities and equipmentISED Methodology Sheets Share of Sectors in GDP Value Added
Page 1 of3

engaged in growing crops and raising animals. It includes fishing and forestry and refers toISIC Categories A?B> divisions 1,2,5;
(ii) Manufacturing. An energy-consuming sub-sector of the industry that consists of allfacilities and equipment engaged in the mechanical, physical, chemical or electronictransformation of materials, substances or components into new products, whether the workis performed by power-driven machines or by hand, whether it is done in a factory or in theworker's home, and whether the products are sold at wholesale or retail. It refers to industriesbelonging to Category D, divisions 15-17;
(iii) Commerce & Services: An energy-consuming sector that consists of service-providingfacilities and equipment of: businesses; Federal, State, and local governments; and otherprivate and public organizations, such as religious, social, or fraternal groups. Thecommercial sector includes institutional living quarters. Common uses of energy associatedwith this sector include space heating, water heating, air conditioning, lighting, refrigeration,cooking, and running a wide variety of other equipment. It corresponds to ISIC Categories G,H, J-Q, divisions 50-55, 65-99;
(iv)Transportation: An energy-consuming sector that consists of all vehicles whose primarypurpose in transporting peoples and/or goods from one location to another. Included areautomobiles, trucks, buses, motorcycles, trains, subways, and other rail vehicles, aircraft; andships, barges, and other waterborne vehicles. Vehicles whose primary purpose is nottransportation (e.g., construction cranes and bulldozers, farming vehicles, and warehousetractors and forklifts) are classified in the sector of their primary use. In ISIC classification itcorresponds to Category I (transport, storage and communications), divisions 60-65.
Further details on the conceptual definition of GDP are contained in the SNA. National accountstatistics are published in the series National Accounts Statistics: Main Aggregates and DetailedTables. The classification of sectors is covered in the UN International Standard IndustrialClassification of All Economic Activities, Revision 3. Concepts and definitions are in accordancewith the international Recommendations for Industrial Statistics, published by the UnitedNations.
(b) Measurement Methods:
(c) The Indicator in the DSR Framework: It is assigned as an Indirect Driving Force ofEconomic dimension.
(d) Limitations of the Indicator: This indicator has no serious limitations because data onsectoral activities in the System of National Accounts are guided by the frameworkrecommended in the ISIC, and generally coherent between countries. It should be taken intoaccount that in some national statistics, in particular in the US, agriculture is considered as a sub-sector of the industrial sector.
(e) Status of the Methodology: None.
(f) Alternative Definitions/Indicators: None.
4. ASSESSMENT OF DATA
(a) Data Needed to Compile the Indicator:
ISED Methodology Sheets Share of Sectors in GDP Value AddedPage 2 of3

(i) Gross domestic product at purchasing power parity as the sum of gross value added by allresident producers in the economy plus any taxes and minus any subsidies not included in thevalue of the product;
(ii) Value added in various sectors as net output after adding all outputs and substractingintermediate inputs. The industrial origin of value added is determined by the InternationalStandard Industrial Classification revision 3.
(b) National and International Data Availability and Sources: Data on sectoral value-added and GDP are generally reported by national statistical offices or central banks to the UNNational Accounts questionnaire. These are supplemented by estimates prepared by the UnitedNations Statistical Division (UNSD), as well as other international organizations such as theWorld Bank and the International Monetary Fund (IMF). These estimates are largely based onindicators of output obtained either from national sources or the United Nations IndustrialDevelopment Organization (UNIDO).
When using both UNSD and UNIDO data it is important to keep in mind the differences inmeasurement concepts between data derived from national accounts and industrial statistics.
When using World Bank data it should be kept in mind that Services includes transportationsector (ISIC I, 60-65) referring to ISIC divisions 50-99. World Bank's data on value added inindustry additionally to manufacturing comprises mining, construction, electricity water and gasoutputs. For some countries data in the UNIDO "International Yearbook of Industrial Statistics"are presented in accordance with Revision 2 of ISIC
(c) Data Reference:
UNIDO: International Yearbook of Industrial Statistics 2001 (published biennially)
OECD: Main Economic Indicators, (monthly);
World Bank: World Development Indicators, 2000 and 2001\
UN: National Accounts Statistics: Main Aggregates and Detailed Tables;
UN Monthly Bulletin of Statistics;
UN-DESA(2001): World Statistics Pocketbook, No21.
EUROSTAT (2000): Economic Accounts of the European Union 1998.
5. AGENCIES INVOLVED IN THE DEVELOPMENT OF THE INDICATOR
(a) Lead Agency: The lead agency for the development of this indicator is the United NationsIndustrial Development Organization (UNIDO). The contact point is the Chief, IndustrialStatistics Branch, Information and Research Division, UNIDO; fax no. (43 1) 232 156. As theofficial compiler of national accounts statistics, the United Nations Statistical Division could alsobe a principal contact point in terms of SNA and ISIC references.
(b) Other Contributing Organizations: None.
6. REFERENCES
(a) Readings:UN (1990): International Standard Industrial Classification of all Economic Activities, ThirdISED Methodology Sheets Share of Sectors in GDP Value Added
Page 3 of3

Revision.
Srinivasan T.N., "Database for Development Analysis: An overview" Journal of DevelopmentEconomics, 44(1), 3-28, 1994.
Heston Alan, "A brief review of some problems in using National Accounts data in level ofoutput comparison and growth studies'3, Journal of Development Economics, 44(1), 29-52,1994.
(b) Internet site:World Bank: http://www.worldbank.org/dataUNIDO: http://www.unido.orgUN-DESA: http://esa.un.org/unsd/cr/registry/regs.asp
ISED Methodology Sheets Share of Sectors in GDP Value Added
Page 4 of3

DISTANCE TRAVELLED PER CAPITA: TOTAL AND BY URBAN TRANSPORTDimension
EconomicAgenda 21
Consumption andProduction Patterns
Placement in the CSD Theme/Sub-theme listEconomic/ Consumption and
Production Patterns/ Transportation
1. INDICATORS)
(a) Name: Distance travelled per capita: total and by urban transport.
(b) Brief Definition: The number of kilometres travelled per person in a given year in total andby urban transport, and in particular by electrically driven vehicles in urban public transport.
(c) Unit of Measurement: Kilometres per year per capita for travelled distances; % for share ofelectrically driven vehicles in urban public transport.
(d) Correspondence with other ISD:
OECD
TSD El: Road traffic and vehicle intensities
IIEC Transport Policy:
EU/EUROSTAT
MPTMSE: Passenger transportby mode (ECON19)
UN-DSD/DESA Provisionallist for Chapter 4
Number of passenger km parcapita by mode of transport
2. POLICY RELEVANCE
(a) Purpose: This indicator can contribute to monitor fuel consumption for travelling and theenvironmental impact of the systems for personal mobility in a particular country or area.
(b) Relevance to Sustainable/Unsustainable Development: Travel is an essential part of theeconomic and social life of a country. As economies develop, the demand for mobility and hencepassenger transport increases. Increasing in distance travelled and changes in the mix of travelmodes result in a changing picture with regard to road fuel mix and environmental impacts. Non-motorised hence has low environmental impact. Motorised travel is the only suitable means oftravelling longer distances, but causes higher demand for energy and consequently has greaterenvironmental and social impacts, such as urban pollution, global warming, and accidents.Sustainability implies using the most appropriate mode of transport for the journey in question.Policies are needed which reduce the need for travel, support a shift towards lessenvironmentally damaging means, such as electrically driven vehicles, provide incentives forchanges in lifestyle, increase safety, and improve the standard of public transport (transit).
(c) International Conventions and Agreements: Not applicable.
(d) International Targets/Recommended Standards: No international targets have beenestablished.
(e) Linkages to other indicators: This mobility indicator is linked to economic indicators, suchas GDP per capita, shares of sectors in GDP value added, energy intensity of transportation andpassenger travel, automotive fuel consumption per capita, and road fuel prices and taxes. It isassociated with percent of population in urban areas. The indicator is also linked to someenvironmental indicators: quantities of air pollutant emissions, quantities of GHG emissions,ambient concentration of pollutants in urban areas.
3. METHODOLOGICAL DESCRIPTION
(a) Underlying Definitions and Concepts: The aim of this indicator is to quantify the use of
ISED Methodology Sheets Distance travelled per capita: total and by urban transportPage 1 of3
different modes of transport by people (passengers). The indicator should be broken down intothe urban public transport modes, notably into electrically driven vehicle (trams, trolleybus,trains, metro etc.) A further breakdown by various modes and purpose would provide usefuladditional information.
(b) Measurement Methods: Total and urban public transport passenger- kilometres travelledper year divided by the total population.
(c) The Indicator in the DSR Framework: The indicator is assigned as an Indirect DrivingForce of Economic dimension.
(d) Limitations of the Indicator: The reliability of passenger- kilometre statistics, with theexception of bus and train, leaves much to be desired. The indicator has an inbuilt bias againstthe longer distance modes of transport, especially planes. To some extent this can be offset bysplitting the indicator by purpose (shopping, travel to school or work, professional travel,pleasure). Ideally, the indicator would measure the distance travelled by the population of acountry both within and outside their country. In practice, national passenger- kilometre statisticsnormally include movements of all people within the national territory (regardless of theirnormal place of residence), and exclude movements outside their territory. This indicatormeasures only distance travelled by passengers and does not cover goods transport. In order tomonitor efficiency changes in the transport sector, an indicator such as transport performancedivided by vehicle performance (tonne- kilometres/ vehicle- kilometres) could be considered.
(e) Status of the Methodology: An agreed methodology at the international level concerningpassenger transport statistics has not yet been established and no specific projects on thisdirection are known at present. National definitions are being used.
(f) Alternative Definitions/Indicators: An alternative would be to use number of trips fordifferent purposes. This would counter the bias against longer distance modes.
4. ASSESSMENT OF DATA
(a) Data Needed to Compile the Indicator:
(i) Total passenger- kilometre data;
(ii) Passenger-kilometre data by urban public transport means;
(iii) Share of electrically driven vehicles in urban public transport;
(ii) Population.
(b) National and International Data Availability: Passenger- kilometer data for at least somemodes of transport are regularly available for most countries at the national level; and for somecountries, at the sub- national level. But the data quality differs by mode. Passenger cars haveconsiderable uncertainties due to lack of complete information of vehicle-kilometres and theoccupancy rates. Data are compiled by and available from national statistical offices and variousprofessional organizations.
(c) Data Reference:
Eurostat: Transport Annual Statistics.
ECMT: Statistical Trends in Transport.
UNECE: Annual Bulletin of Transport Statistics for Europe. International Road Federation:World Road Statistics.
5. AGENCIES INVOLVED IN THE DEVELOPMENT OF THE INDICATOR
(a) Lead Agency: The lead agency is Eurostat (the Statistical Office of the European
ISED Methodology Sheets Distance travelled per capita: total and by urban transportPage 2 of3

Communities). The contact point is Ms. Inger Oehman, fax no. (35-2) 4301 37278.
(b) Other Contributing Organizations: Other Contributing Organizations: Other organizationsinvolved in the development of this type of indicator include: International Road TransportUnion (IRU) and the United Nations Economic Commission for Europe (UNECE
6. REFERENCES
(a) Readings: EU Commission (1999), EU transport in figures, Statistical Pocketbook.
Commission for EU (2000), Transport and Environment - Statistics for the Transport andEnvironment Reporting Mechanism (TERM) for the European Union.
European Environment Agency (2000), Are we moving in the right direction? Indicators ontransport and the environment integration in the EU.
Commission for EU (2001), WHITE PAPER European transport policy for 2010: time to decideBrussels, 12/09/2001, COM(2001) 370
(b) Internet site: http://europa.eu.int/com./ eurostat
ISED Methodology Sheets Distance travelled per capita: total and by urban transportPage 3 of3

FREIGHT TRANSPORT ACTIVITY: TOTAL, BY MODEDimension
EconomicAgenda 21
Consumption andProduction Patterns
Placement in the CSD Theme/Sub-theme listNone
1. INDICATOR (#6)
(a) Name: Freight transport activity: total, by mode.
(b) Brief Definition: The indicator reflects production aspects of transportation and is defined asthe number of tonnes of freight transport multiplied by the distance transported, by differentmodes of transport, such as truck, train, inland water, and pipelines.
(c) Unit of Measurement: Billion tonne-km per year for total freight activity, and percentagefor share of different modes.
(d) Correspondence with other ISD:
OECD
TSD El: Road traffic and vehicle intensities
IIEC Transport Policy:
EU/EUROSTAT
MPTMSE: Freight transport bymode (ECON20)
UN-DSD/DESA Provisionallist for Chapter 4
Freight traffic by mode oftransport
2. POLICY RELEVANCE
(a) Purpose: This indicator can contribute to monitor fuel consumption for freight transport andthe environmental impact of the systems for freight activity in a particular country or area.
(b) Relevance to Sustainable/Unsustainable Development: Transport of freight is an essentialpart of the economic life of a country. As economies develop, the demand for freight transportincreases. Increases in both number of tonnes of freight transported and distances as well as thechanges in the mix of travel modes result in a changing picture with regard to environmentalimpacts. The different modes have significantly different impacts. Water transport and pipelinesare more efficient in energy terms than rail, which is in turn more energy efficient than road. Onthe other hand, if one considers the delivery time road still remains the most efficient mode. Thetrend towards containerisation of freight has speeded up the transfer of freight from one mode toanother.
Sustainability implies using the most appropriate mode of the freight and promoting theintermodal and combined transport, as well as the revitalisation of shipping, railways and inlandwaterways. Policies are needed which reduce the need for freight activity, support a shift towardsmore energy efficient and less environmentally damaging means, provide incentives for changesin lifestyle, increase safety, and improve the standard of freight transport.
(c) International Conventions and Agreements: Not applicable.
(d) International Targets/Recommended Standards: No international targets have beenestablished.
(e) Linkages to other indicators: This mobility indicator is linked to economic indicators, suchas GDP per capita, shares of sectors in GDP value added, energy intensity of transportation andfreight transport, automotive fuel consumption per capita, and road fuel prices and taxes. Theindicator is also linked to some environmental indicators: quantities of air pollutant emissions,quantities of GHG emissions, and ambient concentration of pollutants in urban areas.
ISED Methodology Sheets Freight transport activityPage 1 of3

3. METHODOLOGICAL DESCRIPTION
(a) Underlying Definitions and Concepts: The aim of this indicator is to quantify the use ofdifferent modes of transport for freight. The indicator should be broken down into the followingmodes of transport: train, inland water, and pipelines urban public transport modes, notably intoelectrically driven vehicle
(b) Measurement Methods: The number of tonnes of freight transport, the distance transported,by different modes of transport, such as truck, train, inland water, and pipelines.
(c) The Indicator in the DSR Framework: The indicator is assigned as an Indirect DrivingForce of Economic dimension.
(d) Limitations of the Indicator: The reliability of tonne-km data, with the exception of trainand ships, leaves much to be desired. This indicator measures only distance travelled by freightand does not cover passenger travel. In order to monitor efficiency changes in the transportsector, an indicator such as transport performance divided by vehicle performance (tonne-kilometres/ vehicle- kilometres) could be considered.
(e) Status of the Methodology: An agreed methodology at the international level concerningpassenger transport statistics has not yet been established and no specific projects on thisdirection are known at present. National definitions are being used.
(f) Alternative Definitions/Indicators: An alternative would be to use road freight vehicles-km.
4. ASSESSMENT OF DATA
(a) Data Needed to Compile the Indicator:
(i) Total freight tonne- kilometre data;
(ii) Freight-kilometre data by different freight transport means.
(b) National and International Data Availability: Tonne-kilometre data for different modes offreight transport are regularly available for most countries at the national level; and for somecountries, at the sub- national level. But the data quality differs by mode. Road tracks haveconsiderable uncertainties due to lack of complete information of vehicle-kilometres and the loadfactor. Data are compiled by and available from national statistical offices and variousprofessional organizations.
(c) Data Reference:
Eurostat: Transport Annual Statistics.
ECMT: Statistical Trends in Transport.
UNECE: Annual Bulletin of Transport Statistics for Europe. International Road Federation:World Road Statistics.
5. AGENCIES INVOLVED IN THE DEVELOPMENT OF THE INDICATOR
(a) Lead Agency: The lead agency is Eurostat (the Statistical Office of the EuropeanCommunities). The potential contact point is Ms. Inger Oehman, fax no. (35-2) 4301 37278.
(b) Other Contributing Organizations: Other Contributing Organizations: Other organizationsinvolved in the development of this indicator include: International Road Transport Union (IRU)and the United Nations Economic Commission for Europe (UNECE
6. REFERENCES
ISED Methodology Sheets Freight transport activityPage 2 of3

(a) Readings:
EU Commission (1999), EU transport in figures, Statistical Pocketbook.
Commission for EU (2000), Transport and Environment - Statistics for the Transport andEnvironment Reporting Mechanism (TERM) for the European Union.
European Environment Agency (2000), Are we moving in the right direction? Indicators ontransport and the environment integration in the EU.
Commission for EU (2001), WHITE PAPER European transport policy for 2010: time to decideBrussels, 12/09/2001, COM (2001) 370
(b) Internet site: http://europa.eu.int/com7 eurostat.
ISED Methodology Sheets Freight transport activityPage 3 of3

FLOOR AREA PER CAPITADimension
EconomicAgenda 21 Chapter 7: Promoting
Sustainable Human SettlementDevelopment
Placement in the CSD Theme/Sub-themeList
Social/ Housing/ LivingConditions/ Floor Area per Person
1. INDICATOR (#7)
(a) Name: Floor area per capita.
(b) Brief Definition: Defined as the median usable living space per person.
(c) Unit of Measurement: sq. m per person.
(d) Correspondence with other ISD Sets:
OECD EU/EUROSTAT
MPTMSE: Number of roomsper capita (SOC17)
UN-DSD/DESA Provisionallist for Chapter 4
None
2. POLICY RELEVANCE:
(a) Purpose: This is a key indicator of housing quality, which measures the adequacy of livingspace in dwellings. A low value for the indicator is a sign of overcrowding.
(b) Relevance to Sustainable/Unsustainable Development: This is a key indicator measuringthe adequacy of the basic human need for shelter. Human settlement conditions in many parts ofthe world are deteriorating mainly as a result of a low level of investment, although suchinvestment has been shown to generate considerable public and private sector investment.Housing policies, particularly in urban areas, greatly affect the living conditions of people. In lowincome settlements, reduced space per person can be associated with certain categories of healthrisks.
(c) International Conventions and Agreements: This indicator is one of ten "key" housingindicators approved by the Commission on Human Settlements (Resolution 14/13), to becollected in all countries and in a number of cities in each country, to measure progress towardsmeeting the objectives of the Global Shelter Strategy. Countries are to use the indicators toprovide the basis for their country reports to the Second United Nations Conference on HumanSettlements. Also, the Habitat Agenda, endorsed at the Second United Nations Conference onHuman Settlements (Habitat II), explicitly mentions 'provision of sufficient living space andavoidance of overcrowding', as part of the commitments of UN member states, to be measuredby this indicator. This indicator has also been selected for the Common Country Assessment(CCA) indicators' framework prepared by the UNDG for evaluation, advocacy and policydialogue at the country level.
(d) International Targets/Recommended Standards: No targets have been developed for thisindicator.
(e) Linkages to other indicators: This indicator is linked to several other economic indicatorswith which it should be considered, including energy consumption per capita, energy intensity in
ISED Methodology Sheets Floor area per capitaPage 1 of3

residential sector.
3. METHODOLOGICAL DESCRIPTION
(a) Underlying Definitions and Concepts: The floor area should include all living space, alongwith bathrooms, internal corridors and closets. Covered semi-private spaces such as corridors,inner courtyards or verandas should be included in the calculation if used by the household forcooking, eating, sleeping, or other domestic activities. Floor area refers to a housing unit, definedas a separate and independent place of abode intended for habitation by one household at thetime of the census or other inquiry.
(b) Measurement Methods: The median floor area of a unit should be divided by the averagehousehold size. If data from household surveys or from a recent census are available, these can beused. In the absence of better data, the floor area of the median priced dwelling may be used as anapproximation, although this may not be an accurate estimate. If the median cannot be estimated,then the average should be provided.
(c) The Indicator in the DSR Framework: This indicator is a measure of housing quality, anoutcome of housing demand and in particular of energy demand in residential sector. As such, thisindicator is a Indirect Driving Force of Economic Dimension in the DSR Framework
(d) Limitations of the Indicator: Results for this indicator may vary considerably if collected atthe city, national, urban/rural levels, given the variations in land availability and types of humansettlements and activities. Informal settlements in particular are likely to have much less spaceper person, as are disadvantaged groups. Various levels of data collection are necessary toprovide a full picture of this specific housing outcome. Housing size and housing quality areusually but not necessarily linked, and floor area per person may not give a complete picture ofliving conditions. Cultural values affect sensitivity to crowding. For these reasons, interpretationof this indicator is difficult, and should be completed in conjunction with related indicators
(e) Status of the Methodology: Not Available.
(f) Alternative Definitions: Alternative measures of crowding have been the subject of datacollection and reporting in international statistical compendia. The two most common are personsper room and households per dwelling unit, each of which was included among data collectedduring the first phase of the Housing Indicators Programme (UNCHS, World Bank, 1992).Surveys have shown that floor area per person is more precise and policy-sensitive than theother two indicators. Habitat, the United Nations Cent re for Human Settlements (UNCHS) hasdeveloped and tested a series of crowding indicators in low- income settlements. They include,among others, percentage of housing units with more than one household, in- house living areaper person, percentage of housing units with more than three persons per room, number ofhouseholds per building and per housing unit, number of persons per building.
4. ASSESSMENT OF DATA
(a) Data Needed to Compile the Indicator: Median floor area of housing units; average numberof persons per household.
(b) National and International Data Availability and Sources: The data are generallyavailable at the country level. This indicator was collected in 52 countries (one city per country)by the Shelter Sector Performance Indicators Programme in 1992 (UNCHS, World Bank). It hasbeen collected worldwide by the UNCHS Indicators Programme in preparation for the Habitat IIISED Methodology Sheets Floor area per capita
Page 2 of3

Conference (1996). Results are available from the following Habitat website:www.urbanobservatory.org/indicators.
(c) Data References: Primary data sources include censuses or household surveys. Theindicator is reported in the Housing Indicators Programme report listed in section 6 below.
5. AGENCIES INVOLVED IN THE DEVELOPMENT OF THE INDICATOR
(a) Lead Agency: The lead agency is the United Nations Centre for Human Settlements(Habitat). The contact point is the Head, Urban Secretariat, UNCHS (Habitat); fax no. (254 2)623080.
(b) Other Contributing Organizations: The World Bank.
6. REFERENCES
(a) Readings:
World Bank, (1993): Housing: Enabling Markets to Work The World Bank, Washington D.C. AWorld Bank Policy Paper).
UNCHS (Habitat), World Bank, (1993): The Housing Indicators Programme. Report of theExecutive Director (Volume I). UNCHS, Nairobi,.
UNCHS (Habitat), (\995):Monitoring the Shelter Sector. Housing Indicators Review. UNCHS,Nairobi.
UNCHS (Habitat), (1995): Human Settlement, Interventions Addressing Crowding and HealthIssues,
UNCHS (Habitat), (2001):. Cities in a Globalizing World: Global Report Human Settlements,UNCHS, Nairobi.
(b) Internet site:
UNCHS (Habitat) home page: http://www.urbanobservatory.org/indicators/database.
http://www.UNCHS.org/documents/http://www.bestpractices.org/
ISED Methodology Sheets Floor area per capitaPage 3 of3

MANUFACTURING VALUE ADDED BY SELECTED ENERGY INTENSIVEINDUSTRIES
Dimension Chapter in Agenda 21 Placement in the CSD Theme/Sub-theme Set
Economic Chapter 4: Changing Consumption NoneAnd Production Patterns
1. INDICATOR (#8)
(a) Name: Manufacturing Value Added by Selected Energy Intensive Industries.
(b) Brief Definition: This indicator measures the contribution of the various manufacturingenergy intensive industries in total manufacturing output. It is obtained by dividing the valueadded in a specific manufacturing branch by the total net value-added in manufacturing at theconstant 1990 prices.
(c) Unit of Measurement: %.(d) Correspondence with other ISD Sets:
OECD
None
EU/EUROSTAT
None
UN-DSD/DESA Provisionallist for Chapter 4
None
2. POLICY RELEVANCE:
(a) Purpose: Indicator is designed to monitor the relative size of energy intensive industries inmanufacturing. The relative size of energy intensive industries also hints at basic driving forcesassociated with level of energy use per unit of GDP.
(b) Relevance to Sustainable/Unsustainable Development: The shares of economic output ofindustrial branches reflect the level of energy needs to drive economy.
(c) International Conventions and Agreements: Not available.
(d) International Targets/Recommended Standards: National targets for the share ofindustries to manufacturing, are usually included in policy making as a basis for economyrestructuring, budgets, funding programmes, and for priority-setting exercises.
(e) Linkages to other indicators: This indicator is closely related to other economic andenvironmental indicators reflecting the level of development and use of energy resources, suchas share of energy intensive industries in manufacturing, depletion of energy resources, airpollution emissions, etc.
3. METHODOLOGICAL DESCRIPTION
(a) Underlying Definitions and Concepts:The energy intensive industries have to be specified for the manufacturing of:
(i) Iron and steel, in classification ISIC refers to Group 271;
(ii) Non-ferrous metals, refers to ISIC Group: 272 "Manufacture of basic precious and non-ferrous metals";
(iii) Basic Chemicals, corresponds to ISIC Group 241, which in turn comprises the followingISED Methodology Sheets Manufacturing Value Added by Selected Energy Intensive Industries
Page 1 of3

Classes: 2411 - "Manufacture of basic chemicals, except fertilizers and nitrogencompounds"; 2412 - "Manufacture of fertilizers and nitrogen compounds"; 2413 —"Manufacture of plastics in primary forms and of synthetic";
(iv) Non-metallic minerals, corresponds to ISIC Group 269 - "Manufacture of non-metallicmineral products", Class 2694 - Manufacture of cement, lime and plaster is of primaryinterest. The Class includes manufacture of (1) hydraulic cements, including portland,aluminous slag and superphosphate, whether or not in the form of clinkers; (2) quicklime,slaked lime and hydraulic lime; (3) plasters consisting of calcined gypsum or calciumsulphate.
(v) Paper and pulp, corresponds to ISIC Group 210. This Group comprises several Classes,among them the desirable one to be addressed is 2101 - "Manufacture of pulp, paper andpaperboard", if data on it is available;
(vi) Refined Petroleum Products: In ISIC classification it corresponds to Group 232
Data on manufacturing branches value-added (output) are presently compiled in accordance withthe UN International Standard Industrial Classification (ISIC) Revision 3. Details on theconceptual definition of manufacturing and its branches are contained in the in the System ofNational Accounts (SNA). National account statistics are published in the series NationalAccounts Statistics: Main Aggregates and Detailed Tables. The classification of sectors iscovered in the UN International Standard Industrial Classification of All Economic Activities,Revision 3. Concepts and definitions are in accordance with the international Recommendationsfor Industrial Statistics, published by the United Nations.
(b) Measurement Methods:
(c) The Indicator in the DSR Framework: It is assigned as an Indirect Driving Force ofEconomic dimension.
(d) Limitations of the Indicator: This indicator has no serious limitations because data onmanufacturing structure in the System of National Accounts are guided by the frameworkrecommended in the ISIC, and generally coherent between countries.
(e) Status of the Methodology: None.
(f) Alternative Definitions/Indicators: None.
4. ASSESSMENT OF DATA
(a) Data Needed to Compile the Indicator:(i) Value added in manufacturing as the sum of gross output less the value of intermediate
inputs used in production for industries classified in ISIC major division (See theMethodological Sheet for Shares of sectors in GDP value added);
(ii) Value added in various branches of manufacturing as net output after adding all outputsand substracting intermediate inputs. The industrial origin of value added is determined by theInternational Standard Industrial Classification, Revision 3.
(b) National and International Data Availability and Sources: Data on the distribution ofmanufacturing value added by manufacturing activities branches are provided the United NationsIndustrial Development Organization (UNIDO). Value-added is generally reported by national
ISED Methodology Sheets Manufacturing Value Added by Selected Energy Intensive Industries
Page 2 of3

statistical offices or central banks to the UN National Accounts questionnaire. These aresupplemented by estimates prepared by the United Nations Statistical Division (UNSD), as wellas other international organizations such as the World Bank (WB) and the InternationalMonetary Fund (IMF).
The I SIC emphasizes commonalities in the production process and is explicitly not intended tomeasure output. For output measuring there is a newly developed Central Product Classification(CPC). Nevertheless, the ISIC views an activity as defined by " a process resulting in ahomogeneous set of products"
When using the WB data it should be noted that the classification of manufacturing industriescoincides with the ISIC revision 2. For some countries data in the UNIDO "InternationalYearbook of Industrial Statistics" are presented in accordance with Revision 2 of ISIC
(c) Data Reference:
UNIDO: International Yearbook of Industrial Statistics 2001 (published biennially);
OECD: Main Economic Indicators, (monthly);
World Bank: World Development Indicators 2000 and 2001;
UN National Accounts Statistics: Main Aggregates and Detailed Tables;
UN Monthly Bulletin of Statistics.
UN-DESA: World Statistics Pocketbook, No21, 2001.
EUROSTAT: Economic Accounts of the European Union 1998, 2000.
5. AGENCIES INVOLVED IN THE DEVELOPMENT OF THE INDICATOR
(a) Lead Agency: The lead agency for the development of this indicator is the United NationsIndustrial Development Organization (UNIDO). The contact point is the Chief, IndustrialStatistics Branch, Information and Research Division, UNIDO; fax no. (43 1) 232 156. As theofficial compiler of national accounts statistics, the United Nations Statistical Division could alsobe a principal contact point in terms of SNA and ISIC references.
(b) Other Contributing Organizations: None.
6. REFERENCES
(a) Readings:
UN (1990): International Standard Industrial Classification of all Economic Activities, ThirdRevision.
Srinivasan T.N., "Database for Development Analysis: An overview" Journal of DevelopmentEconomics, 44(1), 3-28, 1994.
Heston Alan, "A brief review of some problems in using National Accounts data in level ofoutput comparison and growth studies", Journal of Development Economics, 44(1), 29-52,1994.
(b) Internet site:World Bank: http://www.worldbank.org/dataUNIDO: http://www.unido.org
ISED Methodology Sheets Manufacturing Value Added by Selected Energy Intensive Industries
Page 3 of3

UN-DESA: http://esa.un.org/unsd/cr/registrv/regs.asp
ISED Methodology Sheets Manufacturing Value Added by Selected Energy Intensive Industries
Page 4 of3

ENERGY INTENSITY: MANUFACTURINGDimension
EconomicAgenda 21
Chapter 4: Consumption andProduction Patterns
Placement in the CSD Theme/Sub-theme Set
Consumption and ProductionPatterns/ Energy Use/ Intensity of
Energy Use: Manufacturing
1. INDICATOR (#9-1)
(a) Name: Energy Intensity in Manufacturing.
(b) Brief Definition: Energy consumption per unit of manufacturing output.
(c) Unit of Measurement: Tonne of oil equivalent (toe) of final energy and kWh of electricityper unit of output in manufacturing sector converted to constant international US dollars usingpurchasing power parity rates (toe/1000$ and kWh/$).
(d) Correspondence with other ISP Sets:OECD EU/EUROSTAT
MPTMSE: Energy intensity ofmanufacturing (ECON12)
UN-DSD/DESA Provisionallist for Chapter 4
Energy intensity ofmanufacturing
2. POLICY RELEVANCE:
(a) Purpose: The manufacturing sector is a major consumer of energy. This indicator is ameasure of the efficiency of energy use in the sector that can be used for analysing trends andmaking international comparisons in energy efficiency, particularly when the indicator can bedisaggregated to specific branches of manufacturing.
(b) Relevance to Sustainable/Unsustainable Development: Sustainable development requiresincreases in energy efficiency in order to reduce fossil fuel consumption, greenhouse gasemissions and related air pollution emissions.
(c) International Conventions and Agreements: Although there are no specific internationaltargets regarding energy use or energy efficiency, many industrialized countries have targets forreducing energy use and carbon emissions from manufacturing branches.
(d) Linkages to other indicators: This indicator is one of a set for energy intensity in differentsectors (manufacturing, transportation, agriculture, commercial/services and residential), with theindicator for energy use per unit of GDP as an aggregate energy intensity indicator. Theseindicators are also linked to indicators for shares of sectors in value added, manufacturing valueadded by selected energy intensive products, total energy and electricity consumption,greenhouse gas emissions, and air pollutant emissions.
(e) International Targets/Recommended Standards: UNFCCC and its Kyoto Protocol.
3. METHODOLOGICAL DESCRIPTION
(a) Underlying Definitions and Concepts: Energy consumption per unit of value added isone way of measuring energy requirements and energy efficiency in manufacturing. While energyISED Methodology Sheets Energy Intensity in manufacturing
Page 1 of4

consumption per unit of physical output is a better indicator of energy efficiency in specificmanufacturing processes, energy use per unit of economic output is more useful both for relatingenergy efficiency to economic activity and for aggregating and comparing energy efficiency acrossmanufacturing sectors or across the entire economy.
(b) Measurement Methods:=> Energy Use: Energy use is usually measured at the point of consumption, i.e., the factory
or establishment. "Own energy" (including internal use of hydropower, biofuels, orinternal waste heat) should be combined with purchased energy at useful heating values.
For combined production of heat and electricity, no simple method exists for dividing thetotal energy consumed between these two outputs. Where excess heat or electricity issold or provided to outside establishments or a grid, the energy required for this out-goingsupply should not be allocated to the product of the establishment or branch and theincome or apparent value added from these sales should be excluded from output value.
In some cases, it may be preferable to measure total primary energy consumption,including losses incurred in the external production and distribution of the purchasedelectricity and heat, since these losses would occur if the establishment or branch used theprimary energy directly. Primary energy consumption is a better measure of the totalenergy burden on the economy of a unit of output from an industry. Generally, theenergy loss from converting primary energy to electricity is estimated by the average ratiofor electricity production in the economy.
Complications in interpreting energy intensity data arise from the fact that some branchesof manufacturing may be concentrated in regions of a country rich in certain kinds ofpower or heat sources, such that those branches constitute a lower energy burden on theeconomy than the indicator would suggest. Interpretation is also complicated when aparticular branch has significant internal energy resources, such as captive hydro, biofuelsor coal. There are various conventions for calculating the primary energy corresponding toelectricity produced by nuclear, hydro or geothermal sources.
It is also possible to measure total energy consumption, internal and external, for any finalproduct by using input-output tables to measure the energy embodied in materials andintermediate products. This is much more data intensive, because the input-output tablesare complex. Such tables are not produced regularly, so this approach is difficult tofollow, except at long intervals.
Units: Preferable units for measuring final energy is tonne of oil equivalent and forelectricity is kWh.
=> Output. There are different approaches for measuring output in manufacturing. Forsome purposes, physical output would be preferable, but this is not possible using theenergy consumption statistics available in many countries, and there are many sectorsfor which aggregate physical output cannot be easily defined.
There are two basic alternatives for measuring economic output. In either case, we use reallocal currency, deflated by the deflator for the sector or branch to a base year. This step is
ISED Methodology Sheets Energy Intensity in manufacturingPage 2 of4

crucial, so that the weight of each sector or branch reflects the correct weight in the baseyear. The value of output is then converted to a common international currency, usuallyUS dollars using purchasing power parities (PPP). One alternative is to calculate the totalvalue of production or shipments. This measures literally the total output from anindustry, and is defined for most countries. The other alternative is to calculate the value-added or contribution to GDP, representing only the increase in economic outputproduced by the sector or branch in question.
The total value of output tends to be more stable over time, but has the disadvantage thatit cannot be aggregated to total output, because of double counting: inputs to one branchmay be the outputs of another branch. Value added can be aggregated, but may havegreater fluctuations from year to year if input costs or output prices change, which iscommon for many basic raw materials, particularly crude oil. Unfortunately, there is nosimple correspondence between the two measures of output.
Unit: Constant international US dollars. Market value of output in real local currencydeflated to a base year using GDP deflators. Local currency is converted to US dollars,using purchasing power parity for the base year.
(c) The Indicator in the DSR Framework: This indicator is assigned as an Indirect DrivingForce indicator of the Economic dimension.
(d) Limitations of the Indicator:
The aggregate indicator for the manufacturing sector reflects both the energy intensity of variousbranches of manufacturing and the composition of the manufacturing sector. Changes in theaggregate indicator can therefore be due either to changes in energy intensity or to changes inrelative branch output. Similarly, differences between countries may be due either to differencesin energy efficiency or differences in the structure of the manufacturing sector. A country withlarge energy-intensive industries, such as pulping, primary metals or fertilizers, for example, willhave a high energy intensity, even if the industry is energy efficient. For this reason, it isdesirable to disaggregate energy intensity by branch of manufacturing.
Detailed calculations such as total energy consumption for particular products, using input-output tables, while desirable, are very data intensive and difficult to update regularly.
(e) Status of the Methodology: The methodology is in use in many developed countries.
(f) Alternative Definitions/Indicators: In the context of climate change, it has becomeincreasingly desirable to convert energy consumption to carbon emissions per unit of production.The fuels consumed can be converted to carbon emissions using IPCC coefficients. Carbonemissions will therefore change both with changes in energy efficiency and changes in fuel type.
4. ASSESSMENT OF DATA
(a) Data Needed to Compile the Indicator:(i) Energy consumption by manufacturing sector;(ii) Electricity consumption by manufacturing sector;(iii) Real output of the sector.
(b) National and International Data Availability and Sources:The United Nations compiles value added at the two or three digit level for developed anddeveloping countries. Value added in manufacturing at the three and four digit ISIC level for most
ISED Methodology Sheets Energy Intensity in manufacturingPage 3 of4

OECD countries is now compiled by OECD as part of its STAN data base. The EuropeanUnion produces data on value added at the two and three-digit level in the NACE system, andsuitable bridges exist to translate NACE into ISIC.
One persistent data problem at the aggregate level is distinguishing between "industry" (ISIC C,D, F and even E) and manufacturing (ISIC D). Some countries also lump agriculture, forestry andfishing (ISIC A, B) in the aggregate "industry" classification. For these reasons, it is stronglyrecommended that data be checked to ascertain exactly what sectors are covered. Manufacturingis the preferable aggregate, since inclusion of the other sectors mentioned can distort time seriesanalysis and comparisons among countries.
(c) Data Reference:
IEA: Energy Balances of Member Countries and Energy Balances of non-Member Countries,annually;
Eurostat: Energy Balances;
The Latin American Energy Organization /Organizacion Latinoamericana de Energia (OLADE);
Asia Pacific Energy Research Centre (APERC);
UN: Industrial Statistics, National Accounts;
OECD: STAN database (structural analysis database);
EU: NACE system.
5. AGENCIES INVOLVED IN THE DEVELOPMENT OF THE INDICATOR(a) Lead Agency: The lead agency is the International Energy Agency (IEA).
(b) Other Contributing Organizations: OECD and IEA have collected detailed value addedand energy consumption data at the four-digit level in the ISIC database. Less detailed two-digitdata are also available. IEA now collects two-digit energy consumption data for manufacturing forabout half of the developing countries as well.
6. REFERENCES
(a) Readings:
Energy Policy, June/July 1997 issue, Elsevier Science Limited, various articles in this issuediscuss the physical and monetary measures of output and various problems associated withindicators of manufacturing energy use and intensity.
Phylipsen, G.J.M, Blok, K., and Worrell, E., 1997. Handbook on International Comparison ofEnergy Efficiency in the Manufacturing Industry. Utrecht: Dept. of Science, Technology, andSociety.
IEA, 1997. Indicators of Energy Use and Energy Efficiency. Paris: OECD.
(b) Internet site:
International Energy Agency: http://www.iea.org
World Bank: http://www.worldbank.org/data
ISED Methodology Sheets Energy Intensity in manufacturingPage 4 of4

ENERGY INTENSITY: AGRICULTUREDimension
EconomicAgenda 21
Chapter 4: Changing Consumption andProduction Patterns;
Chapter 14: Promoting SustainableAgriculture and Rural Development
Placement in the CSD Theme/Sub-theme Set
None
1. INDICATOR (#9-2)
(a) Name: Energy Intensity: Agriculture.
(b) Brief Definition: Energy consumption per unit of agricultural output.
(c) Unit of Measurement: Tonne of oil equivalent (toe) of final energy and kWh of electricityper unit of output in agricultural sector converted to constant international US dollars usingpurchasing power parity rates (toe/1000$ and kWh/$).
(d) Correspondence with other ISD Sets:
OECD
None
EU/EUROSTAT
None
UN-DSD/DESA Provisionallist for Chapter 4
Energy intensity of agriculture
2. POLICY RELEVANCE:
(a) Purpose: The agriculture is an important consumer of energy. The purpose of theindicator is to provide a measure of the efficiency of energy use in the sector that can be used foranalyzing trends, particular in non-commercial energy consumption, and making internationalcomparisons in energy efficiency.
(b) Relevance to Sustainable/Unsustainable Development: Energy is essential for mosthuman activities, including agriculture. The availability of energy is a key factor to increaseagricultural productivity and to achieve food security and improve rural livelihoods Too littleenergy makes it difficult to realize decent productivity and meet food requirements. Too muchenergy signifies waste, global warming, and other stress on the environment. The indicator canguide policies and investments regarding (i) energy requirements in all stages of agriculturalproduction in order to measure agricultural productivity and, (ii) energy efficiency, to reduceenergy intensity. The indicator is relevant to promote an increase in energy efficiency in order toreduce fossil fuel consumption, greenhouse gas emissions and air pollutant emissions with aparallel increase in agricultural production. Renewable energies such as solar, wind and bioenergycan contribute strongly, together with other environmental technologies, to increased labourefficiency and diversified economic activities in rural areas.
It is worth to note, that the specific functions of agriculture as an energy producer andagroecosystem regenerator is an other essential component of sustainability.
(c) International Conventions and Agreements: No binding agreements exist. Agenda 21makes reference to the need to promote energy efficiency.
(d) Linkages to other indicators: This indicator is one of a set for energy intensity indifferent sectors (manufacturing, transportation, agriculture, commercial/services and residential),
ISED Methodology SheetsAgriculture
Energy Intensity in
Page 1 of4
with the indicator for energy use per unit of GDP as an aggregate energy intensity indicator.Also, it is linked to indicators for shares of sectors in value added, total energy, non-commercialenergy and electricity consumption, greenhouse gas emissions, and air pollutant emissions.
(e) International Targets/Recommended Standards: No international targets exist or apply.At the national level targets could be developed, depending on the country's range of agriculturalproducts.
3. METHODOLOGICAL DESCRIPTION
(a) Underlying Definitions and Concepts: Energy consumption per unit of value added isone way of measuring energy requirements and energy efficiency in the agricultural sector. Whileenergy consumption per unit of physical output is a better indicator of energy efficiency inspecific agricultural processes, energy use per unit of economic output is more useful both forrelating energy efficiency to economic activity and for aggregating and comparing energyefficiency across agricultural sectors or across the entire economy. Total energy consumption inagriculture derives from the energy inputs in all the stages of agricultural production andprocessing, that is land preparation, mechanization, fertilization, irrigation, harvesting, transport,processing, and storage. Each of these stages use different forms of energy (mechanical, electrical,thermal) which can be aggregated in equivalent units. Total agricultural production is anestablished concept and needs no further elaboration.
(b) Measurement Methods:
Energy Use: Annual energy inputs for each stage in agricultural production and processing aredetermined and converted into equivalent units and aggregated as total energy. Annual agriculturalproduction figures are collected for all products. Energy use is usually measured at the point ofconsumption, i.e., the farm, factory or establishment. "Own energy" (including internal use ofhydropower, biofuels, or internal waste heat) should be combined with purchased energy atuseful heating values.
Units: Preferable units for measuring final energy is metric ton (tonne) of oil equivalent (toe) ofoil equivalent and for electricity is kWh.
Output. Net economic output is measured in agriculture value added (ISIC, Division A). Sectorcomprises crops and livestock production, agricultural services and both forestry andfishing/hunting/trapping. For some purposes, disaggregated physical output would be preferable,and such statistics are provided by FAO. But it is not possible to find out the energyconsumption in various forms of agricultural activities, which is required for evaluation ofspecific energy intensities.
Unit: Constant international US dollars. Market value of output in real local currency deflated toa base year using GDP deflators. Local currency is converted to US dollars, using purchasingpower parity for the base year.
(c) Limitations of the Indicator: The aggregate indicator for the agricultural sector (ISIC,Division A; groups 01,02,07,08,09) reflects the energy intensity of various agricultural activities(crop and livestock productions, forestry, fishing, etc.) Changes in the aggregate indicator cantherefore be due either to changes in energy intensity or to changes in relative activity output.Similarly, differences between countries may be due either to differences in energy efficiency ordifferences in the structure of the agricultural sector.
Agricultural production is affected by factors other than energy inputs (for example, climate,ISED Methodology Sheets Energy Intensity inAgriculture
Page 2 of4
availability of other inputs). These factors are less distorting if comparative values are collectedfor consecutive years. Data for energy use in agriculture at the present time are not considered tobe very reliable. Special surveys could generate sound data, but would be expensive, and may notbe a priority for statistical agencies.
(d) The Indicator in the DSR Framework: This indicator is an Indirect Driving Force ofEconomic dimension. It can guide a response action especially if normative targets for increase ofagricultural production or energy intensity are established.
(e) Status of the Methodology: The methodology is in use in many developed countries.
(f) Alternative Definitions/Indicators: Alternative indicator is energy intensity per unit ofphysical output. While data for production is available it is problematic to find data on energyconsumption disaggregated for specific form of agricultural activities. The indicator includescombustible renewable and waste (CRW) but not such non-commercial energy inputs, as humanand animal power. Human power quantification methodologies might need to be furtherelaborated. The relevance of this alternative to sustainable development is questionable.
In the context of climate change, it has become increasingly desirable to convert energyconsumption to carbon emissions per unit of production. The fuels consumed can be convertedto carbon emissions using IPCC coefficients. Carbon emissions will therefore change both withchanges in energy efficiency and changes in fuel type.
4.ASSESSMENT OF DATA
a) Data Needed to Compile the Indicator:(i) Total final energy consumption by agricultural sector;(ii) Electricity consumption by agricultural sector;(iii) Real output (value added) of the sector.
(a) National and International Data Availability and Sources: Some data are available formost countries, although reliable and comprehensive statistics to enable time-series analysis areelusive. Agriculture value added and physical outputs are compiled by World Bank. Agriculturalproduction figures are available from agriculture ministries. The Food and AgricultureOrganization (FAO) has processed and compiled considerable data in agricultural sector outputsin physical terms. The United Nations compiles value added at two and three digit level inagricultural sector. The Energy Balances of the IEA include energy consumption in agriculture.Energy balances are prepared by energy ministries or other competent national authorities
Data Reference:
IEA: Energy Balances of Member Countries and Energy Balances of non-Member Countries;annually
Eurostat: Energy Balances;
The Latin American Energy Organization /Organizacion Latinoamericana de Energia (OLADE);
World Bank: World Development Indicators 2000 and 2001,
FAOSTAT 2001 CD-ROM. FAO Statistical Databases. Bases de Donnees
FAO (2001), Statistiques de la FAO. Bases de Datos Estadisticos de la FAO.
ISED Methodology Sheets Energy Intensity inAgriculture
Page 3 of 4

5. AGENCIES INVOLVED IN THE DEVELOPMENT OF THE INDICATOR
(a) Lead Agency: The lead agency is the Food and Agricultural Organization (FAO). Thecontact point is the Assistant Director-General, Sustainable Development Department, FAO; faxNo. (39 6)5225 3152.
(b) Other Contributing Organizations: The United Nations Development Programme(UNDP), The World Bank, and UN Regional Commissions could be involved in furtherdevelopment of this indicator. OECD and IEA have collected detailed value added and energyconsumption data of OECD counties. IEA now collects data on energy consumption by anagricultural sector of many non-OECD countries as well.
6. REFERENCES
(a) Readings:
FAO (1988): Energy conservation in agriculture. Report and proceedings of technicalconsultation, Helsinki (Finland),". CNRE Bulletin 23.
FAO and African Development Bank (1995): Future Energy Requirements for Africa'sAgriculture.
FAO (1995): State of Food and Agriculture.
WEC: World Energy Council Developing Country Committee Publications (1993-1998).
FAO (1995): Forests, Fuels and the Future - Wood energy for sustainable development., FAOForestry Topics, Report No.5.
(b) Internet site:
Food and Agricultural Organization of the UN: http://www.fao.org
International Energy Agency: http://www.iea.org
World Bank: http://www.worldbank.org/data
ISED Methodology Sheets Energy Intensity inAgriculture
Page 4 of4

ENERGY INTENSITY: COMMERCIAL&SERVTCE SECTORDimension
Economic
Agenda 21
Chapter 4: Consumption andProduction Patterns
Placement in the CSD Theme/Sub-theme Set
Consumption and ProductionPatterns/ Energy Use/ Intensity of
Energy Use: Commercial &services
1. INDICATOR (#9-3)
(a) Name: Energy Intensity in Commercial & Service Sector.
(b) Brief Definition: Energy consumption per unit of commercial & service sector (valueadded) output.
(c) Unit of Measurement: Tonnes of oil equivalent (toe) of final energy and kWh ofelectricity per unit of output in commercial & service sector converted to constant internationalUS dollars using purchasing power parity rates (toe/1000$ and kWh/$).
(d) Correspondence with other ISD Sets:
OECD EU/EUROSTAT
MPTMSE: Energy Intensity of commercial&services (ECON12)
UN-DSD/DESA Provisionallist for Chapter 4
Energy intensity of services
2. POLICY RELEVANCE:
(a) Purpose: This indicator is used to monitor trends in energy consumption in thecommercial/service sector, which is the largest sector of most economies.
(b) Relevance to Sustainable/Unsustainable Development: The service sector is less energyintensive than manufacturing, and the growth of the sector relative to manufacturing contributesto the long-term reduction in the ratio of total energy consumption to GDP. The sector,however, is a large consumer of electricity, generation of which contributes to many local orglobal environmental problems. In general sustainable development requires increases in energyefficiency in order to reduce fossil fuel consumption, greenhouse gas emissions and related airpollution emissions.
(c) International Conventions and Agreements: There are no international agreements. Somecountries are promulgating energy-efficiency standards for lighting, office equipment or otherdevices, while others are negotiating voluntary agreements to reduce energy consumption persquare meter of floor space.
(d) International Targets/Recommended Standards: There are no international targets orstandards. Many industrialized countries have previously set targets for reducing the space-heating component of service-sector energy consumption per unit of floor area. Now, manycountries are trying to reduce electricity consumption for cooling, lighting, and informationsystems.
(e) Linkages to other indicators: This indicator is one of a set for energy intensity in differentsectors (manufacturing, transportation, agriculture, commercial&service and residential), with theindicator for energy use per unit of GDP as an aggregate energy intensity indicator. The indicatoris also linked to indicators for total energy and electricity consumption, greenhouse gasemissions, and air pollutant emissions.
Energy Intensity in commercial & serviceISED Methodology Sheetssector
Page I o f 5

3. METHODOLOGICAL DESCRIPTION
(a) Underlying Definitions and Concepts: Energy consumption per unit of value added or perunit of floor area in the commercial/service sector is one way of measuring energy requirementsand trends in the sector. As with the manufacturing sector, the commercial/service subsectors arediverse and difficult to classify. They include subsectors that require a great deal of electricity perunit of output (retail trade), those that use large quantities of fuel for water and space heating(health care establishments), and those that by their nature consume little energy (warehousing,parking). Energy efficiency in this sector is more directly related to the efficiency of generalenergy services (lighting, ventilation, computing, lifting, etc.) than to the efficiency of theparticular sectoral activities. But there are almost no data on actual energy service outputs perunit of energy input (lumens of light, cubic meters of air moved, computing power or use, tonnesraised in lifts, etc.). Hence, the usual measure of energy intensity, toe per unit of output ineconomic terms (toe /1000$), can be a useful indicator provided it is clear that this summarizesmany processes and types of buildings. Because of the differences in processes, it is veryimportant to separate electricity from fossil fuel and purchased heat.
It is often difficult to measure and interpret energy intensities per unit of value added withinsubsectors (private services, public service, etc.) because different activities often take place inthe same building, hence, the real partition of energy use between activities is uncertain. In suchcases, intensities expressed per unit area disaggregated by building type may be more easilyrelated to real energy efficiencies. However, these have the similar problem that a variety ofactivities may take place in a particular type of building. A hospital, for example, will containspace for food preparation or laundry services, as well as for health care.
Energy consumption per unit of value added is one way of measuring energy requirements andenergy efficiency in commercial sector. While energy consumption per unit of physical output isa better indicator of energy efficiency in specific commercial sector processes, energy use per unitof economic output is more useful both for relating energy efficiency to economic activity and foraggregating and comparing energy efficiency across commercial sector or across the entireeconomy.
(b) Measurement Methods:
=> Energy Use: Energy Consumption (plus district heating) and electricity intensities recordedseparately Energy consumption is usually measured at the point of use, i.e., the building orenterprise. Data for buildings must be collected through surveys of building owners, operators,or tenants, while data for enterprises are usually collected through the enterprise's normalaccounting of expenditures or consumption of energy. Note, however, that the correspondencebetween enterprise and building type can be very loose.
In a few countries, energy consumption in buildings is measured or imputed by surveys of actualbuildings (United States, France and Japan, and Sweden for space and water heating only). Wherethese data exist, they can be used to represent real efficiencies. Heating energy consumption persq. meter of floor area heated is an important example of such a measure. Electricity use per sq.meter is important to measure, but it is difficult to disaggregate into heating, cooling, waterheating/cooking, lighting, etc., without recourse to detailed surveys. Some colder countries (e.g.,Norway) have very high energy intensities, which are clearly dominated by electric heating, while
ISED Methodology Sheets Energy Intensity in commercial & servicesector
Page 2 of 5

others (e.g., Canada, Finland) have very high intensities, yet do not have much electric spaceheating. Similarly, warmer countries have substantial amounts of space that are fully air-conditioned. For many countries, the amount of air-conditioned space is unknown.
Despite all these uncertainties, fuel intensities give useful indicators of space/waterheating/cooking on the one hand and electricity services on the other. Primary energy use shouldbe used to aggregate electricity and fuel consumption (see methodology for manufacturing sector).
Units: Preferable units for measuring final energy is tonne of oil equivalent and for electricity iskWh.
Output. There are different approaches to measuring output in the commercial/service sector,with value added as the most direct measure of economic output. However, for estimating energyefficiency, physical area is preferred because most energy services (heating, cooling, lighting, etc.)are related to the floor area and size of the building. Surveys of floor area by building type havebeen carried out in many IE A countries. Often, the building type is specifically related to theactivity of the enterprise, e.g., school (education), hospital (health care), or restaurant (foodservices). However, in many cases, particularly for offices and restaurants, buildings contain amix of activities and enterprises, each with its own energy system and with considerablydifferent energy use patterns.
Unit: Constant international US dollars. Market value of output in real local currency deflated toa base year using GDP deflators. Local currency is converted to US dollars, using purchasingpower parity for the base year. For floor area, sq. metres of built space is usually the unit, but insome colder countries, sq. meters of occupied or heated space is recorded. The difference, whichcan be significant (up to 10%), reflects unheated spaces, garages and stairwells, etc.
(c) The Indicator in the DSR Framework: This indicator is assigned as an Indirect DrivingForce indicator of the Economic dimension.
(d) Limitations of the Indicator:
(e) Status of the Methodology: The methodology is in use in many developed countries.
(f) Alternative Definitions/Indicators: An alternative indicator is energy consumption relativeto floor area (in sq. meters), which is a good measure of the total amount of physical activity forthe sector.
In the context of climate change, it has become increasingly desirable to convert energyconsumption to carbon emissions per unit of production. The fuels consumed can be convertedto carbon emissions using IPCC coefficients. Carbon emissions will therefore change both withchanges in energy efficiency and changes in fuel type. Since in many countries more than half ofall final energy consumed in this sector may be in the form of electricity, accounting for theemissions from electricity generation is extremely important.
4. ASSESSMENT OF DATA
(a) Data Needed to Compile the Indicator:
(i) Energy consumption by commercial sector
(ii) Electricity consumption by commercial sector
(iii) Real value added of the sector; and/orISED Methodology Sheets Energy Intensity in commercial & servicesector
Page 3 of 5

(iv) Built areas or occupied space (sometimes, heated space).
(b) National and International Data Availability and Sources: Value added or GDP in one-digit service sector branches is available for almost every country. More detailed data exist forOECD countries, both from national sources and from the OECD national accounts.
Energy consumption data at the sector-wide level are available from almost all OECD countriesand most others, but there are some important caveats. First, one must check the residentialsector data from the same source to determine whether liquid and solid fuels have been dividedbetween these sectors. In many of the IEA time series, this division is not done, and one sector orthe other has all of the liquid or solid fuels. For developing countries, this split is a problem forgas as well, which is often entirely allocated to either residential use or services rather than beingsplit.
Second, one must ascertain whether the commercial/service sector contains data from othersectors. Data from Germany for the sector ("Kleinverbraucher") contained significant amounts ofboth agriculture and construction through the early 1990s. Other countries may include streetlighting and even non-energy utilities like water and waste disposal. Some countries include otheritems that cannot be classified elsewhere.
Reliable time-series energy data disaggregated at the subsectoral level exist for only a fewcountries, namely, the United States, France, Japan, and Sweden (heating only).
IEA sent a questionnaire to OECD countries asking for data on floor area and energy use, but fewresponses on floor area were received. The IEA will pursue this and expects to report data forfloor area in its future energy indicators.
(c) Data Reference:
IEA: Energy Balances of Member Countries and Energy Balances of non-Member Countries,annually;
Eurostat: Energy Balances;
The Latin American Energy Organization /Organizacion Latinoamericana de Energia (OLADE);
Asia Pacific Energy Research Centre (APERC);
UN: Industrial Statistics, National Accounts;
OECD: STAN database (structural analysis database);
EU: NACE system.
5. AGENCIES INVOLVED IN THE DEVELOPMENT OF THE INDICATOR
(a) Lead Agency: The lead agency is the International Energy Agency (IEA).
(b) Other Contributing Organizations: None.
6. REFERENCES
(a) Readings:Krackeler, Tom and Lee Schipper, 1998. "Carbon Dioxide Emissions in OECD Service Sectors.The Critical Role of Electricity use". Energy Policy (February).
ISED Methodology Sheets Energy Intensity in commercial & servicesector
Page 4 of 5

Schipper, L., and Steve Meyers, 1986. "Energy Use in the Service Sector. An InternationalComparison". Energy Policy (June).
Meyers, S., Ed., 1986. Electricity Use in the Service Sector. Report of An InternationalWorkshop. Palo Alto, CA: Electric Power Research Institute
(b) Internet site:International Energy Agency: http://www.iea.org.
ISED Methodology Sheets Energy Intensity in commercial & servicesector
Page 5 of 5

ENERGY INTERSITY: TRANS PORTATIONDimension
EconomicAgenda 21
Chapter 4: Consumption andProduction Patterns
Placement in the CSD Theme/Sub-theme Set
Consumption and ProductionPatterns/ Energy Use/ Intensityof Energy Use: Transportation
1. INDICATOR (#9-4)
(a) Name: Energy intensity in transportation.
(b) Brief Definition: Energy consumption for transportation per unit of transportation sectoroutput and relative to the amount of freight or passengers carried and the distance traveled.
(c) Unit of Measurement: toe of final energy and kWh of electricity per unit of output intransportation sector converted in constant international UD dollars using purchasing powerparity rates (toe/1000$ and kWh/$); goe and kWh per tonne-kilometer (goe/tonne-km, kWhAonne-km) for freight; and goe and kWh per passenger-kilometer (goe/passenger-km and kWh^assen^r-km)for passengers.
(d) Correspondence with other ISD Sets:
OECD
IIECEP: Energy intensity/ transport
EU/EUROSTAT
MPTMSE: Energy Intensityof transport (ECON12)
UN-DSD/DESA Provisionallist for Chapter 4
Energy intensity of transport
2. POLICY RELEVANCE:
(a) Purpose: Transportation is a major consumer of energy, mostly in the form of fossil fuels, andtheshaie of transportation in energy consumption is generally increasing. The indicator is a measureof how efficiently energy is used for moving goods and people. The indicator can be used to monitortrends in energy consumption for transportation and for international comparisons. Separation offreight and passenger travel is essential.
(b) Relevance to Sustainable/Unsustainable Development: Transportation serves economicand social development through distribution of goods and services and through personal mobility.However, energy consumption for transportation also leads to air pollution and climate change.Reducing energy intensity (increasing energy efficiency) in transportation can reduce theenvironmental impacts of transportation while maintaining the economic and social benefits.
(c) International Conventions and Agreements: Many industrialized countries havetar^ts forreducing energy use and carbon emissions from transportation, for which these energy intensities arekey indicators. UNFCCC and its Kyoto Protocol. The European Union voluntary agreement ongreenhouse gas (GHG) emissions from automobiles (to which Japanese and Korean producers havealso agreed) require reductions in GHG emissions per kilometer from new automobiles
(d) Linkages to other indicators: This indicator is one of a set for energy intensity in differentsectors (manufacturing, transportation, commercial/services and residential), with the indicator forenergy use per unit of GDP as an aggregate energy intensity indicator. These indicators are also linkedto indicators for total energy consumption, greenhouse gas emissions, and air pollution emissions.This indicator is also linked to both the indicator for distance traveled per capita by means oftransport and indicator for freight transport activity.
(a) International Targets/Recommended Standards: Many industrialized countries have

targets for reducing energy use and carbon emissions from transportation, for which these energyintensities are key indicators.3. METHODOLOGICAL DESCRIPTION
(a) Underlying Definitions and Concepts: Energy consumptions per unit of transportationsector output and per unit of activity are a key measure of how efficiently transportation systemsconvert energy into human mobility and goods distribution. As for activity because it is notmeaningful to add freight and passenger travel, these types of transportation must be disaggregated.Separating the two activity measures is generally not difficult, but separating the energy consumptionis often complicated
(b) Measurement Methods:=> Energy Use: Energy consumption should be measured for each kind of vehicle, includingtwo-wheelers, automobiles, busses, small trucks, heavy trucks, and miscellaneous road vehicles, aswell as trains, ships and aircraft for domestic transport, and even pipelines. In general, however,national energy balances are only disaggregated by fuel and broad traffic type: road, rail, water, airand pipeline. Considerable work is required to disaggregate road fuels consumed by vehicle type.It is important to take into account the different energy content and carbon emissions in differentfuels and not simply add the weights or volumes of different fuels consumed (e.g., tonnes, or cubicmetres in the case of natural gas). International air or marine transportation should not be included.Electric power consumption for rail, subway and trams, as well as electric road vehicles, should beconverted to primary energy consumption, although there is no standard method for suchconversion.
=> Output or Activity: Transportation sector output is measured as a fraction of GDP valueadded in real US dollars. Concerning activity there are two different measures. Vehicular activity,in vehicle-km, provides a measure of traffic that is important for transport policy and road andinfrastructure planning. Most often these data can be divided further into basic vehicle types.However, economic and human activity is better measured in passenger-km and tonne-km, takinginto account utilisation or load factors. A bus carrying 20 passengers for 10 km (200 passenger-km) is less energy intensive (more energy efficient) than the same bus carrying 5 passengers forthe same distance (50 passenger-km). Similarly, a fully-loaded truck is less energy intensive thanthe same truck carrying a partial load.
In passenger travel it is meaningful to distinguish separately both the distance travelled by urbanpublic transport and share of electricity driven vehicles in urban public transport.
=> Indicators:
i) Vehicle Intensities: Energy consumption per vehicle-km by vehicle and fuel type is animportant indicator, as many standards for air pollution (and more recently, goals for CO2
emissions reduction) are expressed in terms of vehicle characteristics, i.e., emissions pervehicle-km.
ii) Modal Intensities: Energy use per passenger-km or tonne-km should be disaggregated byvehicle type, i.e., two-wheeler, car/van, bus, air, local and long-distance rail, subway, tram,ship or ferry for passengers; and truck, rail, ship, air pipelines for freight.
ISED Methodology Sheets Energy intensity in transportation

Note: Aggregate energy intensity for travel or freight is a meaningful summary indicator, thevalue of which depends on both the mix of vehicles and the energy intensities of particular typesof vehicles. The energy intensities of public train and bus transportation per passenger-km arecommonly 60 to 80 per cent less than the energy intensities for cars or air transportation. Forfreight, rail and ship transportation are commonly 65 to 90 per cent less than the energy intensivefor trucking per tonne-km. These differences between modes are of the same order of magnitudeas the differences between the lowest and highest energy intensities of transportation within eachmode. It should also be noted that fuel consumption per vehicle-km also depends on trafficconditions as well as vehicle characteristics.
The energy intensity for a vehicle type depends on both capacity and capacity utilisation. A largevehicle that is fully loaded generally has a lower energy intensity per tonne-km than a fully-loadedsmaller vehicle, but a small vehicle fully loaded will have a lower energy intensity than a largevehicle with the same load. Typical load factors for private cars are 1.5 people per car. Typicalload factors for rail and bus vary from well below 10 per cent (e.g., United States city busses onaverage) to over 100 per cent of nominal capacity at peak times, and in many developing countriesduring most of the day. Typical load factors for trucking might be 60 to 80 per cent of weightcapacity when loaded, but trucks commonly run 20 to 45 per cent of their kilometers empty,yielding a relatively low overall load factor. Under-utilized transport capacity means morepollution and road damage (and other impacts) per unit of transport service delivered, hencecapacity utilisation itself is an important indicator of sustainable transportation.
(c) The Indicator in the DSR Framework: This indicator is assigned as an Indirect DrivingForce indicator of Economic dimension.
(d) Limitations of the Indicator: Data availability may limit the disaggregation of the indicatorto the desired level. Considerable work is often required to disaggregate energy balances intovarious modes of transportation.
Some countries' transportation energy statistics include fuel consumed by domestic airlines orshipping lines in international transportation. Efforts should be made to exclude suchtransportation and energy consumption from the indicators.
(e) Status of the Methodology: The methodology is in use in many developed countries.
(f) Alternative Definitions/Indicators: An alternative, simpler, broad measure of eneigyintensity for transportation could be average fuel consumption per vehicle for all vehicles, but theresults would be strongly influenced by the mix of vehicles, which varies enormously among countriesand over time. In particular, it would be influenced by the number of two- and three-wheelers.
4. ASSESSMENT OF DATA
(a) Data Needed to Compile the Indicator:(i) Eneigy consumption by mode of transportation, vehicle type and fuel;(ii) Share of transportation sector output in GDP value added;(iii) Distance traveled by vehicles, passengers and freight, including load factors;(iv) Distance traveled by urban public transport and a share of electrically driven vehicles in that.
(b) National and International Data Availability and Sources: Eneigy useby fuel type in eachbranch of road transport, rail, ship, and air transport is published by most transport ministries in
ISED Methodology Sheets Energy intensity in transportation

OECD countries. Natbnal energy balances (as well as present IEA/OECD Energy Statistics) do notdisaggregate road transport by mode. Few sources of energy data separate fuel consumption for railor shipping into that for passengers and that for freight, but national or private rail and shippingorganizations often do this. Energy consumption for local electric transport (commuter rail, subways,trams) is often published separately by national authorities.
Eurostat is a lead agency for collecting data on vehicle, passenger, and tonne-kilometers in Europe.Ministries of Transport in the United States, Canada, Japan, Australia and other countries, oftenthrough their statistical agencies, publish similar data In developing and transitional countries, fewerdata are available.
(c) Data Reference: Eurostat: Transport Annual Statistics
5. AGENCIES INVOLVED IN THE DEVELOPMENT OF THE INDICATOR
(a) Lead Agency: International Energy Agency
(b) Other Contributing Organizations: None
6. REFERENCES
(a) Readings:
Schipper, L. andMarie-Lilliu, C , 1999. Carbon Dioxide Emissions from Transport in IEA countries:Recent lessons and long-term Challenges. KFB M eddelande 1999:11. Stockholm.Schipper, L.,Figueroa. M.J., Price, L.,andEspey. M., 1993. "Mind the Gap: The Visdous Circle ofmeasuring automobile fuel use". Energy Policy (October).Samaras. Z.? et al. 1999. Study on Transport Related Parameters of the European Road Vehicle Stock.Prepared for Eurostat andDG-7. Thessalonikai: Laboratory of Applied Thermodynamics, AristotleUniversity.
Schpper, L., and Tax, W., 1994. "Mind the Gap". Transport Policy.
(b) Internet site: IEA: http://www.iea.org:
EU, General Directorate Transport & Energy:http://europa.eu.int/comm/dgs/energy transport/index en.html
ISED Methodology Sheets Energy intensity in transportation
ENERGY INTENSITY: RESIDENTIAL SECTORDimension
Economic
Agenda 21
Chapter 4: Consumption andProduction Patterns
Placement in the CSD Theme/Sub-theme Set
Consumption and ProductionPatterns/ Energy Use/ Intensity of
Energy Use: Residential Sector
1. INDICATOR (#9-5)
(a) Name: Energy Intensity in the Residential Sector.
(b) Brief Definition: Amount of energy used per person or household and for space heating perunit of home area in the residential sector.
(c) Unit of Measurement: toe of final energy andkWh of electricity per capita or per household;toe of energy used for sp ace heating p er unit of home area
(d) Correspondence with other ISD Sets:
OECD
IIEC EP: Energy intensity:residential
EU/EUROSTAT
Intensity of energy use in households(EC0N12)
UN-DSD/DESA Provisionallist for Chapter 4
Total energy per household
2. Policy Relevance
(a) Purpose: The indicator is used to monitor energy consumption in the residential sector.
(b) Relevance to Sustainable/Unsustainable Development: The residential sector is a majorconsumer of energy with a distinctive pattern of usagp. Reducing energy consumption contributes toreducing air pollution and climate change. Many policies addressing energy efficiency and savingshave been formulated for this sector. In colder countries, for example, the space heating componenthas been the focus of many energy-saving policies, while in almost all countries, the electric-appliance and lighting component is still the focus of many policies.
(c) International Conrentions and Agreements: None specifically for this sector.
(e) International Targets / Recommended Standards: None as such. However, thermalstandards for new homes are in effect in almost all OECD and Eastern European countries, Chinaand some other countries in colder climates. Efficiency standards for boilers are also important inmany countries. Efficiency standards on new electrical appliances are important in the United Statesand indirectly in Canada, and voluntary programmes have been important in Japan and Europe.
(f) Linkages to Other Indicators: This indicator is one of a set for energy intensity in differentsectors (manufacturing, transportation, commercial/services and residential), with the indicator forenergy use per unit of GDP as an aggregate energy intensity indicator. These indicators are alsolinked to indicators for home area per capita, total energy and electricity consumption, greenhousegas emissions, and air pollutant emissions.
3. Methodological Description
(a) Underlying Definitions and Concepts: Household or residential energy use encompassesenergy used in residential buildings, including urban and rural free-standing houses, apartmentdwellings, and most collective dwellings such as dormitories and barracks. These energy usesISED Methodology Sheets Energy intensity in residential sector
Page 1 of4
typically include cooking, water heating, space heating and cooling, lighting, major appliances forrefrigeration, washing and drying, TV and communications, computers, conveniences like foodmachines, vacuum cleaners, etc, as well as a myriad of small appliances. Household or residentialenergy use should exclude energy for farm processes, small businesses or small industry. Thehousehold sector must be separated from the commercial/services sector, although data for manyIEA countries did not separate these two sectors in the past. The energy sources should include notonly commercial (purchased) eneigy, but also gathered (non-commercial) energy such as fuelwood orother biomass and miners' coal The electricity is to be distinguished separately.
(b) Measurement Methods:• EneigyUse: Purchased energy for residences/households is usually recorded in the energy
statistics of a country with data provided by electric, g^s, or heat utilities according to customerdefinitions that correspond to "households". Data on purchases of LPG, other oil products, coalor similar fuels and wood are not always recorded correctly since suppliers may not know whereor how these fuels are being used
Alternatively, household/residential energy use can be measured through household surveys. Themost direct surveys collect detailed information on both fuels consumed and energy-consumingequipment owned or used The most accurate surveys also obtain permission from households toask energy suppliers for quantities consumed, or they leave fuel-use diaries for households to recordwhat they consume. They measure usa^ in a variety of appliances and in heating equipment usingminiature data loggprs. Less detailed surveys estimate the use of each fuel for each major purposethrough regression analysis over a largp number of households.
Unit: Energy is measured in tonne of oil equavalent (toe) (net calorific value). In most cases,electricity and purchased heat are counted at final or delivered value. Electricity consumption itselfis counted in kWh. In some cases, primary energy is recorded. (See methodology for manufacturingsector.)
• Residential unit: Energy consumption is calculated on a per capita or per householdbasis. In general, energy consumption depends both on the physical size and characteristicsof the dwelling and on the number of people. As the number of people in a householddeclines, energy consumption per household declines, while the energy consumption percapita increases. As a rule of thumb, energy use for water heating, cooking and manyappliances tends to vary with the square-root of household size.
For developing countries with large rural sectors or large numbers of homes without access toelectricity, the share of homes in the urban sector and the share in each sector connected to gridelectricity is an important factor in total residential energy consumption. The shares of homesusing different kinds of CRW are also important.
(c) The Indicator in the DSR Framework: The indicator is assigned as an Indirect DrivingForce of Economic dimension.
(d) Limitations of the Indicator: When energy consumption by end-use is not known, energyuse per household is a valuable indicator of energy intensity, but it does not measure energyefficiency. Some important conclusions can be drawn, however, if the average wintertemperature, ownership of energy-consuming appliances, and dwelling size are known. In acountry with cold winters and high penetration of central heating systems, a low total
ISED Methodology Sheets Energy intensity in residential sectorPage 2 of4
consumption of energy for all purposes, relative to total home (floor) area and the severity ofwinter climate, probably implies efficient heating practices. Conversely, high energy use relativeto floor area in a country with mild winters may imply inefficiencies. However, since energyconsumption habits vary so much, both among countries and among end-uses, few conclusionsabout "efficiency" can be drawn from the indicator on "residential energy use per household."(See alternative definitions / indicators below.)
(e) Status of the Methodology: The indicator, with some variations in the methodology, is usedin many OECD countries. It is not widely used in developing or transitional countries.
(f) Alternative Definitions /Indicators:
• Measurement of Efficiency: A true energy efficiency can be expressed as energy use perunit of energy service. Examples of true energy efficiency would be litres of refrigeratedvolume at a given temperature divided by electricity use, lumens of light per watt of powerconsumed, or computer tera-flops per second divided by power consumption. In practice,these are not measured for large populations. Specific energy requirements for particularservices, taking into account equipment efficiency and the time the service is used, are easierto estimate since these can be summed for a given household and compared with actualconsumption.
• Output (services provided): Ideally, output units would be in energy services delivered,such as lumens of lighting, meals cooked, area and time heated, litres of hot water provided,litres refrigerated, kilogrammes of clothes washed, etc. In practice such data are rarelyavailable, even for individually metered homes. A suitable proxy for each service may beeither the area heated (or lit), the number of people in the household receiving meals or hotwater, and the average number of appliances, by type, per household or per capita.
• Energy requirements: If both energy use and equipment ownership for each major serviceis known, then specific energy requirements can be developed as follows:- Space heating: energy use per sq. meter heated floor area or per sq. meter per degree day;- Energy use per capita for water heating and cooking; and- Energy use per year for each major appliance: refrigerator, freezer, clothes washer, dryer,
dishwasher, TV, etc.
These specific energy requirements are related to, but not identical to, energy efficiencies. Theydiffer in that they do not measure accurately the service provided, since, for example, a largerefrigerator gives more service than a smaller one.
5. Assessment of Data
(a) Data Needed to Compile the Indicator:
(i) Energy use in the residential sector (as indicated in section 3(b) above)(S) Number of p op ulation and/or households(w) Home are p er cap ita.
(b) National and International Data Availability and Sources: Until the early 1980s, theresidential or household sector was not well distinguished from the commercial/service sector in amajority of OECD member country energy statistics, particularly for liquid and solid fuels. InOECD countries, this distinction is now common. In developing countries, data often distinguish
ISED Methodology Sheets Energy intensity in residential sectorPage 3 of4

residential and commercial consumption of electricity and natural gas, but users of liquid andsolid fuels are often not accurately identified. Many national energy balances thus fail todistinguish between the residential and commercial/service sectors. Such problems are indicatedwhen data show electricity and natural gas consumption for both the residential andcommercial/service sectors, while liquid and solid fuel consumption is shown for only one of thetwo sectors.
The other major challenge is to estimate the use of non-commercial fuels, such as CRW (biomass)of all kinds in developing countries. This is important in almost all developing countries, even inurban areas.
Because of these two problems, aggregate national or international statistics must be used withcaution.
Data on equipment are usually developed by electric and gas utilities, as well as by tradeassociations representing electric and gas appliance manufacturers. These have generally not beencompiled in an internationally compatible form No single agency collects all the data, except in afew IEA countries (United States, France, Netherlands) where detailed household surveys areundertaken. The World Bank has sponsored many one-time household surveys in developingcountries, focusing either on rural or urban areas. As noted above, national or private energycompanies often undertake marketing surveys. Oil industry sources in most IEA countries oftencompile data on oil-equipment sales and ownership.
(c) Data References:
IEA: Energy Balances of M ember countries, annually.Energy Statistics of non-M ember countries, annually.
5. Agencies Involved in the Development of the Indicator
(a) Lead Agency: International Energy Agency.
(b) Other Contributing Organizations: None.
6. References
(a) Readings:
Schipper, L., Ketoff, A., and Kahane, A. "Estimating Residential Energy Use from Bottom-Up,International Comparisons, Ann. Rev. Energy 10. Palo Alto CA: Ann. Revs., inc. 1985.
(b) Internet sites:
International Energy Agency: http://www.iea.org
World Bank: http://www.worldbank.org/html/fpd/energy/
ISED Methodology Sheets Energy intensity in residential sectorPage 4 of 4

FINAL ENERGY INTENSITY OF SELECTED ENERGY INTENSIVE PRODUCTSDimension
EconomicAgenda 21
Chapter 4: Consumption andProduction Patterns
Placement in the CSD Theme/Sub-theme Set
None
1. INDICATOR (#10)
(a) Name: Final Energy Intensity of Selected Energy Intensive Products.
(b) Brief Definition: Energy consumption for production of tonne of energy intensiveproducts, such as: Iron&steel, Non-ferrous metals, Chemicals, Petroleum Refining, Non-metallicminerals, Cement, and Paper&pulp.
(c) Unit of Measurement: Tonne of oil equivalent (toe) of final energy per metric tonne ofselected products (toe/tonne).
(d) Correspondence with other ISP Sets:OECD
None
EU/EUROSTAT UN-DSD/DESA Provisionallist for Chapter 4
2. POLICY RELEVANCE:
(a) Purpose: The branches manufacturing sector are major consumer of energy. This indicator isa measure of the efficiency of energy use for production of various energy intensive products.The indicator can be used for evaluating energy efficiency technological potential, analyzingtrends, and making international comparisons in energy efficiency.
(b) Relevance to Sustainable/Unsustainable Development: Sustainable development requiresincreases in energy efficiency in order to reduce fossil fuel consumption, greenhouse gasemissions and related air pollution emissions.
(c) International Conventions and Agreements: Although there are no specific internationaltargets regarding energy use or energy efficiency, many industrialized countries have targets forreducing energy use and carbon emissions from manufacturing branches.
(d) Linkages to other indicators: This indicator is linked to indicators for manufacturing valueadded by selected energy intensive products, energy intensity in manufacturing, and to energyuse per unit of GDP as an aggregate energy intensity indicator. The indicator is also linked toenvironmental indicators, notably to greenhouse gas emissions, air pollutant emissions, anddepletion of energy resources.
(e) International Targets/Recommended Standards: UNFCCC and its Kyoto Protocol.
3. METHODOLOGICAL DESCRIPTION
(a) Underlying Definitions and Concepts:The energy intensive industries have to be specified for the manufacturing of:
(i) Iron and steel, in classification ISIC refers to Group 271;
(ii) Non-ferrous metals, refers to ISIC Group: 272 "Manufacture of basic precious and non-ferrous metals";
ISED Methodology Sheets Energy Intensity of Selected Energy Intensive ProductsPage 1 of3

(iii) Basic Chemicals, corresponds to ISIC Group 241, which in turn comprises thefollowing Classes: 2411 - "Manufacture of basic chemicals, except fertilizers and nitrogencompounds"; 2412 - "Manufacture of fertilizers and nitrogen compounds"; 2413 -"Manufacture of plastics in primary forms and of synthetic";
(iv) Non-metallic minerals, corresponds to ISIC Group 269 - "Manufacture of non-metallic mineral products", Class 2694 - Manufacture of cement, lime and plaster is ofprimary interest. The Class includes manufacture of (1) hydraulic cements, includingPortland, aluminous slag and superphosphate, whether or not in the form of clinkers; (2)quicklime, slaked lime and hydraulic lime; (3) plasters consisting of calcined gypsum orcalcium sulphate.
(v) Paper and pulp, corresponds to ISIC Group 210. This Group comprises several Classes,among them the desirable one to be addressed is 2101 - "Manufacture of pulp, paper andpaperboard", if data on it is available;
(vi) Refined Petroleum Products: In ISIC classification it corresponds to Group 232.
(b) Measurement Methods:
Energy use is usually measured at the point of consumption, i.e., the factory or establishment."Own energy" (including internal use of hydropower, biofixels, or internal waste heat) should becombined with purchased energy at useful heating values.
Complications in interpreting energy intensity data arise from the fact that some branches ofmanufacturing may be concentrated in regions of a country rich in certain kinds of power or heatsources, such that those branches constitute a lower energy burden on the economy than theindicator would suggest. Interpretation is also complicated when a particular branch hassignificant internal energy resources, such as captive hydro, biofuels or coal.
It is also possible to measure total energy consumption, internal and external, for any finalproduct by using input-output tables to measure the energy embodied in materials andintermediate products. This is much more data intensive, because the input-output tables arecomplex. Such tables are not produced regularly, so this approach is difficult to follow, except atlong intervals.
(c) The Indicator in the DSR Framework: This indicator is assigned as an Indirect DrivingForce indicator of the Economic dimension.
(d) Limitations of the Indicator:
Detailed calculations such as total energy consumption for particular products, using input-output tables, while desirable, are very data intensive and difficult to update regularly.
(e) Status of the Methodology: The methodology is in use in many developed and developingcountries.
(f) Alternative Definitions/Indicators: In the context of climate change, it has becomeincreasingly desirable to convert energy consumption to carbon emissions per unit of physicalproduction. The fuels consumed can be converted to carbon emissions using IPCC coefficients.Carbon emissions will therefore change both with changes in energy efficiency and changes in fueltype.
4. ASSESSMENT OF DATA
ISED Methodology Sheets Energy Intensity of Selected Energy Intensive ProductsPage 2 of3

(a) Data Needed to Compile the Indicator:
(i) Final energy consumption by different selected manufacturing branches;
(ii) Real physical output (tones) of selected manufacturing branches.
(b) National and International Data Availability and Sources: Data on physical output ofthe selected products are available in national statistics. Final energy consumption data iscompiled by the IEA in the Energy balances for OECD and non-OECD countries.
(c) Data Reference:
IEA: Energy Balances of Member Countries and Energy Balances of non-Member Countries,annually;
Eurostat: Energy Balances;
The Latin American Energy Organization /Organizacion Latino Americana de Energia (OLADE);
Asia Pacific Energy Research Centre (APERC);
UN: Industrial Statistics, National Accounts;
OECD: STAN database (structural analysis database);
EU: NACE system.
5. AGENCIES INVOLVED IN THE DEVELOPMENT OF THE INDICATOR
(a) Lead Agency: The lead agency is the International Energy Agency (IEA).
(b) Other Contributing Organizations: None.
6. REFERENCES
(a) Readings:
Energy Policy, June/July 1997 issue, Elsevier Science Limited, various articles in this issuediscuss the physical and monetary measures of output and various problems associated withindicators of manufacturing energy use and intensity.
Phylipsen, G.J.M, Blok, K., and Worrell, E., 1997. Handbook on International Comparison ofEnergy Efficiency in the Manufacturing Industry. Utrecht: Dept. of Science, Technology, andSociety.
IEA, 1997. Indicators of Energy Use and Energy Efficiency. Paris: OECD.
(b) Internet site:
International Energy Agency: http://www.iea.org
World Bank: http://www.worldbank.org/data
ISED Methodology Sheets Energy Intensity of Selected Energy Intensive ProductsPage 3 of3

ENERGY MIXDimension
EconomicAgenda 21
Chapter 4: Changingconsumption and
production patterns
Placement in the CSD Theme/Sub-theme List
Consumption and ProductionPatterns/Energy XJseiShare of consumption
of renewable energy resources
1. INDICATOR (#11)
(a) Name: Energy mix.
(b) Brief Definition: The structure of energy supply in terms of shares of energy sources infinal energy consumption, primary energy supply, and electricity generation.
(c) Unit of Measurement: %
(d) Correspondence with other ISD Sets:
OECD
IIECEP: Energy use by fuel type
TSD-EI: Energy mix, i.e. thestructure of and changes in energy
EU/EUROSTAT
TERI: Energy consumption by fuel;Electricity from renewable sources
M P T M S E : Share of consumptionof renewable energy sources
UN-DSD/DESAprovisional core list for
Chapter 4
Share of consumption ofrenewable/non-renewable energysources
2. POLICY RELEVANCE:
(a) Purpose: This indicator measures the structure of energy consumption, the proportion ofenergy mix between fossil fuel, renewables, and nuclear energy sources.
(b) Relevance to Sustainable/Unsustainable Development: The energy supply mix has amajor effect on environmental performance because the environmental impact of each energysource differs greatly from one source of energy to another, and include the following: (i)traditional local or regional atmospheric pollution related to the combustion of fossil fuels (e.g.,urban smog, acid rain); (ii) global climate change related to the emission of GHG generated byfossil fuel production, transport and use; (iii) land use for a range of energy activities, and notablyfor mining and for hydroelectric reservoirs; (iv) risks attributed to various fuel chain cycles (fires,explosions, spill, disposal of high level radioactive wastes, etc). Energy mix indicates ratio of non-renewable to renewable energy sources, and in this context dependence on non-renewableresources can be regarded as unsustainable in the long term. Regarding economic dimension energysupply mix is a key determinant of energy security. This implies that the "right energy mix"relies on a well-diversified portfolio of domestic, or imported, or regionally traded fuels andsources of energy.
(c) International Conventions and Agreements: Not available.
(d) International Targets/Recommended Standards: In some countries there is a target forpercentage of energy supply from renewable sources.
(e) Linkages to other indicators: Interpretation of this indicator is enhanced when combinedwith annual indigenous energy production, annual energy consumption per capita, net energyISED Methodology Sheets Energy Mix
Page 1 of4

import dependence, and lifetime of proven energy reserves. It is also closely linked to some ofthe environmental indicators such as air pollutant and greenhouse gas emissions, generation ofsolid and radioactive wastes, land area taken by energy facilities, etc.
3. METHODOLOGICAL DESCRIPTION
(a) Underlying Definitions and Concepts: A disaggregation of energy supply by fuel sourcesin respect to: (i) final consumption, (ii), primary energy supply, and (iii) electricity generation.The elements comprising this indicator are consumption of various fossil fuel (coal, crude oil,petroleum products, gas); primary electricity and heat; non-combustible renewables; andcombustible renewables & wastes all converted into toe.
Regarding the final energy consumption mix sources to be specified are: Coal; Crude oil;Petroleum products; Gas; Electricity; Heat; and Combustible renewables &wastes (CRW).
Regarding the primary energy supply mix, sources to be specified are: Coal; Crude oil; Gas;Nuclear power; Hydro power; Non-combustible renewables; and Combustible renewables& wastes (CRW). Electricity net import is to taken into account as well.
Regarding electricity generation sources to be specified are: Coal; Petroleum products; Gas;Nuclear; Hydro; Non-combustible renewables; and Combustible renewables & wastes (CRW).
Coal includes all coal, both primary hard coal and lignite, and derived fuels (including patent fuel,coke, oven coke, gas coke, coke oven gas and blast furnace gas). Peat is also included in thiscategory. But coal derived secondary fuels is not a part of primary mix.
Crude oil comprises crude oil, natural gas liquids (NGL), and oil from unconventionalhydrocarbon sources.
Petroleum products comprise refinery gas (1.15), ethane (1.13), LPG (1,13), naphtha (1.075),motor gasoline (1.07), jet fuels (1.06), kerosene (1.04), gas/diesel oil (1.03), heavy fuel oil (0.96),and other petroleum products (0.96). In brackets average specific net calorific values are given intoe/tonne.
Gas includes natural gas (excluding natural gas liquids) and gas works gas, while the latter is notin primary energy mix. Gross calorific value of natural gas varies in range of 0.8- 1 toe/1000cub.m between different producing counties ( Netherlands-0.8; Uzbekistan-0.90; Russia, US,Canada, and Saudi Arabia - 0.91; UK-0.94; Indonesia-0.98, Algeria and Norway -1.0).
Hydro shows the energy content of the electricity produced in hydro power plants. Hydrooutput excludes output from pumped storage plants. Hydro-electricity production are accountedfor using 1 TWh = 0.086 Mtoe.
Nuclear shows the primary heat equivalent of the electricity produced by a nuclear power plantwith an average thermal efficiency of 33 per cent, i.e. 1 TWh = 0.086:0.33 = 0.261 Mtoe.
Non-combustible renewables includes geothermal, solar, wind, tide, and wave energy. Unless theactual efficiency of the geothermal process is known, the quantity of geothermal energy enteringelectricity generation is inferred from the electricity production at geothermal plants assuming anaverage thermal efficiency of 10 per cent. For solar, wind, tide and wave energy, the quantitiesentering electricity generation are equal to the electrical energy generated. Electricity is accountedfor at the same heat value as electricity in final consumption (i.e. 1 TWh = 0.086 Mtoe). Directuse of geothermal and solar heat, and heat from heat pumps, that is extracted from ambientISED Methodology Sheets Energy Mix
Page 2 of4

environment are also included here.
Combustible renewables & waste (CWR) comprises biomass (fuelwood, bagasse, vegetal waste,ethanol) and animal products (animal materials/wastes and sulphite lyes), municipal waste(wastes produced by the residential, commercial and public service sectors that are collected bylocal authorities for disposal in a central location for the production of heat and/or power) andindustrial waste. The share of fuelwood in CRW has to be specified.
Electricity Import and Export comprise amounts having crossed the national territorial boundariesof the country. Electricity net import is a difference between amounts of electricity import andexport.
(b) Measurement Methods: This indicator is computed by calculating the ratio of consumptionof specific energy sources identified above to total energy consumption in respect to:
(i) final consumption;
(ii) primary energy consumption; and
(iii) electricity generation.
Consumption of energy sources is measured in a term of heat contents based on their specific netcalorific values (NCV).
(c) The Indicator in the DSR Framework: The Indicator is assigned as an Indirect DrivingForce of Economic Dimension.
(d) Limitations of the Indicator:
(e) Status of the Methodology: Not available.
(f) Alternative Definitions/Indicators: In some ISD sets only share of consumption ofrenewable energy resources is monitored.
4. ASSESSMENT OF DATA
(a) Data Needed to Compile the Indicator:(f) Final energy consumption, both total (TFC) and by specified final energy sources;
(ii) Primary energy supply, both total (TPES), and specified primary energy sources.The difference between TPES and TFC is mainly accounted for losses in conversionof primary sources to final energy commodities such as electricity, by transportationand distribution losses and by use of fuels for non-energy purposes;
(iii) Electricity generation, both total and by fuel.
(b) National and International Data Availability: Data on energy supply by fuel are availablefrom national statistical offices and country publications, and various international sources (IEA,World Bank).
(c) Data Reference:
IAE: Energy Balances ofOECD Countries, 1990-2001
IAE: Energy Statistics and Balances ofNon-OECD Countries, 1990-2001
United Nations: Energy Statistics Yearbook and Energy Balances and Electricity Profiles.
ISED Methodology Sheets Energy MixPage 3 of4
World Bank: World Development Indicators 2000, 2001.
5. AGENCIES INVOLVED IN THE DEVELOPMENT OF THE INDICATOR
(a) Lead Agency: None
(b) Other Contributing Organizations: The agencies involved in the development of thisindicator are the International Energy Agency, the International Atomic Energy Agency.
6. REFERENCES
(a) Readings:
United Nations (1982), Concepts and Methods in Energy Statistics with Special Reference toEnergy Accounts and Balances.
United Nations (1987), Energy Statistics: Definitions, Units of Measure and Conversion Factors.
United Nations (1991), Energy Statistics: A Manual for Developing Countries.
IEA (2001), Key World Energy Statistics from the IEA, 2001 Edition.
World Bank, World Development Indicators 2000, 2001, Washington D.C.
(b) Internet site:United Nations Statistical Division: http://www.un.orgPeptsAmsd/UN Commission on Sustainable Development: http://esl.jrc.it/envind/sip/en/sipenO 1 .htmIEA: http://www.iea.orgWB: http://www.worldbank.org/data
ISED Methodology Sheets Energy MixPage 4 of4

ENERGY SUPPLY EFFICIENCYDimension
EconomicAgenda 21
Chapter 4: Changingconsumption and productionpatterns
Placement in the CSD Theme/Sub-theme List
None
1. INDICATOR (#12)
(a) Name: Energy supply efficiency.
(b) Brief Definition: Efficiency of transformation of primary supplied energy to final energycurriers which are delivered to consumers; fossil fuel efficiency for electricity generation;efficiency of oil refining; losses occurring during electricity transmission & distribution, and gastransportation & distribution; and electricity supplies from combined heat power plant aspercentage of total electricity generated by TPP.
(c) Unit of Measurement: %.
(d) Correspondence with other ISD Sets:
OECD
IIECEP: Fossil fuel efficiency forelectricity generation
EU/EUROSTAT
None
UN-DSD/DESA Provisionallist for Chapter 4
None
2. POLICY RELEVANCE:
(a) Purpose: The indicator measures the efficiency of energy industries in total and efficienciesof various chains of energy supply and losses occurring during gas and electricity transportation& distribution in particular.
(b) Relevance to Sustainable/Unsustainable Development: Energy is essential for economicand social development, but consumption of fossil fuels is the major cause of air pollution andclimate change. Improving energy supply efficiency and elimination of losses occurring duringthe energy transformation and transportation are essential to sustainable development.
(c) International Conventions and Agreements: Currently, there are no conventions oragreements specifically referring to the regulation and/or limitation of energy supply efficiencyper GDP. However, Agenda 21 calls for considering how economies can grow and prosper whilereducing the losses during various chains of fuel cycle and encouraging greater efficiency in theuse of energy, in particular at the supply side. At the regional level calls were made for theprudent and rational use of energy (Article 130 of the Treaty on the European Union -Maastricht, 1992), energy efficiency (The Energy Protocol of Lisbon, 1994).
(d) International Targets/Recommended Standards: No specific target for energy intensity.The Kyoto Protocol sets targets for total greenhouse gas emissions for Annex I (developed)countries.
(e) Linkages to other indicators: The indicator is closely linked with other indicators of theeconomy such as indigenous energy production, energy mix, status of deployment of pollutionabatement technology, total primary energy supply, import dependency, energy use per unit ofGDP; with environmental indicators such as GHG emission, air quality, acidification land area,
ISED Methodology Sheets Energy supply efficiencyPage 1 of4

waste generation.
3. METHODOLOGICAL DESCRIPTION
(a) Underlying Definitions and Concepts: The indicator comprises the following entries:
(i) Ratio of total final energy consumption (TFC) by the different end-use sectors to totalprimary energy supply (TPES), both expressed in tonnes of oil equivalent. Total primaryenergy supply is made up of indigenous production + imports - exports - internationalmarine bunkers ± stock changes.
(ii) Fossil fuel efficiency for electricity generation, defined as gross production of electricityrelative to fossil fuel inputs (NCV). The reasons for the significant improvements in theaverage efficiency of the TPP include fuel switching, the commissioning of new, highefficiency generating plants and decommissioning of older inefficient plant. In particular,there was a move from coal towards gas as a more efficient fuel, often using highefficiency combined gas-steam cycle.
(iii) Electricity transmission and distribution losses, defined as ratio of final electricityconsumption to electricity supply. Electric power transmission and distribution lossesinclude losses in transmission between sources of supply and points of distribution and inthe distribution to consumers, including pilferage. Production plus net import lesstransmission and distribution losses, own-use, and transformation losses is equal to end-use electricity consumption.
(iv) Gas transportation and distribution losses, defined as ratio of final gas consumption toprimary gas supply. Gas transportation and distribution losses include losses intransportation between sources of supply and points of distribution, including own-usegas consumed by gas pumping systems, and in the distribution to consumers. Productionplus net import less transportation and distribution losses, own-use, and transformationlosses is equal to end-use gas consumption.
(v) Oil refining efficiency defined as average percentage of finished light products output perunit of crude oil fed at the refineries. Light oil products comprise aviation gasoline, motorgasoline, jet fuels, kerosene, gas/diesel oil, naphtha, white spirit, and LPG.
(vi) Electricity supplies from combined heat power plant as percentage of total electricitygenerated by TPP. Combined heat and power plants refers to plants which are designedto produce both heat and electricity. UNIPEDE refers to these as co-generation powerstations. Both public and autoproducer plants are included here.
(b) Measurement Methods: The amount of energy produced, supplied and consumed can bederived from the energy statistics published by each country or various international or regionalorganisations (e.g. the International Energy Agency, EUROSTAT). The amounts of all primaryenergy sources such as fossil fuel, electricity, heat, and CRW must be considered.
(c) The Indicator in the DSR Framework: It is considered as an Indirect Driving Force ofEconomic dimension.
(d) Limitations of the Indicator:
(e) Status of the Methodology: The ratio of TFC to TPEC, as well as fossil fuel efficiency forelectricity generation; outputs from refineries; gas and electricity transportation and distribution
ISED Methodology Sheets Energy supply efficiencyPage 2 of4
losses are in widespread use, but without a standardized methodology,
(f) Alternative Definitions/Indicators:
4. ASSESSMENT OF DATA
(a) Data Needed to Compile the Indicator: Energy commodity data for production andconsumption (energy balances); refineries light oil product output; and structure of electricitysupplies.
(b) National and International Data Availability: Energy commodity data for production andconsumption (energy balances) are regularly available for most countries at the national level;and for some countries, at the sub- national level. Both types of data are compiled by andavailable from national statistical offices and country publications.
Internationally, the International Energy Agency maintains the most thorough set of energybalances and energy accounts, based primarily on national data or data collected from reliableregional agencies.
(c) Data Reference:
United Nations: Energy Statistics Yearbook.
United Nations: Energy Balances and Electricity Profiles;
IEA/OECD: Energy balances and Energy statistics for OECD countries and non-OECDcountries, annually.
5. AGENCIES INVOLVED IN THE DEVELOPMENT OF THE INDICATOR
(a) Lead Agency: None.
(b) Other Contributing Organizations: The International Atomic Energy Agency is interestedin development of this methodology sheet.
6. REFERENCES
(a) Readings:
United Nations (1982). Concepts and Methods in Energy Statistics with Special Reference toEnergy Accounts and Balances.
United Nations (1987), Energy Statistics: Definitions, Units of Measure and Conversion Factors..
United Nations (1991), Energy Statistics: A Manual for Developing Countries.
The IEA, (2001), Key World Energy Statistics from the IEA, 2001 Edition,.
WB, World Development Indicators 2000,2001, the World Bank, Washington, D.C.
Eurostat (2001), Integration - indicators for energy Data 1985-98, European Commission, 2001Edition.
(b) Internet site:
United Nations Statistics Division: http://www.un.org/Depts/unsd
International Energy Agency Statistics: http://www.iea.org/statist/index.htm.
IEA: http://www.iea.org
ISED Methodology Sheets Energy supply efficiencyPage 3 of4

WB: http://www.worldbank.org/data
ISED Methodology Sheets Energy supply efficiencyPage 4 of4

STATUS OF DEPLOYMENT OF POLLUTANT ABATEMENT TECHNOLOGIESDimension
EconomicAgenda 21
Chapter 9: Protection of theAtmosphere
Placement in the CSD Theme/Sub-themeList
None
1. INDICATOR (#13)
(a) Name: Status of deployment of pollutant abatement technologies.
(b) Brief Definition: The indicator measures the extent of use of pollutant abatementtechnologies for abatement of SO2, NOX and particulates; and average emission reductionefficiency of the abatement technologies (the capture efficiency of the abatement control system)in term of SO2, NOX and particulates removal.
(c) Unit of Measurement: %.
(d) Correspondence with other ISD Sets:
OECD
None
EU/EUROSTAT
None
UN-DSD/DESA Provisionallist for Chapter 4
None
2. POLICY RELEVANCE:
(a) Purpose: The indicator provides a measure of the status of the deployment of pollutantabatement technologies to meet air quality standards with respect to selected pollutants. Sincelarge combustion plants are the major source of the considered pollutants emissions the indicatorfocuses on the status of the pollutant abatement technologies at the existing TPP in regard to (1)share of installed capacities of TPP that are equipped with corresponding flue gas clean-upsystems (industrial precipitators, desulphurisation and denitrification facilities); and (2) averageSO2, NOX and particulates emission reduction efficiency of the pollutant abatement technologies.
(b) Relevance to Sustainable/Unsustainable Development: There is a growing concernrelated to higher concentration of various air pollutants, mainly arising from energy use, notablyfrom fossil fuel combustion. The air emissions are influenced by a country's energy supplypattern and its standards of pollution abatement and control, and consequently by the status ofuse of pollution abatement technologies. Countries' efforts to abate air pollutant emissions arereflected in national policies and international commitments. Among various concrete pollutioncontrol actions, a deployment of pollutants abatement systems plays an important role inreducing pollutant emissions and prevents exceeding limits for sulphur dioxide, nitrogen oxides,and particulates in ambient air. The indicator can be used, therefore, to evaluate theenvironmental performance of national policies in relation to energy production, notably relatedto fossil fuel combustion, and to monitor levels of compliance with air quality standards.
(b) International Conventions and Agreements: None.
(a) International Targets/Recommended Standards: No direct standards exist for thisindicator. However World Health Organization (WHO) air quality guidelines exist for all thepollutants of this indicator. Many countries have established their own air quality standards formany of these pollutants.
ISED Methodology Sheets Status of deployment of pollutant abatement technologiesPage 1 of3

(b) Linkages to other indicators: The indicator is linked to economic indicators, such as Energyconsumption per capita, Energy mix, and Energy supply efficiency, and Expenditure on airpollution abatement. It is closely linked to some environmental indicators: Quantities of airpollutant emissions, Ambient concentration of pollutants in urban areas.
3. METHODOLOGICAL DESCRIPTION
(a) Underlying Definitions and Concepts: The quantities of air pollutants from allanthropogenic activities is directly related to the combustion of fossil fuels for energy. The term"air pollution" is used to describe substances that are artificially introduced into the air fromenergy related activities, in particular from fossil fuel combustion facilities. Air pollution stemsfrom acid gases such as SO2, NOX and airborne particulates which, in excess, are harmful tohuman health, buildings and ecosystems. There are various technological options to preventrelease of air pollutants into atmosphere, in particular those which clean-up combustion fluegases at the "end-of- pipe" from pollutants already generated. Among such "end-of-pipe"pollutant abatement technologies, such as electrostatic precipitator, bag filter, are widelydeployed for particulates removal. In turn wet scrubbers are used for SO2 removal, and selectivecatalytic reduction is used to clean-up gases from NOx. The extent of use of pollutantabatement technologies is defined as a share of thermal power plant TPP install capacitiesequipped with the appropriate facilities for abatement of SO2, NOX and particulates.
Average emission reduction efficiency of the abatement technologies determines the reduction inemissions of generated pollutants by the corresponding abatement control systems (the captureefficiency of devices) deployed at the stationary combustion facilities, notably at the thermalpower plants.
(b) Measurement Methods: The extent of use of pollutant abatement technologies forabatement of SO2, NOX and particulates on existing TPP may be evaluated from data of nationalutilities and energy agencies.
Average emission reduction efficiency of the abatement technologies is to be evaluated throughdirect sampling pollutant emissions levels in flue gases flow upstream and downstream ofrepresentative abatement control system.
(c) The Indicator in the DSR Framework: The indicator is considered as an Indirect DrivingForces within energy sector.
(d) Limitations of the Indicator:
(a) Status of the Methodology: Not available.
(b) Alternative Definitions/Indicators: The indicator may be extended to cover not onlythermal power plant but also all the stationary combustion facilities.
4. ASSESSMENT OF DATA
(a) Data Needed to Compile the Indicator:
(i) Total number of installed capacities of thermal power plant.
(ii) Number of TPP installed capacities which are equipped with abatement technologies forSO2, NOX and particulates removal at the "end-of-pipe"
(iii) Average reduction of SO2, NOX and particulates by the corresponding pollutant abatementtechnologies deployed at the TPP.ISED Methodology Sheets Status of deployment of pollutant abatement technologies
Page 2 of3

(b) National and International Data Availability: International data sources do not exist.Data presumably are available at the national level compiled by utilities and energy agencies.
(c) Data Reference:
5. AGENCIES INVOLVED IN THE DEVELOPMENT OF THE INDICATOR
(a) Lead Agency: None.
(b) Other Contributing Organizations: The IAEA.
(c) 6. REFERENCES
(d) Readings:
(e) Internet site:
ISED Methodology Sheets Status of deployment of pollutant abatement technologiesPage 3 of3

ENERGY USE PER UNIT OF GDPDimension
EconomicAgenda 21
Chapter 4: Changing consumptionand production patterns
Placement in the CSD Theme/Sub-theme
Economic/Consumption andProduction Patterns/ Energy Use:
Energy use per unit of GDP
1. INDICATOR (#14)
(a) Name: Energy use per unit of GDP.
(b) Brief Definition: Ratio of the energy consumption to GDP in real US dollars.
(c) Unit of Measurement: toe per 1000 $UD and KWh per $UD for electricity.
(d) Correspondence with other ISD:
OECD
TSD El: Energy supply per unit of GDP
IIECEP: Total mergy supply per unit of GDP
EU/EUROSTAT
MPTMSE: Intensity ofenergy use (ECON12)
UN-DSD/DESA Provisionallist for Chapter 4
None
2. POLICY RELEVANCE
(a) Purpose: Trends in overall energy use relative to GDP indicate the general relationship ofenergy consumption to economic development and provide a rough basis for projecting energyconsumption and its environmental impacts with economic growth. For energy policy-making,however, sectoral or sub-sectoral energy intensities should be used.
(b) Relevance to Sustainable/Unsustainable Development: Energy is essential for economicand social development, but consumption of fossil fuels is the major cause of air pollution andclimate change. Improving energy efficiency and delinking economic development from energyconsumption, particularly of fossil fuels, is essential to sustainable development.
(c) International Conventions and Agreements: Currently, there are no conventions oragreements specifically referring to the regulation and/or limitation of energy use per GDP.However, Agenda 21 calls for considering how economies can grow and prosper while reducingthe use of energy and materials and encouraging reducing the amount of energy and materialsused per unit in the production of goods and services. At the regional level calls were made forthe prudent and rational use of energy (Article 130 of the Treaty on the European Union -Maastricht, 1992), energy efficiency (The Energy Protocol of Lisbon, 1994) and switch tocleaner forms of energy.
(d) International Targets/Recommended Standards: No specific target for energy intensity.The Kyoto Protocol sets targets for total greenhouse gas emissions for Annex I (developed)countries.
(e) Linkages to Other Indicators: The ratio of energy use to GDP is an aggregate of sectoralenergy intensity indicators and is thus linked to the energy intensities for the manufacturing,transportation, commercial/services and residential sectors, for which separate methodologysheets have been prepared. This indicator is also linked to indicators for total energyconsumption, greenhouse gas emissions and air pollution emissions.
3. METHODOLOGICAL DESCRIPTIONISED Methodology Sheets Energy use per unit of GDP
Page 1 of4

(a) Underlying Definitions and Concepts: The ratio of energy use to GDP is also called"energy intensity". The term "energy intensity" is better used for sectoral or sub-sectoral ratiosof energy use to output. The indicator could be called "aggregate energy intensity" or"economy-wide energy intensity". The ratio of energy use to GDP indicates the total energybeing used to support economic and social activity. It represents an aggregate of energyconsumption resulting from a wide range of production and consumption activities. In specificeconomic sectors and sub-sectors, the ratio of energy use to output or activity is the "energyintensity" (if the output is measured in economic units) or the "specific energy requirement" (ifthe output is measured in physical units such as tonnes or passenger-kilometers). Due to thelimitations described in section 3 (c) below, total energy use should be disaggregated intocomponents, by sector (manufacturing, transportation, residential, commercial/services, industry,agriculture, construction, etc.) or sub-sector. For each sector or sub-sector, energy use can berelated to a convenient measure of output to provide a sectoral or sub-sectoral energy intensity.Examples include energy use for steel-making relative to tonnes of steel produced; energyconsumption by passenger vehicles relative to passenger- or vehicle-kilometers; energyconsumption in buildings relative to their floor area. (See separate methodology sheets formanufacturing, transportation, commercial/services, and residential sectors). The energyintensity of a process (energy consumed per unit of output) is the inverse of the "energyefficiency" of the process (output per unit energy consumed).
(b) Measurement Methods:• Energy Use: Total primary, conventional energy and electricity consumption are
obtained from national energy balances and International statistical sources as well.TPES and Conventional energy are measured in Mega tonne of oil equivalent (Mtoe);Electricity use is measured in TWh.
• Output: GDP should be measured in US dollars, converted from real local currency atpurchasing power parity for the base year (1990) to which local currency was deflated.
(c) The Indicator in the DSR Framework: It is considered as a Direct Driving Force inEconomic dimension.
(d) Limitations of the Indicator: The ratio of aggregate energy use to GDP, often called"energy intensity" or the "energy ratio", is not an ideal indicator of energy efficiency,sustainability of energy use, or technological development, as it has been commonly used. Theaggregate ratio depends as much on the structure of the economy as on the energy intensities ofsectors or activities, and changes in the ratio over time are influenced almost as much by changesin the structure of the economy as by changes in sectoral energy intensities.
Measurement and interpretation of energy intensities are complicated by differences amongproducts within a category, such as size (e.g., automobile weight or refrigerator capacity),features (power steering and automatic transmission in cars, freezer compartments inrefrigerators), and utilization (hours per year a stove is used, vehicle occupancy if passenger-kmis the measure of output).
Comparison among countries of the ratio of energy use to GDP is complicated by geographicalfactors. Large countries, for example, tend to have high levels of freight transportation as manygoods are distributed nationwide. Compared with countries with moderate climates, coldcountries may consume as much as 20 per cent more energy per capita due to demand for spaceheating, while hot countries may use 5 per cent more energy per capita, due to demand for airconditioning. Countries with large raw materials industries may use twice as much energy perISED Methodology Sheets Energy use per unit of GDP
Page 2 of4

unit of manufacturing output compared to countries that import processed materials, due to thehigh energy intensity of raw material processing. Canada, for example, has a high ratio ofenergy use to GDP, due in part to that fact that it is a large, cold country with a large rawmaterials processing sector. In Japan, the climate is milder, raw materials are limited, and highpopulation density results in smaller residential units and less distance travelled, contributing to alower ratio of energy use to GDP.
Interpreting the ratio of energy use to GDP in terms of environmental impact or sustainability isalso complicated by differences in environmental impact among energy sources. Canada, forexample, has substantial hydropower, nuclear power and natural gas, all of which have lowerenvironmental impacts than coal or oil.
Given the large number of factors that affect energy consumption, the ratio of total energyconsumption to GDP should not be used as an indicator of energy efficiency or sustainability forpolicy-making purposes.
(e) Status of the Methodology: The ratio of energy use to GDP, as well as sectoral and sub-sectoral energy intensities, are in widespread use, but without a standardized methodology.
(f) Alternative Definitions/Indicators: Energy intensity. The ratio of sectoral or sub-sectoralenergy use to the output or activity of the sector or sub-sector provides a more useful indicator ofenergy intensity. Four separate methodology sheets have been prepared for manufacturing,transportation, commercial/services, and residential sectors
4. ASSESSMENT OF DATA
(a) Data Needed to Compile the Indicator: Real GDP in US dollars of a base year and energyconsumption, while the last to be specified for total primary energy (TPES), Primaryconventional energy and Electricity.
(b) National and International Data Availability and Sources: The International EnergyAgency maintains the most thorough set of energy balances and energy accounts, basedprimarily on national data or data collected from reliable regional agencies. For OECDcountries, the OECD maintains the most reliable set of national accounts with a breakdown ofGDP by sector and sub-sector. IEA energy data now cover virtually all developing countries.
GDP and value-added by industry are published in the United Nations National AccountsStatistics. The IMF "International Financial Statistics" provides nominal and real GDP for mostcountries. Data on components of GDP are often available from regional development banks ornational sources.
(c) Data Reference:
IEA: Energy Balances of Member Countries; Energy Balances of Non-Member Countries,annually;
Eurostat: Energy balances; annually
Latin American Energy Organization/ OrganizacRon Latinoamericana de EnergRa (OLADE);
Asia Pacific Energy Research Centre (APERC)
UN: National Accounts Statistics;
IMF: International Financial Statistics;
ISED Methodology Sheets Energy use per unit of GDPPage 3 of4
WB: World Development Indicators 2000 and 2001.
5. AGENCIES INVOLVED IN THE DEVELOPMENT OF THE INDICATOR
(a) Lead Agency: The lead agency is the International Energy Agency (IEA).
(b) Other Contributing Organizations: Virtually every national and international energyagency uses the ratio of total energy use to GDP, often inappropriately. Key agencies involvedin more detailed development of sectoral and sub-sectoral indicators, including energy intensityand energy efficiency indicators, are Eurostat and the Directorate-General for Energy andTransport of the European Commission. The IEA has a parallel effort with a particular focus onnon-EU countries. Work is also being done by APERC, with a focus on the Asia-Pacific Region,and OLADE for Latin America.
6. REFERENCES
(a) Readings:
EUROSTAT (2001), Integration - indicators for energy, 2001 edition
(b) Internet site: International Energy Agency: http://www.iea.org
ISED Methodology Sheets Energy use per unit of GDPPage 4 of4

EXPENDITURE ON ENERGY SECTORDimension
EconomicAgenda 21
Chapter 33: FinancialResources and Mechanisms
Placement in the CSD Theme/Sub-themeList
Expenditure on R&D as a percent ofGDR under Institutional/Institutionalcapacity/Science and technology
1. INDICATOR (#15)
(a) Name: Expenditure on energy sector.
(b) Brief Definition: Expenditure on energy sector refers to economic resources spent by publicsector and industry in forms of investments and current expenditures to secure national energysupply in an environmentally benign manner. From a point of view of environmental concernimportant components are shares of the above expenditure aimed at reducing the pressures on theenvironment arising from energy systems, such as expenditures on (i) air pollution control, (ii)waste management, and (iii) hydrocarbon exploration and development in regard to energy sourcedepletion. Additionally, ratios of expenditures on both RD&D for energy technology, and energynet import expenses/revenues over GDP are worth to be specified.
(c) Unit of Measurement: Million 1990 US dollars in PPPs for total expenditure; % for shareson environmental protection; and % for RD&D expenditure, and energy net importexpenses/revenues both as percentage of GDP.
(d) Correspondence with other ISD Sets:
OECD EU/EUROSTAT
MPTMSE: Environmental protectionexpenditures (ECON21)
UN-DSD/DESA Provisionallist for Chapter 4
2. POLICY RELEVANCE:
(a) Purpose: The indicator provides an indication of a level of the efforts undertaken by acountry to secure national energy supply. Alternatively, it can be interpreted as a measure of theeconomic cost or financial overburden imposed by a society to match its energy demand in nearand long terms.
Relevance to Sustainable/Unsustainable Development: Financial resources are obviouslyneeded for the attainment of sustainable development. Agenda 21 calls for the monitoring of theprovision of financial resources, particularly in developing countries, so that the internationalcommunity can take further action on the basis of accurate and reliable data. However essentialfinancial resources (investments and current expenditures) are required to secure sustainableenergy supply, in particular for energy importing countries. A part of resources spent for energyuse comprises the environmental expenditure, since energy services create major pressure onecosystems in terms of air emissions, waste streams generation and resources depletion. Theenergy expenditure represents a considerable overburden on a national economy. Diminishingthese expenses would free up financial resources, which could be allocated for the resolving othersocietal needs. On the other hand, less expenditure in the energy sector might result in reductionsISED Methodology Sheets Expenditure on energy use
Page 1 of 3

of energy cost to the public, favoring both the economic growth and affordability, in particularfor low income population in the developing world, where limited access to energy is a seriousconstraint to development.
RD&D expenditure for developing energy system
(b) International Conventions and Agreements: None.
(c) International Targets/Recommended Standards: None.
(d) Linkages to other indicators: The indicator is linked to economic indicators, such as GDPper capita, energy prices, annual energy consumption per capita, net energy import dependence.Also through corresponding chains, it affects the indicators of economic dimension: quantities ofair pollutant emissions, ambient concentration of pollutants in urban areas, Generation of solidand radioactive waste, accumulated quantity of solid waste to be managed, accumulated quantityof radioactive waste awaiting disposal, lifetime of proven fossil fuel reserves, etc.
3. METHODOLOGICAL DESCRIPTION
(a) Underlying Definitions and Concepts: Environmental protection expenditures are definedin Chapter XXI of the System of National Accounts (SNA), in the System of IntegratedEnvironmental and Economic Accounting (SEEA) (United Nations 1993), and in SERIEE(Eurostat 1994) as those expenses, which are an immediate response to effects caused byproduction and for which environmental protection is the main objective. The Classification ofEnvironmental Protection Expenditures (CEPA) is contained in UNECE/CES/822 (1994).
Regarding energy net import expenses/revenue, it is a standard item in the balance of paymentsand national accounts. Apart, it could be computed as a sum of products of volume of importednet energy sources by corresponding energy commodity price.
(b) Measurement Methods: See section 3a above.
(c) The Indicator in the DSR Framework: It is considered as a Direct Driving force ofEconomic Dimension.
(d) Limitations of the Indicator: Comparable data are not readily available, and may be basedon incomplete estimates. In most cases the available data on expenditures on environmentalprotection or R&D are aggregated for all sectors and it is not possible to identify which part oftotal expenditure is spent for energy sector.
(e) Status of the Methodology: Not available.
(f) Alternative Definitions/Indicators:
4. ASSESSMENT OF DATA
(a) Data Needed to Compile the Indicator:
(i) Total Expenditure on energy use, except for energy imports, and its break down by typesof expenditures such as: air pollution abatement, waste management, hydrocarbon explorationand development, RD&D for energy technology;
(ii) Energy net import expenses/revenue;
(iii) Gross Domestic product.
ISED Methodology Sheets Expenditure on energy usePage 2 of 3

(b) National and International Data Availability: There is no international data on energyrelated expenditure and its break down by various types of expenditures. Data on expenditure offuel and power producing sectors (companies) can be obtained from industrial statistics and bymeans of questionnaires to the energy companies. Data on government energy expenditures canbe found in financial statistics.
Data on RD&D expenditure can be obtained through UNESCO's international surveys onscientific research and experimental development; however, sectoral break down is a rathercomplicated task.
(c) Data Reference:
UNESCO Statistical Yearbook for data on R&D.
5. AGENCIES INVOLVED IN THE DEVELOPMENT OF THE INDICATOR
(a) Lead Agency: None.
(b) Other Contributing Organizations: The IAEA. The World Bank may be interested in thedevelopment of this indicator.
(c) 6. REFERENCES
(d) Readings:
Eurostat, (1998): Environmental Protection Expenditure in Member States.
Eurostat, (1994): SERIEE European System of Recording Information of the Economy on theEnvironment.
OECD(1993).\ Pollution Abatement and Control Expenditures in OECD Countries. EnvironmentMonograph No. 75.
DESIPA. (1993/- System of National Accounts. Inter-secretariat Working Group on NationalAccounts. 1993.
(e) Internet site:
ISED Methodology Sheets Expenditure on energy usePage 3 of3

ENERGY CONSUMPTION PER CAPITADimension
EconomicAgenda 21
Chapter 4: Changing ConsumptionPatterns
Placement in the CSD Theme/Sub-theme set
Economic/Consumption andProduction Patterns/Energy
Use
1. INDICATOR (#16)
(a) Name: Energy consumption per capita.
(b) Brief Definition: The per capita amount of energy - coal, oil, petroleum products, gas,combustible energy &waste, electricity, and heat converted into oil equivalent - available in a givenyear in a given country or geographical area.
(c) Units of Measurement: Toe per capita; regarding electricity - kWh per capita.
(d) Correspondence with other ISD:
OECD
Core ENV: Energy supply percapita
EU/EUROSTAT
MPTMSE: Per capita gross inlandenergy consumption (ECON10)
UN-DSD/DESA Provisionallist for Chapter 4
Annual energy consumption percapita
2. POLICY RELEVANCE
(a) Purpose: The indicator is a widely used measure of access to and use of energy, individual andindustrial energy consumption patterns and the energy intensity of a society.
(b) Relevance to Sustainable/Unsustainable Development: Energy is a key factor in industrialdevelopment and in providing vital services that improve the quality of life. Traditionally energyhas been regarded as the engine of economic progress. However, its production, use, andbyproducts have resulted in major pressures on the environment, both from a resource use andpollution point of view. The decoupling of energy use from development represents a majorchallenge of sustainable development. The long- term aim is for development and prosperity tocontinue through gains in energy efficiency rather than increased consumption and a transitiontowards the environmentally friendly use of renewable resources. On the other hand, limited accessto energy is a serious constraint to development in the developing world, where the per capita use ofenergy is less than one sixth than that of the industrialized world.
(c) International Conventions and Agreements: Currently, there are no conventions oragreements specifically referring to the regulation and/or limitation of energy consumption percapita. However, calls have been made for the prudent and rational use of energy (Article 130 of theTreaty on the European Union -Maastricht, 1992), energy efficiency (The Energy Protocol ofLisbon, 1994) and switch to cleaner forms of energy. UNFCC and the Kyoto Protocol call forlimitations on total greenhouse gas emissions, which are dominated by CO2 from the combustion offossil fuels.
(d) International Targets/Recommended Standards: The Kyoto Protocol sets targets for totalgreenhouse gas emissions for Annex I (developed) countries.
(e) Linkages to Other Indicators: The indicator is closely linked with other indicators of theeconomy such as energy intensities, energy net import dependency, with environmental indicatorssuch as GHG emission, air quality, acidification land area, waste generation, and also with socialindicators.
ISED Methodology Sheets Energy consumption per capitaPage 1 of4

3. METHODOLOGICAL DESCRIPTION
(a) Underlying Definitions and Concepts: Gross inland consumption of primary energy or Totalprimary energy supply (TPES) is a key aggregate in the energy balances.
TPES comprises: coal, crude oil, Petroleum products, Gas, Nuclear, Hydro, Other non-combustiblerenewables (excluding Hydro), electricity and heat.
Coal includes primary solid fuels, such as hard coal, lignite, and derived fuels (including patentfuel, coke oven coke, gas coke, BKB, coke oven gas and blast furnace gas). Peat is also included inthis category.
Crude oil comprises crude oil, natural gas liquids, refinery feedstocks and additives as well as otherhydrocarbons.
Petroleum products comprise refinery gas, ethane, LPG, aviation gasoline, motor gasoline, jet fuels,kerosene, gas/diesel oil, heavy fuel oil, naphtha, white spirit, lubricants, bitumen, paraffin waxes,petroleum coke and other petroleum products.
Gas in common includes natural gas (excluding natural gas liquids) and gas works gas.
Hydro shows the energy content of the electricity produced in hydro power plants. Hydro outputexcludes output from pumped storage plants. Hydro-electricity production are accounted for using 1TWh = 0.086 Mtoe.
Nuclear shows the primary heat equivalent of the electricity produced by a nuclear power plant withan average thermal efficiency of 33 per cent, i.e. 1 TWh = 0.086:0.33 = 0.261 Mtoe.
Non-combustible renewables include geothermal, solar, wind, tide, and wave energy. Unless theactual efficiency of the geothermal process is known, the quantity of geothermal energy enteringelectricity generation is inferred from the electricity production at geothermal plants assuming anaverage thermal efficiency of 10 per cent. For solar, wind, tide and wave energy, the quantitiesentering electricity generation are equal to the electrical energy generated. Electricity is accountedfor at the same heat value as electricity in final consumption (i.e. 1 TWh = 0.086 Mtoe). Direct useof geothermal and solar heat, and heat from heat pumps, that is extracted from ambient environmentare also included here.
Combustible renewables & waste (CRW) comprise biomass (wood, vegetal waste, ethanol) andanimal products (animal materials/wastes and sulphite lyes), municipal waste (wastes produced bythe residential, commercial and public service sectors that are collected by local authorities fordisposal in a central location for the production of heat and/or power) and industrial waste. Theshare of wood in CRW has to be specified.
Consumption of energy refers to apparent consumption and is derived from the formula that takesinto account indigenous production, exports, imports and stock changes. Production refers to thefirst stage of production. International trade of energy commodities is based on the general tradesystem, that is, all goods entering and leaving the national boundary of a country are recorded asexport and imports. Bunkers refer to fuels supplied to ships engaged in international transport,irrespective of the carriers flag. In general, data on stocks refer to changes in stocks of producers,importers and/ or industrial consumers at the beginning and the end of the year.
(b) Measurement Methods: The indicator is calculated as the ratio of consumption of energy in aspecific area/country/region to the mid- year population in that area/country/region. The followingfour different entries are to be specified for the numerator of the indicator, namely: Total primaryenergy; Automotive fuel; Combustible renewable and waste; and Electricity.
ISED Methodology Sheets Energy consumption per capitaPage 2 of4

a. Total primary energy requirement (gross inland primary energy consumption, totalprimary energy consumption) is calculated from the following formula: "Primaryindigenous production + Net import/Bunkers/+/- Stock changes = Total primary energyrequirement".
b. Gross inland automotive fuel consumption is calculated from the following formula:"automotive fuel production + Imports/Exports/Bunkers/+/- Stock changes = Totalautomotive fuel requirement". Automotive fuel comprises: aviation gasoline, motorgasoline, jet fuels, gas/diesel oil, LPG.
c. Combustible energy and waste consumption is calculated from the following formula:"CRW + net import = Total CRW consumption".
d. Electricity consumption is calculated from the following formula: "Electricityproduction + Net imports = Total electricity requirement". Amounts are considered asimported or exported when they have crossed the national territorial boundaries of thecountry.
(c) The Indicator in the DSR Framework: A State indicator of the Economic Dimension.
(d) Limitations of the Indicator: Apparent consumption may in some cases represent only anindication of the magnitude of actual gross inland availability. The actual value of the indicator isstrongly influenced by a multitude of economic, social and geographical factors. When using it asan indicator of sustainability the indicator has to be interpreted in connection with other indicatorsof economic development and energy use, as smaller or larger values of the indicator do notnecessarily indicate more or less sustainable development.
(e) Status of the Methodology: The indicator is in a widespread use, but without a standardizedmethodology. International recommendations are available.
(f) Alternative Definitions/Indicators: Use of energy per capita.
4. ASSESSMENT OF DATA
(a) Data Needed to Compile the Indicator: Energy commodity data for production andconsumption (energy balances) and mid- year population estimates.
(b) National and International Data Availability: Energy commodity data for production andconsumption, and population data are regularly available for most countries at the national level;and for some countries, at the sub- national level. Both types of data are compiled by and availablefrom national statistical offices and country publications.
(c) Data Reference: United Nations: Energy Statistics Yearbook. United Nations: Energy Balancesand Electricity Profiles; IEA/OECD: Energy balances and Energy statistics for OECD countries andnon-OECD countries.
5. AGENCIES INVOLVED IN THE DEVELOPMENT OF THE INDICATOR
(a) Lead Agency: The lead agency is the United Nations Department of Economic and SocialAffairs (DESA). The contact point is the Director, Statistics Division, DESA; fax no. (1 212) 9639851. UN Commission on Sustainable Development.
(b) Other Contributing Organizations: Other organizations involved in the indicatordevelopment include the International Energy Agency of the Organisation for EconomicCooperation and Development (OECD/ IEA), and Eurostat.
ISED Methodology Sheets Energy consumption per capitaPage 3 of4

6. REFERENCES
(a) Readings:
United Nations, ( 1982): Concepts and Methods in Energy Statistics, with Special Reference toEnergy Accounts and Balances. Energy Statistics: Definitions, Units of Measure and ConversionFactors.
United Nations, (1987): Energy Statistics: A Manual for Developing Countries. United Nations,1991.
(b) Internet sites:
United Nations Statistics Division: http://www.un.org/Depts/unsdUN Commission on Sustainable Development: http://esl.jrc.it/envind/sip/en/sipenO 1 .htmInternational Energy Agency Statistics: http://www.iea.org/statist/index.htm.
ISED Methodology Sheets Energy consumption per capitaPage 4 of4

INDIGENOUS ENERGY PRODUCTIONDimension
EconomicAgenda 21
Chapter 4: Changing consumptionpatterns
Placement in the CSDTheme/Sub-theme List
None
1. INDICATOR (#17)
(a) Name: Indigenous energy production.
(b) Brief Definition: Amount of indigenous primary energy produced nationally in a given yearin total and by fuel types, such as: coal, oil, natural gas, nuclear, hydro, all converted into oilequivalent, and combustible renewables & waste (CWR) all converted into oil equivalent; andamount of total electricity produced domestically from all primary energy sources.
(c) Unit of Measurement: Million tonnes of oil equivalent (Mtoe), and TWh for electricity.
(d) Correspondence with other ISD Sets:
OECD
IIECEP: Indigenous energy production.
EU/EUROSTAT UN-DSD/DESA Provisionallist for Chapter 4
None
2. POLICY RELEVANCE:
(a) Purpose: The indicator is a widely used measure of extent to which indigenous energyproduction is economically and environmentally competitive with imported energy inincreasingly global energy market.
(b) Relevance to Sustainable/Unsustainable Development: In principl, using indigenousenergy production rather than energy consumption, as an indicator, offers a better measure forthe overall pressure applied to the environment, in particular regarding energy depletion. On aglobal scale, total energy production, which is equivalent to primary energy consumption (asidefrom some stock variations and statistical errors) is in fact the primary source of the majority ofemitted pollutants into the atmosphere and the cause of a series of air pollution-related problems.On a regional scale, however, the production of different types of energy is associated with agreater or lesser significance for the occurrence of regional environmental problems. Theproduction of electricity from the combustion of fossil fuels, irrespective of the amount finallyexported, does indeed have a major regional contribution because the local release of air pollutantsdoes affect their regional concentration levels. Over the last few years, it has become apparentthat it will be virtually impossible to maintain the production of fossil fuels at current rates overthe long term because of the related adverse environmental effects and the gradual depletion offossil fuel reserves.
Regarding economic dimension indigenous energy production reflects the extent to whichindigenous energy sources are economically competitive with imported energy unless the optimallevel of energy security is provided.
(c) International Conventions and Agreements: Currently, there are no conventions oragreements specifically referring to the regulation and/or limitation of energyproduction/consumption. However, calls have been made for the rational use of energy, fuelefficiency improvements and the switch to cleaner forms of energy.ISED Methodology Sheets Indigenous energy production
Page 1 of4
(d) International Targets/Recommended Standards: Not available.
(e) Linkages to other indicators: In the Economic dimension the level of indigenous energyproduction is closely linked with total primary energy consumption (TPES), the energy netimports dependency and expenditures on energy sector. Concerning the Environmentaldimension, the energy production sector is responsible for the emissions of air pollutants andGHG and therefore, it is related to both the air pollution and the global climate change indicators.Energy production sector rather than energy consumption is also responsible for generation ofsolid and radioactive wastes, discharges into water basin, area of land taken up and fatalities dueto accidents. In addition, the growing global energy needs add to the demand on fossil anduranium reserves, the depletion of which is dealt with indicators of energy resource depletion- lifetimes of fossil fuels and uranium reserves.
3. METHODOLOGICAL DESCRIPTION
(a) Underlying Definitions and Concepts: Total indigenous production of energy is a keyaggregate in the energy balances. Production refers to the first stage of production and iscomprised by primary energy in the form of coal, crude oil, gas, nuclear, hydro, non-combustiblerenewables, and combustible renewables & waste (CRW). The total domestic electricityproduction is to be specified as well.
Coal includes primary solid fuels, such as hard coal, lignite, and peat.
Crude oil comprises crude oil and natural gas liquids. Refinery feedstocks and additives as well asother hydrocarbons are usually included but they are not part of indigenous production.
Gas in common includes natural gas (excluding natural gas liquids) and gas works gas, althoughthe latter is not part of indigenous production.
Hydro shows the energy content of the electricity produced in hydro power plants. Hydrooutput excludes output from pumped storage plants. Hydro-electricity production is accountedfor using 1 TWh = 0.086 Mtoe.
Nuclear shows the primary heat equivalent of the electricity produced by a nuclear power plantwith an average thermal efficiency of 33 per cent, i.e. 1 TWh = 0.086:0.33 = 0.261 Mtoe.
Non-combustible renewables includes geothermal, solar, wind, tide, and wave energy. Unless theactual efficiency of the geothermal process is known, the quantity of geothermal energy enteringelectricity generation is inferred from the electricity production at geothermal plants assuming anaverage thermal efficiency of 10 per cent. For solar, wind, tide and wave energy, the quantitiesentering electricity generation are equal to the electrical energy generated. Electricity is accountedfor the same heat value as electricity in final consumption (i.e. 1 TWh = 0.086 Mtoe). Direct useof geothermal and solar heat, and heat from heat pumps, that is extracted from ambientenvironment are also included here.
Combustible renewables & waste (CRW) comprises biomass (wood, vegetal waste, ethanol) andanimal products (animal materials/wastes and sulphite lyes), municipal waste (wastes producedby the residential, commercial and public service sectors that are collected by local authorities fordisposal in a central location for the production of heat and/or power) and industrial waste. Theshare of wood in CRW has to be specified.
For aggregation of fossil fuel into total indigenous energy production the amount of fuel producedISED Methodology Sheets Indigenous energy production
Page 2 of4

in physical terms (metric tones of coal and crude oil; cub.m of natural gas) should be convertedinto its heat content based on specific net calorific values for each source specified above. Ingeneral, specific net calorific values for different sorts of crude oil may be roughly estimated as 1toe/tonne. Gross calorific values of natural gas produced in different countries vary in range of0.8- 1 toe/1000 cub.m (Netherlands-0.8; Uzbekistan-0.90; Russia, US, Canada, and Saudi Arabia- 0.91; UK-0.94; Indonesia-0.98, Algeria and Norway - 1.0).
Note: The World Bank terms total indigenous primary energy production as commercial energyproduction, while CRW (excluding municipal waste and industrial waste) is termed as"traditional fuel". Prior to 1998 the IEA's terminology excluded CRW from primary energysources. In ISED terminology total primary energy sources excludes CRW as a conventionalenergy source. Thus, total primary energy comprises both conventional sources and CRW.
(b) Measurement Methods: The amount of energy produced can be derived from the energystatistics published by each country or various international or regional organisations (e.g. theInternational Energy Agency, EUROSTAT). The amounts of all primary energy sources such asfossil fuel, electricity, heat, and CRW must be considered. Production is calculated after removalof impurities and converted to heat content base on specific net calorific values.
(c) The Indicator in the DSR Framework: It is assigned as a State indicator of Economicdimension.
(d) Limitations of the Indicator:
(e) Status of the Methodology: There is no standardized methodology. Internationalrecommendations are available.
(f) Alternative Definitions/Indicators: Commercial energy production; Energy production percapita, or per unit of GDP.
The World Bank uses an indicator "Energy depletion", which is defined as the product of unitresource rents and the physical quantities of energy extracted. It covers crude oil, natural gas, andcoal.
4. ASSESSMENT OF DATA
(a) Data Needed to Compile the Indicator: Energy commodity data for production both ofprimary energy by fuels and by electricity.
(b) National and International Data Availability: Energy commodity data for productionand consumption are regularly available for most countries at the national level; and for somecountries, at the sub- national level. Both types of data are compiled by and available fromnational statistical offices and country publications.
Internationally, primary energy and electricity production data are compiled by the InternationalEnergy Agency (IEA) and the United Nations Statistics Division (UNSD). IEA data for non-OECD countries are based on national energy data adjusted to conform with annualquestionnaires completed by OECD member governments. UNSD data are primarily fromresponses to questionnaires sent to national governments, supplemented by official nationalstatistical publications and by data from intergovernmental organizations. When official data arenot available, the UNSD prepares estimates based on the professional and commercial literature.This variety of sources affects the cross-country comparability of data.
(c) Data Reference:
ISED Methodology Sheets Indigenous energy productionPage 3 of4

United Nations: Energy Statistics Yearbook;
United Nations: Energy Balances and Electricity Profiles',
United Nations: World Statistics Yearbook;
IEA: Energy Statistics ofOECD Countries, annually,
IEA: Energy Balance ofOECD Member Countries, annually,
IEA Energy Statistics and Balances and Non-OCED Member Countries, annually;
EUROSTAT: Energy Balances.
5. AGENCIES INVOLVED IN THE DEVELOPMENT OF THE INDICATOR
(a) Lead Agency: None.
(b) Other Contributing Organizations: Other organizations involved in the indicatordevelopment include the International Atomic Energy Agency (IAEA), the International EnergyAgency of the Organization for Economic Cooperation and Development (OECD/IEA), andEUROSTAT.
6. REFERENCES
(a) Readings:United Nations (1982). Concepts and Methods in Energy Statistics with Special Reference toEnergy Accounts and Balances.
United Nations (1987), Energy Statistics: Definitions, Units of Measure and ConversionFactors..
United Nations (1991), Energy Statistics: A Manual for Developing Countries.
The IEA, (2001), Key World Energy Statistics from the IEA, 2001 Edition,.
WB, World Development Indicators 2000,2001, the World Bank, Washington, D.C.
Eurostat (2001), Integration - indicators for energy Data 1985-98, European Commission, 2001Edition.
(b) Internet site:
United Nations Statistics Division: http ://www.un.org/Depts/unsd
UN Commission on Sustainable Development: http://esl.jrc.it/envind/sip/en/sip_enO 1 .htm
IEA: http://www.iea.org
WB: http://www.worldbank.org/data
ISED Methodology Sheets Indigenous energy productionPage 4 of 4

ENERGY NET IMPORTS DEPENDENCYDimension
EconomicAgenda 21
Chapter 4: Changingconsumption patterns
Placement in the CSD Theme/Sub-theme List
None
1. INDICATOR (#18)
(a) Name: Energy net imports dependency.
(b) Brief Definition: The ratio of net import (imports minus exports) to consumption ofprimary energy in a given year in total and by fuel types such as: oil & petroleum products, gas,coal; and electricity in particular.
(c) Unit of Measurement: %
(d) Correspondence with other ISD Sets:
OECD
None
EU/EUROSTAT
None
UN-DSD/DESA Provisionallist for Chapter 4
None
2. POLICY RELEVANCE:
(a) Purpose: This indicator measures the extent to which a country relies on imports to meet itsenergy needs.
(b) Relevance to Sustainable/Unsustainable Development: Maintaining a stable supply ofenergy is a core objective of policy in the pursuit of sustainable development. Importance ofenergy security in terms of the physical availability of supplies to satisfy demand at a given pricefor economic and social sustainability is paramount. Therefore energy supply interruptionsconstitute the sort of systematic risk that needs to be addressed by policies for sustainabledevelopment. It is noteworthy to say, that two different kinds of risk are involved: a quantityrisk and a price risk. Both risks are related to level of a country reliance on imported energy, thatis on its energy import dependence. Thus the general exposure to energy supply disruptions canbe limited by decreasing the import dependency, which in turn could be achieved through policiesto increase indigenous energy production, enhance energy efficiency, diversify fuel sources,optimize fuel mix, etc.
(c) International Conventions and Agreements: Not available.
(d) International Targets/Recommended Standards: In some countries there is arecommended level to which a country may rely on energy import.
(e) Linkages to other indicators: This indicator is closely linked to some of the economicindicators, such as indigenous energy production, energy consumption per capita, etc. It is alsolinked to such environmental indicator as lifetime of proven energy reserves.
3. METHODOLOGICAL DESCRIPTION
(a) Underlying Definitions and Concepts: The elements comprising this indicator are (i)primary energy in total, and by fuel (oil, gas, coal); and (ii) electricity.ISED Methodology Sheets Energy Net Imports Dependency
Page 1 of3

Two optional methods exist for calculation of net energy imports.
First, Net energy import is calculated as import minus export, both measured in oil equivalents.
Imports and exports comprise amounts having crossed the national territorial boundaries of thecountry, whether or not customs clearance has taken place.
Oil: Quantities of crude oil and petroleum products imported or exported under processingagreements (i.e. refining on account) are included. Quantities of oil in transit are excluded. Crudeoil, NGL and natural gas are reported as coming from the country of origin; refinery feedstocksand petroleum products are reported as coming from the country of last consignment.
Re-exports of oil imported for processing within bonded areas are shown as exports of productfrom the processing country to the final destination.
Coal: Imports and exports comprise the amount of fuels obtained from or supplied to othercountries, whether or not there is an economic or customs union between the relevant countries.Coal in transit is not included.
Electricity: Amounts are considered as imported or exported when they have crossed the nationalterritorial boundaries of the country.
Net import of total primary energy is calculated as a sum of energy sources specified above.
Second, Net import is estimated as energy consumption less production, both measured in oilequivalents.
In both methods a negative value indicates that the country is a net exporter.
(b) Measurement Methods: This indicator is computed by calculating the ratio of net import toconsumption or to production if net import has negative value. All values are in oil equivalents.
For an importing country:
Indicator = 100 x net import/consumption = 100x(import-export)/consumption; or
= 100x(consumption-production)/consumption= lOOx (1-production/consumption)
For an exporting country:
Indicator = lOOx net import/production = 100x(import-export)/production; or
= 100*(consumption-production)/production = lOOx (consumption/production-1).
The indicator is computed in respect to (i) primary energy in total and by fuel (oil, gas, coal); and(ii) electricity.
(c) The Indicator in the DSR Framework: Indicator is assigned as a State indicator ofEconomic Dimension.
(d) Limitations of the Indicator:
(e) Status of the Methodology: Not available.
(f) Alternative Definitions/Indicators:
4. ASSESSMENT OF DATA
(a) Data Needed to Compile the Indicator:
ISED Methodology Sheets Energy Net Imports DependencyPage 2 of3

L Primary energy import, export, production, and consumption in total; and by fuel: oil,gas, and coal,
ii. Electricity import, export, consumption, and production.
(b) National and International Data Availability: Data on energy imports, exports and onproduction consumption by fuel are available from national statistical offices and countrypublications, and various international sources (IEA, World Bank).
(c) Data Reference:
IEA: Energy Balances ofOECD Countries, 1990-2001, annually.
IEA: Energy Statistics and Balances ofNon-OECD Countries, 1990-2001, annualy.
United Nations: Energy Statistics Yearbook and Energy Balances and Electricity Profiles.
5. AGENCIES INVOLVED IN THE DEVELOPMENT OF THE INDICATOR
(a) Lead Agency: None.
(b) Other Contributing Organizations: The agencies interested in the development of thisindicator are International Energy Agency, International Atomic Energy Agency.
6. REFERENCES
(a) Readings:
Concepts and Methods in Energy Statistics with Special Reference to Energy Accounts andBalances. United Nations, 1982.
Energy Statistics: Definitions, Units of Measure and Conversion Factors. United Nations, 1987.
Energy Statistics: A Manual for Developing Countries. United Nations, 1991.
Key World Energy Statistics from the IEA, 2001 Edition, The IEA, 2001.
World Development Indicators 2000, 2001, the World Bank, Washington D.C.
(b) Internet site:United Nations Statistical Division: http://www.un.orgPepts/unsd/UN Commission on Sustainable Development: http://esl.jrc.it/envind/sip/en/sip_enO 1 .htmIEA: http://www.iea.orgWB: http://www.worldbank.org/data
ISED Methodology Sheets Energy Net Imports DependencyPage 3 of3