Integration of Hydrometeorological and Climate Information...
48
Center for Hydrometeorology and Remote Sensing, University of California, Irvine Ensuring Water in a Changing World Ensuring Water in a Changing World Integration of Hydrometeorological and Climate Information in Water Resources System Operation and Design Soroosh Sorooshian Center for Hydrometeorology and Remote Sensing University of California Irvine The Abdus Salam ICPT Conference on: Water Resources in Developing Countries: Planning & Management under Climate Change Scenario Trieste, Italy: Apr. 27 th - May 8 th 2009
Transcript of Integration of Hydrometeorological and Climate Information...

Center for Hydrometeorology and Remote Sensing, University of California, Irvine
Ensuring Water in a Changing WorldEnsuring Water in a Changing World
Integration of Hydrometeorological and Climate Information in Water Resources System Operation
and Design
Soroosh SorooshianCenter for Hydrometeorology and Remote Sensing
University of California Irvine
The Abdus Salam ICPT Conference on: Water Resources in Developing Countries: Planning & Management under Climate Change Scenario Trieste, Italy: Apr. 27th- May 8th 2009

Center for Hydrometeorology and Remote Sensing, University of California, Irvine
Short Range Long Range
hours days weeks months seasons years decades
Required Hydrometeorologic Predictions
Forecast Requirements
Short-range Mid-range Long-range

Center for Hydrometeorology and Remote Sensing, University of California, Irvine
Climate, Hydrology and Water Resources
• How will Climate effect water Availability?
• Can we predict the future changes which are responsive to “user” needs?
Center for Hydrometeorology and Remote Sensing, University of California, Irvine
What Do “Instrumental”Records Tell Us? What Do “Instrumental”Records Tell Us?
Hydrologically-Relevant Climate Variables

Center for Hydrometeorology and Remote Sensing, University of California, Irvine
Changes in Precipitation: U.S.A
From 1908-2002:
Total annual precipitation across the contiguous U.S. increased 7%
Heavy daily Precipitation events have increased by 20%
Rainfall associated with warmer climates are more due to extreme events compared to colder climates
Facts from Observations
10
0Confidence Index
Source: Tom Karl NCDC-NOAA 2007

Center for Hydrometeorology and Remote Sensing, University of California, Irvine
Global Variations in Precipitation (1979-2005) 90N-90S
Global mean = 2.6 mm/d (Ocean [ 2.8 mm/d ] Land[ 2.1 mm/d ])
• Little or no linear change during period [biggest change is +2% over ocean]
• Ocean and land precipitation tend to compensate
Adler et al. J. Hydromet.

Center for Hydrometeorology and Remote Sensing, University of California, Irvine
What Do Climate Models Tell Us About the Future which May Be Useful for Water Resources Applications ?
What Do Climate Models Tell Us About the Future which May Be Useful for Water Resources Applications ?
Hydrologically-Relevant Climate Variables

Center for Hydrometeorology and Remote Sensing, University of California, Irvine
Seasonal and Inter-Annual Time-Scales
Climate Predictions into the Future!

Center for Hydrometeorology and Remote Sensing, University of California, Irvine
Canadian Prairie drought 1999-2005
500 km
2001/02
Source: Ronald Stewart

Center for Hydrometeorology and Remote Sensing, University of California, Irvine
SEASONAL PREDICTIONS: Summer of 2005 - Canada
PREDICTION
BelowNormal
Source: Ronald Stewart

Center for Hydrometeorology and Remote Sensing, University of California, Irvine
SEASONAL PREDICTIONS: Summer of 2005 - Canada
PREDICTION OBSERVATION
AboveNormal
BelowNormal
Source: Ronald Stewart

Center for Hydrometeorology and Remote Sensing, University of California, Irvine
(flooding at the end of the drought)
St. Jean de Baptiste, ManitobaJuly 2005
Source: Ronald Stewart

Center for Hydrometeorology and Remote Sensing, University of California, Irvine
Recent Assessment of Seasonal Climate Forecasts •“ of the dozens of forecast techniques proffered by government, academic, private-sector climatologists, all but two are virtually useless, according to a new study” Livezey &Timofeyeva - BAMS,
June 2008.
• “About the only time forecasts had any success predicting precipitation was for winters with an El Nino or a La Nina”
Quoting from Science, Vol. 321, 15th August 2008

Center for Hydrometeorology and Remote Sensing, University of California, Irvine
Some Results from Long Time-Scales
Climate Predictions into the Future!
Center for Hydrometeorology and Remote Sensing, University of California, Irvine
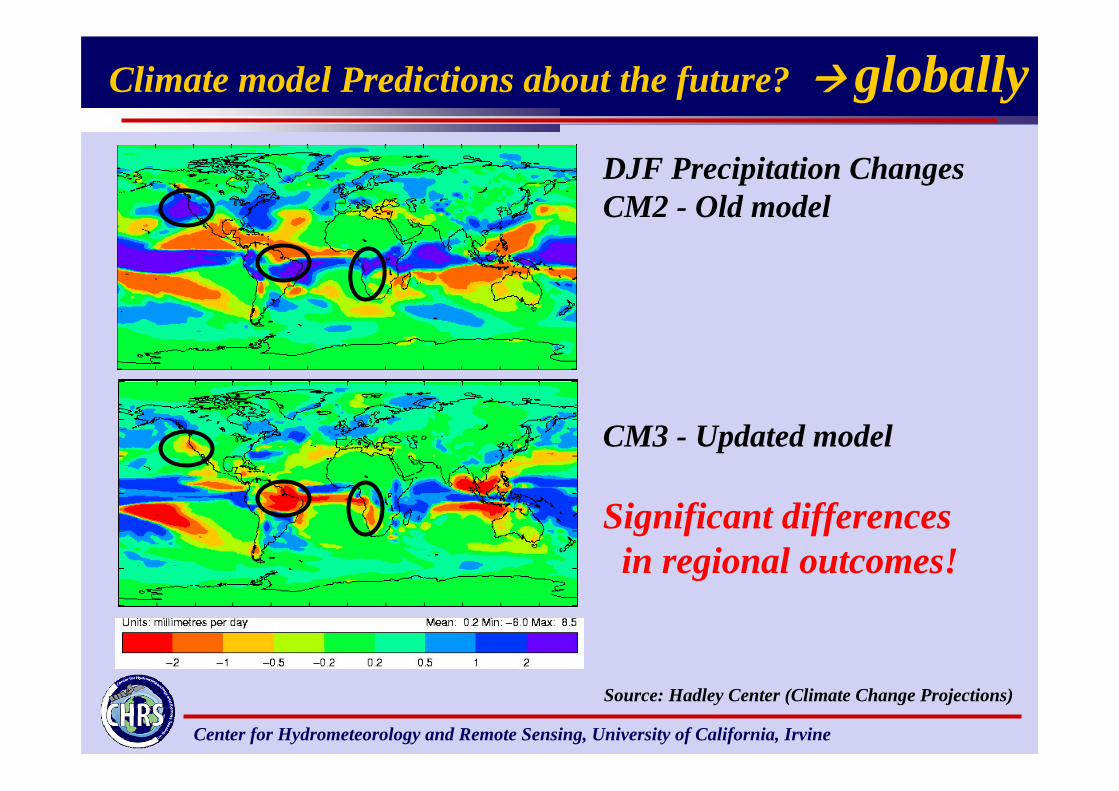
Climate model Predictions about the future? globallyDJF Precipitation ChangesCM2 - Old model
CM3 - Updated model
Significant differences in regional outcomes!
Source: Hadley Center (Climate Change Projections)

Center for Hydrometeorology and Remote Sensing, University of California, Irvine
A Dryer Future for Southwest US?

Center for Hydrometeorology and Remote Sensing, University of California, Irvine
Observed changes: Drought
• U.S. droughts show pronounced multi-year to multi-decadal variability, but no convincing evidence for long-term trends toward more or fewer events.
Drought activity during the 20th and early 21st Century
10
0
5Confidence Index
Based on Palmer Drought IndexModerate to Extreme Drought
Source: Tom Karl NCDC-NOAA 2007
Center for Hydrometeorology and Remote Sensing, University of California, Irvine
Recent Articles About the efficacy of climate models

Center for Hydrometeorology and Remote Sensing, University of California, Irvine
Recent Articles About the efficacy of climate models

Center for Hydrometeorology and Remote Sensing, University of California, Irvine
Recent Articles About the efficacy of climate models

Center for Hydrometeorology and Remote Sensing, University of California, Irvine
Recent Assessment of Climate Models
• “Regional trends in extreme events are not always captured by current models, but it is difficult to assess the significance of these discrepancies and to distinguish between modeldeficiencies and natural variability.”
How Accurate Are Global Climate Models?

Center for Hydrometeorology and Remote Sensing, University of California, Irvine
•Presently, the accuracy of regional-scale climate model predictions fall short of meeting the requirements of water resources planning.
• Hardly used for operational Purposes and unwise to push their use while highly uncertain.
Therefore, Factoring in Resiliency in water resources systems design and planning is still the safest approach!
What is the Message?

Center for Hydrometeorology and Remote Sensing, University of California, Irvine
Back to Operational and Design Practices in Water Resources
Planning

Center for Hydrometeorology and Remote Sensing, University of California, Irvine
Factoring in Climate
Engineering Approach: Build and operate infrastructures
toControl, Store & Deliver water
for Multi-Purpose Uses

Center for Hydrometeorology and Remote Sensing, University of California, Irvine
Hoover Dam
Glen Canyon Dam
Central Arizona Project Aqueduct
A Century of Water Resources Development: Engineering success!

Center for Hydrometeorology and Remote Sensing, University of California, Irvine
18001900
1950
Impact of Dam & Reservoir Construction
2000
More than 70,000 Dams in the U.SMore than 70,000 Dams in the U.S
Provided by: C. J. Vörösmarty

Center for Hydrometeorology and Remote Sensing, University of California, Irvine
Addressing “ Climate Extremes” in Water Resources Planning:
Stochastic Hydrology

Center for Hydrometeorology and Remote Sensing, University of California, Irvine
Probability density function
Time (years)Present
Future
10 20 30 40 50 60 70 80 90 100 -40 -30 -20 -10 0
Flo
w
Past
Time (years)
Flo
w
-40 0
Present
Statistical Hydrology: “synthetic” streamflow Generation

Center for Hydrometeorology and Remote Sensing, University of California, Irvine
1 0.5 0.2 0.1 0.05 0.02 0.01 0.005 0.002 0.001 Probability of Exceedance
Return Period (Years)1 2 5 10 20 50 100 200 500 1000
600
500
400
300
200
100
0
Dis
char
ge(1
000
cfs)
Potential Hydrologic Scenarios 1. Precipitation and Runoff Trends 1. Precipitation and Runoff Trends
(e.g. (e.g. increase/decreaseincrease/decrease))2. Hydrologic Variability 2. Hydrologic Variability
(e.g. (e.g. magnitude/severity/durationmagnitude/severity/duration))
Higher Mean
Lower Mean
Higher Variability
Lower Variability

Center for Hydrometeorology and Remote Sensing, University of California, Irvine
Impact of Nonstationarity on Water Resources
Center for Hydrometeorology and Remote Sensing, University of California, Irvine
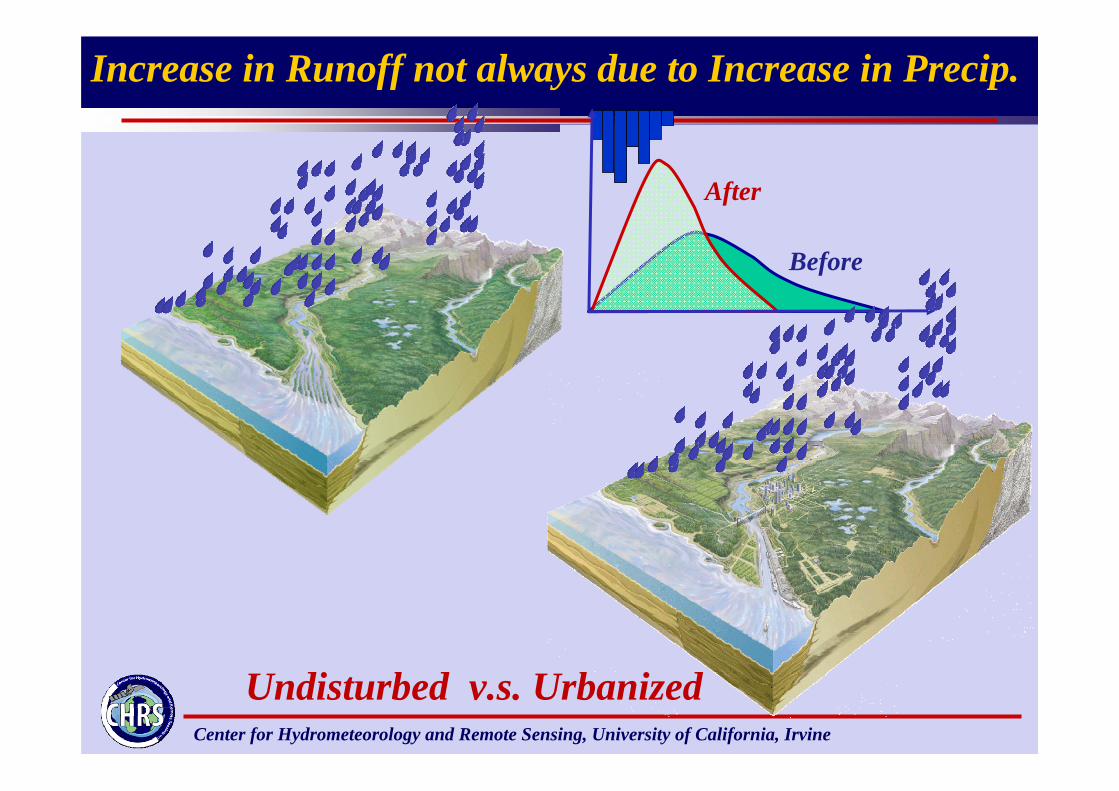
Increase in Runoff not always due to Increase in Precip.
Before
After
Undisturbed v.s. Urbanized

Center for Hydrometeorology and Remote Sensing, University of California, Irvine
What is the Big Deal About Characterizing the Long-
Term Uncertainties in Hydro-Climate Variables?

Center for Hydrometeorology and Remote Sensing, University of California, Irvine
Flood Damage Assessment
Flood Plain Mapping and Zoning

Center for Hydrometeorology and Remote Sensing, University of California, Irvine
Highway Culvert Design

Center for Hydrometeorology and Remote Sensing, University of California, Irvine
A Page From the CalTran Highway Design Manual

Center for Hydrometeorology and Remote Sensing, University of California, Irvine
How About Drought Frequency Analysis Methods?
Not to my Knowledge. No comprehensive program until recently.

Center for Hydrometeorology and Remote Sensing, University of California, Irvine
Some of the Issues facing the Arid & Semi-Arid
Regions:
Implications of Hydrologic Variability
(Extremes) and Ecological changes

Center for Hydrometeorology and Remote Sensing, University of California, Irvine
2 Precipitation Scenarios with different Temporal properties
Monthly Total
100 mm
100 mm
A
B
Idea from: K. Trenberth, NCARIdea from: K. Trenberth, NCAR
Frequency 6.7%Intensity 50.0 mm
Frequency 67%Intensity 5.0 mm

Center for Hydrometeorology and Remote Sensing, University of California, Irvine
Importance of Temporal Scale : Daily Precip. at 2 stations
Monthly total: 100 mmFrequency: 67 %Intensity: 5 mm/day
Monthly total: 100 mmFrequency: 6.7 %Intensity: 50 mm/day

Center for Hydrometeorology and Remote Sensing, University of California, Irvine
0
20
40
1 6 11 16 21 26
0
20
40
1 6 11 16 21 26 Frequency 6.7%Intensity 50.0 mm
Frequency 67%Intensity 5.0 mm
MonthlyAmount 100 mm
Amount 100 mm
local FloodsStream bed Recharge
soil moisture replenishedvirtually no runoff
A
B
Idea from: K. Trenberth, NCARIdea from: K. Trenberth, NCAR
Importance of Temporal Scale : Daily Precip. at 2 stations
Center for Hydrometeorology and Remote Sensing, University of California, Irvine
s
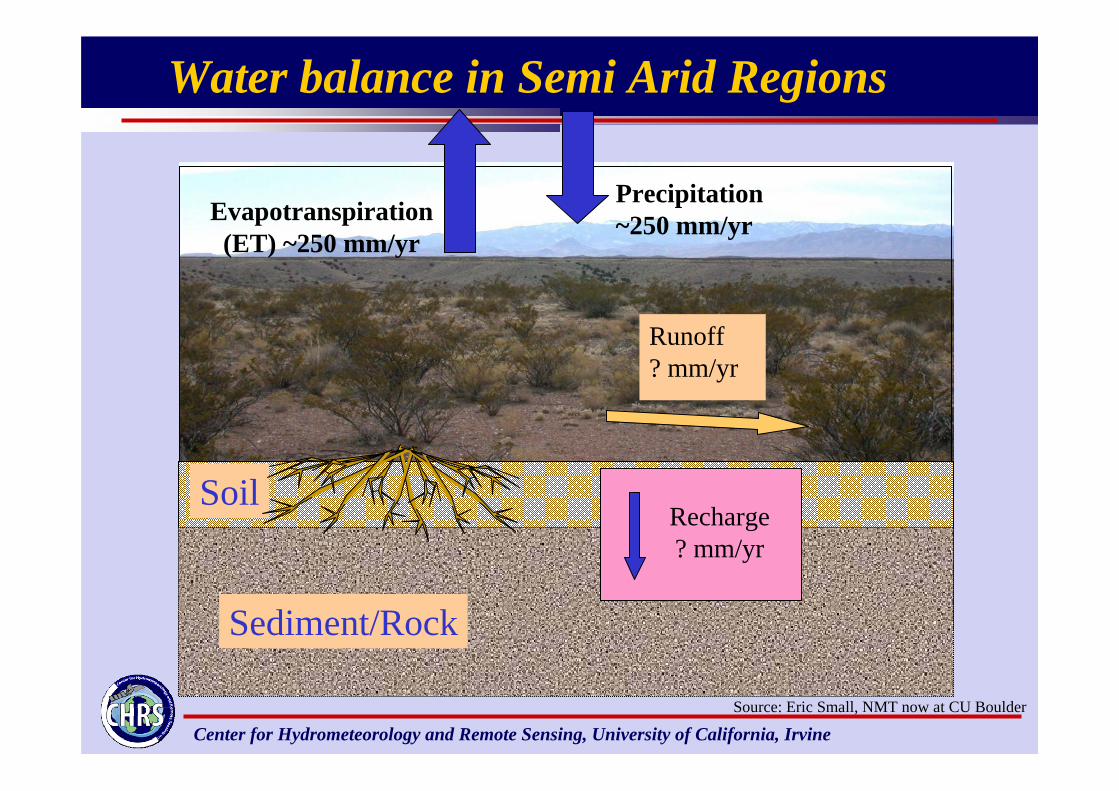
Soil
Sediment/Rock
Precipitation~250 mm/yr
Runoff? mm/yr
Evapotranspiration(ET) ~250 mm/yr
Recharge? mm/yr
Water balance in Semi Arid Regions
Source: Eric Small, NMT now at CU Boulder

Center for Hydrometeorology and Remote Sensing, University of California, Irvine
s
Soil
Sediment/Rock
Precipitation25 billion m3 yr-1
Runoff1 billion m3 yr-1
Evaporation7 billion m3 yr-1
Recharge2.5 billion m3 yr-1
Data Source: West & Broadherst (1975)
Where are the critical gaps in understanding?
Transpiration15 billion m3 yr-1
Water balance of the Rio Grande basin in New MexicoWater balance of the Rio Grande basin in New Mexico
Visualization: Eric Small, NMT now at CU Boulder

Center for Hydrometeorology and Remote Sensing, University of California, Irvine
Semi-arid grasslands in New Mexico and Arizona
are being replaced by deep rooted shrubs.
Vegetation change in the Southwestern US:

Center for Hydrometeorology and Remote Sensing, University of California, Irvine
Groundwater recharge through semiarid soils is measured in mm per year.
Only mm per year?!?!Does it really matter?
Recharge through semiarid soils
(Stephens,1994)
Slide contents from Walvoord & Phillips - NMT

Center for Hydrometeorology and Remote Sensing, University of California, Irvine
Vegetation cover changes Impacts Infiltration
Soil
Runoff Runoff
Infil
InfilSoil
GRASSLAND
SHRUBLAND
3 m
0.5 m
Source: Eric Small, NMT now at CU Boulder
Original Recharge ~ 2 mm/yr
Revised Recharge rate ~ 0.02 mm/yr

Center for Hydrometeorology and Remote Sensing, University of California, Irvine
Upper Rio Grande Basin – CO and NM
Alamosa
Santa Fe
Albuquerque
Elephant Butte Res
Caballo Res.
Las Cruces
El Paso
Map from C. Duffy
Basin Area: 60,000 km2
Population: 1,200,000
Recharge ~ 2 mm/yr
Ground Water for 1.6 Million People
Recharge ~0.02 mm/yr
Ground Water for only 16,000 people
Slide contents from Walvoord & Phillips - NMT

Center for Hydrometeorology and Remote Sensing, University of California, Irvine
• Despite advances to date, predicting the future Hydro-Climate variables will remain a major challenge:
• While investment in model development is fully justified, we must also improve the “engineering approaches” currently used in practice for operational and planning purposes.
• Long-term and sustained observation programs are critical, especially for model verification. Without some degree of verifiability, hard to expect their use
What is the Message?

Center for Hydrometeorology and Remote Sensing, University of California, Irvine
Thank You For ListeningThank You For Listening
The Rio Grande River, NM Photo: J. Sorooshian 2005