
Acute Myocardial Infarction Acute Myocardial Infarction (AMI ...
Upload
vibha-amblihalliCategory
view
234download
0
IS TECHNOLOGICAL CHANGE IN
MEDICINE ALWAYS WORTH IT? THE
CASE OF ACUTE MYOCARDIAL
INFARCTION
“Waste and inefficiency are not inevitable by-products of technological
growth.”
Jonathan S. Skinner, Douglas O. Staiger and Elliott S. Fisher
5th April, 2016
Vibha Amblihalli
Sanjana Srinivasan
PREVIOUS RESEARCH
David Cutler et al. argue “the benefits from many
technological innovations more than justify the
rising costs of health care”
Rapid decline in mortality following Acute Myocardial
Infarction (AMI)
1984 to1998 - increase cost of Rx heart attack by
$10,000, and life expectancy rose by about 1 year
Elliott Fisher et al (Medicare)
Higher healthcare cost didn’t have better outcome, nor
did they gain better access to care or report greater
satisfaction
A state level data: –ve associative between quality of
care and healthcare spending!!
WHAT IS NEW ABOUT THIS PAPER?
Analysis on AMI mortality and spending
expanded data set that stretches from 1986 to 2003.
Questions to be answered
Did the observed survival gain in the earlier data continue
into the current century?
Have recent increases in health care costs still been worth it?
Did regions with rapid improvement in health outcomes also
experience rapid increases in costs?
Were there specific regional characteristics (low-cost, highly
effective Rx) which could be associated with better health-
outcome with unusual low spending increases?
STUDY DATA AND METHODS
Data:
Part A: hospital claims data from 1986–2003 were
merged with the Medicare Denominator File through
2003 to create a longitudinal cohort of fee for-service
(FFS) enrollees aged ≥65 who had new AMI - 2,872,050
valid AMI events found.
Spending data are available only through the end of
2003
One-year survival and spending data are analyzed from
1986 to 2002.
Part B spending data from 1993-2002: 5 % sample
from 1993–1997 and 20% sample for 1998–2002
PRIMARY AND SECONDARY ANALYSIS
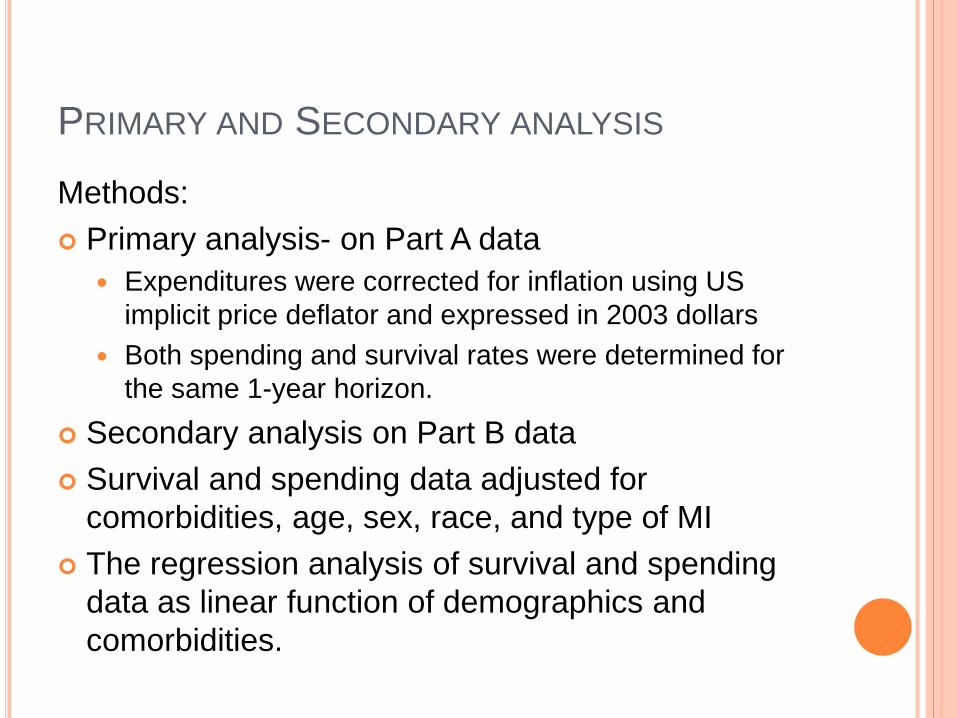
Methods:
Primary analysis- on Part A data
Expenditures were corrected for inflation using US
implicit price deflator and expressed in 2003 dollars
Both spending and survival rates were determined for
the same 1-year horizon.
Secondary analysis on Part B data
Survival and spending data adjusted for
comorbidities, age, sex, race, and type of MI
The regression analysis of survival and spending
data as linear function of demographics and
comorbidities.

REGION SPECIFIC ANALYSIS
Done using data from 306 Hospital Referral Regions
(HRRs) across U.S. between 1986-2002
Region specific measure of annual survival and
spending were constructed
Regression analysis with adjustment for
comorbidities and demographics
Rationale : Analysis ensured that the results reflect
regional practice patterns rather than regional
differences in patient characteristics
Regions differed dramatically in their AMI treatment
strategies as well as reliance upon multiple physicians
per patient.

REGIONAL ANALYSIS
Research was focused on two region-level
dimensions of care.
1. Index of low-cost, highly effective treatments for AMI -
aspirin at discharge, beta-blockers at discharge, and
reperfusion within twelve hours of admission
quality measures were % patients in each region deemed idea
for Rx who actually did receive Rx
Quality measure range from 1 (<national median for all 3
measures) to 4 (>national median for all 3 measures)
2. Average no. of different physicians treating the patient
within one year of AMI, averaged across all patients in
the HRR in 1994-95.
REGIONAL ANALYSIS
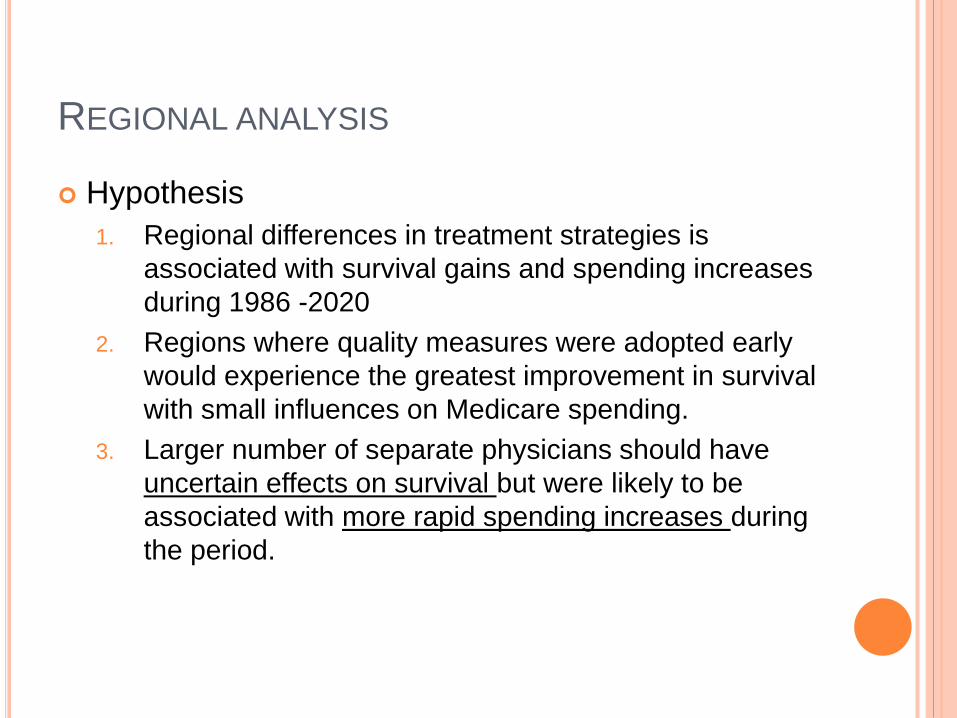
Hypothesis
1. Regional differences in treatment strategies is
associated with survival gains and spending increases
during 1986 -2020
2. Regions where quality measures were adopted early
would experience the greatest improvement in survival
with small influences on Medicare spending.
3. Larger number of separate physicians should have
uncertain effects on survival but were likely to be
associated with more rapid spending increases during
the period.
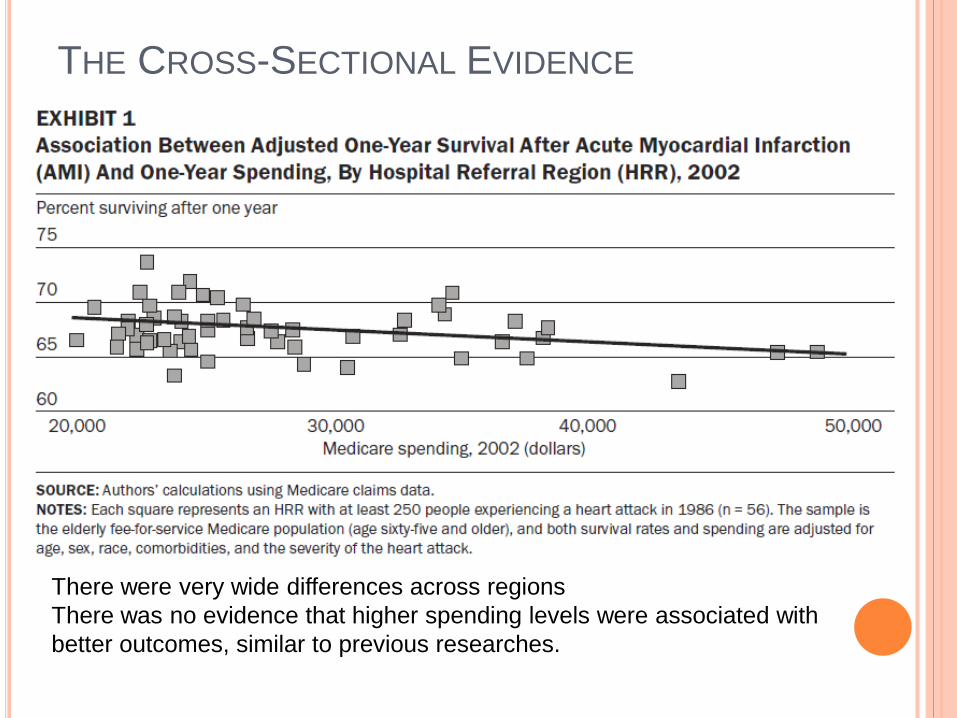
THE CROSS-SECTIONAL EVIDENCE
There were very wide differences across regions
There was no evidence that higher spending levels were associated with
better outcomes, similar to previous researches.
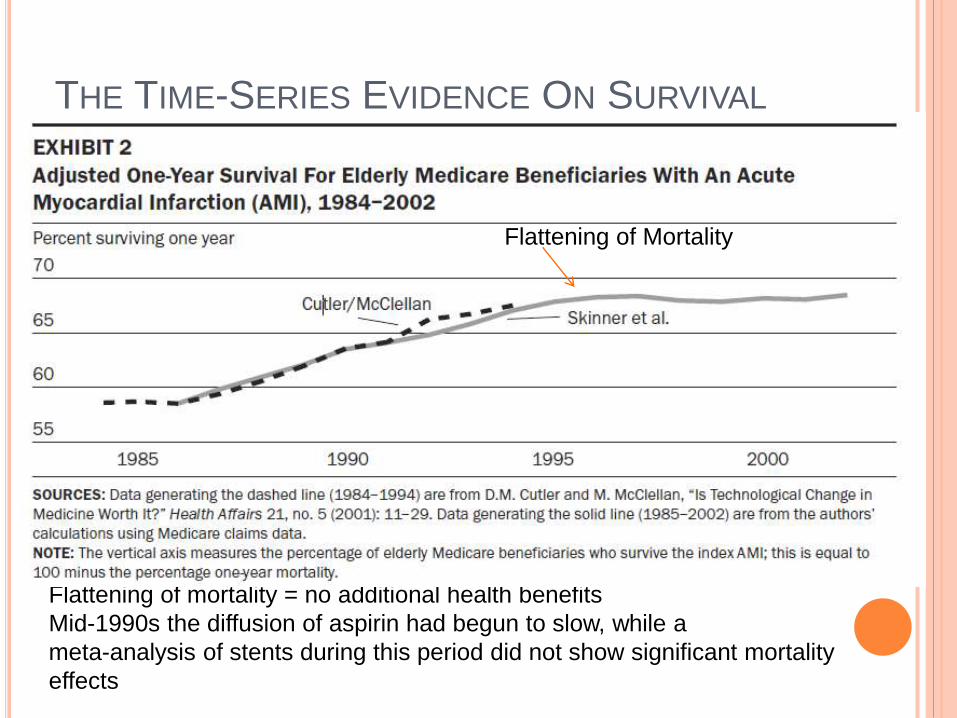
THE TIME-SERIES EVIDENCE ON SURVIVAL
Flattening of mortality = no additional health benefits
Mid-1990s the diffusion of aspirin had begun to slow, while a
meta-analysis of stents during this period did not show significant mortality
effects
Flattening of mortality Flattening of Mortality
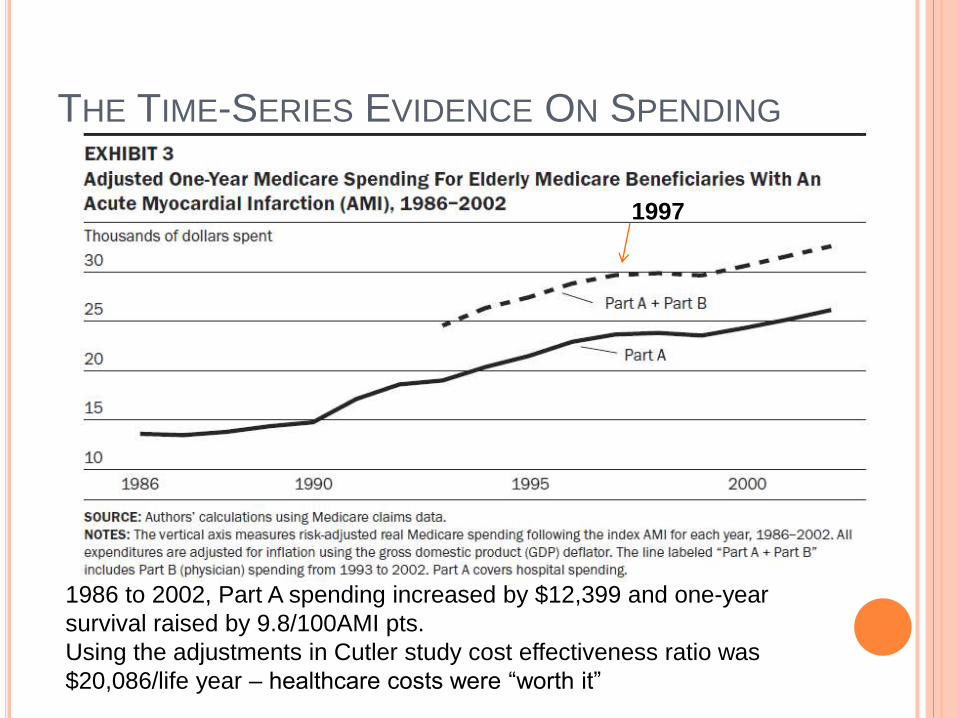
THE TIME-SERIES EVIDENCE ON SPENDING
1986 to 2002, Part A spending increased by $12,399 and one-year
survival raised by 9.8/100AMI pts.
Using the adjustments in Cutler study cost effectiveness ratio was
$20,086/life year – healthcare costs were “worth it”
1997
REGIONAL CHANGES IN SURVIVAL AND
EXPENDITURES
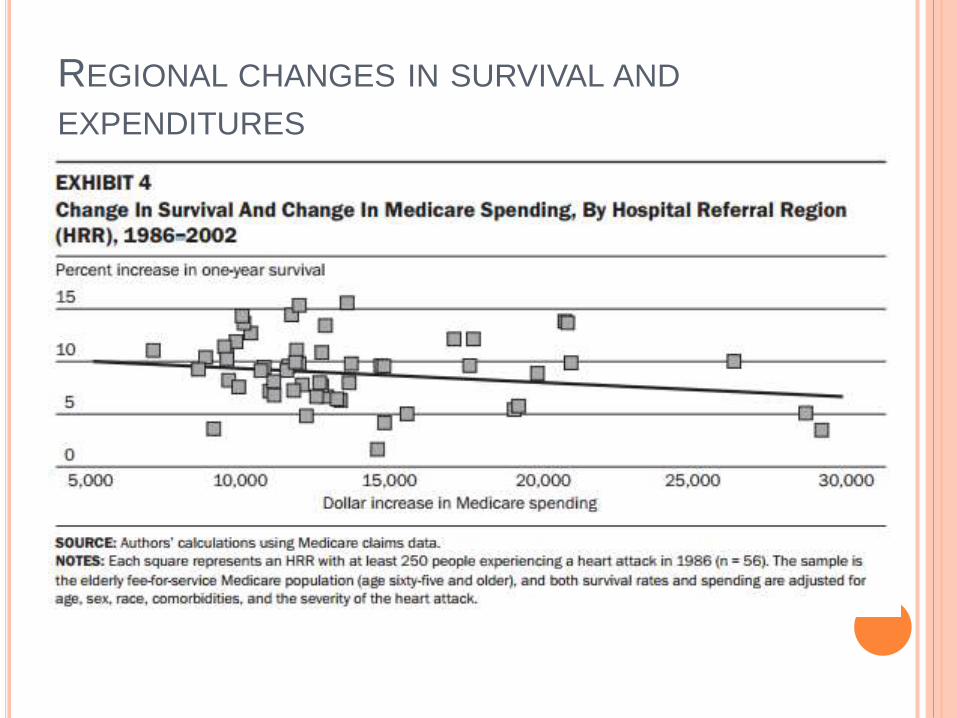
REGIONAL CHANGES IN SURVIVAL AND
EXPENDITURES
Increase in expenditures not associated with
increase in survival
If anything, there is a negative correlation between the
two
Statistical analysis shows that the correlation
coefficient between growth in spending and survival
is -0.21 (p < 0.001)
Changes in reimbursement rates across regions and in
the quality of care provided.
At best, no association between growth and
survival gains
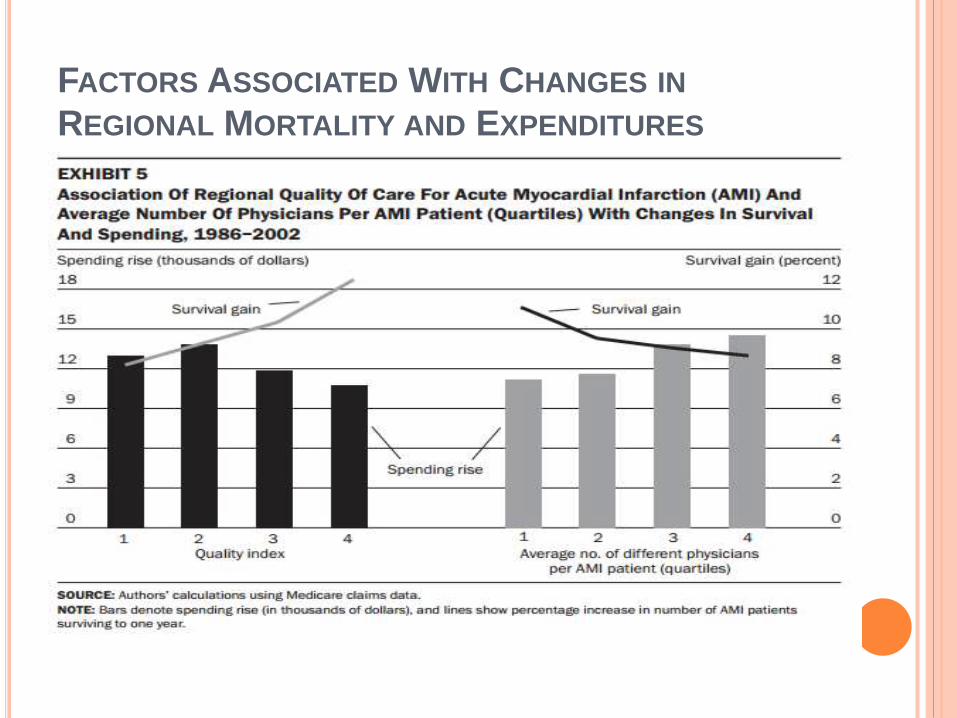
FACTORS ASSOCIATED WITH CHANGES IN
REGIONAL MORTALITY AND EXPENDITURES
Exhibit 4 suggests large differences in regional
productivity
Highly productive regions = rapid growth in survival
rates, below-average growth in expenditures
Low productivity regions = below-average survival
gains, above-average growth in expenditures
Can the two variables from the 1994/1995 study –
quality index and average number of different
physicians predict high and low productivity
regions?
FACTORS ASSOCIATED WITH CHANGES IN
REGIONAL MORTALITY AND EXPENDITURES
FACTORS ASSOCIATED WITH CHANGES IN
REGIONAL MORTALITY AND EXPENDITURES
Exhibit 5a controls for average number of different
physicians, and Exhibit 5b holds the quality index at
a constant
Varying both the quality index and the average
number of different physicians yielded an effect that
was large in magnitude and highly significant
Highest productivity regions = best quality index AND
lowest average physicians
Predicted better survival growth (7.0/100 patients) and lower
cost increase (over $5000) than the lower productivity regions
DISCUSSION
Between 1986 and 2002
Average 1-year survival rate following AMI increased by
10 AMI patients
Estimated cost – less than $25,000 per life year saved
Huge amount of heterogeneity
very little improvement after 1996 despite growing
expenditures
Variation in survival gains across regions and times
Regional gains in survival were negatively related to
costs
So are increasing expenditures on medical care
“worth it” or not?
DISCUSSION
“Flat of the curve” – changes in patient outcomes
over time reflect valuable technological change, but
incremental spending provides little benefit or could
harm patients
Doesn’t explain the patterns found in this study
Overuse of treatments cannot explain why regions with
high spending are less likely to provide effective
treatment
This hypothesis is not consistent with findings that areas
with lower survival gains and higher cost lagged in
adopting low cost, non-invasive treatment

DISCUSSION
DISCUSSION
The proposed model reconciles the cross-sectional and
time series evidence
There is a negative correlation between spending and
survival – can be seen when comparing points B and C
On average, everyone is better off, but regional gains are not
correlated with regional expenditures
Assumption: uneven diffusion of cost-effective
innovations drives differences in patient costs and
outcomes
Use of low-cost and non-invasive treatments reduces the
incremental benefit of expensive, invasive treatments
Adoption of these low cost innovations may have caused
reduction in health care costs
POLICY IMPLICATIONS OF PROPOSED
APPROACH
Model does not preclude that cutting costs in the
low-efficiency, high-cost regions would impact
quality of care
Policies should focus on improving productivity – not
necessarily decreasing costs, but restructuring
resources to be spent on more efficient treatments or
processes
Does not suggest that focus be on “low-tech”
effective treatments. Preliminary results suggest
that “high-tech” options like surgery were not the
cause of expenditure growth between 1986 and
2002
AUTHORS’ CONCLUSIONS
Benefits of health care technology are substantial, but costs to consumers, producers and the government should be of real value to patients
Some regions in this study were able to implement technological innovations at low cost in an efficient fashion
Waste and high costs are not an inevitable by-product of technology
Keeping quality of care and efficiency in mind will help providers adopt low cost effective care, which may foster the growth of technological progress

THANK YOU!