IS MORE CHOCOLATE BAD FOR POVERTY? AN · PDF fileINDUSTRIAL POLICIES ON POVERTY AND...
39
1 IS MORE CHOCOLATE BAD FOR POVERTY? AN EVALUATION OF THE IMPACT INDUSTRIAL POLICIES ON POVERTY AND INDUSTRIALIZATION IN GHANA 1 Francis Mulangu 2 African Center for Economic Transformation Accra, Ghana Mario Miranda Ohio State University Columbus, OH USA Eugenie Maiga University of Koudougou Koudougou, Burkina Faso DRAFT VERSION Abstract Industrialization has recently reemerged in development policy debates, both among sub-Saharan African (SSA) countries eager to pursue economic transformation and at the global level, as industrialization is mentioned in Goal 9 of the Zero Draft of the Sustainable Development Goals (SDGs) that are to be made final by the UN General Assembly in September 2015. For an SSA country such as Ghana, industrialization will start with a competitive agro-processing sector that leverages on its comparative advantage in cocoa beans production to establish a competitive cocoa processing sector. However, while Ghana has been producing cocoa beans even before its independence, its global share of processed cocoa is far below its share of cocoa beans produced because markets often fail to correct for the gains that accrued over time from declining unit costs and learning by doing. While effective subsidization of increasing return cocoa processing firms engaged in global market share rivalry is seen as the preferred industrial policy for correcting this, evidence of its impact on other cocoa value chain players, especially poor cocoa producers, has never been systematically analyzed. The purpose of this study is to understand how industrial policies in the form of cocoa pricing options affect local processors’ cocoa acquisition, processing, and inventory decisions, with the ultimate goal of determining what policies best meet the multiple, but possibly conflicting, public policy objectives of maximizing government revenue, maximizing and stabilizing processor profits and throughput, and reducing poverty rates of cocoa bean producers. To evaluate these effects, we construct and numerically solve a structural dynamic model of a representative cocoa processor that maximizes the present value of current and expected future profits, given prevailing market conditions and cocoa pricing options. We then took the predicted cocoa pricing options to determine their associated poverty impacts among cocoa producers. 1 This paper benefited from financial resources provided through a 2013 Innovative Research Grant from The African Growth and Development Policy Modeling Consortium (AGRODEP). The authors thank Antoine Bouet and an anonymous reviewer for their constructive guidance on earlier versions of the paper. 2 Lead and corresponding author. Telephone: +233 203100681; e-mail address: [email protected]
Transcript of IS MORE CHOCOLATE BAD FOR POVERTY? AN · PDF fileINDUSTRIAL POLICIES ON POVERTY AND...
1
IS MORE CHOCOLATE BAD FOR POVERTY? AN EVALUATION OF THE IMPACT
INDUSTRIAL POLICIES ON POVERTY AND INDUSTRIALIZATION IN GHANA1
Francis Mulangu2 African Center for Economic
Transformation Accra, Ghana
Mario Miranda Ohio State University Columbus, OH USA
Eugenie Maiga University of Koudougou Koudougou, Burkina Faso
DRAFT VERSION
Abstract
Industrialization has recently reemerged in development policy debates, both among sub-Saharan African (SSA) countries eager to pursue economic transformation and at the global level, as industrialization is mentioned in Goal 9 of the Zero Draft of the Sustainable Development Goals (SDGs) that are to be made final by the UN General Assembly in September 2015. For an SSA country such as Ghana, industrialization will start with a competitive agro-processing sector that leverages on its comparative advantage in cocoa beans production to establish a competitive cocoa processing sector. However, while Ghana has been producing cocoa beans even before its independence, its global share of processed cocoa is far below its share of cocoa beans produced because markets often fail to correct for the gains that accrued over time from declining unit costs and learning by doing. While effective subsidization of increasing return cocoa processing firms engaged in global market share rivalry is seen as the preferred industrial policy for correcting this, evidence of its impact on other cocoa value chain players, especially poor cocoa producers, has never been systematically analyzed. The purpose of this study is to understand how industrial policies in the form of cocoa pricing options affect local processors’ cocoa acquisition, processing, and inventory decisions, with the ultimate goal of determining what policies best meet the multiple, but possibly conflicting, public policy objectives of maximizing government revenue, maximizing and stabilizing processor profits and throughput, and reducing poverty rates of cocoa bean producers. To evaluate these effects, we construct and numerically solve a structural dynamic model of a representative cocoa processor that maximizes the present value of current and expected future profits, given prevailing market conditions and cocoa pricing options. We then took the predicted cocoa pricing options to determine their associated poverty impacts among cocoa producers.
1 This paper benefited from financial resources provided through a 2013 Innovative Research Grant from The
African Growth and Development Policy Modeling Consortium (AGRODEP). The authors thank Antoine Bouet and
an anonymous reviewer for their constructive guidance on earlier versions of the paper. 2 Lead and corresponding author. Telephone: +233 203100681; e-mail address: [email protected]

2
Background
Cocoa production in Ghana occurs in the forested areas of the country, namely the Ashanti,
Brong-Ahafo, Central, Eastern, Western, and Volta regions, which receive between 1,000 and
1,500 millimeters of rainfall per year. The marketing year begins in October, when harvest of the
“main crop” begins, followed by the harvest of a smaller “light crop” in July. Light-crop beans are
smaller than the main-crop variety, but are identical in quality and grown on the same trees. The
main crop accounts for 90% of total annual cocoa bean production in Ghana, and the light crop
accounts for the remaining 10%.3
Ghana was the world’s largest cocoa producer in the early 1960s. However, by the early 1980s,
Ghana’s share of world production had dwindled almost to the point of insignificance, in large
part due to the catastrophic bushfires of 1983 that destroyed most of Ghana’s cocoa-producing
forests. Cocoa bean production in Ghana began to recover in the early 1990s, exhibiting an
average annual rate of growth of 6% between 1990 and 1999, and 8% between 2000 and 2012.
Many actors involved in the cocoa sector have attributed this production boom to an increase in
fertilizer use and a government-sponsored mass spraying exercise beginning in 2001. Today,
Ghana produces slightly less than 700,000 metric tons (MT) of cocoa beans per year on average,
making it the world’s second largest cocoa bean producer after neighboring Côte d’Ivoire.
The cocoa bean sector in Ghana is heavily regulated. The Ghana Cocoa Board (COCOBOD) serves
as the exclusive marketing intermediary between primary producers and processors of cocoa
beans in Ghana. As a matter of policy, COCOBOD buys cocoa beans from producers through
3 It is important to note this distinction, as it forms the basis of Ghana’s industrial policy on cocoa.

3
Licensed Buying Companies (LBCs) and sells them to processors, in both cases at prescribed
multiples of the prevailing world cocoa bean price, and liquidates any surplus on the international
cocoa market at the prevailing world price through its wholly owned subsidiary, the Cocoa
Marketing Company (CMC). COCOBOD provides input subsidies and guaranteed prices to
farmers, and as a result, Ghanaian cocoa bean farmers enjoy far greater price stability than in
free market–oriented regimes such as Côte d’Ivoire.
Value addition activities in the cocoa marketing chain are regulated by the Ministry of Trade and
Industry (MoTI), which regulates all of Ghana’s manufacturing activities. It is estimated that less
than 30% of the cocoa beans grown in Ghana are locally processed, allowing Ghana to capture
only 5% of the $28 billion global intermediate cocoa processing industry, even though it accounts
for 20% of the $9 billion global cocoa bean market. The large gap between Ghana’s share of global
cocoa bean production and its share of processed intermediate cocoa products is the results of
issues associated the infancy of the cocoa processing sector that Ghana’s industrial cocoa policy
is seeking to address. While Ghana had been processing cocoa beans for many years, although in
sub-optimal quantities; markets often fail to correct for the gains that accrued over time from
declining unit costs and learning by doing. A number of factors such as poor local market demand
for cocoa-based products, high overall manufacturing cost, and increasing tariff rates for
intermediate cocoa products imported to Europe are behind this situation.
Current government cocoa value chain policies are tilted toward maximizing revenue from cocoa
bean exports, which are generating by COCOBOD’s retention of 9% of the cocoa freight on board
(FOB) price. COCOBOD’s efforts to ensure quality, traceability, and social responsibility have
4
awarded Ghanaian cocoa a 4-6% price premium on the international market. However, the only
policy in place for attracting and encouraging local cocoa processing is a 20% discount given on
the light cocoa bean harvest which bears little impact on processors willingness to increase
quantity processed.
Whether to export raw cocoa beans or to first process them locally is an industrial policy question
that has faced several successive Ghanaian governments. Predictably, in recent years, public
policy has shifted toward increasing earnings through increased local processing. MoTI has
attempted to promote local processing by subsidizing the price paid by local processors, a
strategy in line with Brander and Spencer (1985) for encouraging domestic reallocation of
increasing return industries for global market share rivalry purposes. However, this subsidy has
come at the cost of reduced revenue for farmers and other upstream value chain players,
including COCOBOD, undermining COCOBOD’s mission to make cocoa farming an adequate
source of income for farmers. The inability to strike the right balance between industrialization
and poverty reduction has been and still is at the heart of the failure of efforts to addressing the
market incompleteness.
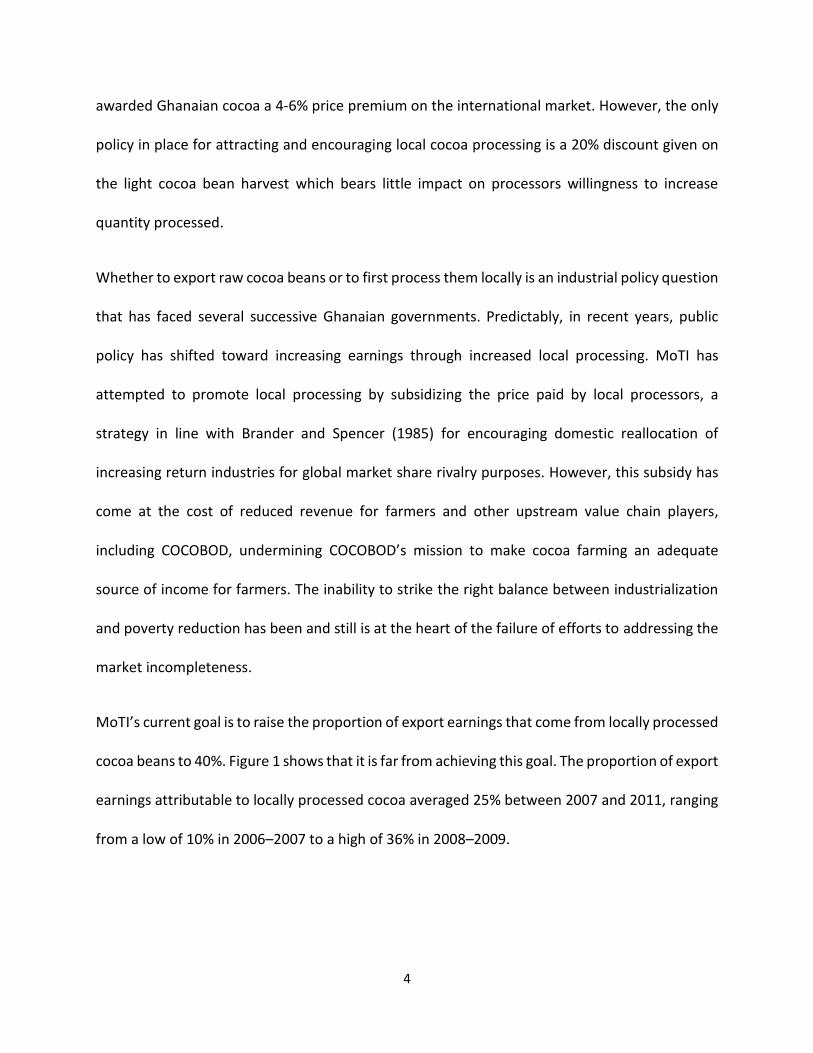
MoTI’s current goal is to raise the proportion of export earnings that come from locally processed
cocoa beans to 40%. Figure 1 shows that it is far from achieving this goal. The proportion of export
earnings attributable to locally processed cocoa averaged 25% between 2007 and 2011, ranging
from a low of 10% in 2006–2007 to a high of 36% in 2008–2009.
Figure 3
1
5
Figure 1: Cocoa beans processed as percent of exports
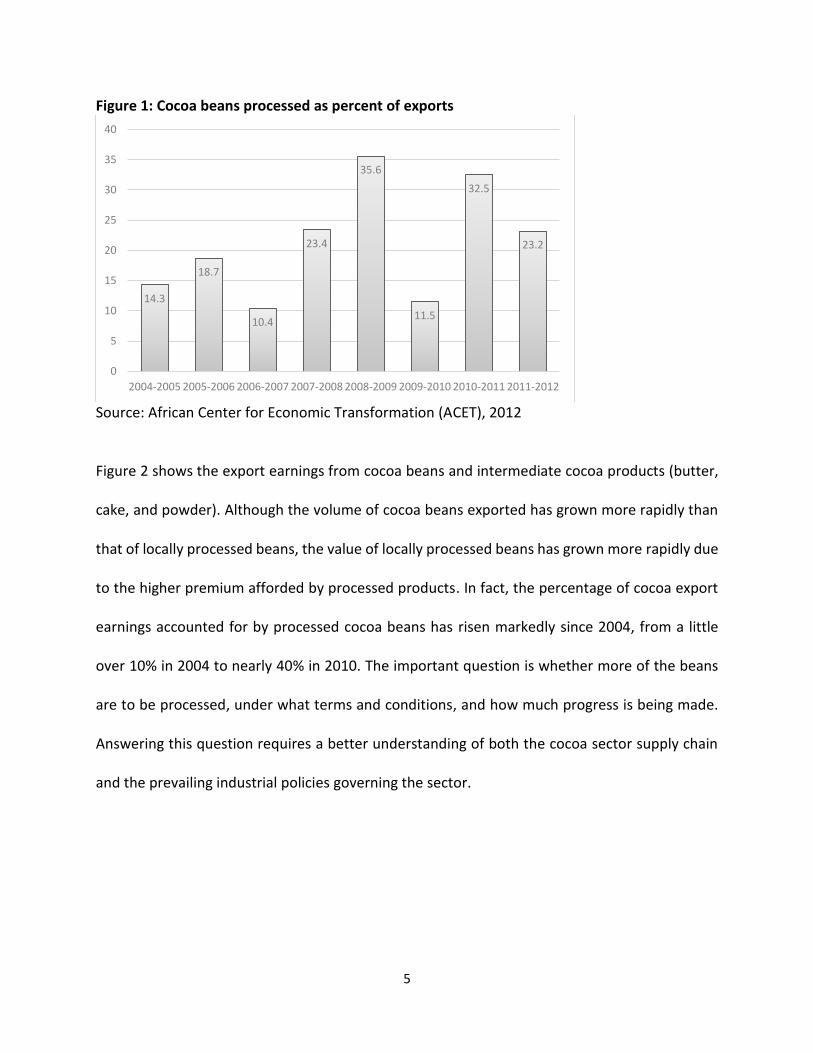
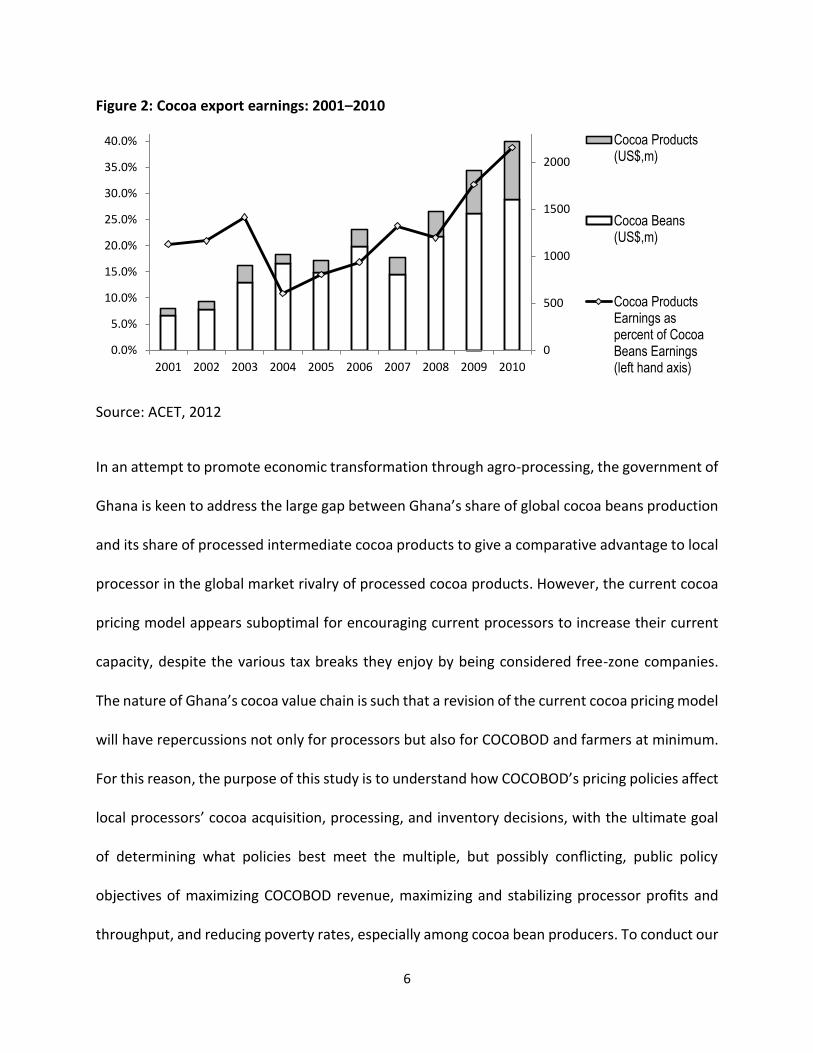
Source: African Center for Economic Transformation (ACET), 2012 Figure 2 shows the export earnings from cocoa beans and intermediate cocoa products (butter,
cake, and powder). Although the volume of cocoa beans exported has grown more rapidly than
that of locally processed beans, the value of locally processed beans has grown more rapidly due
to the higher premium afforded by processed products. In fact, the percentage of cocoa export
earnings accounted for by processed cocoa beans has risen markedly since 2004, from a little
over 10% in 2004 to nearly 40% in 2010. The important question is whether more of the beans
are to be processed, under what terms and conditions, and how much progress is being made.
Answering this question requires a better understanding of both the cocoa sector supply chain
and the prevailing industrial policies governing the sector.
14.3
18.7
10.4
23.4
35.6
11.5
32.5
23.2
0
5
10
15
20
25
30
35
40
2004-2005 2005-2006 2006-2007 2007-2008 2008-2009 2009-2010 2010-2011 2011-2012
6
Figure 2: Cocoa export earnings: 2001–2010
Source: ACET, 2012
In an attempt to promote economic transformation through agro-processing, the government of
Ghana is keen to address the large gap between Ghana’s share of global cocoa beans production
and its share of processed intermediate cocoa products to give a comparative advantage to local
processor in the global market rivalry of processed cocoa products. However, the current cocoa
pricing model appears suboptimal for encouraging current processors to increase their current
capacity, despite the various tax breaks they enjoy by being considered free-zone companies.
The nature of Ghana’s cocoa value chain is such that a revision of the current cocoa pricing model
will have repercussions not only for processors but also for COCOBOD and farmers at minimum.
For this reason, the purpose of this study is to understand how COCOBOD’s pricing policies affect
local processors’ cocoa acquisition, processing, and inventory decisions, with the ultimate goal
of determining what policies best meet the multiple, but possibly conflicting, public policy
objectives of maximizing COCOBOD revenue, maximizing and stabilizing processor profits and
throughput, and reducing poverty rates, especially among cocoa bean producers. To conduct our
0
500
1000
1500
2000
2500
0.0%
5.0%
10.0%
15.0%
20.0%
25.0%
30.0%
35.0%
40.0%
45.0%
2001 2002 2003 2004 2005 2006 2007 2008 2009 2010
Cocoa Exports Earnings: 2001-2010Cocoa Products(US$,m)
Cocoa Beans(US$,m)
Cocoa ProductsEarnings aspercent of CocoaBeans Earnings(left hand axis)
7
analysis, we proceed in two steps. First, we construct a structural dynamic model of a
representative cocoa processor that maximizes the present value of current and expected future
profits, given prevailing market conditions and COCOBOD pricing policies. Second, we take the
predicted appropriate cocoa pricing options to determine their associated poverty impacts
among cocoa producers. This is done by applying Deaton’s 1989 “net buyer, net seller” approach
to the 2005 Ghana Living Standards Survey (GLSS5) for cocoa farmers.
The paper goes on to contextualize the global and regional debate on industrial policy for
economic transformation in Section 2. In Section 3, we present an overview of Ghana’s cocoa
supply chain and justify the modeling framework. In Section 4, we present the model, the
parameterization approach, and the model’s analytical solution. Section 5 presents the numerical
solution of the model. In Section 6, we discuss the poverty implications of industrial policies, and
in Section 7, we summarize our findings and draw conclusions.
Industrial Policy for Economic Transformation
The government of Ghana’s desire to increase the quantity of locally processed cocoa is a
reflection of its strategy to move the country from a primary product economy to an industry-
based one. Industrialization through agro-processing is not only a subject of contemplation in
Ghana, but has recently reemerged in development policy debates. This reemergence is
especially prominent in sub-Saharan Africa (SSA), where both countries and regional institutions
have become interested in promoting economic transformation. Institutions such as the African
Development Bank, the UN’s High-Level Panel on the Post-2015 Development Agenda and on
Goal 9 of the Zero Draft of the Sustainable Development Goals (SDGs), and the African Union

8
have all echoed the need for economic transformation and industrialization in Africa. African
countries such as Ethiopia, Rwanda, Kenya, and Liberia have also articulated and begun
implementing robust transformation plans in recent years, and Ghana is revisiting its national
development strategies after many fitful attempts.
By economic transformation/industrialization, we mean a process that leads to the narrowing of
the gap between SSA countries and industrialized countries in key areas, including technological
capacity, productivity, economic diversity, export competitiveness, per capita income, and
formal-sector employment, all of which are discussed in the African Center for Economic
Transformation’s African Transformation Report (ATR) of 2014.
Most African countries’ economies are agriculture-based. It is estimated that 65% of the labor
force in SSA countries is employed in the agricultural sector, and that the sector contributes
about 32% of the regional GDP. A natural starting point for promoting economic
transformation/industrialization is to link the agricultural sector to the manufacturing sector
through effective agro-industrial policies. Agro-industrial policies matter for both economic
transformation and poverty alleviation because they influence investment in physical and human
capital and technology and promote efficient organization of production. These policies can be
used to promote both aggregate economic growth and more equitable distribution of societal
resources (Robinson 2009).
Economic transformation/industrialization is often the outcome of an effectively implemented
industrial policy, which is broadly defined as any set of policies pursued by a government with
the explicit goal of promoting the expansion, technological upgrading, or international
9
competitiveness of a targeted set of economic activities (Ansu 2013). The importance of
industrial policies for economic transformation became prominent after a series of important
interpretations of the “East Asian Miracle” economies published by Johnson (1982), Amsden
(1989), Wade (1990), and the World Bank (1993). These works put successful industrial policy at
the heart of the postwar economic successes of Japan, South Korea, and Taiwan. This research,
and much else like it, argued that market failures are always worse than government failures and
that industrial policy is a powerful tool for promoting economic growth.
The appropriate industrial policy will depend on the market imperfection at hand. In Latin
America, for example, it took the form of import-substituting industrialization (ISI), closing
domestic markets to international competition. In South Korea and Taiwan, it took the form of
incentives to induce the development of export industries. The basic argument of Rodrik (2007)
for this variation in policy approach is that one size does not fit all. A successful industrial policy
has to be tailored to the specific context or institutions of a country. According to this view,
different countries could adopt identical policies, but with very different results, as they had
different market failures.
SSA has experienced two important industrial policy regimes. After achieving independence in
the 1960s, many African countries developed industrial policies centered on ISI. Under this
strategy, the state aspired to control the economy, which, in the nascent industrial settings of
these countries, included the import-substituting factories that were then being promoted. Thus,
governments either entered into production themselves through state-owned enterprises, or
controlled the entry of entrepreneurs and heavily regulated the operations of private firms.
10
Despite initial successes in expanding the manufacturing sector, the results of industrial policies
based on state-led import substitution strategies proved to be quite disappointing.
By the beginning of the 1980s, severe balance-of-payments problems had made the state ISI
strategy difficult to sustain in almost all of the SSA countries that employed it, and country after
country, including Ghana, turned to the International Monetary Fund (IMF) and the World Bank
for help. This help was often contingent on the countries’ entrance into macroeconomic
stabilization programs with the IMF and programs of structural reform with the World Bank.
These programs, often jointly referred to as “Structural Adjustment Programs” (SAPs), typically
shared the following features: fiscal adjustment (to reduce fiscal deficits); exchange rate
devaluation; trade (particularly import) liberalization; privatization of state-owned enterprises;
and reduction of government involvement in production or support to select economic activities
and actors. As with the ISI strategy, the results of the SAPs were disappointing (Ansu 2013).
Recently, a new model of state–private sector partnership in industrial policy has emerged in the
form of “a market-oriented industrial policy,” interpreted broadly as a set of policies that
promote the efficient production and export of a diverse range of technologically upgraded
goods and services, whether from the agricultural, industrial, or services sector (ATR 2014;
Whitfield and Buur 2014). The core of this new industrial policy is to strike the right balance
between the state and the private sector in their active collaboration. An important role for the
state in such a partnership, in addition to maintaining macroeconomic stability, is facilitating the
private sector’s capacity to become internationally competitive through for example, effective
11
subsidization of increasing return firms involved in global market share rivalry (Brander and
Spencer, 1985).
Overview of Ghana’s Cocoa Supply Chain
Production
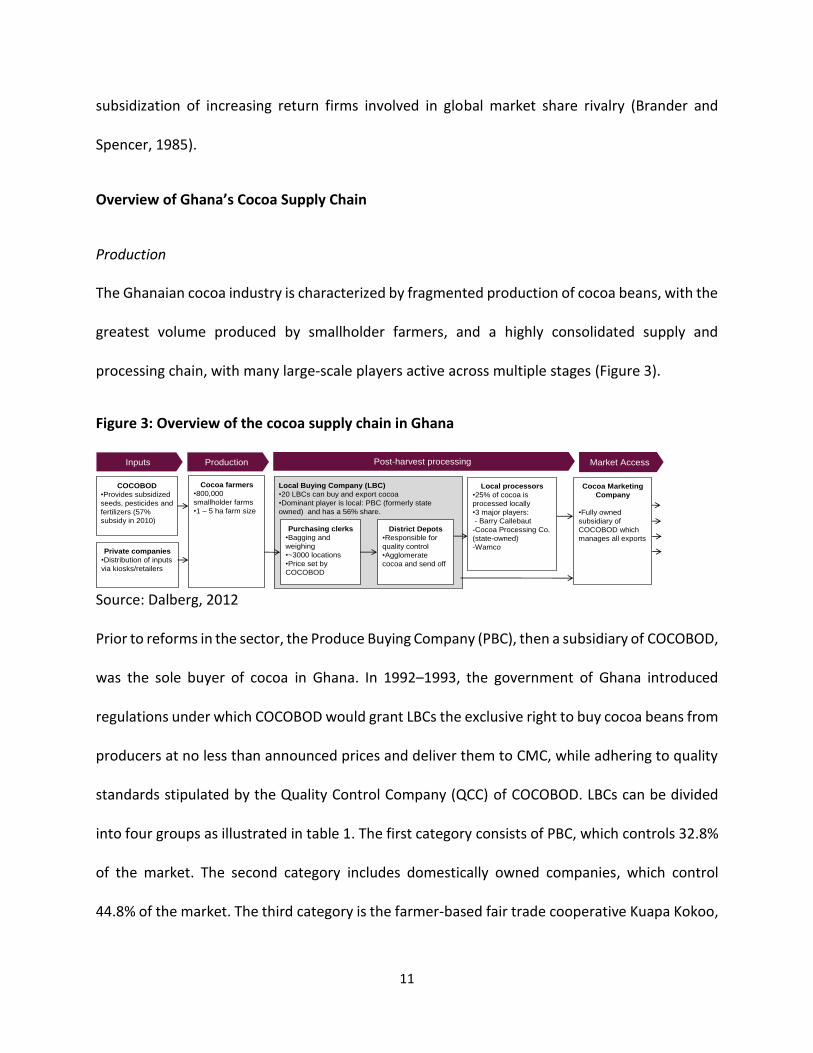
The Ghanaian cocoa industry is characterized by fragmented production of cocoa beans, with the
greatest volume produced by smallholder farmers, and a highly consolidated supply and
processing chain, with many large-scale players active across multiple stages (Figure 3).
Figure 3: Overview of the cocoa supply chain in Ghana
Source: Dalberg, 2012 Prior to reforms in the sector, the Produce Buying Company (PBC), then a subsidiary of COCOBOD,
was the sole buyer of cocoa in Ghana. In 1992–1993, the government of Ghana introduced
regulations under which COCOBOD would grant LBCs the exclusive right to buy cocoa beans from
producers at no less than announced prices and deliver them to CMC, while adhering to quality
standards stipulated by the Quality Control Company (QCC) of COCOBOD. LBCs can be divided
into four groups as illustrated in table 1. The first category consists of PBC, which controls 32.8%
of the market. The second category includes domestically owned companies, which control
44.8% of the market. The third category is the farmer-based fair trade cooperative Kuapa Kokoo,
Local Buying Company (LBC)
•20 LBCs can buy and export cocoa
•Dominant player is local: PBC (formerly state
owned) and has a 56% share.
Cocoa farmers
•800,000
smallholder farms
•1 – 5 ha farm size
Purchasing clerks
•Bagging and
weighing
•~3000 locations
•Price set by
COCOBOD
District Depots
•Responsible for
quality control
•Agglomerate
cocoa and send off
Cocoa Marketing
Company
•Fully owned
subsidiary of
COCOBOD which
manages all exports
Local processors
•25% of cocoa is
processed locally
•3 major players:
- Barry Callebaut
-Cocoa Processing Co.
(state-owned)
-Wamco
Production Post-harvest processing Market AccessInputs
COCOBOD
•Provides subsidized
seeds, pesticides and
fertilizers (57%
subsidy in 2010)
Private companies
•Distribution of inputs
via kiosks/retailers

12
which controls 5.9% of the market, and the fourth category consists of two international
companies, Olam and Armajaro, which control 16.4% of the market.
Table 1: Market share of LBCs
Firm Share
PBC 32.83 Akuapo 11.97 Olam 10.71 Adwumapa 8.62 Fed 7.04 Kuapa Kokoo 5.91 Transroyal 5.72 Armajaro 5.7 Coco Gh 3.17 Diaby 2.7 Others 5.63
Source: Porto, Depetris-Chauvin, and Olarreaga, 2011
The relationship between the LBCs and their suppliers varies. Most LBCs have informal contracts
with farmers, in which farmers are provided with inputs in return for a guaranteed supply of
cocoa beans at harvest. Some farmers have organized themselves as a union and LBC to buy
inputs in bulk and maximize revenue. However, since COCOBOD fixes the minimum price farmers
must receive at 72% of the international market price, with 8% of the price margin kept by the
LBCs, there is not much opportunity for enhancing competition at this level.
Processing
Cocoa beans are first processed into intermediate products, such as liquor, butter, cake, and
powder. Between the 2009–2010 season and the 2012–2013 season, Ghana processed 32% of
its cocoa bean production. Liquor constitutes the largest portion of the processed cocoa products

13
and is either exported “as is” or compressed to produce butter, cake, and powder before being
exported, mainly to Europe as illustrated in table 2. It is important to note that import tariffs play
a significant role in keeping African countries focused on exporting raw beans. For example, the
EU levies no duties on the import of raw cocoa beans, but levies 7.7% and 15% ad valorem duties
on cocoa powder and cocoa cake, respectively.
Table 2: Production of intermediate cocoa products
Production year
Cocoa beans bought by local processors
(in MT) Processing output (in MT)
Liquor Butter Cake Powder
2009/10 212,245 122,715 25,326 7,237 16,975
2010/11 229,695 118,437 38,564 12,024 29,593
2011/12 211,709 114,274 30,381 10,375 21,817
2012/13 230,896 117,711 37,174 12,444 26,250
Source: COCOBOD
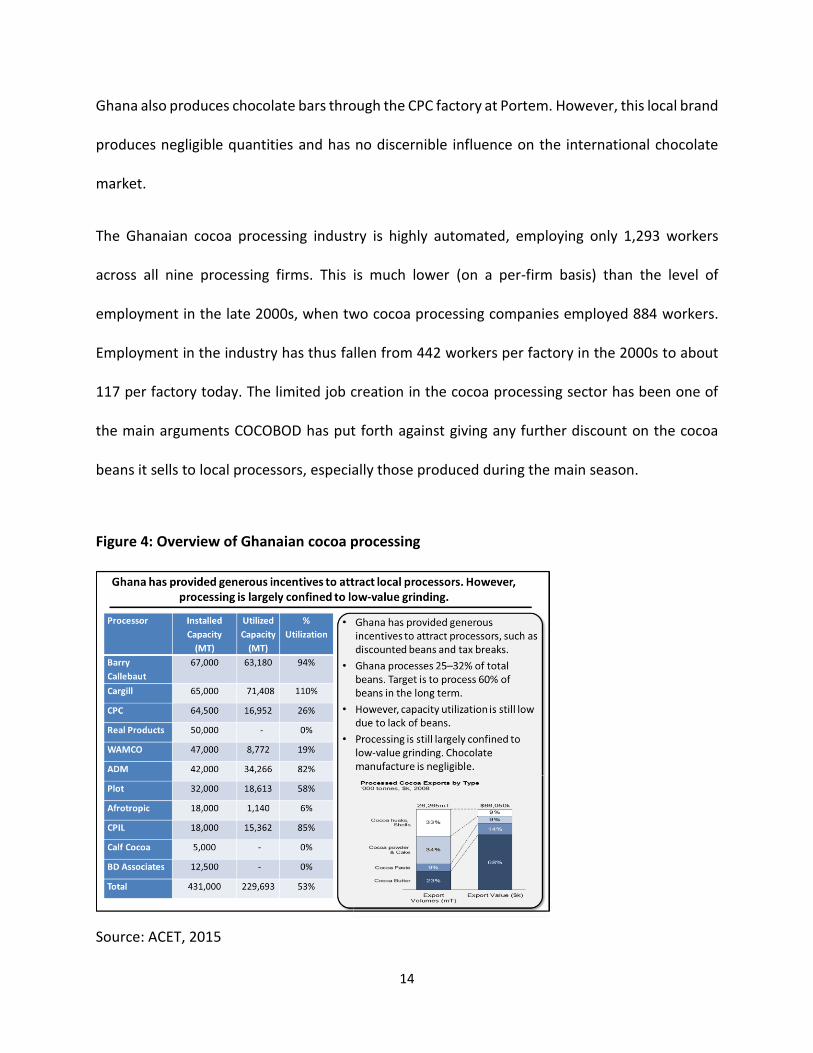
Total installed cocoa processing capacity is 431,000 MT per year, up from 111,500 MT per year
in 2000–2001. Cocoa grinding is undertaken by a combination of state-owned, international, and
local private enterprises. There are nine cocoa processors in Ghana, of which three, Archer
Daniels Midland (ADM),4 Barry Callebaut, and Cargill, control 47% of the country’s cocoa
processing capacity. The government-owned CPC controls 17% of installed capacity, and the
remaining 36% is controlled by local private players, as illustrated in Figure 4.
4 ADM’s global cocoa business was acquired by Olam in late 2014.
14
Ghana also produces chocolate bars through the CPC factory at Portem. However, this local brand
produces negligible quantities and has no discernible influence on the international chocolate
market.
The Ghanaian cocoa processing industry is highly automated, employing only 1,293 workers
across all nine processing firms. This is much lower (on a per-firm basis) than the level of
employment in the late 2000s, when two cocoa processing companies employed 884 workers.
Employment in the industry has thus fallen from 442 workers per factory in the 2000s to about
117 per factory today. The limited job creation in the cocoa processing sector has been one of
the main arguments COCOBOD has put forth against giving any further discount on the cocoa
beans it sells to local processors, especially those produced during the main season.
Figure 4: Overview of Ghanaian cocoa processing
Source: ACET, 2015
15
The Ghanaian government initially targeted an increase in origin grinding to 40% by 2012, with a
long-term target of 60%. However, as only 25% of beans are now locally grinded, Ghana has fallen
short of its target. Some processors argue that COCOBOD’s current cocoa bean pricing scheme is
an impediment to further progress, despite COCOBOD’s benefits to cocoa bean production.5
Local processors buy main crop beans at the international market price, which they believe
discourages local processing due to the high cost of utilities in Ghana.6
Cocoa grinding capacity has increased substantially over the past 10 years due to the entry of
multinational players, especially Cargill and ADM. These major players and other cocoa
processing companies, benefiting from export free zone (EFZ) advantages, were attracted to the
Ghanaian market partly because of the discount COCOBOD gives on light-crop beans and their
expectations of receiving greater discounts on main-crop beans. EFZ advantages include a 100%
exemption from the payment of direct and indirect duties and levies on all imports for production
and exports from free zones; a 100% exemption from the payment of income tax on profits for
their first 10 years (while after 10 years, these companies pay no more than 8% income tax,
compared to 25% for non-EFZ companies); exemption from value added tax (VAT) on purchases,
including on utilities); and no restrictions on fund repatriation.
5 The operations manager for the business unit of Cargill Cocoa and Chocolate, Wouter Evers, told the Daily
Graphic (a prominent newspaper in Ghana) that “we have the capacity to do more than we do now, but Ghana’s
cocoa is expensive, and to increase the quantum we process, we will require some incentives.”
6 We noted more than half a dozen newspaper articles in which processors have advocated for more support in the
form of cheaper beans from COCOBOD.

16
Pricing
International cocoa prices are highly volatile. Since the 1980–1981 growing season, the
International Coffee and Cocoa Organization (ICCO) international price index has varied from a
low of 685 SDR/ton in 2000 to a peak of 2,320 SDR/ton in 1984.7
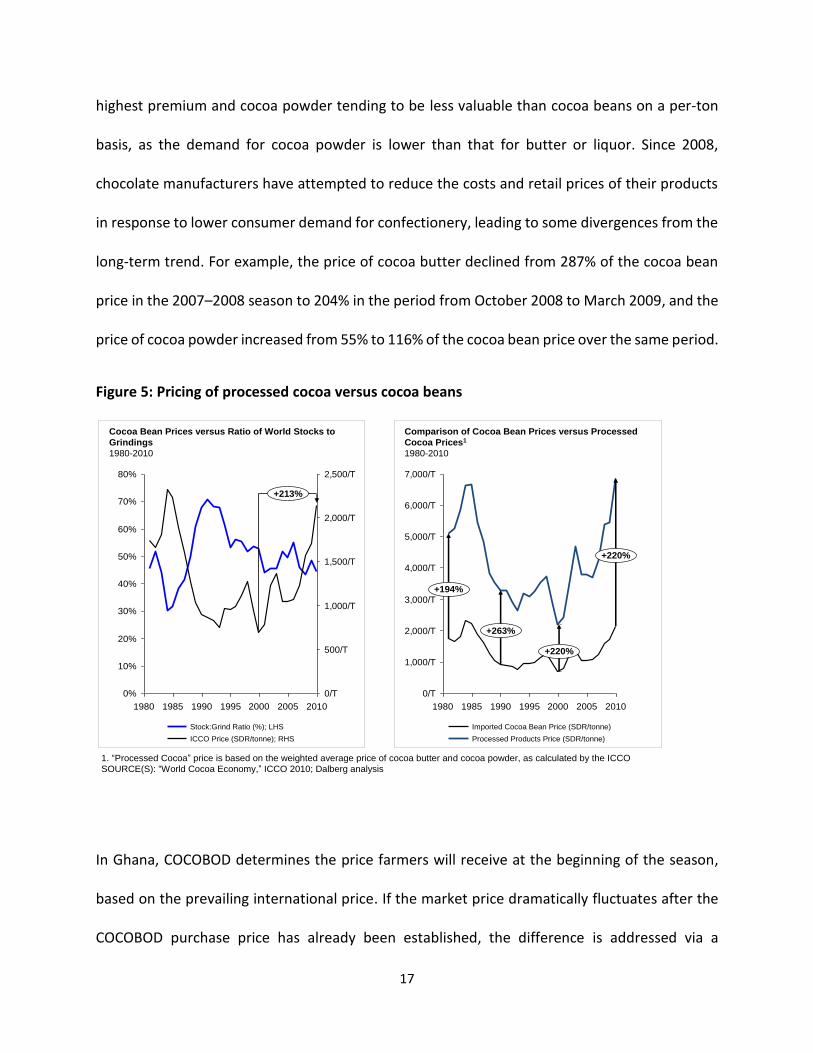
Over the medium term, the prevailing international price for cocoa beans is strongly related to
the stocks of cocoa beans relative to the volume of grinding. This “stock-to-grind ratio” is typically
used as a measure of the tightness of the cocoa market and is closely associated with movements
in the traded cocoa bean price; a 10% increase in the stock-to-grind ratio is typically associated
with a 9% decrease in the ICCO index cocoa bean price. Recently prices have risen far above the
levels justified by this ratio, due to a combination of short-term concerns about the security of
supply from Côte d’Ivoire and longer-term concerns over the ability of the cocoa production
industry to increase their volumes fast enough to meet expected long-term rises in demand of
2–3% per annum. These concerns are driven by a rising incidence of disease in all major producing
regions, as well as competition for land between producers of cocoa and producers of other
agricultural commodities, such as palm oil and rubber.
The prices of intermediate products, such as cocoa liquor, butter, cake, and powder, are
commensurate to the underlying spot price of cocoa beans. On a weighted average price basis,
intermediate processed outputs earn a relatively stable premium of approximately 200–220%
over the price of raw cocoa beans, as illustrated in Figure 5. Within this, however, there are
substantial differences in the prices of individual intermediates, with cocoa butter earning the
7 Prices are measured in both dollars and Special Drawing Rights (SDR). The latter is used here to eliminate the
impact of variation in the value of the US dollar on the nominal price of cocoa over the period.
17
highest premium and cocoa powder tending to be less valuable than cocoa beans on a per-ton
basis, as the demand for cocoa powder is lower than that for butter or liquor. Since 2008,
chocolate manufacturers have attempted to reduce the costs and retail prices of their products
in response to lower consumer demand for confectionery, leading to some divergences from the
long-term trend. For example, the price of cocoa butter declined from 287% of the cocoa bean
price in the 2007–2008 season to 204% in the period from October 2008 to March 2009, and the
price of cocoa powder increased from 55% to 116% of the cocoa bean price over the same period.
Figure 5: Pricing of processed cocoa versus cocoa beans
In Ghana, COCOBOD determines the price farmers will receive at the beginning of the season,
based on the prevailing international price. If the market price dramatically fluctuates after the
COCOBOD purchase price has already been established, the difference is addressed via a
0%
10%
20%
30%
40%
50%
60%
70%
80%
1980 1985 1990 1995 2000 2005 2010
0/T
500/T
1,000/T
1,500/T
2,000/T
2,500/T
+213%
ICCO Price (SDR/tonne); RHS
Stock:Grind Ratio (%); LHS
1. “Processed Cocoa” price is based on the weighted average price of cocoa butter and cocoa powder, as calculated by the ICCO
SOURCE(S): “World Cocoa Economy,” ICCO 2010; Dalberg analysis
Cocoa Bean Prices versus Ratio of World Stocks to
Grindings
1980-2010
0/T
1,000/T
2,000/T
3,000/T
4,000/T
5,000/T
6,000/T
7,000/T
1980 1985 1990 1995 2000 2005 2010
+220%
+220%
+194%
+263%
Imported Cocoa Bean Price (SDR/tonne)
Processed Products Price (SDR/tonne)
Comparison of Cocoa Bean Prices versus Processed
Cocoa Prices1
1980-2010

18
stabilization fund. The FOB price allocation among Ghana cocoa industry players is such that
producers receive 72.2% of the FOB share, LBCs keep 8.4%, COCOBOD keeps 9.3%, and the rest
goes to logistical and farmers’ welfare activities, as illustrated in Table 3.
Table 3: Allocation of price of cocoa beans
Cost items Share of net FOB (%) Ghana cedis (GHS)8 per MT
GHS per bag (64 kg)
Producer price 72.16 2400.05 150.00
Stabilization fund 1.50 49.89 3.12
Buyers’ margin 8.42 280.05 17.50
Haulers’ cost 3.40 113.08 7.07
Storage and shipping (CMC) 1.16 38.58 2.41
Quality control 1.66 55.21 3.45
Crop finance 1.06 35.26 2.20
Scale inspection and phytosanitary
0.01 0.33 0.02
Government/COCOBOD 9.34 310.65 19.42
Farmers’ housing scheme 0.04 1.33 0.08
Replanting/rehabilitation 0.64 21.29 1.33
Farmers’ social security 0.61 20.29 1.27
Total 100 3326.01 207.87
Source: Kolavalli et al, 2012
8 As of June 10th 2015 $1=4.1 GHC
19
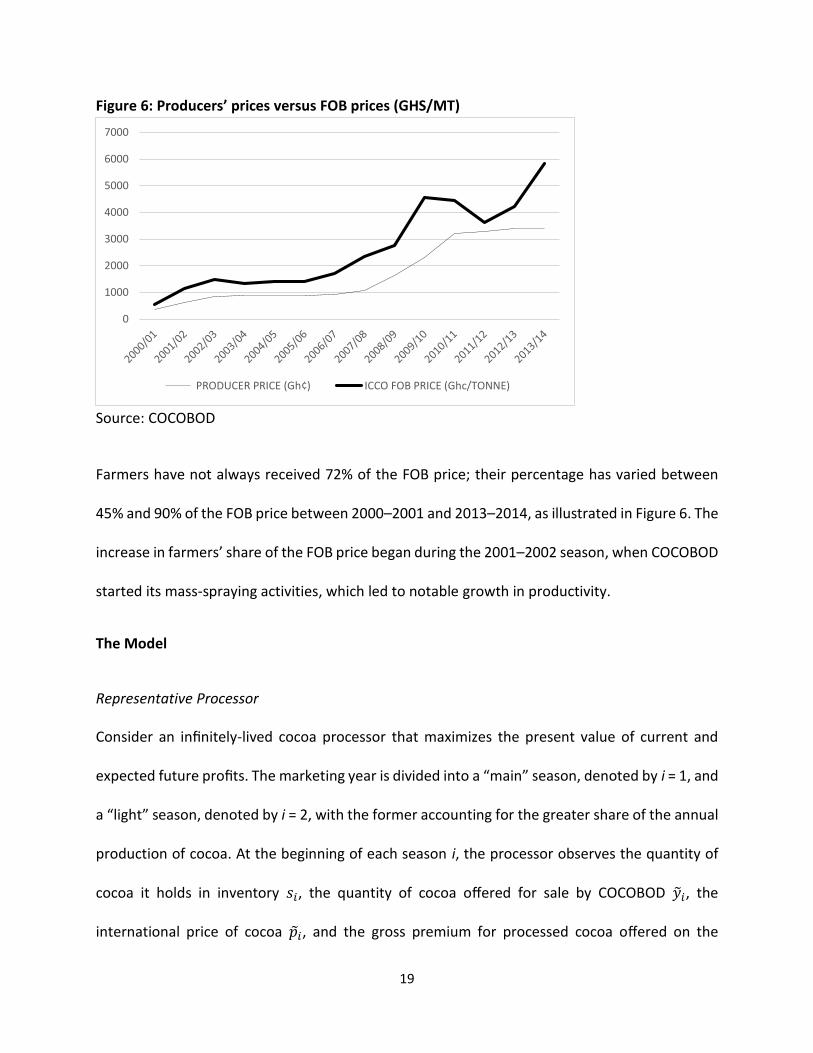
Figure 6: Producers’ prices versus FOB prices (GHS/MT)
Source: COCOBOD
Farmers have not always received 72% of the FOB price; their percentage has varied between
45% and 90% of the FOB price between 2000–2001 and 2013–2014, as illustrated in Figure 6. The
increase in farmers’ share of the FOB price began during the 2001–2002 season, when COCOBOD
started its mass-spraying activities, which led to notable growth in productivity.
The Model
Representative Processor
Consider an infinitely-lived cocoa processor that maximizes the present value of current and
expected future profits. The marketing year is divided into a “main” season, denoted by i = 1, and
a “light” season, denoted by i = 2, with the former accounting for the greater share of the annual
production of cocoa. At the beginning of each season i, the processor observes the quantity of
cocoa it holds in inventory 𝑠𝑖, the quantity of cocoa offered for sale by COCOBOD �̃�𝑖, the
international price of cocoa 𝑝𝑖, and the gross premium for processed cocoa offered on the
0
1000
2000
3000
4000
5000
6000
7000
PRODUCER PRICE (Gh¢) ICCO FOB PRICE (Ghc/TONNE)
20
international market 𝜖�̃�. The processor must then decide how much cocoa 𝑎𝑖 to acquire from
COCOBOD, how much cocoa 𝑞𝑖 to process, and how much cocoa to hold in inventory 𝑥𝑖 at the
end of the season.
The processor’s decisions are subject to capacity constraints
0 ≤ 𝑎𝑖 ≤ 𝑦�̃� (1)
0 ≤ 𝑞𝑖 ≤ �̅�𝑖 (2)
0 ≤ 𝑥𝑖 ≤ �̅�𝑖 (3)
And a material balance constraint
𝑠𝑖 + 𝑎𝑖 = 𝑞𝑖 + 𝑥𝑖 (4)
Here, (1) states that the quantity of cocoa acquired by the processor cannot exceed the quantity
offered for sale by COCOBOD; (2) states that the quantity of cocoa processed cannot exceed a
fixed processing capacity �̅�𝑖; (3) states that the processor’s ending inventory of cocoa cannot
exceed a fixed storage capacity �̅�𝑖; and (4) states that the initial inventory of cocoa plus new
acquisitions must be either processed or held in inventory at the end of the season. Since the
inventory held at the end of one season equals the inventory held at the beginning of the
following season, 𝑠𝑖+1 = 𝑥𝑖, provided we interpret the subscript i + 1 to mean 1 when i = 2.9
The processor’s profit in season i is
9 We assume, without loss of generality, that �̅�𝑖+1 ≥ �̅�𝑖.
21
𝜋𝑖 = 𝜖�̃�𝑝�̃�𝑞𝑖 − 𝛼𝑖𝑝�̃�𝑎𝑖 − 𝑐𝑖(𝑞𝑖) (5)
where 𝛼𝑖 is the discount on cocoa offered by COCOBOD to the processor, 𝑐𝑖(𝑞𝑖) is the processor’s
total cost of processing, and we assume the processor’s fixed unit cost of inventory to be
negligible, where 0 <𝛼𝑖< 1. We assume the total cost of processing is a convex quadratic function
of the quantity processed. This assumption is not made arbitrarily, but in light of both the capital-
intensive nature of cocoa processing in Ghana and the short-run nature of our analysis, which
keeps capacity fixed and assumes that marginal cost rises over the normal range of utilization,
becoming higher as we approach capacity.
𝑐𝑖(𝑞𝑖) = 𝑐�̅� + 𝜂𝑖𝑞𝑖 +1
2𝛾𝑖𝑞𝑖
2 (6)
where 𝑐�̅� > 0, 𝜂𝑖 > 0, and 𝛾𝑖 > 0.
The processor maximizes the present value of current and expected future profits. The
processor’s dynamic decision problem is thus characterized by a Bellman equation whose value
function 𝑉𝑖 specifies the maximum expected present value of profit attainable by the processor
in season i, given its current inventory 𝑠𝑖, available new production 𝑦�̃�, the prevailing international
cocoa price 𝑝�̃�, and the prevailing gross processed cocoa premium 𝜖�̃�:
𝑉𝑖(𝑠𝑖, 𝑦�̃�, 𝑝�̃�, 𝜖�̃�) = max𝑎𝑖,𝑞𝑖,𝑥𝑖
{𝜋𝑖 + 𝛿𝑖𝐸𝑖𝑉𝑖+1( 𝑥𝑖 , 𝑦𝑖+1̃ , 𝑝𝑖+1̃ , 𝜖𝑖+1̃)} (7)
subject to constraints (1) through (4). Here, 𝛿𝑖 ∈ (0,1) is the market discount factor between
season 𝑖 and the subsequent season.
22
Quantities of cocoa beans acquired by COCOBOD but not purchased by the processors are sold
on the international market at the prevailing international price. Therefore, COCOBOD does not
hold inventories, and its net income in a given period is:
𝜋𝑖𝐶 = 𝑝�̃�(𝑦�̃� − 𝑎𝑖) + 𝛼𝑖𝑝�̃�𝑎𝑖 − 𝛽𝑖𝑝�̃�𝑦�̃� (8)
where 𝛽𝑖 is COCOBOD’s discount to cocoa bean producers
Cocoa production, the international cocoa price, and the international cocoa processing margins
are assumed to be exogenous and random.
Analytical Solutions
Assume there is no carryout between marketing years and that any surplus may be disposed of
freely at the end of the year, so that 𝑠𝑡𝑖 = 0. Under these assumptions, 𝑞2 = 𝑞2(𝑠2, 𝑦2̃, 𝑝2̃, 𝜖2̃), the
optimal quantity processed in season 2, and 𝑎2 = 𝑎2(𝑠2, 𝑦2̃, 𝑝2̃, 𝜖2̃), the optimal quantity acquired
in season 2, are both functions of the quantity held by the processor at the beginning of the
season 𝑠2, available new production 𝑦2̃, the international cocoa price 𝑝2̃, and the gross processed
cocoa premium 𝜖2̃. More explicitly,
𝑞2(𝑠2, 𝑦2̃, 𝑝2̃, 𝜖2̃) = min {�̅�2, 𝑠2 + 𝑦2̃, max{0, 𝑞2̃} , max {𝑠2, 𝑦2̃ −𝛼2𝑝2̃
𝛾2}} (9)
and
𝑎2(𝑠2, 𝑦2̃, 𝑝2̃, 𝜖2̃) = max {0, 𝑞2(𝑠2, 𝑦2̃, 𝑝2̃, 𝜖2̃) − 𝑠2} (10)
where 𝑞2̃ ≡𝜖2̃𝑝2̃−𝜂2
𝛾2. It also follows that the profits realized by the processor are
23
𝜋2 = 𝜖2̃𝑝2̃𝑞2 − 𝛼2𝑝2̃𝑎2 − 𝑐2(𝑞2) (11)
And the profits realized by COCOBOD are
𝜋𝑖𝐶 = 𝑝2̃(𝑦2̃ − 𝑎2) + 𝛼2𝑝2̃𝑎2 − 𝛽2𝑝2̃𝑦2̃ (12)
It follows that the profit expected in season 2, which is conditional on information available in
season 1, is solely a function of the carryout in season 1, allowing us to write:
𝑓(𝑥1) = 𝐸𝜖2̃𝑝2̃𝑦2̃𝜖2̃𝑝2̃𝑞2 − 𝛼2𝑝2̃𝑎2 − 𝑐2(𝑞2) (13)
where 𝑞2 = 𝑞2(𝑥1, 𝑦2̃, 𝑝2̃, 𝜖2̃) and 𝑎2 = 𝑎2(𝑥1, 𝑦2̃, 𝑝2̃, 𝜖2̃) are as above. In season 1, the processor
thus solves
min𝑞1,𝑥1
{𝜖1̃𝑝1̃𝑞1 − 𝛼1𝑝1̃(𝑞1 + 𝑥1) − 𝑐1(𝑞1) + 𝛿𝑓(𝑥1) (14)
subject to constraints
𝑞1 ≤ 𝑥1 ≤ 𝑦1̃ (15)
0 ≤ 𝑞1 ≤ �̅�1 (16)
0 ≤ 𝑥1 ≤ �̅�1 (17)
Equation (15) restricts firms’ cocoa bean inventory to greater than or equal to the quantity of
beans processed, and less than or equal to COCOBOD’s inventory. This assumes that firms cannot
import cocoa beans to process in Ghana. If we assume that 𝑦1̃ ≥ �̅�1 + �̅�1 with certainty, then the
24
first constraint may be ignored, and the optimal amount processed 𝑞1 and ending inventory 𝑥1
are characterized by the independent complementary conditions
0 ≤ 𝑞1 ≤ �̅�1 ⏊ (𝜖1̃ − 𝛼1)𝑝1̃ − 𝜂1 − 𝛾1𝑞1 (18)
0 ≤ 𝑥1 ≤ �̅�1 ⏊ 𝛿𝑓 ′̂(𝑥1) − 𝛼1𝑝1̃ (19)
To numerically solve the model, we formulate a finite-dimensional approximation for the
expectations function 𝑓 by explicitly computing its value at prescribed nodes and using cubic
spline interpolation to compute its values at other points of its domain as needed. We also use
Gaussian quadrature methods to replace the continuous random variables with discrete
approximation (Miranda and Fackler 2002).
Parameterization
The model is a production inventory model with two distinct production periods, the main season
and the light season. The processors decide what quantity of cocoa beans to buy and process in
each season and how to adjust inventory when prices (or discounts) change between seasons.
We collected a series of data for both main and light seasons from various sources to calibrate
the model. The parameters that must be specified to make the model numerically soluble
include:
1. Raw cocoa produced
2. International price of raw cocoa
3. International price of processed cocoa
4. COCOBOD’s gross sales discount offered to processors
25
5. COCOBOD’s gross purchase discount offered to producers
6. Quantity of raw cocoa purchased from COCOBOD by processors
7. Quantity of raw cocoa processed by processors
8. Quantity of raw cocoa acquired by processors in the main season, but processed in the
light season
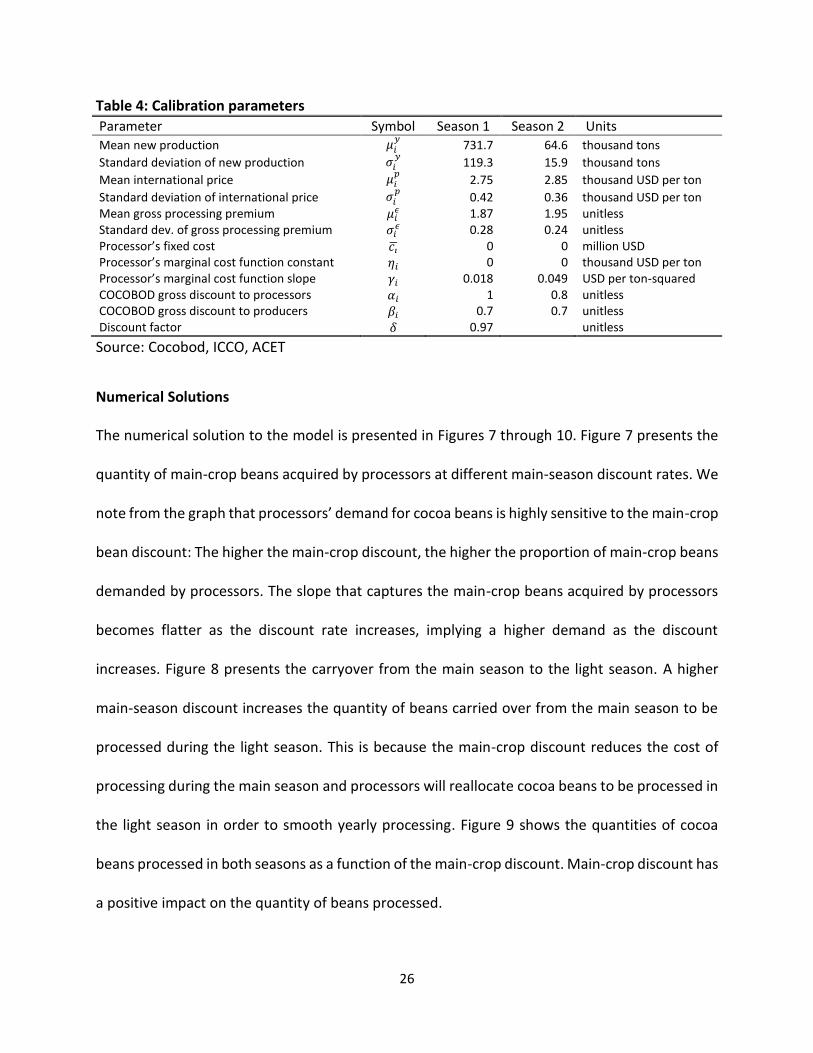
The values of these parameters are specified in Table 4 below. They were deduced using data
collected from COCOBOD, ICCO, and various papers and reports.
We ignore fixed cost in our analysis, as they do not affect the optimal quantities acquired,
processed, or stored. Cocoa processing may well be characterized by an increasing-return-to-
scale technology, with plants of greater capacity able to achieve lower average cost of production
at their technical optimal throughput. However, in the short-run, the scale of the plant is fixed
and designed to operate most efficiently at a technically prescribed optimal throughput. In the
short run, the plant can operate at lower or higher throughputs, but at diminished efficiency and
thus higher average cost of production, justifying a convex short-run cost function. An
assessment of how policies might affect long-run capital investment by processors is beyond the
scope of this study.
26
Table 4: Calibration parameters
Parameter Symbol Season 1 Season 2 Units
Mean new production 𝜇𝑖𝑦
731.7 64.6 thousand tons
Standard deviation of new production 𝜎𝑖𝑦
119.3 15.9 thousand tons
Mean international price 𝜇𝑖𝑝
2.75 2.85 thousand USD per ton
Standard deviation of international price 𝜎𝑖𝑝
0.42 0.36 thousand USD per ton Mean gross processing premium 𝜇𝑖
𝜖 1.87 1.95 unitless Standard dev. of gross processing premium 𝜎𝑖
𝜖 0.28 0.24 unitless Processor’s fixed cost 𝑐�̅� 0 0 million USD Processor’s marginal cost function constant 𝜂𝑖 0 0 thousand USD per ton Processor’s marginal cost function slope 𝛾𝑖 0.018 0.049 USD per ton-squared COCOBOD gross discount to processors 𝛼𝑖 1 0.8 unitless COCOBOD gross discount to producers 𝛽𝑖 0.7 0.7 unitless Discount factor 𝛿 0.97 unitless
Source: Cocobod, ICCO, ACET
Numerical Solutions
The numerical solution to the model is presented in Figures 7 through 10. Figure 7 presents the
quantity of main-crop beans acquired by processors at different main-season discount rates. We
note from the graph that processors’ demand for cocoa beans is highly sensitive to the main-crop
bean discount: The higher the main-crop discount, the higher the proportion of main-crop beans
demanded by processors. The slope that captures the main-crop beans acquired by processors
becomes flatter as the discount rate increases, implying a higher demand as the discount
increases. Figure 8 presents the carryover from the main season to the light season. A higher
main-season discount increases the quantity of beans carried over from the main season to be
processed during the light season. This is because the main-crop discount reduces the cost of
processing during the main season and processors will reallocate cocoa beans to be processed in
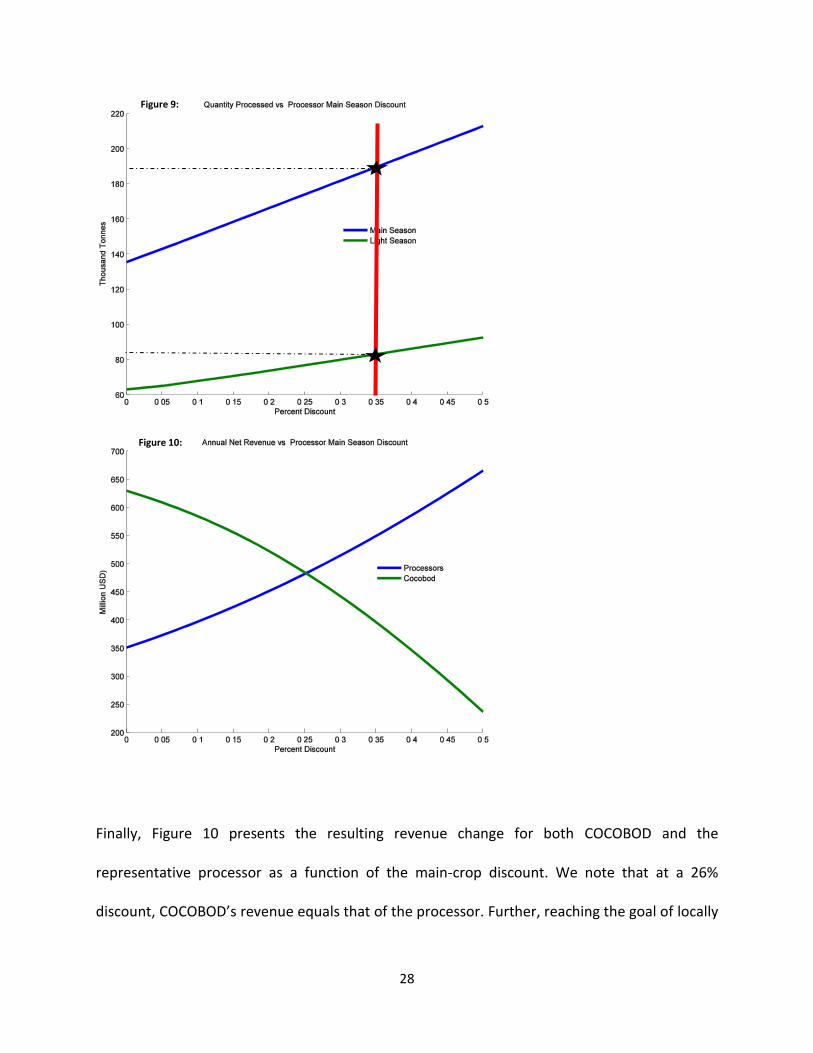
the light season in order to smooth yearly processing. Figure 9 shows the quantities of cocoa
beans processed in both seasons as a function of the main-crop discount. Main-crop discount has
a positive impact on the quantity of beans processed.

27
Figure 7:
Figure 8:
28
Finally, Figure 10 presents the resulting revenue change for both COCOBOD and the
representative processor as a function of the main-crop discount. We note that at a 26%
discount, COCOBOD’s revenue equals that of the processor. Further, reaching the goal of locally
Figure 9:
Figure 10:
:
29
processing 40% of the total quantity of cocoa beans processed, as set by MoTI, will require a
main-crop discount of almost 35%. This will in turn reduce COCOBOD’s revenue by 36% and
increase processors’ revenue by 57%.
Implications for Cocoa Farmers’ Welfare
The first-order effect of the estimated industrial policy is on both the price farmers will receive
and the wages generated from the newly created jobs in the cocoa processing sector. Söderbom
and Teal (2004) identified the creation of more and higher-wage jobs as the sole pathway through
which industrial policy will affect poverty. Job creation is directly linked to the firms’ demand for
labor, which in turn is determined by the technology with which firms operate. However, capital-
intensive firms such as cocoa processors are not expected to generate many new jobs. The only
way that Ghanaian cocoa policy will affect poverty is through the farm-gate price, which is
determined by COCOBOD. COCOBOD may maintain the share of the international market price
that is guaranteed to farmers in a given industrial policy regime, but the reduced profit to
COCOBOD identified earlier will exert indirect negative impacts on producers. In fact, farmers
may experience a reduction in annual bonuses, social services such as mass spraying, social
security contributions, housing, and other technical supports. If COCOBOD gives discounts to
processors, it is fair to assume that farmers will receive lower prices if the auxiliary services
provided by COCOBOD are maintained. Depending on the share of income cocoa beans sales
represent for individual farmers, the anticipated price changes will affect the poverty rate.
To understand how COCOBOD’s pricing policies affect poverty, consider first the income
distribution in Ghana. The household data in the analysis comes from the 2005 “Ghana Living Standard

30
Survey 5”. Figure 11 shows the estimated density function of the logarithm of household per capita
expenditure at the national level and for urban and rural regions separately. As expected, the density for
urban areas lies to the right of the density for rural areas, thus indicating that urban households enjoy, on
average, a higher level of expenditure per capita than the rural households.
Figure 11: The Distribution of Income
Density of (log) per capita household expenditure
Source: Ghana Living Standard Survey 5 (2005)
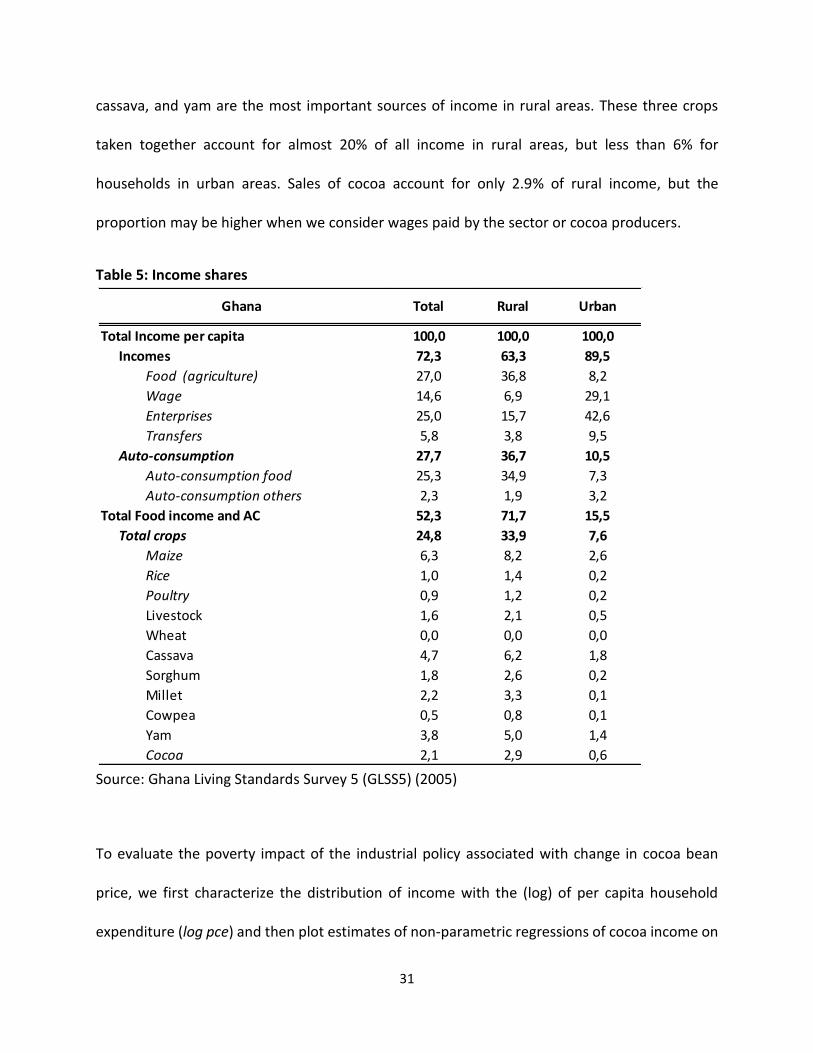
Second, let’s consider the patterns in sources of income across households. In Table 5, we show
different sources of income for Ghanaian households. As expected, rural households have lower
shares of cash income (66.9%) because a significant part of their income is agricultural and auto-
consumed. On the other hand, urban cash income represents 89.5% of total income, of which
10% is associated with agricultural income. Within the category of agricultural income, maize,
0.2
.4.6
Den
sity
11 12 13 14 15log per capita consumption
National Rural
Urban
Ghana
31
cassava, and yam are the most important sources of income in rural areas. These three crops
taken together account for almost 20% of all income in rural areas, but less than 6% for
households in urban areas. Sales of cocoa account for only 2.9% of rural income, but the
proportion may be higher when we consider wages paid by the sector or cocoa producers.
Table 5: Income shares
Source: Ghana Living Standards Survey 5 (GLSS5) (2005)
To evaluate the poverty impact of the industrial policy associated with change in cocoa bean
price, we first characterize the distribution of income with the (log) of per capita household
expenditure (log pce) and then plot estimates of non-parametric regressions of cocoa income on
Ghana Total Rural Urban
Total Income per capita 100,0 100,0 100,0
Incomes 72,3 63,3 89,5
Food (agriculture) 27,0 36,8 8,2
Wage 14,6 6,9 29,1
Enterprises 25,0 15,7 42,6
Transfers 5,8 3,8 9,5
Auto-consumption 27,7 36,7 10,5
Auto-consumption food 25,3 34,9 7,3
Auto-consumption others 2,3 1,9 3,2
Total Food income and AC 52,3 71,7 15,5
Total crops 24,8 33,9 7,6
Maize 6,3 8,2 2,6
Rice 1,0 1,4 0,2
Poultry 0,9 1,2 0,2
Livestock 1,6 2,1 0,5
Wheat 0,0 0,0 0,0
Cassava 4,7 6,2 1,8
Sorghum 1,8 2,6 0,2
Millet 2,2 3,3 0,1
Cowpea 0,5 0,8 0,1
Yam 3,8 5,0 1,4
Cocoa 2,1 2,9 0,6

32
the log pce. Figure 12 displays cocoa income share across the income distribution. Income share
from cocoa increases almost monotonically with the level of income in rural households. While
the poorest rural households receive less than 1% of their income on average from cocoa
production, this share increases to almost 6% on average for those households on the upper end
of the distribution.
Figure 12: Cocoa income share across the income distribution
Source: Depetris-Chauvin, Porto, and Mulangu (2015)
Table 6: Change in income resulting from 1% change in cocoa price
Change in Income of Cocoa-Producing Households Only
Total Poor Non-poor
0.624 0.596 0.659
Change in Income of All Households
Total Poor Non-poor
0.103 0.102 0.105
Source: Depetris-Chauvin, Porto, Mulangu (2015)
Table 6 illustrates the corresponding income changes, for both cocoa-producing households and
all households, resulting from a 1% change in the cocoa producers’ price. While the impact of the
price change is predictably higher (by almost six times) for cocoa producers than for all
0
.02
.04
.06
Sh
are
of co
coa (
Inc
+ A
C)
11 12 13 14 15log per capita expenditure
National Rural
Urban
Ghana
33
households, we did not find any significant differences between poor and non-poor cocoa
producers and households. In other words, a change in the cocoa farm-gate price does not
necessarily affect poor farmers and households more than it affects non-poor ones. However,
the impact seems slightly higher for non-poor households, mainly because non-poor households
get a higher share of their income from cocoa than poor ones, as illustrated in Figure 12.
Finally, we noted earlier that MoTI seeks to reach 40% processing capacity. One possible way to
do this would be by issuing a 35% discount rate for processors on main-crop beans, which will
result in a reduction of COCOBOD’s revenue by 36%, an increase in processors’ revenue by 57%,
and no impact on farmers, as we have assumed in our model that COCOBOD bears the full cost
of the discount. However, if COCOBOD were to pass on the cost of the full discount rate to cocoa
farmers, cocoa producer income would be reduced by a maximum of 22%.
Conclusion
The purpose of this study was to understand what cocoa pricing option best meets the multiple,
but possibly conflicting, public policy objectives of maximizing the government’s tax revenue,
maximizing and stabilizing processor profits and throughput, and reducing poverty rates,
especially among cocoa bean producers. To conduct our analysis, we proceeded in two steps.
First, we evaluated what would need to be changed within the industrial policy regime to attain
the objective of increasing Ghana’s cocoa processing capacity to 40%. We found that this could
be accomplished with a 35% discount on main-crop beans, which would increase processors’
revenue by 57% while either reducing COCOBOD’s revenue by 36% or reducing cocoa farmers’
income by 22%.

34
While a discount on main-crop beans proves to generate sufficient incentives for processors to
increase their capacity, the reality is that it reduces sum of profits across the cocoa value chain.
In addition, cocoa processors already benefit from tax breaks, given that they mostly operate in
the EFZ, as discussed earlier. This position prevents the government from compensating
producers with any additional income tax revenue collected from processors, since processors in
the EFZ are not required to pay income taxes for 10 years. The capital-intensive nature of the
cocoa processing industry does not guarantee substantial job creation. We illustrated that the
number of workers per factory has decreased, from 442 in the early 2000s to 117 today, due to
the capital-intensive nature of cocoa processing activities. Finally, other sectors may benefit from
spillover effects, such as technology transfer, associated with the expansion of the cocoa
processing sector. While this is hard to measure, we can argue here that the enclave nature of
EFZ companies may reduce their spillover effects on the rest of the economy outside the EFZ
enclave.
If Ghana wants to increase the quantity of cocoa it processes locally, it must either revise cocoa
processing firms’ EFZ incentives before adjusting their cocoa pricing options or seek to attract
more processing firms to enter the market. However, Ghana should not expect to gain much in
terms of employment or tax revenue as expected for most processing activities as long as it keeps
attracting new cocoa processing firms via the EFZ benefit.
35
References
African Center for Economic Transformation (ACET) (2014) “African Transformation Report.”
Accra, Ghana.
African Center for Economic Transformation (ACET) (2015) “Sustainable Rural Development in
Africa: Ghana Cocoa Report” Accra, Ghana
Amsden, A. (1989) Asia’s Next Giant: South Korea and Late Industrialization. New York: Oxford University Press.
Ansu, Y. (2013) “Industrial Policy and Economic Transformation in Africa,” in Stiglitz, J., Lin, J. Y., and Patel, E. (eds.) The Industrial Policy Revolution II: Africa in the 21st Century. London: Palgrave Macmillan, pp. 492–528.
Ashton, D. (2012) Lessons from the East Asian and European Experience for Skills Development in
African Countries. Unpublished paper, African Center for Economic Transformation. Accra,
Ghana.
Brander J.A. and Spencer, B.J., (1985), “Export Subsidies and International Market Share Rivalry”, Journal of International Economics, 18(1-2), 83-100
Deaton, A. (1989) “Rice Prices and Income Distribution in Thailand: A Non-Parametric Analysis,” Economic Journal, 99(395), pp. 1–37.
Depetris-Chauvin, N., Porto, G., and Mulangu, F. (2015) Agricultural Supply Chains, Growth and Poverty in Sub-Saharan Africa: Market Structure, Farm Constraints and Grass-root Institutions. Forthcoming book. Dollar, D., and Kraay, A. (2002) “Growth Is Good for the Poor,” Journal of Economic Growth, 7(3),
pp. 195–225.
Dutta, S., Lanvin, B., and Paua, F. (2003) The Global Information Technology Report 2002–2003:
Readiness for the Networked World. New York: World Economic Forum and Oxford University
Press.
Johnson, C. (1982) MITI and the Japanese Miracle: The Growth of Industrial Policy, 1925–1975. Stanford, CA: Stanford University Press.
Kolavalli, S., Vigneri, M., Maamah, H., and Poku, J. (2012) The Partially Liberalized Cocoa Sector in Ghana: Producer Price Determination, Quality Control, and Service Provision. Washington, DC: Ghana Strategy Support Program, International Food Policy Research Institute (IFPRI).
Miranda, M. J., and Fackler, P. L. (2002) Applied Computational Economics and Finance. Cambridge, MA: MIT Press.

36
Porto, G., Depetris-Chauvin, N., and Olarreaga, M. (2010) Supply Chains in Export Agriculture, Competition, and Poverty in Sub-Saharan Africa. London: Centre for Economic Policy Research.
Robinson, J. (2009) “Industrial Policy and Development: A Political Economy Perspective.” Cambridge, MA: Harvard University Department of Government and IQSS.
Rodrik, D. (2007) “Industrial Policy for the Twenty-First Century,” in Rodrik, D. (ed.) One Economics, Many Recipes: Globalization, Institutions, and Economic Growth. Princeton, NJ: Princeton University Press, pp. 99–
Söderbom, M., and Teal, F. (2004) “How can policy towards manufacturing in Africa reduce poverty? A review of the current evidence from cross-country firm studies,” in Wolmuth, K. A., et al (eds.) “African Entrepreneurship and Private Sector Development,” African Development Perspectives Yearbook 2002/2003. Münster, Germany: Lit Verlag
Wade, R. (1990) Governing the Market: Economic Theory and the Role of Government in East Asian Industrialization. Princeton, NJ: Princeton University Press.
World Bank (1993) The East Asian Miracle: Economic Growth and Public Policy. New York: Oxford University Press.
Whitfield, L., and Buur, L. (2014) “The Politics of Industrial Policy: Ruling Elites and Their
Alliances,” Third World Quarterly, 35(1), pp. 126–144.

37
Appendix
Data Sources
The data presented below were collected from various sources, including COCOBOD, ICCO, and various reports on cocoa value chains found online.
1. Raw Cocoa Produced, Main Season and Light Season
Table A
Year
Quantity
Produced
Main Crop
Quantity
Produced
Light
Crop
Quantity
Purchased by
Processors
Main Crop
Quantity
Purchased by
Processors
Light Crop
Quantity
Processed by
Processors
Main Season
Quantity
Processed by
Processors
Light Season
Quantity of Main Crop
Carried Over to
Light Season
2009/10 587,794 44,243 168,003 44,243 128,462.90 83,783.10 39,540.10
2010/11 626,518 73,502 156,193 73,502 137,047.67 92647.33 19,145.33
2011/12 800,207 79,141 132,569 79,141 117,267.37 94,442.63 15,301.63
2012/13 770,466 65,000 165,897 65,000 137,296.81 93,600.19 28,600.19
2013/14 880,000 50,000 178,800 50,000 153,736.23 75,063.77 25,063.77
All quantities measured in metric tons.
While drier weather resulting from climate change and variability could have an impact on bean
size, the proportion of small beans (i.e., light crop) has averaged about 10% of total production
in the last decade. This has implications for the cocoa grinding sector in Ghana.
2. International Price of Raw Cocoa
The main season runs from October to June, and the light season from July to September. We
used monthly international cocoa prices to estimate the corresponding international prices for
the two seasons.
Year Main season Light season
2009 2863.78 2963.62
2010 3157.74 3058.73

38
2011 2961.69 3035.12
2012 2357.79 2494.12
2013 2236.57 2469.67
2014 3007 3227
3. International Price of Processed Cocoa
This is a composite price of butter, cake, and powder, the three main intermediate cocoa
products.
Year Main season Light season
2009 5464.69 5655.21
2010 6025.63 5836.70
2011 5651.52 5791.64
2012 4499.16 4759.30
2013 4267.84 4712.65
2014 5737.98 6157.79
4. COCOBOD Gross Sales Discount Offered to Processors, for Main-Crop Beans and Light-
Crop Beans
The light-season COCOBOD gross sales discount offered to processors is 0.80 and has not
changed over the years. The main-season COCOBOD gross sales discount offered to processors
is 1.0 and has not changed over the years.
5. COCOBOD’s Gross Purchase Discount Offered to Producers
Today farmers receive 72% of international market price
Year Gross discount to producers in seasons 1 and 2
07/08 66%
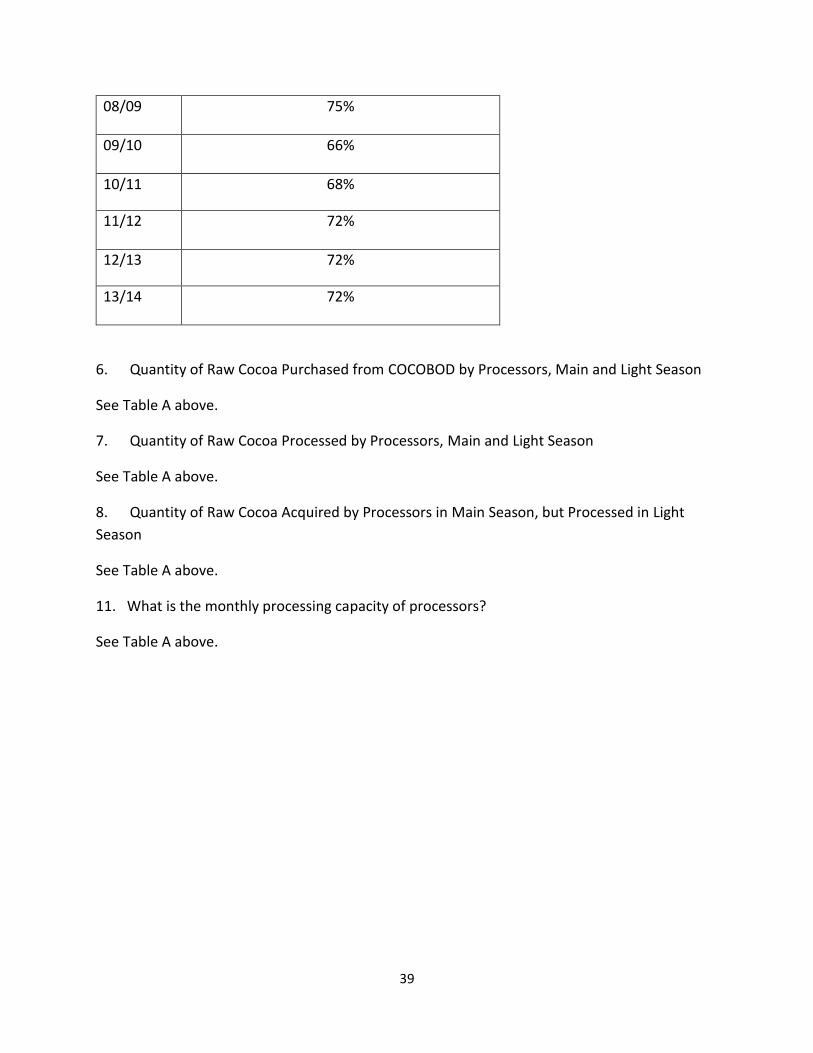
39
08/09 75%
09/10 66%
10/11 68%
11/12 72%
12/13 72%
13/14 72%
6. Quantity of Raw Cocoa Purchased from COCOBOD by Processors, Main and Light Season
See Table A above.
7. Quantity of Raw Cocoa Processed by Processors, Main and Light Season
See Table A above.
8. Quantity of Raw Cocoa Acquired by Processors in Main Season, but Processed in Light
Season
See Table A above.
11. What is the monthly processing capacity of processors?
See Table A above.