Is CO2 mitigation cost-effective?jonova.s3.amazonaws.com/monckton/co2-mitigation-cos… · ·...
12
Is CO2 mitigation cost-effective? Christopher Monckton of Brenchley [email protected] Lecture to the Prague School of Economics May 2011 Introduction Hitherto, the economic literature has chiefly addressed the cost-effectiveness of climate mitigation globally. A simple yet comprehensive metric, derived from methods of the Intergovernmental Panel on Climate Change (IPCC, here taken as reliable), is intended to enable even non-specialist policy-makers to determine not only how much global warming any proposed CO2-reduction policy may be expected to forestall but also the policy’s mitigation cost-effectiveness and the abatement cost of forestalling a given quantum of future warming, on the assumption that the global cost-effectiveness of all mitigation strategies is equivalent to that of the policy. Brief case studies illustrate how cost-benefit may be addressed by comparing the mitigation cost-effectiveness of competing CO2-reduction policies with one another, and by comparing their abatement costs with published estimates of the welfare loss arising from unmitigated climate change. As benchmarks, Stern (2006, p. vi), using the 0.1% discount rate that will be adopted here for illustration, estimates that 1% of 21 st -century global GDP will suffice to forestall a projected 5 K global warming to 2100, against a global inaction cost of 5-20%, while Garnaut (2008, p. 253, fig. 11.2, & p. 270, table 11.3) puts Australia’s 21 st -century mitigation and inaction costs at 3.2-4% and 6% respectively, against a projected 5.1 K unmitigated global warming to 2100. The economic literature puts the inaction cost at 1-4%. Costs external to the policy itself and benefits external to mitigation of CO2 forcing are beyond the focus of this paper, but the metric may readily be adapted to encompass them.
Transcript of Is CO2 mitigation cost-effective?jonova.s3.amazonaws.com/monckton/co2-mitigation-cos… · ·...

Is CO2 mitigation cost-effective? Christopher Monckton of Brenchley
Lecture to the Prague School of Economics May 2011
Introduction
Hitherto, the economic literature has chiefly addressed the cost-effectiveness of climate mitigation globally. A simple yet comprehensive metric, derived from methods of the Intergovernmental Panel on Climate Change (IPCC, here taken as reliable), is intended to enable even non-specialist policy-makers to determine not only how much global warming any proposed CO2-reduction policy may be expected to forestall but also the policy’s mitigation cost-effectiveness and the abatement cost of forestalling a given quantum of future warming, on the assumption that the global cost-effectiveness of all mitigation strategies is equivalent to that of the policy.
Brief case studies illustrate how cost-benefit may be addressed by comparing the mitigation cost-effectiveness of competing CO2-reduction policies with one another, and by comparing their abatement costs with published estimates of the welfare loss arising from unmitigated climate change. As benchmarks, Stern (2006, p. vi), using the 0.1% discount rate that will be adopted here for illustration, estimates that 1% of 21st-century global GDP will suffice to forestall a projected 5 K global warming to 2100, against a global inaction cost of 5-20%, while Garnaut (2008, p. 253, fig. 11.2, & p. 270, table 11.3) puts Australia’s 21st-century mitigation and inaction costs at 3.2-4% and 6% respectively, against a projected 5.1 K unmitigated global warming to 2100. The economic literature puts the inaction cost at 1-4%.
Costs external to the policy itself and benefits external to mitigation of CO2 forcing are beyond the focus of this paper, but the metric may readily be adapted to encompass them.
2
Method
For simplicity, central estimates from IPCC’s A2 emissions scenario are used throughout. Eq. (1) determines Cpol, the atmospheric CO2 concentration in ppmv (somewhat below IPCC’s projected A2 business-as-usual concentration Cy) achievable by following any proposed policy to mitigate the radiative forcing from atmospheric CO2 enrichment from 2010 (when C2010 = 390 ppmv) till a target calendar year y. Eq. (1) also determines ΔTnix, the quantum (in K) of transient global warming that the policy will be likely to forestall if pursued until year y. Only two case-specific inputs are required: Cy itself, and p, the proportion of projected global business-as-usual CO2 emissions till year y that the policy is intended to forestall. A non-case-specific input is the climate-sensitivity parameter λ, defined later, which may be set to encompass the interval of IPCC global-warming projections under all emissions scenarios. Eq. (1) may be tuned to represent any forcing (see Table 2 below): but only warming attributable to the CO2 forcing is demonstrated here.
[ (
)]
[ (
( ))] (1)
Mitigation cost-effectiveness is defined as the cost of forestalling 1 K CO2-driven global warming on the assumption that all measures to mitigate all CO2-driven warming to year y are as cost-effective as the policy under consideration. On the same assumption, the policy’s global abatement cost is defined as the cost (expressed either as a percentage of real global GDP from 2010 to year y or as a cash cost per capita to year y) of forestalling all global warming from all forcings that the IPCC projects will occur by year y without mitigation.
Where ΔTallCO2 is all projected CO2-driven warming to year y, where x is the net present value of the policy’s cost, and where x/p is the cost of mitigating all CO2-driven warming to year y, Eq. (2) gives the mitigation cost-effectiveness in US$ per Kelvin of global warming forestalled. The lesser the mitigation cost-effectiveness M, the more cost-effective is the policy, enabling policymakers reliably to compare competing mitigation proposals.
(
)
[ ( )] (2)
Where q is the fraction of total radiative forcing attributable to CO2, Eq. (3) gives the policy’s abatement cost as a percentage of total real global 21st-century GDP r to year y:
(3)
Eq. (4) gives the per-capita abatement cost in US $/head assuming 7 bn world population:
(4)
3
Derivation of Equation (1)
IPCC (2001), following Myhre et al. (1998), takes the CO2 forcing in W m–2 as 5.35 times the logarithm of a given proportionate change Cb/Ca in atmospheric CO2 concentration, where Ca is the unperturbed value. Where λ is a climate-sensitivity parameter in K W–1 m2, consequent global warming in K may thus be expressed generally by Eq. (5):
ΔT = λ ∆F = λ [5.35 ln(Cb/Ca)]. (5)
IPCC (2001, p. 354, citing Ramanathan, 1985) takes 0.5 K W–1 m2 as a typical value of λ. On the A2 emissions scenario, IPCC (2007, p. 13, table SPM.3) projects 3.4 K warming by 2100 in response to forcings from all sources summing to 8 W m–2 (ibid., p. 803, fig. 10.26), implying a 21st-century transient-sensitivity parameter λtra = 3.4 / 8 = 0.425 K W–1 m2, which the case studies will use. As a check, at CO2 doubling Eq. (5) gives 0.425[5.35 ln(2)] = 1.6 K, within the model-derived transient-climate-response interval [1, 3] K (ibid., p. 749).
The parameter λequ for climate sensitivity when the climate has settled to equilibrium after our perturbation of it will exceed λtra. However, equilibrium is not reached for 1000-3000 years (Solomon et al., 2009), so only 21st-century warming is policy-relevant: subsequent warming will occur too slowly to do unavoidable harm.
On the IPCC’s A2 emissions scenario, CO2 concentration is projected to rise from 390 ppmv today (Tans, 2011) to 836 ppmv by 2100 (IPCC, 2007, ch. 10, p. 750). Accordingly, a central estimate of global warming preventable by 2100 even if all anthropogenic CO2 emissions were to have ceased in 2010 is λtra[5.35 ln(836/390)] = 1.7 K.
To reflect the IPCC’s wide error-intervals, where λc is a central estimate λ will fall on the 1 σ interval [0.8λc, 1.2λc] (from the ±0.69 K 1 σ error-bar in IPCC, 2007, p. 798, box 10.2), or on the >66%-probability interval [0.6λc, 1.4λc] (derived ibid., p. 12). Thus, where λc = 0.425 K W–1 m2, λ will fall on [0.34, 0.51] to 1 σ, and on [0.26, 0.59] with probability >0.66.
Where p, on [0, 1], is the fraction of future global emissions that a given CO2-reduction policy is projected to forestall by a target calendar year y, and Cy is the IPCC’s projected unmitigated CO2 concentration in year y, Eq. (6) gives Cpol, the somewhat lesser concentration in ppmv that may be expected to obtain in year y if the policy is followed:
Cpol = Cy – p(Cy – 390). (6)
Table 1 gives decadal values of Cy from 2010-2100 on the IPCC’s A2 emissions scenario, whose central projection is that the anthropogenic fraction of CO2 concentration will grow exponentially from 390 ppmv in 2010 to C2100 = 836 ppmv by 2100.
y 2010 2020 2030 2040 2050 2060 2070 2080 2090 2100 Cy 390 412 438 469 506 551 604 668 744 836
Table 1. Business-as-usual CO2 concentrations, 2010-2100, on scenario A2 (IPCC, 2007). CO2 concentration in 2010 is 390 ppmv (Tans, 2011) compared with 280 ppmv in 1750, so that the anthropogenic component is 110 ppmv. Assuming all increases in CO2 concentration since 1750 are anthropogenic, in any calendar year y in the 90 years 2011-2100, IPCC’s projected intra-decadal values of Cy on emissions scenario A2 are determined by the equation
.110280)
110
280ln
90
2010(
2100
Cy
y eC

4
Eq. (7), of similar form to the general Eq. (5), gives the quantum of warming ΔTnix, in K, that a specific policy intended to cut CO2 emissions will forestall in the 21st century:
ΔTnix = λtra [5.35 ln(Cy/C2010) – 5.35 ln(Cpol/C2010)] = λtra [5.35 ln (Cy/Cpol)]. (7)
The second expression of Eq. (7) is identical to the second expression of Eq. (1).
Other greenhouse gases
The metric described here may be adapted to determine the mitigation cost-effectiveness and global abatement costs of greenhouse gases other than CO2. Table 2 summarizes some climate-relevant radiative forcing functions:
Trace gas
Radiative forcing ΔF gy= business-as-usual; gpol = lesser concentration after policy
Concentration in 2010
CH4 0.036(μy0.5 – μpol
0.5) + f(μpol, νpol)† – f(μy, νpol)† 1816 ppbv
N2O 0.12(νy0.5 – νpol
0.5) + f(μpol, νpol)† – f(μpol, νy)† 324 ppbv
CFC11 0.00025(βy – βpol) 238 pptv
CFC12 0.00033(γy – γpol) 532 pptv
SF6 5.2–4(υy – υpol) 7.31 pptv
SO2 –[0.03 ψy/ψpol+0.08 ln(1+ψy/34.4)/(1+ψpol/34.4)] Unknown
† f(σ,τ) = 0.47 ln[1 + 2.01 x 10⁻⁵(στ)0.75 + 5.31 x 10⁻¹⁵σ(στ)1.52]
Table 2. Radiative forcing functions for methane (CH4), nitrous oxide (N2O), CFC11, CFC12, sulfur hexafluoride (SF6), and sulfur dioxide (SO2). Global values for SO2 are unknown because its concentration is highly variable both spatially and temporally: however, the forcing function is given so as to permit estimates to be used. Source: IPCC (2007).
Illustrative case studies
In the brief illustrative case studies that follow, A2-scenario 21st-century transient warming is taken as 3.4 K arising in response to a forcing of 8 W m–2, so that the “near-invariant” (IPCC, 2001, ch. 6.1) transient-sensitivity parameter λtra is 3.4 / 8 = 0.425 K W–1 m2. Real GDP growth of 3%/year from $60 tr/year in 2010 (World Bank, 2011) is assumed in all cases. The 0.1% discount rate in Stern (2006) is applied, so that his estimated welfare loss of 5-20% of GDP arising in the absence of any mitigation may serve as a policy benchmark. The appropriateness of this rate is examined later. Some results are rounded.
Case study 1: US carbon-trading Bill
At $180 bn/year for 40 years, total $7.2 tr, discounted to $7 tr at net present value, the climate Bill (HR 2454, 2009, s. 311) would have forestalled 83% of US CO2 emissions by 2050. The US emits 17% of global CO2 (derived from Olivier & Peters, 2010, table A1). Thus p = 0.1411. From Table 1, business-as-usual CO2 concentration in 2050 would be 506 ppmv, falling to 489.632 ppmv (from Eq. 5) via the Bill. From Eq. (1), warming forestalled is 0.07 K; from Eq. (2), mitigation cost-effectiveness is $84 tr/K; from Eq. (3), the global abatement cost of all projected warming to 2050 is almost $100 tr, or more than 2% of global GDP to 2050, or (from Eq. 4), $14,000 per capita of global population.
5
Case study 2: Australia cuts emissions 25% in 10 years
Carbon Trading will cost $11.5 bn/year, plus $2.5 bn/year for innovation (Garnaut, 2011), plus $1.6 bn/year for administration (Wong, 2010, p. 5), all rising at 4%/year above GDP growth, or $231 bn by 2020 at n.p.v., to forestall 25% of current emissions, which are 1.2% of world emissions (derived from Boden et al., 2010ab). Thus p = 0.003. CO2 concentration would fall from a business-as-usual 412 to 411.934 ppmv by 2020. Warming forestalled is <0.0004 K; mitigation cost-effectiveness is $634 tr/K; global abatement cost of projected warming to 2020 is $151 trillion, or 21.3% of global GDP to 2020, or $21,000 per capita.
Case study 3: UK Climate Change Act
The UK accounts for 1.5% of global CO2 emissions (derived from Olivier & Peters, 2010, table A1). At an officially-estimated cost of $1.2 tr by 2050, the Climate Change Act (2008, s. 1(1)), will cut 80% of UK emissions, which are 1.5% of world emissions. Thus p = 0.012. Business-as-usual CO2 concentration in 2050 is 506 ppmv, falling to 504.608 ppmv via the Act. Warming forestalled is 0.006 K; mitigation cost-effectiveness is $167 tr/K; and global abatement cost to 2020 is $193 tr, or 4% of global GDP to 2050, or $27,500 per capita.
Case study 4: EU carbon trading
EU carbon trading costs $92 bn/year (World Bank, 2009, p. 1), or $915 bn at net present value by 2020. The EU aims to halt 20% of its emissions, which are 13% of global emissions (from Boden et al., 2010ab). Thus p = 0.026. Business-as-usual CO2 concentration would be 412 ppmv by 2020, falling to 411.428 ppmv via the policy. Warming forestalled is 0.003 K; mitigation cost-effectiveness, excluding non-carbon-trading costs, is $282 tr/K; and the global abatement cost of $69 tr is 8% of GDP to 2020, or almost $10,000 per capita.
Case study 5: Thanet Wind Array
Subsidy to the world’s largest wind-farm, off the English coast, guaranteed at $100 mn annually for its 20-year life, is £1.96 bn at net present value. Rated output of the 100 turbines is 300 MW, but wind-farms yield only 24% of rated capacity (Young, 2011, p. 1), so total output, at 72 MW, is 1/600 of mean 43.2 GW UK electricity demand (Department for Energy and Climate Change, 2011). Electricity is 33% of UK CO2 emissions, which are 1.5% of global emissions, so p = 8.333 x 10⁻⁶. Business-as-usual CO2 concentration in 2030 would be 438 ppmv, falling to 437.9996 ppmv as a result of the subsidy. Warming forestalled is 0.000002 K; mitigation cost-effectiveness is almost $900 tr/K; and the global abatement cost of $461 tr is 28% of GDP to 2030, or $66,000 per capita.
Case study 6: Oldbury Primary School wind turbine
On 31 March 2010 Sandwell Council, England, answered a freedom-of-information request, disclosing that it had spent $9694 (£5875) on buying and installing a small wind-turbine like one at a primary school in Oldbury which had in a year generated 209 KWh – enough to power a single 100 W reading-lamp for <3 months. Assuming no maintenance costs, and discounting revenues of $0.18 (£11)/KWh for 20 years to net present value, net cost is $8943. p = 209 KWh / 365 days / 24 hrs / 43.2 GW x 0.33 x 0.015 = 2.76 x 10⁻¹². CO2 concentration of 438 ppmv will fall to 437.9999999999 ppmv. Warming forestalled is 0.0000000000007 K; mitigation cost-effectiveness is $12,000 tr/K; and the global abatement cost, at >$6000 tr, is 400% of global GDP to 2030, or $900,000 per capita.

6
Case study 7: London bicycle-hire scheme
In 2010 the Mayor of London set up what he called a “Rolls-Royce” scheme at US$130 mn for 5000 bicycles (>$26,000 per bicycle). Transport represents 15.2% of UK emissions (from Office for National Statistics, 2010, table C). Cycling represents 3.1 bn of the 316.3 bn vehicle miles travelled on UK roads annually (Department for Transport, 2011). There are 23 mn bicycles in use in Britain (Cyclists’ Touring Club, 2011). Global emissions will be cut by 1.5% of 15.2% of 3.1/316.3 times 5000/23 mn. Thus p = 4.886 x 10⁻⁹. If the lifetime of bicycles and docking stations is 20 years, business-as-usual CO2 concentration of 438 ppmv will fall to 437.9999998 ppmv through the scheme. Warming forestalled is 0.000000001 K; mitigation cost-effectiveness exceeds $100,000 tr/K; and the global abatement cost of $52,000 tr exceeds 3000% of global GDP to 2030, representing almost $7.5 mn per capita.
Results
Government estimates of abatement cost (cases 1-3) exceed by a factor 2-4 the 1% of GDP Stern considers achievable, but are similar to those in Garnaut (2008) and in the peer-reviewed literature. However, the costs of specific measures prove considerably higher than government estimates, which seem optimistic. The global abatement cost of measures equivalent to EU carbon trading, for instance, is almost 10% of global GDP, while that of policies equivalent to subsidizing the world’s largest wind farm is 28% of GDP, substantially in excess of Stern’s estimated maximum inaction cost.
Table 3 compares the results of the case studies with the estimates of 21st-century global abatement and inaction costs given in Stern (2006):
Case study
[#]
Warming forestalled
(K by year y)
Mitigation cost-effect.
($ tr/K)
Abate. cost
(% GDP)
Cost/ capita ($000)
Stern 21st-century abate. cost 3.4 K by 2100 $90 tr/K 1% 43 [1] US cap-&-trade Bill 0.07 K by 2050 $84 tr/K 2% 14
[2] Australia 25% cut 0.0004 K by 2020 $634 tr/K 21.3% 21 [2] UK Climate Act 0.006 K by 2050 $167 tr/K 4% 27.6
Stern low-end inaction cost 0.0 K by 2100 N.A. 5% N.A. [4] EU carbon trading 0.003 K by 2020 $282 tr/K 9.7% 9.9
Stern high-end inaction cost 0.0 K by 2100 N.A. 20% N.A. [5] Thanet Wind Array 0.0+ K by 2030 $891 tr/K 28% 66
[6] Sandwell school windmill 0.0+ K by 2030 $12,270 tr/K 382% 907 [7] London bicycle hire scheme 0.0+ K by 2030 $101,000 tr/K 3142% 7450
Table 3. Results of the case studies, compared with estimates of global abatement and inaction costs (italicized) in Stern (2006).
Some estimates from the peer-reviewed economic journals are as follows, broadly suggesting that the global inaction cost will be 2-5% of GDP:
1.0 K warming will cost 2.5% of GDP (Tol, 2002).
2.5 K warming will cost 0.9% (Nordhaus, 2006), 1.4% (Fankhauser, 1995), 1.5% (Nordhaus & Boyer, 2000), 1.7% (Nordhaus & Yang, 1996), 1.9% (Tol, 1995), 2.5% (Plamberk & Hope, 1996), or 0.0-0.1% of GDP (from market impacts only: Mendelsohn et al., 2000).
3 K warming will cost 1.3-4.8% of GDP (Nordhaus, 1994ab).

7
There are three main reasons for the differences between the peer-reviewed literature and the Stern report.
First, Stern adopts extreme a very high central estimate of the warming to be expected by 2100: 5 K compared with the IPCC’s 3.4 K. The adoption by Stern of a central climate-sensitivity estimate half as much again as that of the IPCC provides a margin of caution, allowing its use as a starting point for determining global inaction costs on the basis of various other discount rates that occur in the literature.
Secondly, Stern adopts extreme estimates of various specific welfare losses (such as that from malaria, which will in fact be near-zero in response to global warming). Again, if we merely adopt his analysis ad argumentum, any analysis that we base upon it will err on the side of caution.
Thirdly, Stern adopts a 0.1% pure rate-of-time preference. The inter-temporal discount rate is, as we shall see, the prime determinant of variations between published cost-benefit estimates.
By how much, then, should future costs and benefits be discounted to net present value to take account of the uncertainties inherent in any long-term investment appraisal, and particularly inherent in an appraisal of the effect of a given policy on the future behavior of the non-linear, chaotic climate object?
Stern’s 0.1% discount rate is based – according to a document linked from HM Treasury’s website – on a misunderstanding by him of the literature on the economic treatment of inter-generational equity.
Certainly, Stern’s near-zero rate is a long way below HM Treasury’s standard 3.5% discount rate.
However, the Treasury moved in Stern’s direction by adopting two reduced “climate-change” discount rates, that are initially commercial and are then reduced after year 30 and again after year 75 to allow for “very-long-term, substantial, and for practical purposes irreversible wealth transfers between generations” (Grice, 2011; Lowe, 2008).
Over the entire 21st century these variable rates are equivalent to 3.22% and 2.75% respectively – much closer to the Treasury’s standard 3.5% discount rate than to Stern’s 0.1%.
Garnaut chooses two discount rates: 1.35% and 2.65%.
Finally, Dr. Vaclav Klaus, President of the Czech Republic, recommends a 5% discount rate to allow for uncertainties in climate prediction (Downing College climate conference, 2011).
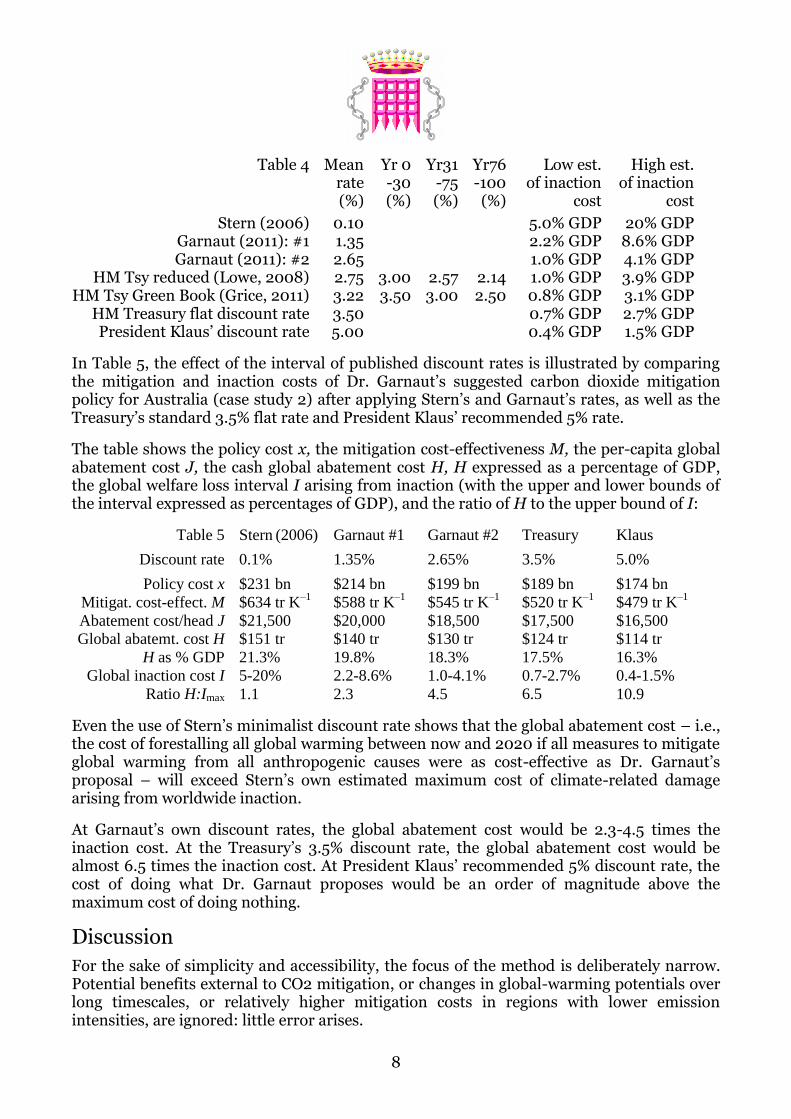
In Table 4, all of these rates are modelled on a very simple basis. First 3% annual GDP growth throughout the 21st century is assumed.
Secondly, low-end and high-end estimates of the welfare loss owing to climate inaction are determined by multiplying Stern’s 5%- and 20%-of-GDP estimated 21st-century inaction costs by the ratio of total 21st-century GDP discounted at Stern’s 0.1% rate to total 21st-century GDP discounted at the mean discount rates shown:
8
Table 4 Mean rate (%)
Yr 0 -30 (%)
Yr31 -75 (%)
Yr76 -100 (%)
Low est. of inaction
cost
High est. of inaction
cost
Stern (2006) 0.10 5.0% GDP 20% GDP Garnaut (2011): #1 1.35 2.2% GDP 8.6% GDP Garnaut (2011): #2 2.65 1.0% GDP 4.1% GDP
HM Tsy reduced (Lowe, 2008) 2.75 3.00 2.57 2.14 1.0% GDP 3.9% GDP HM Tsy Green Book (Grice, 2011) 3.22 3.50 3.00 2.50 0.8% GDP 3.1% GDP
HM Treasury flat discount rate 3.50 0.7% GDP 2.7% GDP President Klaus’ discount rate 5.00 0.4% GDP 1.5% GDP
In Table 5, the effect of the interval of published discount rates is illustrated by comparing the mitigation and inaction costs of Dr. Garnaut’s suggested carbon dioxide mitigation policy for Australia (case study 2) after applying Stern’s and Garnaut’s rates, as well as the Treasury’s standard 3.5% flat rate and President Klaus’ recommended 5% rate.
The table shows the policy cost x, the mitigation cost-effectiveness M, the per-capita global abatement cost J, the cash global abatement cost H, H expressed as a percentage of GDP, the global welfare loss interval I arising from inaction (with the upper and lower bounds of the interval expressed as percentages of GDP), and the ratio of H to the upper bound of I:
Table 5 Stern (2006) Garnaut #1 Garnaut #2 Treasury Klaus
Discount rate 0.1% 1.35% 2.65% 3.5% 5.0%
Policy cost x $231 bn $214 bn $199 bn $189 bn $174 bn
Mitigat. cost-effect. M $634 tr K–1
$588 tr K–1
$545 tr K–1
$520 tr K–1
$479 tr K–1
Abatement cost/head J $21,500 $20,000 $18,500 $17,500 $16,500
Global abatemt. cost H $151 tr $140 tr $130 tr $124 tr $114 tr
H as % GDP 21.3% 19.8% 18.3% 17.5% 16.3%
Global inaction cost I 5-20% 2.2-8.6% 1.0-4.1% 0.7-2.7% 0.4-1.5%
Ratio H:Imax 1.1 2.3 4.5 6.5 10.9
Even the use of Stern’s minimalist discount rate shows that the global abatement cost – i.e., the cost of forestalling all global warming between now and 2020 if all measures to mitigate global warming from all anthropogenic causes were as cost-effective as Dr. Garnaut’s proposal – will exceed Stern’s own estimated maximum cost of climate-related damage arising from worldwide inaction.
At Garnaut’s own discount rates, the global abatement cost would be 2.3-4.5 times the inaction cost. At the Treasury’s 3.5% discount rate, the global abatement cost would be almost 6.5 times the inaction cost. At President Klaus’ recommended 5% discount rate, the cost of doing what Dr. Garnaut proposes would be an order of magnitude above the maximum cost of doing nothing.
Discussion
For the sake of simplicity and accessibility, the focus of the method is deliberately narrow. Potential benefits external to CO2 mitigation, or changes in global-warming potentials over long timescales, or relatively higher mitigation costs in regions with lower emission intensities, are ignored: little error arises.

9
Given the small quanta of warming forestalled by CO2-reduction policies, as well as the breadth of the intervals of published estimates of inaction and mitigation costs, greater complexity may in any event be otiose.
The case studies suggest official projections may be optimistic against the cost-effectiveness of specific policies. For instance, the abatement cost of EU carbon-trading is within Stern’s inaction-cost interval, suggesting that the policy should be abandoned. The abatement cost of subsidy to the Thanet wind array, a large but typical government mitigation exercise, is well above the inaction-cost interval, a fortiori suggesting desubsidization. In general, smaller projects seem less mitigation-cost-effective than larger projects.
A substantial reduction in global CO2 emissions, maintained over centuries, might offset some of the warming caused by the pre-existing increase in atmospheric CO2 concentration from 278 ppmv in 1750 to 390 ppmv in 2010. After a sufficiently long period of global emissions reduction (y 2100), it may become justifiable to reduce the value 390 in the denominator of Eq. (1) stepwise towards the pre-industrial CO2 concentration 278 ppmv, increasing ΔTnix and consequently reducing M. However, within the 21st century even the immediate and total elimination of CO2 emissions will only forestall 1.7 K global warming.
For numerous reasons, Eq. (1) and the case studies tend to overstate the warming that any CO2-reduction policy may forestall, and also to overstate mitigation cost-effectiveness:
It is here assumed that any policy-driven reduction in CO2 concentration occurs at once, when it would be likely to occur stepwise to year y, halving the warming otherwise forestalled by that year. The IPCC takes CO2’s mean atmospheric residence time as 50-200 years: if so, little mitigation will occur within the 21st century. In some cases – for example, the EU carbon trading scheme – it is assumed that the policy will meet the emissions-reduction target on its own, ignoring the often heavy cost of all other mitigation measures intended to contribute to achievement of the target.
In most case studies capital costs only are counted and running costs excluded. Capital costs external but essential to a project, such as provision of backup generation for wind turbines on windless days, are excluded. Emissions from project construction and installation, such as concrete bases for wind turbines, are ignored, as are costs and CO2 emissions arising from necessary external operating expenditures such as spinning-reserve backup generation for wind turbines.
If the IPCC’s central projections exaggerate the warming that may arise from a given increase in atmospheric CO2 concentration, the warming forestalled may be less than shown. Though emissions are rising in accordance with the IPCC’s A2 emissions scenario, concentration growth has been sub-exponential for a decade, so that outturn by 2100 may be considerably below the IPCC’s A2-scenario low-end estimate 730 ppmv.
The A2 scenario is one of the more extreme emissions scenarios: use of any of the four less extreme scenarios would lead to lesser warming and hence to reduced mitigation cost-effectiveness. The climate-sensitivity parameter λtra used in the case studies is centennial-scale: accordingly, over the shorter periods covered by the studies a somewhat lesser coefficient (allowing for the fact that longer-term temperature feedbacks may not yet have acted) and consequently less warming forestalled would reduce mitigation cost-effectiveness.

10
Conclusions
The case studies indicate that government estimates of overall abatement cost are likely to be optimistic. Mitigation policies cheap enough to be affordable will be ineffective, while policies costly enough to be effective will be unaffordable. It is unlikely that any policy to forestall global warming by taxing, trading, regulating, reducing, or replacing greenhouse-gas emissions will prove cost-effective solely on grounds of the welfare benefit foreseeable from global-warming mitigation. High abatement costs, and the negligible returns in warming forestalled, imply that focused adaptation to the consequences of such future warming as may occur will prove to be some orders of magnitude more cost-effective than any attempted mitigation. If so, since the opportunity cost of diverting trillions of dollars to mitigation is heavy, the question arises whether mitigation should be attempted at all.
Acknowledgements
I am grateful for comments from Professor Tim Congdon, formerly of the Monetary Policy Committee of the Bank of England; Dr. Christopher Essex, Professor and departmental Chair of Applied Mathematics in the University of Western Ontario; Dr. David Evans, formerly of the Australian Government’s Carbon Accounting Office; Dr. Laurence Gould, Professor of Physics in the University of Hartford; Dr. Vaclav Klaus, President of the Czech Republic; and Dr. Fred Singer, Professor Emeritus of Environmental Sciences in the University of Virginia. Any errors that remain are mine.

11
References
Boden, T., and G. Marland, 2010a, Global CO2 Emissions from Fossil-Fuel Burning, Cement Manufacture, and Gas Flaring: 1751-2007, Carbon Dioxide Information and Analysis Center, Oak Ridge, Tennessee, USA.
Boden, T., G. Marland and R. Andres, 2010b, Ranking of the world's countries by 2007 total CO2 emissions from fossil-fuel burning, cement production, and gas flaring, Carbon Dioxide Information and Analysis Center, Oak Ridge, Tennessee, USA.
Climate Change Act, 2008, http://www.legislation.gov.uk/ukpga/2008/27/section/1.
Cyclists’ Touring Club, 2011, Cyclists’ Touring Club Facts and Figures, obtainable from http://www.ctc.org.uk/resources/Campaigns/CTC-Facts+figs_rpt.pdf.
Department for Energy and Climate Change, 2011, United Kingdom Energy Statistics: Electricity 5.2, www.decc.gov.uk/en/content/cms/statistics/source/electricity/electricity.aspx.
Department for Transport, 2011, Table TRA0101, Road traffic by vehicle type, Great Britain, 1950-2009, http://www.dft.gov.uk/pgr/statistics/datatablespublications/roads/traffic/#tables.
Fankhauser, S, 1995, Valuing Climate Change – The Economics of the Greenhouse, EarthScan, London, UK [1st edn.]
Garnaut, R., 2008, The Garnaut Climate Change Review: Final Report, Cambridge University Press, Port Melbourne, Australia, 680 pp, ISBN 9780521744447.
Grice, J., 2011, The Green Book: Appraisal and Evaluation in Central Government: Treasury Guidance, The Stationery Office, London, UK, 114 pp: obtainable from http://www.hm-treasury.gov.uk/d/green_book_complete.pdf.
HadCRUt3gl, 2011, Monthly global mean surface temperature anomalies, 1850-2011, obtainable from http://www.cru.uea.ac.uk/cru/data/temperature/hadcrut3gl.txt.
HR 2454, 2009, American Clean Energy & Security Act [not yet enacted], 111th Congress, Washington DC.
IPCC, 2001, Climate Change 2001: The Scientific Basis. Contribution of Working Group I to the Third Assessment Report of the Intergovernmental Panel on Climate Change [Houghton, J.T., Y. Ding, D.J. Griggs, M. Noguer, P.J. van der Linden, X. Dai, K. Maskell and C.A. Johnson (eds.)]. Cambridge University Press, Cambridge, United Kingdom, and New York, NY, USA, 881 pp.
IPCC, 2007, Climate Change 2007: the Physical Science Basis. Contribution of Working Group I to the Fourth Assessment Report of the Intergovernmental Panel on Climate Change, 2007 [Solomon, S., D. Qin, M. Manning, Z. Chen, M. Marquis, K.B. Avery, M. Tignor and H.L. Miller (eds.)], Cambridge University Press, Cambridge, United Kingdom, and New York, NY, USA.
Lowe, J, 2008, Intergenerational wealth transfers and social discounting: supplementary Green Book guidance, HM Treasury, London, 8 pp, ISBN 978-1-84532-419-3.
McCauley, R., 2011, Letter of response to a request under the Freedom of Information Act received from Peter Day, Sandwell Borough Council, Oldbury, England, 31 March, obtainable from http://www.whatdotheyknow.com/request/wind_turbine#incoming-163689.
Mendelsohn, R.O., W.N. Morrison, M.E. Schlesinger, and N.G. Andronova, 2000, Country-specific market impacts of climate change, Climatic Change 45:3-4, 553-569.

12
Myhre, G., E. J. Highwood, K. P. Shine, and F. Stordal, 1998, New estimates of radiative forcing due to well mixed greenhouse gases, Geophys. Res. Lett. 25:14, 2715–2718, doi:10.1029/98GL01908.
Nordhaus, W.D., 2006, Geography and macroeconomics: new data and new findings, PNAS 103:10, 3510-3517.
Nordhaus, W.D., 1994a, Expert opinion on climate change, American Scientist 82:1, 45-51.
Nordhaus, W.D., 1994b, Managing the global commons: the economics of climate change, MIT Press, Cambridge, Mass., and London, England.
Nordhaus, W.D., and J.G. Boyer, 2000, Warming the world: economic models of global warming, MIT Press, Cambridge, Mass., and London, England.
Nordhaus, W.D., and Z. Yang, 1996, RICE: a regional dynamic general-equilibrium model of optimal climate-change policy, American Economic Review 86:4, 741-765.
Office for National Statistics, 2010, Statistical Bulletin, Greenhouse gas emissions intensity falls in 2008, June 11, obtainable from http://www.statistics.gov.uk/pdfdir/ea0610.pdf.
Olivier, J.G.J., and J.A.H.W. Peters, 2010, Mondiale emissies koolstofdioxide door gebruik fossiele brandstoffen en cementproductie, 1990-2009, PBL Netherlands Environmental Assessment Agency, Den Haag, Netherlands, 16 pp.
Plamberk, E.E., and C.W. Hope, 1996, PAGE95 – an updated valuation of the impacts of global warming, Energy Policy 24:9, 783-793.
Ramanathan, V., R. Cicerone, H. Singh and J. Kiehl, 1985, Trace gas trends and their potential role in climate change, J. Geophys. Res. 90, 5547-5566.
Solomon, S., G.-K. Plattner, R. Knutti and P. Friedlingstein, 2009, Irreversible climate change due to carbon dioxide emissions, PNAS 106:6, 74-79, doi: 10.1073/pnas:0812721106.
Stern, N., 2007, The Economics of Climate Change: The Stern Review, Cambridge University Press, Cambridge, United Kingdom, and New York, NY, USA, 712 pp.
Tans, P., 2011, NOAA global monthly mean CO2 concentration trends dataset, obtainable from ftp://ftp.cmdl.noaa.gov/ccg/co2/trends/co2_mm_gl.txt.
Tol, R.S.J., 1995, The damage costs of climate change: toward more comprehensive calculations, Environmental and Resource Economics 5:4, 353-374.
Tol, R.S.J., 2002, Benchmark and dynamic estimates of the damage costs of climate change, Environmental and Resource Economics 21:1, 47-73, and 21:2, 135-160.
Tol, R.S.J., 2009, An analysis of mitigation as a response to climate change, Copenhagen Consensus Center, Copenhagen Business School, Frederiksberg, Denmark, 48 pp.
Wong, P., 2010, Portfolio Budget Statements 2010-11: Budget-Related Paper No. 1.4: Climate Change and Energy Efficiency Portfolio, Commonwealth of Australia, Canberra, 72 pp.
World Bank, 2009, State and Trends of the Carbon Market, Washington DC, obtainable from http://siteresources.worldbank.org/INTCARBONFINANCE/Resources/State___Trends_of_the_Carbon_Market_2009-FINAL_26_May09.pdf.
World Bank, 2011, Gross Domestic Product 2009, World Development Indicators Database, obtainable from http://siteresources.worldbank.org/DATASTATISTICS/Resources/GDP.pdf.