Irrigation Efficiency Improvements: Technical, Economic, and Policy Issues NM Geological Society NM...
41
Irrigation Efficiency Improvements: Technical, Economic, and Policy Issues NM Geological Society NM Tech University, Socorro Frank A. Ward NMSU ACES April 12, 2013
-
Upload
percival-greene -
Category
Documents
-
view
215 -
download
0
Transcript of Irrigation Efficiency Improvements: Technical, Economic, and Policy Issues NM Geological Society NM...

Irrigation Efficiency Improvements: Technical,
Economic, and Policy Issues
NM Geological Society NM Tech University, Socorro
Frank A. WardNMSU ACES
April 12, 2013

2
• Climate Change: more floods/droughts, greater conflict potential in dry places like NM
• Continued population growth• Growing values of shrinking key ecological assets• Growing values of treated urban water (pop +
econ)• Irrigated ag consumes 85-90% of water in NM• Ongoing search for ways to conserve water in
irrigated agriculture– technology (drip, sprinkler, water saving crops)– policy (subsidies, regulations, pricing,
… )– Projects (infrastructure, leveling, … )
Background

History of Water Use in Rio Grande• Why that history is important
– Uncover long term water supply trends– Discover lessons for drought adaptation
• Data sources– Stream gauges since late 1800s (into and out of NM)– Long term historic tree ring analysis – Water delivery records of cities, towns, and other water
suppliers (e.g., Santa Fe, Albuquerque, LC).– Historic farm production, yield, acreage– History Books (2 better-known)
• Great River: The Rio Grande in NA History (P. Horgan, 1984)• Water in NM, A History of its Mgmt, Use (I. Clarke, 1987)
3

Historic RG Flows into NM (k-af/yr)USGS Stream Gauge Data – 3 hws
• Rio Grande at Del Norte (CO) – Flows = 657.93 – 109.17 post 2000 – 1891-2010 (110 years)
• Conejos River at Mogote (CO)– Flows = 238.59 – 49.16 post 2000– 1899-2010 (101 years)
• Rio Chama at Chamita (NM)– Flows = 438.14 –99.05 post 2000– 1970 – 2010 (41 years) 4
5
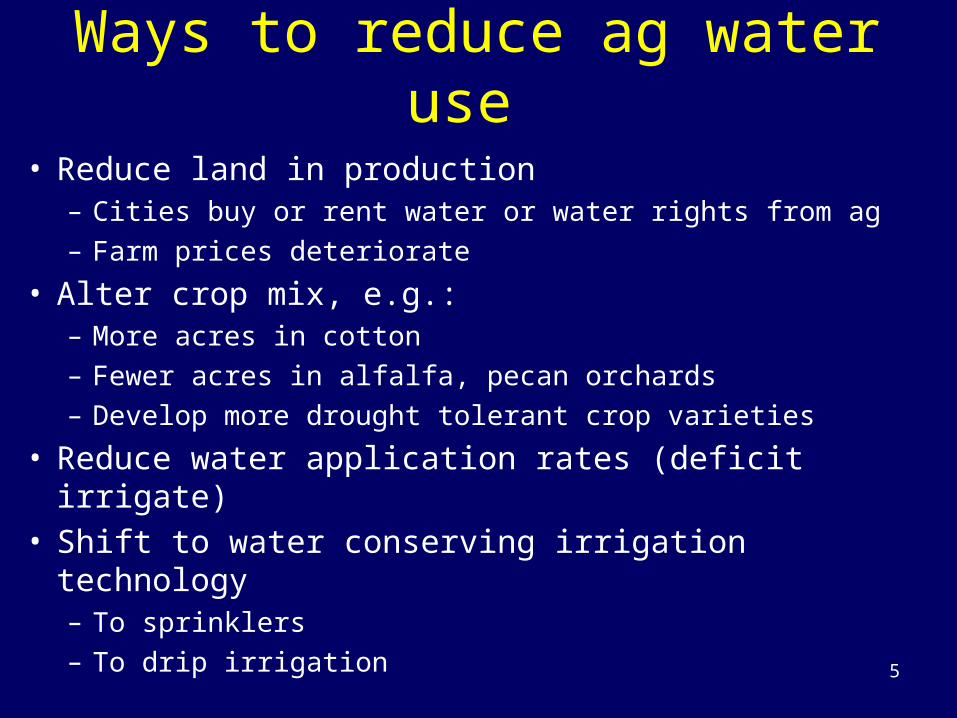
Ways to reduce ag water use
• Reduce land in production– Cities buy or rent water or water rights from ag– Farm prices deteriorate
• Alter crop mix, e.g.:– More acres in cotton– Fewer acres in alfalfa, pecan orchards– Develop more drought tolerant crop varieties
• Reduce water application rates (deficit irrigate)• Shift to water conserving irrigation technology
– To sprinklers– To drip irrigation
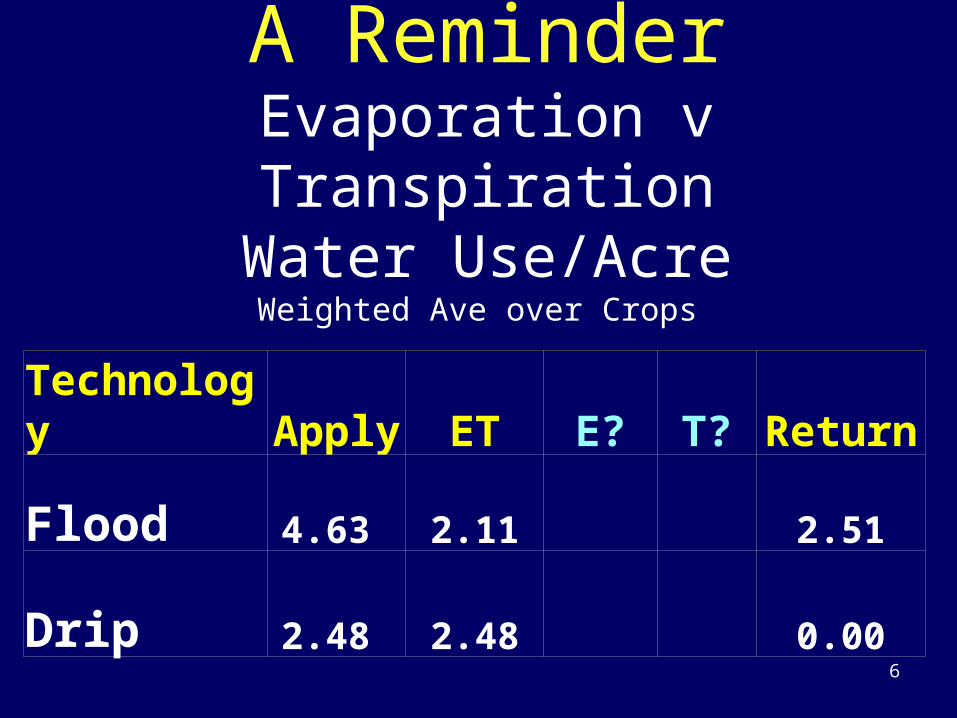
A ReminderEvaporation v Transpiration
Water Use/AcreWeighted Ave over Crops
6
Technology
Apply ET E? T? Return
Flood 4.63 2.11 2.51
Drip 2.48 2.48 0.00
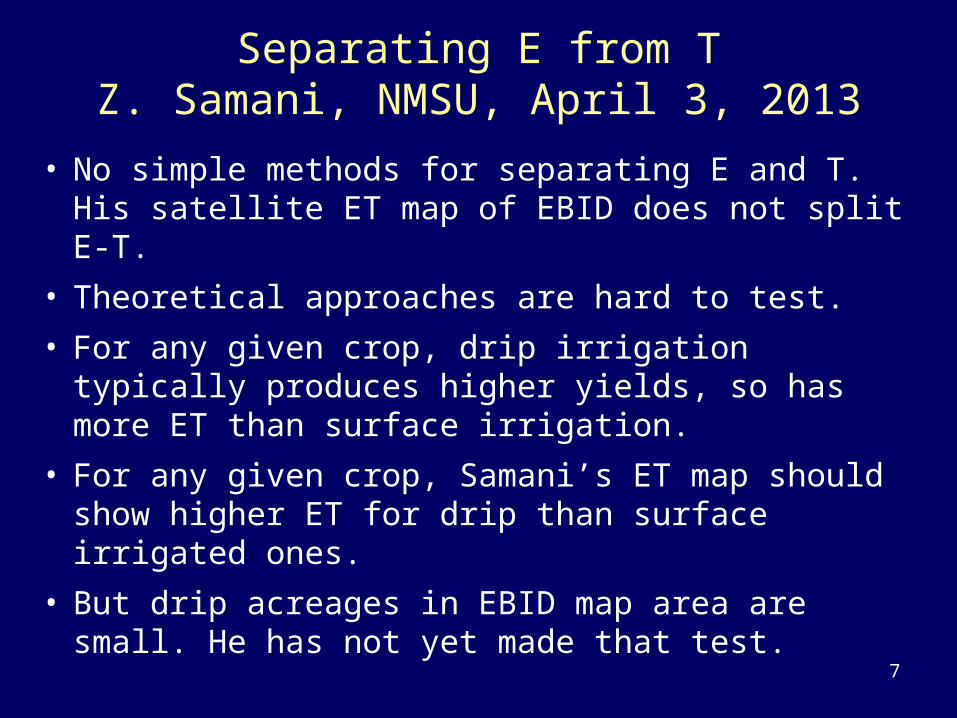
Separating E from TZ. Samani, NMSU, April 3, 2013
• No simple methods for separating E and T. His satellite ET map of EBID does not split E-T.
• Theoretical approaches are hard to test. • For any given crop, drip irrigation typically produces
higher yields, so has more ET than surface irrigation. • For any given crop, Samani’s ET map should show
higher ET for drip than surface irrigated ones. • But drip acreages in EBID map area are small. He has
not yet made that test.
7

8
Gaps• Little work in NM (or elsewhere) explaining
what affects irrigation water savings that integrates
– Farm economics: profitability
– Farm hydrology: water application
– Agronomy: yields by crop
– Basin hydrology: net water depletions
– Basin institutions: protect senior water rights
• Big gap in NM and elsewhere
9
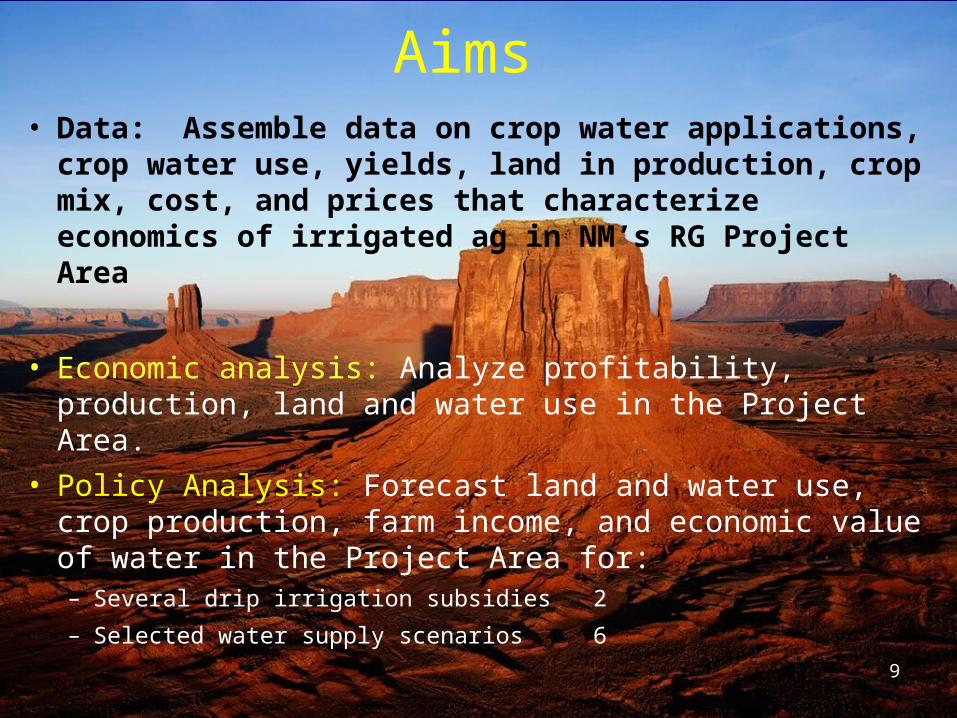
Aims• Data: Assemble data on crop water
applications, crop water use, yields, land in production, crop mix, cost, and prices that characterize economics of irrigated ag in NM’s RG Project Area
• Economic analysis: Analyze profitability, production, land and water use in the Project Area.
• Policy Analysis: Forecast land and water use, crop production, farm income, and economic value of water in the Project Area for:– Several drip irrigation subsidies 2
– Selected water supply scenarios 6

10
Study Region: Elephant Butte Irrigation District
• http://www.ebid-nm.org/

0
5,000
10,000
15,000
20,000
25,000
30,000
35,000
40,000
45,000
50,000
55,000
60,000
65,000
70,000
75,000
80,000
85,000
90,000
95,000
1953
1955
1957
1959
1961
1963
1965
1967
1969
1971
1973
1975
1977
1979
1981
1983
1985
1987
1989
1991
1993
1995
1997
1999
2001
2003
Acreage
Not Ordering
Misc
Grain, Hay, Forage
Vegetables
Cotton
Alfalfa
Pecans
EBID recent history (acreage)
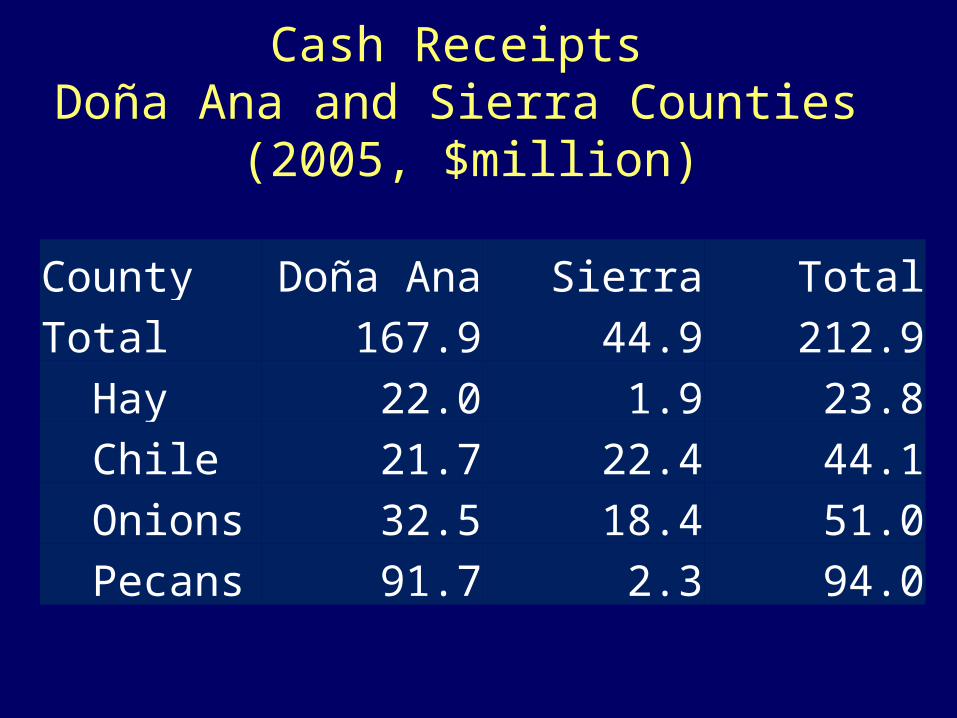
Cash Receipts Doña Ana and Sierra Counties
(2005, $million)
County Doña Ana Sierra TotalTotal 167.9 44.9 212.9 Hay 22.0 1.9 23.8 Chile 21.7 22.4 44.1 Onions 32.5 18.4 51.0 Pecans 91.7 2.3 94.0

13
Approach
• Analyze water conservation subsidies that reduces capital cost to convert from surface to drip. – Public policy: Taxpayer $ to reduce the
costs of drip irrigation conversion– Private effect: Makes it cheaper to convert
• Integrates farm economics and basin hydrology

14
Farm Level Economics• NMSU Farm costs and returns
• Published by NM county, year, crop, and irrigation technology
• Web -- http://aces.nmsu.edu/cropcosts/
• Our analysis: Assumes growers maximize income while limited by water allocations, land, and available crop choices
15
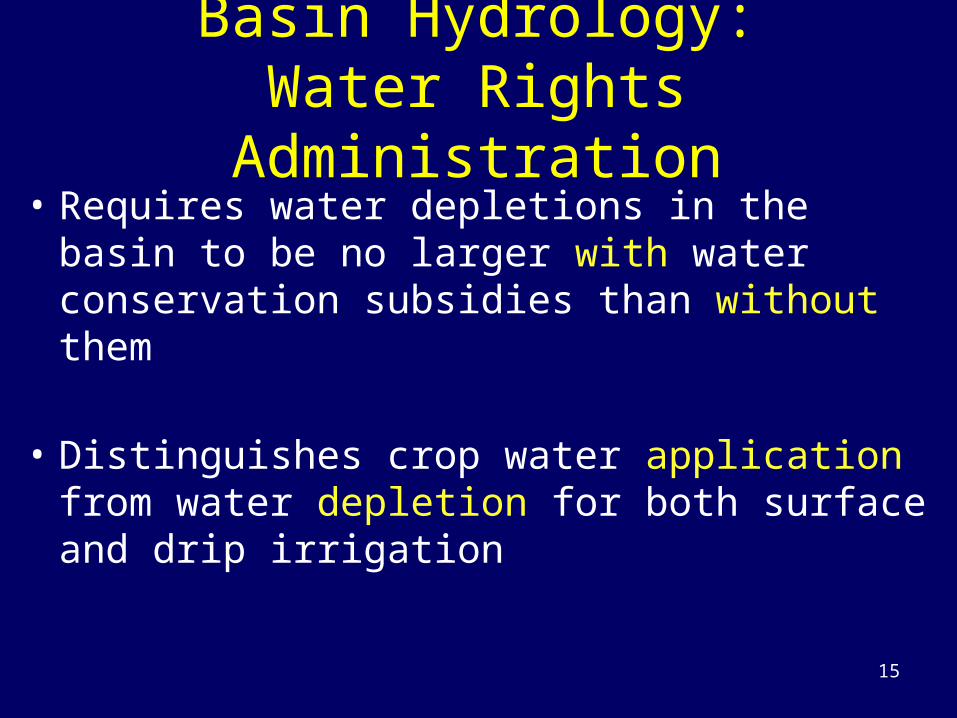
Basin Hydrology:Water Rights Administration
• Requires water depletions in the basin to be no larger with water conservation subsidies than without them
• Distinguishes crop water application from water depletion for both surface and drip irrigation

Pecans, drip irrigated
16

Pecans, surface irrigated
17

Pecans: Drip or Surface Irrigated
18

19
Farm Economics• Drip compared to surface irrigation
– Drip: better applies quantity and timing of water that the plant needs for max yields
– Drip: higher yields (higher ET)– Drip: reduces water applied– Drip: conversion costs are high
• Farmers need economic advantage to convert from surface to drip irrigation.– Growers convert not to conserve water, but for
income– At low water prices the economic advantage of
converting typically is weak or negative– Yield gain must be very large

20
Cost of Converting:Surface to Drip Irrigation
• Conversion Capital Costs: – About $1500 / ha for 10 year life– About $150 / ha per year
• Conversion is a major investment, so for the conversion to increase income:– Yield gain must be high – or– $ Value of saved water must be high

21
Basin Hydrology
• NM water administration (NMOSE) is charged to protect existing water rights
• This means
– Applications / acre fall with drip irrigation– Depletions cannot increase– For a given crop, yields are higher under
drip than under surface irrigation – Higher yields consume higher ET

22
• Basin-wide Evapotranspiration mapping
• Demand forecasting, water operations support
• Depletion changes with:– Management options
– Changing crops
– Drought cycles
• Informs sustainable water management
EBID Remote Sensing: NMSU

• Maximize– Objective: Farm Economic Returns
• Subject to – Constraints
•Hydrologic•Agronomic•Institutional
23
Our Empirical Analysis of NM Ag Water Conservation

Policy Assessment Approach
24
Data
Headwater supplies
Law of the River
Crop pricesCrop costsWater priceLand supply
Outcomes
Crop prodn
Crop ET
Crop Mix
Water Use
Water Saved
Farm Income
NPV
Baseline: no new policy
Alternative : Various drip irrigation subsidies
Policy

25
Ag Water Balance
26
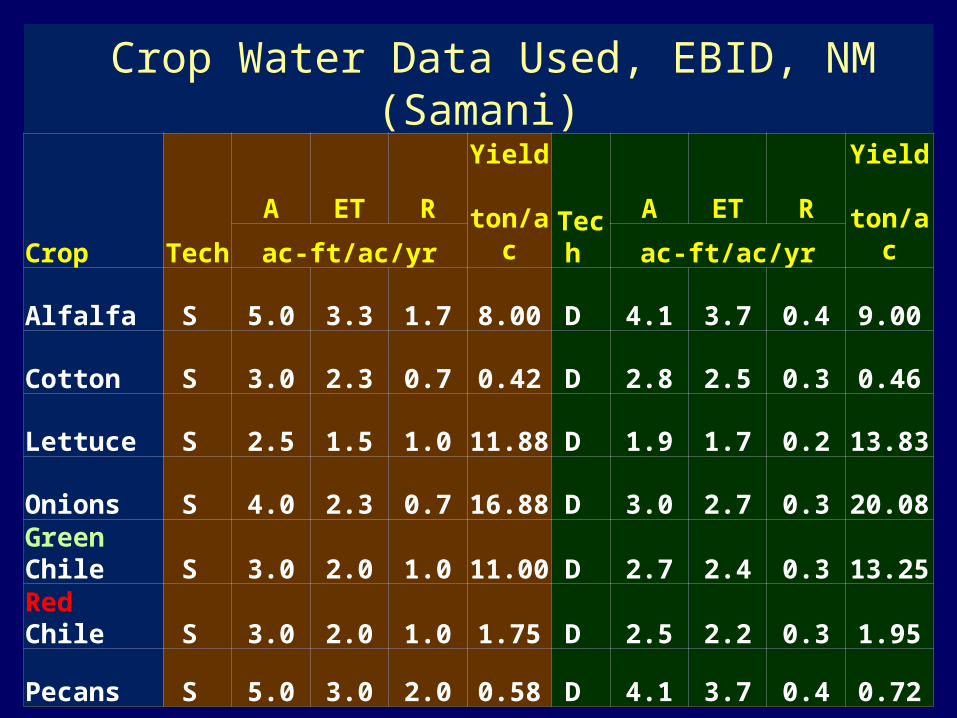
Crop Water Data Used, EBID, NM (Samani)
Crop Tech
A ET RYield
ton/acTech
A ET RYield
ton/acac-ft/ac/yr ac-ft/ac/yr
Alfalfa S 5.0 3.3 1.7 8.00 D 4.1 3.7 0.4 9.00
Cotton S 3.0 2.3 0.7 0.42 D 2.8 2.5 0.3 0.46
Lettuce S 2.5 1.5 1.0 11.88 D 1.9 1.7 0.2 13.83
Onions S 4.0 2.3 0.7 16.88 D 3.0 2.7 0.3 20.08
Green Chile S 3.0 2.0 1.0 11.00 D 2.7 2.4 0.3 13.25
Red Chile S 3.0 2.0 1.0 1.75 D 2.5 2.2 0.3 1.95
Pecans S 5.0 3.0 2.0 0.58 D 4.1 3.7 0.4 0.72

NM Pecans: Water BalanceTotal ET: higher with drip
27
Drip 5’
3.0’
2.0’
Surface
4.1’ 3.7’
0.4Return to system Return to system

28
Under the Hood

29
Max Irrigation Income
[ * ]uckt ct uckt uckt ucktInc P Yield Cost L
(1 )
( . )
ucktt
u c k t u
IncNPV Income
r
u location
c crop
k irrig tech surface v drip
t year
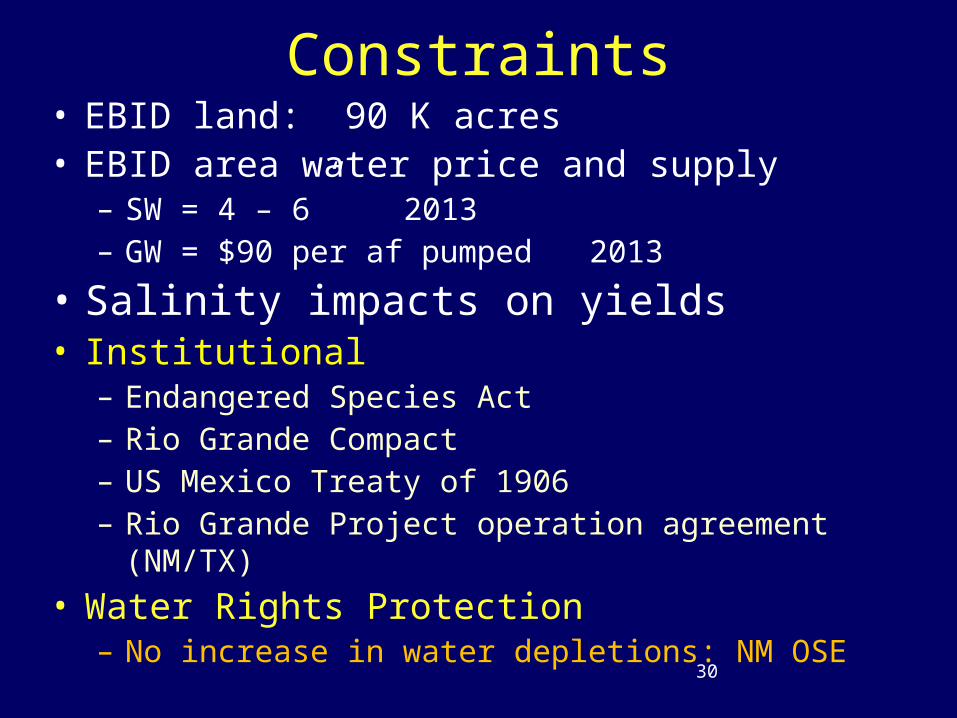
• EBID land: 90 K acres • EBID area water price and supply
– SW = 4 – 6” 2013– GW = $90 per af pumped 2013
• Salinity impacts on yields• Institutional
– Endangered Species Act– Rio Grande Compact– US Mexico Treaty of 1906– Rio Grande Project operation agreement
(NM/TX)
• Water Rights Protection– No increase in water depletions: NM OSE30
Constraints

•Ag Water Use and Water Savings– 0 pct drip conversion subsidy– 100 pct drip conversion subsidy
31
Results
32
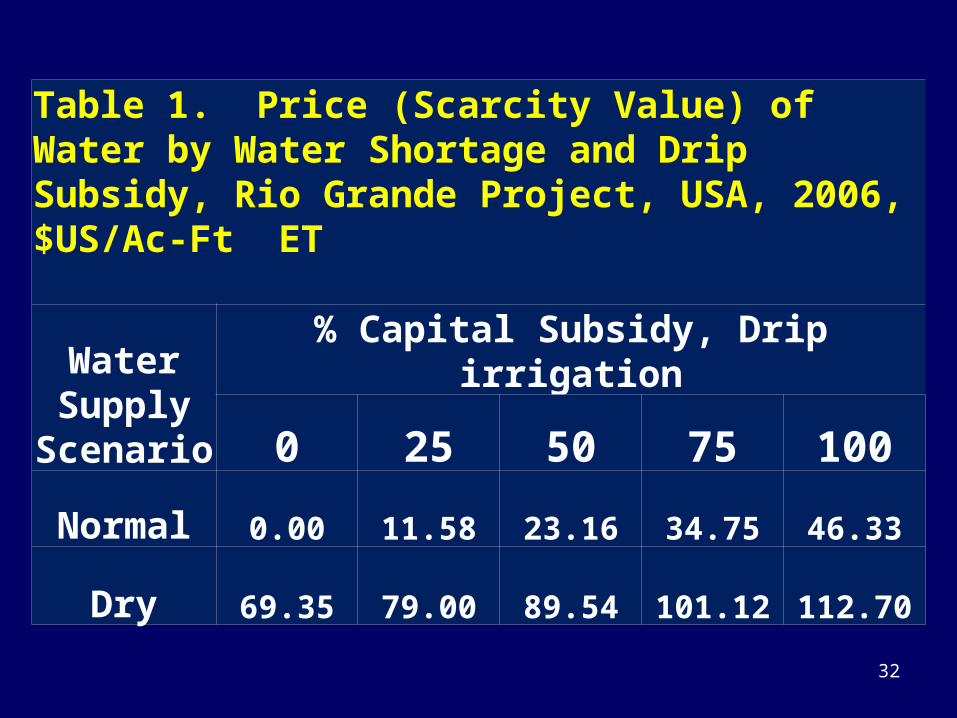
Table 1. Price (Scarcity Value) of Water by Water Shortage and Drip Subsidy, Rio Grande Project, USA, 2006, $US/Ac-Ft ET
Water Supply
Scenario
% Capital Subsidy, Drip irrigation
0 25 50 75 100
Normal 0.00 11.58 23.16 34.75 46.33
Dry 69.35 79.00 89.54 101.12 112.70

33
Table 5. Total Water Applied by Technology and Subsidy Rio Grande Basin, NM, USA, 2006, ac-ft / yr
TechWater Supply
% Capital Subsidy, Drip
0 25 50 75 100
Total all Crops
Surface normal 251,394 245,003 238,612 232,221 225,830
dry 211,384 205,992 200,026 193,635 187,244
drip normal 12,214 15,169 18,124 21,079 24,034
dry 5,320 7,814 10,572 13,527 16,482
Total Water Applied normal 263,608 260,172 256,736 253,300 249,864
dry 216,705 213,806 210,598 207,162 203,726 Water Conserved
(Reduced Applications ref: no subsidy)
normal 0 3,436 6,872 10,308 13,744
dry 0 2,899 6,107 9,543 12,979
34
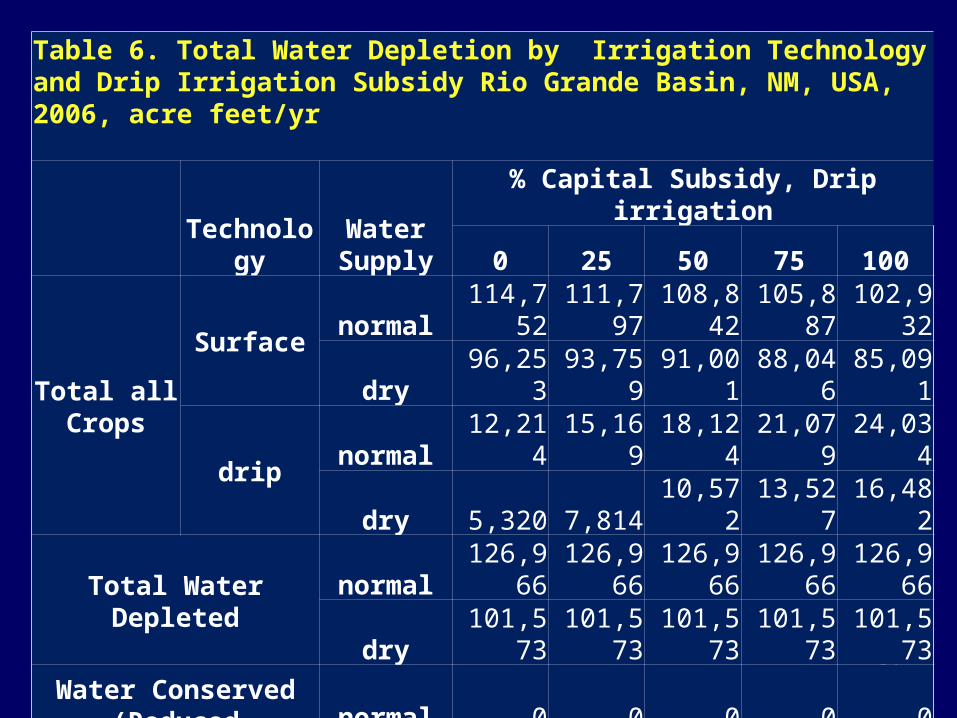
Table 6. Total Water Depletion by Irrigation Technology and Drip Irrigation Subsidy Rio Grande Basin, NM, USA, 2006, acre feet/yr
TechnologyWater Supply
% Capital Subsidy, Drip irrigation
0 25 50 75 100
Total all Crops
Surfacenormal 114,752 111,797 108,842 105,887 102,932
dry 96,253 93,759 91,001 88,046 85,091
dripnormal 12,214 15,169 18,124 21,079 24,034
dry 5,320 7,814 10,572 13,527 16,482
Total Water Depletednormal 126,966 126,966 126,966 126,966 126,966
dry 101,573 101,573 101,573 101,573 101,573
Water Conserved (Reduced Depletions
Ref: No Subsidy)
normal 0 0 0 0 0
dry 0 0 0 0 0

35
Lessons Learned - drought
• Irrigators invest in water-saving technologies when faced with lower costs for converting from surface to drip.
• Drip irrigation subsidies farm income, crop yields, value of food production, and crop water applications.
• However, by raising crop yields and raising crop water ET, drip irrigation subsidies put upward pressure on water depletions.
• Where water rights exist, authorities need to guard against depletions with growing subsidies that reduce water applications.
• In the RG Project Area, a 100% subsidy of the cost of converting from surface to drip irrigation raises the economic value of water from $___ to $___ per acre foot depleted in year 2013 with 20% of full surface supplies.

36
Research Questions• Ag water use and conservation: hard to
– define – measure – forecast – evaluate– change
• Need better measurement of water use by field, farm, district, basin (accounting)
• What policies motivate growers to reduce ag water depletions?

37
Research Questions
• How will adjudication of NM’s streams help ag water conservation and make more water for urban and environmental uses?
• How will climate warming affect best policies to promote ag water conservation?
38
Research Questions• What policies would sustain NM’s aquifers affordably?
• What actions would reduce ag water use likely to occur?
– Without climate change
– With climate change that affects:• Yields
• Evaporation
• ET
• Supplies
– With high, medium, low future: • Prices
• Yields
• Costs

One research/policy question
• Cheapest way to reduce ag water use to supply water for other uses– Urban– Domestic– Key ecological assets– Energy
• In the face of– Recurrent Drought– Climate warming
39

Tentative answers• Better water measurement
– Gauges– Tracking use by crop (application, ET)
• Better water accounting– Current use patterns– Potential use patterns
• Adjudications– Who has the senior/junior rights in the
face of future supply variability. Important as drought/climate intensifies.
40

Thank you
http://agecon.nmsu.edu/fward/water