
IRENA REmap China Report 2014
116
November 2014 CHINA RENEWABLE ENERGY PROSPECTS:
description
China report
Transcript of IRENA REmap China Report 2014
November 2014
CHINARENEWABLE ENERGY PROSPECTS:

Copyright © IRENA 2014Unless otherwise indicated, material in this publication may be used freely, shared or reprinted, so long as IRENA is acknowledged as the source.
About IRENA
The International Renewable Energy Agency (IRENA) is an intergovernmental organisation that sup-ports countries in their transition to a sustainable energy future, and serves as the principal platform for international cooperation, a centre of excellence, and a repository of policy, technology, resource and financial knowledge on renewable energy. IRENA promotes the widespread adoption and sustainable use of all forms of renewable energy, including bioenergy, geothermal, hydropower, ocean, solar and wind energy, in the pursuit of sustainable development, energy access, energy security and low-carbon economic growth and prosperity.
Acknowledgements
The report has benefited from valuable comments and guidance provided by the National Energy Ad-ministration (Shi Lishan) and the China National Renewable Energy Centre (CNREC) (Wang Zhongying, Kaare Sandholt, Ren Dongming, Gao Hu, Zhao Yongqiang, Xuxuan Xie, Liu Jian). Additional external review was provided by Asia Europe Clean Energy (Solar) Advisory Co. (Frank Haugwitz), the China Renewable Energy Industry Association (CREIA) (Li Junfeng), the Energy Research Institute (Jiang Ke-jun, Yang Yufeng), Lawrence Berkeley National Laboratory (David Fridley) and Technical University of Denmark (Peggy Mischke). IRENA colleagues Rabia Ferroukhi, Diala Hawila, Ruud Kempener, Shunichi Nakada, Elizabeth Press and Frank Wouters also provided valuable comments. This report was also reviewed at the China REmap workshop in Beijing co-organised with CNREC on 15 July 2014, as well as the two-day China Solar PV Summit in Beijing co-organised with CREIA on 11-12 September 2014. Digby Lidstone was the technical editor of this report.
IRENA is grateful for the generous support of the Chinese and German governments, which made the publication of this report a reality.
Authors:Dolf Gielen (IRENA), Deger Saygin (IRENA), Nicholas Wagner (IRENA) and Yong Chen (IRENA). Special thanks are due to Sven Teske.
For further information or to provide feedback, please contact the REmap team. E-mail: [email protected]
Report citation
IRENA (2014), Renewable Energy Prospects: China, REmap 2030 analysis. IRENA, Abu Dhabi. www.irena.org/remap
Disclaimer
While this publication promotes the adoption and use of renewable energy, IRENA does not endorse any particular project, product or service provider.
The designations employed and the presentation of materials herein do not imply the expression of any opinion whatsoever on the part of the IRENA concerning the legal status of any country, territory city or area or of its authorities, or concerning their authorities or the delimitation of their frontiers or boundaries.

Renewable Energy Prospects: China
REmap 2030 analysis
November 2014


REmap 2030 – the global roadmap prepared by the International Renewable Energy Agency (IRENA) – assesses how countries can work together to double the share of renewable energy in the global energy mix by 2030. It represents an unprecedented international effort that brings together the work of more than 90 national experts in nearly 60 countries, who continue to collaborate through global web discussions, regional meetings and national workshops involving technology experts, industry bodies and policy makers. Following the global REmap report released in January 2014, IRENA is producing a series of country-specific reports built on the same detailed analyses.
As the largest energy consumer in the world, China must play a pivotal role in the global transition to a sustainable energy future in an increasingly ‘carbon-constrained’ world. The country is already a global leader in renewable energy, with massive potential to harness a diverse range of renewable sources and technologies, both for power generation and for end-use sectors.
Compared to energy systems based on fossil fuel, renewable energy offers broader participation, enhances energy security, creates more jobs and provides an effective route to reducing atmospheric pollution and carbon dioxide (CO2) emissions – a goal that becomes increasingly urgent by the day. Renewable energy technologies now provide the most cost-effective option for delivery of energy services in a growing range of locations and conditions, while innovation and increasing deployment continue to drive costs down even more.
Under current policies and investment patterns, the share of renewables in China’s energy mix is projected to only reach 17% by 2030 compared to 13% in 2010. REmap analysis, however, shows that the country could realistically achieve scaling up modern renewables to 26%. The required investment of USD 145 billion could potentially save China more than USD 200 billion, factoring in the benefits of improved health and lower CO2 emissions.
While countries must make energy decisions based on their own circumstances, each decision needs to be based upon the most comprehensive and transparent data available. China has demonstrated that it possesses the technical and human resources, as well as the dynamism, to spearhead a transformation of global energy use. REmap 2030 suggests concrete pathways to be considered to meet this generational challenge: to attain a clean and secure energy system in China and for the world.
Adnan Z. Amin
Director-General
International Renewable Energy Agency
FOREWORD

Renewable Energy Prospects: Chinavi

Renewable Energy Prospects: China vi i
CONTENTS
FOREWORD ..................................................................................................................................................................................... IIILIST OF FIGURES ..........................................................................................................................................................................VIILIST OF TABLES........................................................................................................................................................................... VIIILIST OF BOXES ............................................................................................................................................................................... IX
EXECUTIVE SUMMARY ...................................................................................................................................................................1
HIGHLIGHTS ........................................................................................................................................................................................1
1 INTRODUCTION .........................................................................................................................................................................5
2 METHODOLOGY AND DATA SOURCES ...........................................................................................................................7
3 RECENT TRENDS FOR RENEWABLE ENERGY AND THE PRESENT ENERGY SITUATION ......................10
3.1 Status of renewable energy development ...........................................................................................................103.2 Base year renewable energy situation ................................................................................................................... 15
4 REFERENCE CASE DEVELOPMENTS TO 2030 ...........................................................................................................31
5 CURRENT POLICY FRAMEWORK ...................................................................................................................................34
5.1 Airborne Pollution Prevention and Control Action Plan ................................................................................345.2 Renewable energy policy of China .........................................................................................................................365.3 Transport sector related policies ............................................................................................................................ 405.4 Solar water heating policy for buildings ...............................................................................................................415.5 Industrial policies for renewable energy ...............................................................................................................415.6 Carbon policy ..................................................................................................................................................................435.7 Electricity pricing ...........................................................................................................................................................45
6 RENEWABLES POTENTIALS..............................................................................................................................................47
7 REMAP OPTIONS ....................................................................................................................................................................49
7.1 Renewable energy technologies .............................................................................................................................507.2 Roadmap table and implications for renewable energy ............................................................................... 527.3 Renewable energy technology cost projections ..............................................................................................587.4 Summary of REmap Options: cost-supply curves .......................................................................................... 607.5 Discussion of REmap 2030 Options ......................................................................................................................67
8 BARRIERS AND OPPORTUNITIES FOR RENEWABLE ENERGY TRANSITION ............................................. 73
8.1 Barriers and opportunities in the power sector ................................................................................................ 738.2 Power market reform ...................................................................................................................................................768.3 Barriers and opportunities in end-use sectors ..................................................................................................76
9 SUGGESTIONS FOR ACCELERATED RENEWABLE ENERGY UPTAKE ............................................................78
REFERENCES ..................................................................................................................................................................................80
LIST OF ABBREVIATIONS .........................................................................................................................................................87

Renewable Energy Prospects: Chinavi i i
ANNEX A: ........................................................................................................................................................................................89
Technology cost and performance data assumptions .............................................................................................89
ANNEX B: ...........................................................................................................................................................................................91
Energy price assumptions ....................................................................................................................................................91
ANNEX C: ........................................................................................................................................................................................92
Details of REmap cost methodology ...............................................................................................................................92
ANNEX D: ........................................................................................................................................................................................93
Reference Case ........................................................................................................................................................................93
ANNEX E: .........................................................................................................................................................................................94
Data for cost-supply curve, from the business perspective and the government perspective ..............94
ANNEX F: ..........................................................................................................................................................................................96
Levelised costs of renewable and conventional technologies in end-use sectors in 2030 .......................96
ANNEX G: ........................................................................................................................................................................................97
Resource maps .........................................................................................................................................................................97
ANNEX H: ........................................................................................................................................................................................98
Detailed roadmap table ........................................................................................................................................................98
ANNEX I: .........................................................................................................................................................................................100
Traditional use of biomass in China ................................................................................................................................100

Renewable Energy Prospects: China ix
List of Figures
Figure 1: Contribution of individual countries to total global renewable energy use in REmap 2030 .......... 6
Figure 2: Cumulative renewable power plant capacity in China .................................................................................. 11
Figure 3: China wind power capacity growth, 2008-2013 ............................................................................................. 12
Figure 4: China TFEC breakdown, 2010 .................................................................................................................................16
Figure 5: Renewable power capacity and generation, 2012 .........................................................................................18
Figure 6: China coal, crude oil and natural gas production, 1990-2012 ....................................................................21
Figure 7: Installed capacity and peak load of State Grid Corporation of China ................................................... 27
Figure 8: Growth of the total primary energy supply in China, 1990-2030 ............................................................31
Figure 9: Reference Case power generation growth ...................................................................................................... 32
Figure 10: Reference Case growth of renewable energy in end-use sectors ........................................................ 32
Figure 11: China Reference Case – Renewable energy in TFEC ...................................................................................33
Figure 12: Interactions between renewable energy policy and renewable energy industrial policy ...........42
Figure 13: Expected average carbon price – China carbon trading ..........................................................................45
Figure 14: Primary biomass demand by sector with REmap Options, 2030 ..........................................................51
Figure 15: Increases in renewable energy consumption in TFEC by resource....................................................... 52
Figure 16: Breakdown of renewable energy use by application and sector, 2010 and REmap 2030 ..........53
Figure 17: Changes in total primary energy supply in REmap 2030 .........................................................................55
Figure 18: Power capacity by renewable energy technology ...................................................................................... 57
Figure 19: REmap Options cost supply curve, national, by resource ....................................................................... 60
Figure 20: REmap Options cost supply curve, national, by sector .............................................................................61
Figure 21: REmap Options cost supply curve, international, by resource ...............................................................62
Figure 22: REmap Options cost supply curve, international, by sector ...................................................................62
Figure 23: Renewable energy technology options in the cases of REmap 2030, REmap-E and REmap-U, 2030 ..........................................................................................................................................70
Figure 24: Comparison of REmap 2030 with the findings of other studies for power sector, 2030 ............71

Renewable Energy Prospects: Chinax
List of Tables
Table 1: Summary of biomass use in China based on different sources ..................................................................20
Table 2: Largest pellet mills in China ......................................................................................................................................22
Table 3: Five largest ethanol plants in China ......................................................................................................................23
Table 4: Regional power generation capacities and peak demand of the State Grid Corporation of China ...........................................................................................................................26
Table 5: Installed and under construction pumped hydroelectricity ........................................................................29
Table 6: Operating performance of pumped hydro plants, 2008 and 2012 ..........................................................29
Table 7: China’s three stage smart grid plan .......................................................................................................................30
Table 8: China’s estimated annual CO2 reductions from strong, smart grid ..........................................................30
Table 9: Renewable energy targets overview ....................................................................................................................38
Table 10: Overview of the current feed-in-tariffs in China by technology and resource ..................................39
Table 11: Overview of carbon trading systems in seven provinces of China...........................................................44
Table 12: China’s ETS pilots and performance ....................................................................................................................44
Table 13: Renewable energy resource potentials of China ............................................................................................47
Table 14: Breakdown of total biomass supply in 2030....................................................................................................48
Table 15: Breakdown of renewable energy share by sector .........................................................................................54
Table 16: China REmap 2030 overview .................................................................................................................................55
Table 17: Comparison of LCOE for power sector technologies ...................................................................................58
Table 18: Overview of the average cost of substitution of REmap Options for the China ...............................63
Table 19: Development of China CO2 emissions, 2010-2030 ........................................................................................65
Table 20: Financial indicators of REmap Options, based on government perspective ....................................66

Renewable Energy Prospects: China xi
List of Boxes
Box 1: Rural grids and mini-grids .............................................................................................................................................28
Box 2: Implications of changes in coal-based power production on water demand .........................................35
Box 3: Renewable energy targets in China ......................................................................................................................... 37
Box 4: Distributed solar PV in China and new policy developments ....................................................................... 40
Box 5: China s “push & pull” strategy to expand the renewable energy industry...............................................42
Box 6: Inner Mongolia case study: The need for connection ....................................................................................... 74

Renewable Energy Prospects: Chinaxi i

Renewable Energy Prospects: China 1
The case for renewable energy in China
China’s energy policy matters globally. The country is the world’s largest energy user, accounting for one fifth of all global energy consumption. By 2030, China’s energy consumption is expected to increase by 60%. China’s energy choices will be a major influence on the world’s ability to curb climate change.
There are rising concerns over energy security. As of 2014, about 30% of China’s natural gas supply is imported, but this could increase substantially. China imports more than half of its crude oil supply, and this will also increase. Shale gas was considered as an alter-native, but local exploration proved challenging. Until recently, China has been meeting most of its energy demand with coal. However, growing concerns over the environmental impacts of coal (severe air pollution that caused 1.2 million premature deaths in 2010, high
water consumption compounding water scarcity) have prompted a shift in policy.
As a result, China is turning to renewable energy. It already has the world’s largest installed capacity of wind and hydroelectric power, as well as the vast majority of solar heating and biogas installations. In 2013 China installed more solar photovoltaic (PV) capacity than the whole of Europe.
This strategy is bringing substantial economic returns. China has become a major exporter of renewable energy technology, accounting for two-thirds of global solar PV module production. Its renewable energy sector employed 2.6 million people in 2013. And it has the financial ability to invest further.
Under a business-as-usual scenario, China could fall far short of its full renewable energy potential. However, given the implementation of the right mix of policies,
EXECUTIVE SUMMARY
HIGHLIGHTS ● China has become a global leader in renewable en-
ergy. It has vast resources and great potential for future development. In 2013, China installed more new renewable energy capacity than all of Europe and the rest of the Asia Pacific region.
● The main drivers for this shift are the increasing cost-competitiveness of renewable energy tech-nologies and other benefits such as improved energy security and decreased air pollution.
● The share of renewables in China’s energy mix was 13% in 2010, including an estimated 6% tradi-tional use of biomass, and 7% modern renewables. Hydroelectricity (3.4%) and solar thermal (1.5%) accounted for most of China’s modern renewable energy use.
● Under current policies and investment patterns, the share of modern renewables in China’s energy mix will rise to 16% by 2030. REmap 2030 esti-mates that it would be both technically and eco-nomically feasible to increase the share of modern renewables to 26%.
● Reaching a 26% share for modern renewable en-ergy would require investments of USD 145 billion per year between 2014 and 2030. Accounting for improved health and reduced carbon dioxide (CO2) emissions, renewables would bring savings of between USD 55 and USD 228 billion per year to China’s economy.
● Under REmap 2030, the share of renewables in the power sector would increase from 20% to nearly 40% by 2030. This assumes accelerated growth in wind and solar PV, and full deployment of hydroelectricity. To achieve this requires significant growth in grid and transmission capacity, and power market reform.
● Significant potential exists for renewable energy in end-use sectors. Industry can achieve a 10% renewable energy share, compared to almost none at present. The building sector can transform its fuel mix to two-thirds renewables. Solar thermal heat and electrification can help, as can modern biomass for process heating and space/water heating.

Renewable Energy Prospects: China2
the country has the resources and the dynamism to lead a transformation of the global energy system.
REmap 2030: China’s renewable potentialREmap 2030 shows how the share of renewable en-ergy in the global energy mix can be doubled by 2030. China’s role is crucial for it to succeed.
Using projections from the Chinese Renewable Energy Centre (CNREC), IRENA calculates that the share of modern renewables (which excludes traditional uses of biomass) in China’s energy mix will rise from about 7% in 2010 to 16% by 2030 under the business-as-usual scenario (the Reference Case in this study).
Under REmap 2030, however, with the right policies and support, the share of renewables in the energy mix could quadruple to 26% with technologies currently available. That would make China the world’s largest user of renewable energy, accounting for about 20% of global use. Hydroelectricity, wind power, solar PV, solar thermal and modern biomass would constitute most of the renewable energy mix of the country.
A strategy for a diverse mix of renewables in the power sectorChina has massive potential to harness renewable ener-gy for power. Currently, 20% of the country’s electricity comes from renewables. Under the business-as-usual scenario, this rises to 30% in 2030. With REmap 2030 options, it approaches 40%. Hydroelectricity would be the largest type, as is the case today, but wind and solar PV would see the largest growth and would play an es-sential role.
Hydro: China’s hydroelectricity potential by 2030 is 400 gigawatts-electric (GWe). Already envisaged in the business-as-usual scenario, this will require significant cross-boundary coordination, as well as enhanced river and water management. Total pumped hydro capacity, crucial for energy storage, should reach 100 GWe.
Wind: Wind became China’s second largest source of renewable power in 2013 and has potential to grow further. The best wind resources are found in the north-west and northeast. REmap 2030 envisages a fivefold increase in onshore wind capacity, from 91 GWe in 2013
to 500 GWe by 2030 (twice the current installed capac-ity worldwide) and an additional 60 GWe capacity in offshore wind. For this to occur, the realisable resource potential by 2030 in northern China would need to be deployed, and the early retirement of some coal capac-ity would be necessary (mainly in western China). New grid and transmission capacity (including 100 new DC power lines) will be needed to link wind power with demand in southern and eastern China.
Solar PV: China installed 13 GWe of solar PV capacity in 2013, a substantial increase which resulted in a total installed capacity of 20 GWe. 1 GWe came from distributed projects, such as rooftop solar PV on residential or commercial buildings. China aims to raise the total to 70 GWe by 2017, with equal contributions from utility-scale and distributed projects. REmap 2030 envisages a total installed capacity of 308 GW by 2030e which is twice the current installed capacity worldwide. Nearly 40% of this would be distributed.
Challenges and solutions:
— Costs and externalities: Wind and solar PV cannot compete with the low cost of coal power generation, based on today’s market prices. They do become cost-competitive, however, when accounting for coal’s significant externalities, such as air pollution and its impact on human health. China would need a nationwide price of about USD 50 per tonne of carbon dioxide (CO2) to raise the cost of coal power generation sufficiently to make distributed solar PV cost-competitive. Prices closer to USD 25-30 per tonne CO2 would ensure that wind and solar PV could compete with coal at utility scale.
— Grids and transmission: Power generation from both utility scale solar PV and wind in China has been curtailed by a lack of sufficient grid infrastructure, and because coal power plants are given priority dispatching. This is improving as preferential policies for renewables are introduced. Grid and transmission capacity issues will gain more importance in the future, as an important share of China’s wind and solar PV will need to be built far from population centres. Better regional coordination is needed to create power exchange and new interconnectors between provinces, and power trading with neighbouring countries (e.g., hydroelectricity from Siberia and Southeast Asia, or wind from Mongolia.)

Renewable Energy Prospects: China 3
— Distributed solar PV offers another solution. For this to be successful, business models need to be developed that result in higher rates of return, uncertainties in ownership should be resolved, and capacity growth needs to be accelerated.
— Power market design and infrastructure planning: The current electricity grid is not designed to handle high shares of variable renewable power. In order to accommodate this, accelerated power market re-form will be needed, including establishing an elec-tricity retail market segment, which would not only encourage competition on electricity retail prices, but also innovation in creating business models for applications of distributed generation renewable electricity. In parallel, China should expand the study on its future grid, particularly incorporating smart technologies to cope with large-scale variable re-newables located in Northern and Western China, far away from the centers of the demand.
The role of biomass in the renewable energy transitionUnder REmap 2030, modern biomass would account for a quarter of all China’s renewable energy use, primarily for end-uses such as fuel and heating. Reaching this po-tential poses significant challenges for data collection, substituting modern for traditional use of biomass, and transport logistics.
Challenges and solutions: — Biomass feedstock: China has abundant biomass
resources, but utilising them sustainably and af-fordably will require carefully crafted policies. The main forms of biomass are straw (concentrated in the northeast and the lower Yangtze River) and fuel-wood (in the southeast and northeast). There is also potential from forestry residues. Transport of biomass feedstock from areas that are scattered across the country to specific centres of demand is a major challenge.
— Cooking/heating/power generation: Nearly all biomass today is used in traditional forms, i.e. for cooking. The share of the population that relies on traditional use of biomass is decreasing, and the use of modern cooking stoves is increasing. But the num-bers are uncertain, and data collection needs to im-prove to assess the challenge ahead. Power produc-tion from biomass and waste could account for 10% of the total renewable power generation by 2030.
— Industry: Biomass in Chinese industry is currently limited to pulp and paper making, and only in small amounts. By 2030, biomass and waste could ac-count for up to one-fifth of the process energy needed to produce clinker, one of the production processes that account for the largest share of en-ergy use in China’s manufacturing industry. Biomass could also be used in industrial combined heat and power (CHP) plants and heaters to generate process heat (e.g., steam), but would still meet less than 5% of the industry sector’s total fuel demand. To utilize these potentials from limited use today requires sig-nificant efforts from the industry sector.
— Transport: The government is promoting the pro-duction of advanced biofuels from sustainable feed-stocks. REmap 2030 envisages production rising from 2.5 billion to 37 billion litres. Already today around 200 million electric two and three-wheelers are on the road in China, by 2030 this could reach 500 million. The magnitude of growth in advanced biofuels production represents a challenge.
Renewable energy options other than biomass: Re-alising the biomass potential in REmap 2030 would require at least two-thirds of China’s total biomass sup-ply potential to be utilized. Solar thermal for heating and different forms of electric transport are renewable energy technology options other than biomass. China is a global leader in solar thermal, and could increase its installed capacity six-fold under REmap 2030: 30% in manufacturing, and 70% in residential and commercial buildings. Electric vehicles already carry hundreds of millions of passengers every year, and could meet up to 20% of projected car demand by 2030, and as China’s power system becomes more renewable, so will the electricity these technologies consume.
The cost of REmap 2030
The investment needed to achieve REmap 2030 would average USD 145 billion per year, between now and 2030. This is an increase of USD 54 billion per year in investments in renewable energy technologies over current projections.
REmap quantifies costs from two perspectives: those of businesses, and those of governments.
● From the business perspective, which includes end-user tax and subsidies, REmap Options could be deployed at an average incremental cost of USD 20.2

Renewable Energy Prospects: China4
per megawatt-hour (MWh), or USD 5.6 per gigajoule (GJ).
● From the government perspective, which excludes energy tax and subsidies, the cost would rise to USD 24.8 per MWh (USD 6.9 per GJ). This translates to a bottom line additional cost of USD 58 billion per year for the entire energy system.
● When externalities are taken into account, such as human health and CO2 emission reductions, REmap 2030 results in net savings of USD 55-228 billion per year.
Reducing CO2 emissions
China is the world’s largest emitter of CO2, driven by its use of coal. Its power and end-use sectors produce around 7 Gt of CO2 per year in 2012, and under business as usual scenario, this will grow by 50% by 2030. REmap 2030 shows that it is possible to limit this growth to 25% by substituting coal, mainly in the power sector.
However, even with the potential of renewables esti-mated in this study, China’s coal use by 2030 will be very similar to its current levels. China will need to continue to deploy renewables beyond 2030, and improve en-ergy efficiency in end-use sectors, in order to transition to a sustainable energy system.
If REmap Options were achieved worldwide, coupled with higher energy efficiency, atmospheric CO2 concen-tration would stay below 450 parts per million (ppm) of CO2 helping to prevent average global temperatures from rising more than two degrees Celsius above pre-industrial levels.
Policy needs
REmap 2030 provides several recommendations to accelerate the transition to renewable energy. They include:
Renewable energy policy:
● Develop a comprehensive national energy plan that accounts for the needed infrastructure for transmis-sion and distribution of electricity, heat and gas
● Introduce taxation, caps, and/or CO2 trading systems to account for the damage of CO2 emission and other air pollution from coal combustion
● Assess the socio-economic, energy security, health, land and water use impact of various technologies
● Set targets for renewables in manufacturing, build-ings and transport
Power supply system and market design:
● Establish the national power market, creating eco-nomic incentives for flexible operation, and bringing in new investors
● Develop the grid to better integrate renewable en-ergy, enhance trade and deal with variability
Technology focused policies:
● Enhance government support for innovation, re-search and development to reduce renewable en-ergy costs
● Support development of next-generation renewable energy technologies
● Improve knowledge and data collection on biomass and develop a working biomass feedstock market
China’s energy use has grown rapidly in recent years, and by 2030 it will increase by another 60%. In a business as usual scenario, the country will not only be the world’s largest energy consumer by far, but also emit over twice the quantity of CO2 of the next largest emitter. Without increased deployment of renewable energy, China’s energy system will continue to result in high levels of air pollution, negatively affecting health, economic growth and the environment. Without the diversification of its energy system and a transition towards renewable energy, the country will become increasingly reliant on imported fossil fuels, affecting its national energy security and economic growth.
China can choose a different path by accelerating the shift to renewable energy. There are challenges, including enhancing grid and transmission infrastructure, as well as biomass collection and logistics. These challenges can be overcome through effective planning and by creating mechanisms that value the external benefits of renewable energy. If China acts decisively to increase the role of renewables in its energy system, it can significantly reduce the pollution of its environment, enhance its energy security, benefit its economy and play a leading role in mitigating climate change.

Renewable Energy Prospects: China 5
1 INTRODUCTION
Renewable Energy Centre (CNREC) estimates, China’s share of modern renewables in the TFEC will grow from just 7% in 2010 to only 16% in 2030 (excluding traditional uses of biomass3).
China has significant potential to go beyond its Refer-ence Case if all the potential renewable energy tech-nologies identified in REmap are deployed in addition to the Reference Case (IRENA, 2014a). The deployment of technologies required to fill this gap are called the REmap Options. Given the size of the country, renew-able energy technologies and their related potentials vary by region and include geothermal, wind and vari-ous forms of solar and biomass. Annex G provides maps of the distribution of various energy sources and their potential.
This national potential is of global importance. Figure 1 provides a breakdown of total renewable energy use across the 26 countries that have developed REmap Options. Six of these countries account for three-quar-ters of the total additional renewable energy potential and more than half of the worldwide REmap Options. China has the largest renewable energy potential world-wide, accounting for 20% of the total global potential. The engagement of China is essential if the goal of doubling the share of global renewable energy use is to be achieved.
The objective of this report is to provide detailed back-ground data and the results of the China REmap country analysis, as well as to make suggestions as to how these results could be translated into action.
The report starts with a brief description of the REmap 2030 methodology (Section 2). It continues by explaining the present energy situation and recent trends for renewable energy use (Section 3). Section 4 provides details of the China Reference Case find-
3 Estimates for traditional uses of biomass vary widely depending on the source. For a detailed breakdown of the information available, see Section 3 and Annex I.
REmap 2030 is the global renewable energy roadmap of the International Renewable Energy Agency (IRENA) that shows how accelerated penetration of renewable energy in individual countries could contribute to dou-bling the share of renewables in the global energy mix by 2030.
Key factors in achieving a doubling are the use of biomass for heating, power generation and biofuels, as well as wind and solar technologies and greater elec-trification of the energy sector. Based on the analysis of 26 countries, REmap 2030 suggests that existing and future renewable energy expansion, as currently planned, will result in a 21% share of renewables world-wide in 2030 (IRENA, 2014a). This leaves a 15 percent-age-point gap to achieve the doubling – 36% renewable energy share in the global total final energy consump-tion (The World Bank, 2013).
REmap 2030 is the result of a collaborative process between IRENA, national REmap experts within the individual countries and other stakeholders. The cur-rent report focuses on the actual and potential role of renewable energy in China, a major energy producer and consumer, and a major contributor of carbon di-oxide (CO2) emissions. In 2010, China was the largest energy consumer in the world with a total final energy consumption (TFEC) of 57 exajoules (EJ) per year (or 1,950 million tonnes of coal equivalent, Mtce)1, equiva-lent to 18% of the global TFEC (IEA, 2012a).
China’s TFEC is projected to grow by 60% in the pe-riod between 2010 and 2030, according to the New Policies Scenario in the International Energy Agency’s World Energy Outlook (WEO) 2012 (IEA, 2012a)2. In the same time period, according to IEA and China National
1 1 tce is equivalent to 29.3 GJ. 1 EJ is equivalent to 109 GJ or 34.1 Mtce.
2 The Reference Case of China has been prepared based on the IEA’s WEO 2012 which projects 5% lower TFC compared with the IEA’s WEO 2013 projection of 103 EJ in 2030 (IEA, 2013a). However, the growth rates for 2010-2030 and 2011-2030 are similar in both projections, estimated at approximately 2.2% per year.

Renewable Energy Prospects: China6
ings – the business-as-usual. Section 5 discusses the current policy framework. Section 6 discusses the potential of different renewable energy resources in China. Section 7, the heart of the report, quantifies the REmap Options – the potential to go beyond the uptake of renewable energy sources outlined in the
Reference Case. This is followed by a discussion of the opportunities and barriers for renewable energy use in China (Section 8).
Section 9 provides policy recommendations for an accelerated renewable energy uptake for China.
Figure 1: Contribution of individual countries to total global renewable energy use in REmap 2030
Six countries (Brazil, China, India, Indonesia, Russia and the United States) account for half of global potential and 75% of the estimated scale-up through REmap Options in 26 countries
Rest of the World (traditional uses of biomass)
10%

Renewable Energy Prospects: China 7
2 METHODOLOGY AND DATA SOURCES
2030 is an exploratory study, not a target-setting ex-ercise.
The sources of the REmap Options for China originate from a range of research that includes:
● For power sector: CNREC estimates, historical trends, IEA China Wind Energy roadmap (IEA, 2011a) and IRENA renewable energy industry roadmap and its accompanying data were used (IRENA, 2014b)
● For transport sector: IRENA estimates were used ● For industry sector: a recent IRENA renewable
energy in industry roadmap (IRENA, 2014b) and its accompanying data was used
● For building sector: an internal analysis of Refer-ence Case developments and REmap Options was used in addition to the draft “Roadmap Research of China Solar Thermal Development” (Ruicheng, Tao and Xuan, 2014)
IRENA developed a REmap tool that allows staff and external experts to input data in an energy balance for 2010, 2020 and 2030, and then assess technology options that could be deployed by 2030 consistent with an accelerated deployment of renewable energy. In addition to what is provided in the Annexes of this report, a detailed list of these technologies and the related background data are provided online. The tool includes the cost (capital, operation and maintenance) and technical performance (reference capacity of installation, capacity factor and conversion efficiency) of renewable and conventional (fossil fuel, nuclear and traditional use of biomass) technologies for each sector analysed: industry, buildings, transport, power and district heat.
Each renewable energy technology is characterized by its costs and the cost of each REmap Option is represented by its substitution cost. Substitution costs are the difference between the annualised cost of the REmap Option and of a conventional technology used to produce the same amount of energy, divided by the total renewable energy use in final energy terms (in 2010 real US Dollar (USD) per gigajoule (GJ) of final re-
This section explains the REmap 2030 methodology and provides information about the background data used for the analysis of China. Annexes A-F provide the data and background assumptions in greater detail.
REmap is an analytical approach for assessing the gap between current national renewable energy plans, ad-ditional renewable technology options potentially avail-able in 2030 and Sustainable Energy for All’s (SE4All) objective of doubling the share of global renewable energy by 2030.
REmap 2030 assesses 26 countries: Australia, Brazil, Canada, China (in the present study), Denmark, Ec-uador, France, Germany, India, Indonesia, Italy, Japan, Malaysia, Mexico, Morocco, Nigeria, Russia, Saudi Ara-bia, South Africa, South Korea, Tonga, Turkey, Ukraine, the United Arab Emirates, the United Kingdom and the United States of America.
The analysis starts with national-level data covering both end-use (buildings, industry and transport) and the power and district heat sectors. Current national plans using 2010 as the base year of this analysis are the starting point4. The Reference Case represents poli-cies in place or under consideration, including energy efficiency improvements if they are contained in these projections. The Reference Case includes the TFEC of each end-use sector and the total generation of power and district heat sectors, with a breakdown by energy carrier for the period 2010–2030. The Reference Case for China was based on CNREC estimates and the IEA’s WEO 2012 New Policies Scenario. Where necessary, 2010 IEA energy balance for China has been updated with information originating from other national sources or own estimates. This was the case in particular for the traditional use of biomass in the residential sector.
Once the Reference Case was prepared, then additional technology options were identified. These are defined as REmap Options. The choice of an options approach instead of a scenarios approach is deliberate: REmap
4 To the extent data availability allows, information for more recent years (e.g., 2012, 2013) is provided where relevant.

Renewable Energy Prospects: China8
newable energy)5. This indicator provides a comparable metric for all renewable energy technologies identified in each sector.
Substitution costs are the key indicators for assessing the economic viability of REmap Options. They depend on the type of conventional technology substituted, energy prices and the characteristics of the REmap Option. The cost can be positive (incremental) or nega-tive (savings), as many renewable energy technologies are already or could be cost-effective compared with conventional technologies by 2030 as a result of tech-nological learning and economies of scale.
Based on the substitution cost and the potential of each REmap Option, country cost supply curves were developed from two perspectives for the year 2030: government and business. In the government perspec-tive, costs exclude energy taxes and subsidies, and a standard 10% discount rate was used, which allows comparison across countries. Estimating a government perspective allows for a comparison of the 26 REmap countries with each other and for a country cost-benefit analysis; the government perspective shows the cost of doubling the global renewable energy share as govern-ments would calculate it.
For the business perspective, the process was repeated to include national prices (including, for example, en-ergy taxes, subsidies and a national cost of capital of 8% for China in order to generate a national cost curve. This approach shows the cost of the transition as businesses and investors would calculate it. Assessment of all ad-ditional costs related to complementary infrastructure, such as transmission lines, reserve power needs, energy storage or fuel stations, are excluded from this study. However, where relevant we discuss the implications of infrastructure needs on total system costs based on a review of comparable literature.
Throughout this study, renewable energy share is esti-mated related to TFEC6. Based on TFEC, the renewable energy share can be estimated for the total of all end-
5 1 Chinese Yuan Renminbi was equivalent to 6.8 US Dollars in 2010.
6 Renewable energy share is estimated by dividing the total final renewable energy use by the TFEC. Total final renewable energy use includes: (i) total fuel use in end-use sectors to generate heat (process heat, space/water heating, cooking, etc.); (ii) motor fuels in the transport sector; and (iii) total power and district heat con-sumption generated from renewable sources.
use sectors of China or for each of its end-use sectors (with and without the contribution of renewable elec-tricity and district heat). The share of renewable power and district heat generation is also calculated. Further details of the REmap 2030 methodology can be found online in IRENA’s REmap webpage at: www.irena.org/remap.
This report also discusses the finance needs and avoid-ed externalities related to renewable energy. Three fi-nancial indicators are developed, namely net incremen-tal system costs, net incremental investment needs and subsidy needs. These indicators are briefly defined as:
1) Net incremental system costs: This is the sum of the differences between the total capital (in USD/year) and operating expenditures (in USD/year) of all energy technologies based on their deploy-ment in REmap 2030 and the Reference Case in the period 2010-2030 for each year.
2) Net incremental investment needs: This is the difference between the annual investment needs of all REmap Options and the investment needs of the substituted conventional technologies which would otherwise be invested in. Invest-ment needs for renewable energy capacity are estimated for each technology by multiplying its total deployment (in gigawatts, GW) to deliver the same energy service as conventional capac-ity and the investment costs (in USD per kilowatt, kW) for the period 2010-2030. This total is then annualized by dividing the number of years cov-ered in the analysis (i.e., 20 years between 2010 and 2030).
3) Subsidy needs: Total subsidy requirements for renewables are estimated as the difference in the delivered energy service costs for the REmap Option (in USD/GJ final energy) relative to its conventional counterpart multiplied by its de-ployment in a given year (in petajoules (PJ) per year).
In addition to the investment and subsidy needs, exter-nal effects related to greenhouse gas (GHG) emission reductions as well as improvements in outdoor and indoor air pollution from the decreased use of fossil fuels have been estimated. As a first step, GHG emis-sions from fossil fuel combustion are estimated for each sector and energy carrier. For this purpose, the energy content of each type of fossil fuel was multiplied by its

Renewable Energy Prospects: China 9
default emission factors (based on lower heating val-ues, LHV) as provided by the Intergovernmental Panel on Climate Change (Eggleston et al., 2006). Emissions were estimated separately for the Reference Case and REmap 2030. The difference between the two estimates yields the total net GHG emission reduction from fossil fuel combustion due to increased renewable energy use. To evaluate the related external costs related to carbon emissions, a carbon price range of USD 20 to 80 per tonne of CO2 is assumed (IPCC, 2007). This range was applied only to CO2 emissions, but not other greenhouse gases. According to the IPCC (2007), the carbon price should reflect the social cost of mitigating one tonne of CO2 equivalent GHG emissions.
The external costs related to human health are esti-mated in a separate step, which excludes any effect related to GHG emissions. Outdoor air pollution is evalu-ated from the following sources: 1) outdoor emission of
sulphur dioxide (SO2), mono-nitrogen oxides (NOx) and particulate matter of less than 2.5 micrometres (PM2.5) from fossil fuel-based power plant operation, and 2) outdoor emissions of NOx, and PM2.5 from road vehicles. To evaluate the external costs related to outdoor emis-sion of SO2, NOx and PM2.5 from fossil power plant opera-tion, the following parameters for respective pollutants were used: (a) emission factor (i.e., tonne per kWh for 2010 and 2030 taken from the IIASA GAINS database ECRIPSE scenario (IIASA, 2014)), and (b) unit external costs (i.e., Euro-per-tonne average for the European Union (EU), adapted for China from the EU CAFE pro-ject (AEA, 2005)). Values for the potential differences in external effects between the EU and China are ac-counted for based on the difference in gross domestic product (GDP).
An extended version of the methodology of the REmap analysis can be found online7.
7 www.irena.org/remap

Renewable Energy Prospects: China10
Key points
● The renewable energy share in China’s total final energy consumption stood at 13% in 2010, the base year of REmap 2030 analysis.
● Hydroelectric (hydro) accounted for 85% of total renewable power generation in China in 2013, a share that has fallen as other forms of power generation have been rolled out. Wind power is growing significantly and in 2013 China had 77 gigawatts-electric (GWe) of installed wind ca-pacity. As a result, wind now accounts for nearly a quarter of total renewable power generation in 2013 in China.
● Modern and traditional uses of biomass are es-timated to account, together, for more than half of China’s total renewable energy use today. However, there are large uncertainties around the actual consumption of traditional forms of bio-mass. Based on the review of existing literature and bottom-up analysis, this study adopted the mean value of the estimated range of 1 EJ-8 EJ, i.e. 4 EJ (136 Mtce).
● China has a long history of developing biogas for households that stretches back to the 1960s, with total investments reaching nearly USD 15 billion between 2003 and 2012. About 50 million house-holds use a total of 16 billion cubic metres of biogas per year today.
● China has the largest solar thermal capacity in the world, accounting for two-thirds of the total global capacity of 270 gigawatts-thermal (GWth) in 2012. All of this capacity is located in the build-ing sector.
● There are important regional differences. Wind generation is concentrated in the northwest and northeast. Utility-scale solar photovoltaic (PV) generation is concentrated in the northern and western parts of China. Distributed solar PV is picking up, with a shift that started in 2013 and is
expected to continue, mainly in eastern parts of China. Biomass, depending on the type of feed-stock, agricultural residues and waste available, is concentrated in central and northern parts of the country and residual forested areas in various parts of China.
This section discusses the current energy situation of China at the level of sector and energy carriers. It also provides a brief overview of the latest renewable energy development and capacity additions.
3.1 Status of renewable energy development
Power sector
By 2013, China exceeded the United States in terms of total electric power generation capacity. In 2013 alone, overall capacity grew by 8% on the previous year, to 1,234 gigawatt-electric (GWe). China’s power generation capacity is expected to more than double by 2030 or even before.
Renewable energy projects have taken an increasingly important share of this total. Figure 2 shows the in-crease in total renewable energy power plant capacities in China between 2005 and 2013. Total installed renew-able capacity reached 380 GWe in 20138. Installed ca-pacity has more than tripled since 2005.
With an installed hydroelectricity generating capacity of 280 GWe
9 at the end of 2013, China remains the world’s leading investor in hydro (CNREC, 2014). As a result,
8 Excluding 20 GWe pumped hydro.
9 This includes more than 50,000 small-scale hydroelectricity facilities with a total installed capacity of around 67 gigawatts.
3 RECENT TRENDS FOR RENEWABLE ENERGY AND THE PRESENT ENERGY SITUATION

Renewable Energy Prospects: China 11
hydro accounted for nearly three-quarters of the total installed renewable power generation capacity in China.
Ten provinces account for more than 70% of total power production from hydro (CNREC, 2013a). One third of all provinces and a quarter of the population relies on small hydroelectricity for power supply. China’s capacity of small-scale hydro is also the world’s largest. In 2012, China had 34.3 GWe of distributed energy capacity, of which small hydro accounted for 26.7 GWe (not all small hydro is considered distributed energy). Distributed energy is also viewed as a way to improve rural incomes and supply irrigation.
Most major Chinese hydroelectricity developers are state-owned enterprises: Sino Hydro Group has devel-oped 65% of China’s hydroelectricity projects. Private companies have thus far had difficulty entering this market. However, Hanergy, a private company focused on hydroelectricity, wind and solar development, is the builder of the Jin’anqiao, Mujing, Huangtian, Wulanghe and Kunlong hydroelectricity plants.
Installed capacity today accounts for only around 40% of its technical potential, well below the average across the developed countries. It was planned for hydro to reach 420 GWe by 2020, including 70 GWe of pump storage (WRI, 2014). Realizing this target would require the construction of more than 50 large-scale dams on the Jinsha, Yalong, Dadu, Lancang and Yarlung Tsangpo rivers.
Hydroelectricity is followed by wind. Wind power in-vestments have accelerated in recent years, as shown in Figure 2. As of the end of 2013, total installed capacity had reached 91.4 GWe; making China the world’s leading user of wind energy (GWEC, 2014a). The gap between newly installed capacity and new additions to the grid has also narrowed in the past three years, with 77.1 GWe
of the total installed capacity now connected to electric-ity distribution grids.
After the six-fold growth of total generation capacity between 2008 and 2013, wind power had become the third largest source of Chinese power production after
Figure 2: Cumulative renewable power plant capacity in China
0
50
100
150
200
250
300
350
400
2005 2006 2007 2008 2009 2010 2011 2012 2013
Inst
alle
d re
new
able
pow
er g
ener
atio
n ca
paci
ty (G
We)
Hydro Wind on-grid Solar PV (on-grid) Biomass Geothermal & Ocean
Source: IRENA analysis based on CNREC (2013a,b;2014)
Note: Excludes distributed solar PV capacity which reached 5 gigawatts in 2013 (CNREC, 2014).
Since 2013, China has the largest total electric power production capacity worldwide which is expected to more than double by 2030

Renewable Energy Prospects: China12
thermal and hydro, albeit accounting for only 2.5% of the total. This suggests there is considerable room for the industry to grow. Between 2010 and 2012, newly added capacity averaged 15 GWe per year. The size of wind parks is also increasing. In 2012, average unit capacity had reached 1.4 megawatts-electric (MWe), double the figure in 2005 (CNREC, 2013a).
As of 2013, the total number of wind turbine projects in the pipeline were equivalent to 60.2 GWe of additional capacity. If these can be completed and connected to the grid in the next 2-3 years, it is expected to nearly double China’s total installed on-grid wind power gen-eration capacity (CREIA, 2014a).
Private and foreign ownership in the sector remains limited, accounting for 5% and 1% of total wind capac-ity, respectively. About 80% of the total is state-owned, while 14% is accounted for by Sino-foreign joint ventures (CNREC, 2013a).
North China accounts for about 70% of the total in-stalled wind capacity. Hebei and Gansu provinces also have high installed capacities: 7.1 GWe and 6.3 GWe, respectively (CNREC, 2013a; Perera, 2014).
Wind power is the third largest source of electricity in China, although it still only accounts for 2.5% of the total
China had installed 390 MWe of offshore wind power by the end of 2012, with the majority in Jiangsu Province and Shanghai City, where all facilities have been con-nected to the grid. Two-thirds of the total capacity was located in intertidal zones where Donghai Bridge (close to Shanghai) is the largest single location with the larg-est capacity (102 MWe). The remaining projects mostly consist of small prototypes for demonstration and test-ing purposes (Carbontrust, 2014). The biggest offshore demonstration project in China had a total capacity of 150 MWe in Jiangsu Rudong. Other installations are the second phase of the 65.6 MWe Donghai Bridge project, with 8.6 MWe installed in 2011 (GWEC, 2014b; WP, 2013).
There are also an increasing number of solar PV pro-jects in China. Installed generation capacity based on solar PV has increased considerably in recent years. The period from 2010 to 2012 saw a nearly tenfold increase, from 0.8 GWe to 7 GWe. In 2012 alone, about 4 GWe – more than the total installed over the previous five years – was added.
Figure 3: China wind power capacity growth, 2008-2013
20
18
16
14
12
10
8
6
4
2
2008 2009 2010 2011 2012 2013
GW
e
GW
e
Cumulative installed(right-axis)(left-axis) (left-axis)
New installedNew installed (connected to the grid)
100
90
80
70
60
50
40
30
20
10
Source: CWEA (2014); CHPDI (2014)

Renewable Energy Prospects: China 13
Driven by a new target of 35 GWe by 2015 – an increase of 40% from its previous target of 21 GWe – announced at the very beginning of 2013, and partly by the ending of a 16 US cents per kWh feed-in tariff (FiT) for large grid-connected PV projects, the record of the annual new addition of installed capacity was reset at nearly 13 GWe by 2013. This makes the total installed capacity 19.6 GWe including 16.3 GWe of ground-mounted solar PV systems and 3.1 GWe of distributed solar.
Following the strong momentum seen in 2013, a new target was set in May 2014 of 70 GWe by 2017 in the con-text of the Action Plan on Prevention and Control of Air Pollution. This target indicates that the record growth of 13 GWe a year would have to be sustained for the next four years (SolarServer, 2014). Although the addition of distributed solar PV generation capacity in 2013 was about 800 MWe, the new goal set for 2014 is to install 8 GWe of distributed solar PV as opposed to 6 GWe ground-mounted utility-scale solar PV farms (CREIA, 2014b). It highlights the importance of distributed solar PV as well as the development of utility-scale solar PV in western China (Haugwitz, 2014), in the context that distributed solar PV accounts for about 38% of the total installed. However, in the first half of 2014 only 2.3 GWe of ground-mounted utility scale capacity was installed while about 1 GWe of distributed generation solar PV was installed, but with another 3 GWe at least commis-sioned in the same time period. If the targets set for 2014 are to be achieved, considerable efforts need to be made in the near future.
Qinghai, Xinjiang, Tibet, Inner Mongolia, Sichuan and Gansu Provinces account for the largest share of in-stalled solar PV capacities, given they represent more than two thirds of the national solar energy resource potential (CNREC, 2013a).
Concentrated solar power (CSP) has only recently been introduced in China. In 2011, there were five approved projects under construction. Their total capacity is 342.5 MWe and all of them use parabolic trough tech-nology. Plants are located across Gansu, Inner Mongo-lia, Ningxia and Qinghai (Eurobserv’er, 2014; ESTELA, 2012). Expected installed capacity growth to 2018 is 1.4 GWe, mainly driven by the 12th five-year plan (FYP) (2011-2015) (for which the target is 1 GWe), the ample availability of low-cost financing and flexibility from hybridisation with coal or storage (IEA, 2013c). By 2020, China aims to have 3 GWe of installed CSP capacity.
Two CSP projects, each with a capacity of 50 MWe, re-ceived total lending of USD 250 million (RMB 1.7 billion) from the Asia Development Bank. One of them was in Qinghai, which received USD 150 million (estimated to produce 197 GWh annually); the other was in Gansu, which received USD 100 million (parabolic). The loans were made in 2013 and 2014, respectively (Lee, 2014).
In August 2014, NDRC set a tariff of USD 19.2 cents per kWh for the first CSP project, the Delingha installation operated by SUPCON Group, which has a designed capacity of 50 MWe. Phase I, worth 10 MWe, has been in commercial operation since early 2013. The nearly two-year-long operation has provided data for policy makers to set future tariffs. The current tariff is not as high as the CSP industry had expected, suggesting that future FiTs for CSP will be differentiated from those for PV projects. This would be of great significance for the CSP industry as the previous prevailing wisdom was that the same level of tariffs would be applied to both forms of solar power plant. It is estimated that a universal tariff structure for CSP will not likely be issued until a few projects are up and running and generating sufficient amounts of operational data on which to base a judgement.
The relatively low tariffs for the pilot CSP projects might also reflect an attempt to encourage the use of local components. Currently, the two biggest challenges facing the Chinese CSP industry include resource as-sessment and system optimisation. It has been widely acknowledged that the levelised cost of energy (LCOE) would be decreased dramatically if and when Chinese manufacturing capacities in CSP increase. This might bring the technology back to the table.
The first CSP pilot project was subject to a comparatively low feed-in tariff, indicating that policy makers are keen to encourage investment in the sector
Installed biomass power generation capacity increased from 1.4 GWe in 2006 to 8.5 GWe in 2013. After hydro it was the second largest form of renewable capacity in-stalled until 2007, before wind caught up. The majority of biomass capacity is in eastern China, with Shandong alone accounting for 14% of the total. Henan, Jiangsu, Heilongjiang and Hubei each have around 500 MWe capacity installed as well (CNREC, 2013a).

Renewable Energy Prospects: China14
Biomass installed capacity numbers vary by source. Half of the total installed capacity (4.1 GWe) today is ac-counted for by agriculture and forestry biomass direct combustion power generation plants. At the end of 2012 there were 100 such steam cycle plants in operation, most with a unit capacity of 12 MWe but some with up to 50 MWe. A quarter (2.3 GWe) of this capacity comes from waste incineration, around 0.3 GWe is from biogas. 1.2 GWe from sludge and biomass gasification power generation, and 1.7 GWe from bagasse power plants10 (CNREC, 2014). Biomass co-firing is limited. Govern-ment has set a target of 30 GWe for biomass-based power by 2020.
Power generation from modern biomass was about 34 TWh in 2012 (using around 0.5 EJ biomass). Solid bi-omass use for power generation is projected to increase to 0.7 EJ in 2015, while biogas will grow to 0.5 EJ, solid biomass for heating to 0.18 EJ and biofuels to 0.18 EJ (total 1.6 EJ).
The target for biomass power generation is 13 GWe by 2015. This includes 8 GWe agricultural/forestry residues, 3 GWe municipal solid waste and 2 GWe biogas. This could double power generation from 2012 levels of 34 TWh/year.
European high-pressure, high-temperature technology has been adapted to the Chinese market. Such boilers can achieve efficiencies of up to 32%. China has mature combustion technologies. There are plants with up to 50 MWe capacity in operation. Three high temperature and ultra-high pressure circulating fluid bed boilers have been in operation since 2012 (Van Sambeek et al., 2013). Manufacturing in China has reduced engineering, pro-curement and construction (EPC) costs from USD 2,500 per kW in Europe to USD 1,000 to 1,200 per kW for the same base technology. Special attention is needed for fuel handling and fuel feeding, combustion, boiler and flue gas cleaning (Brendstrup, 2012).
10 Bagasse is a by-product of the sugar cane industry. Sugar cane production of China amounted to about 110 Mt/year in 2010. This yields approximately 36 Mt/year bagasse (with 40-50% moisture content). This is equivalent to 300 PJ per year bagasse genera-tion. This is used for on-site power generation in a total installed capacity of 800-1,700 MWe today; that is equivalent to about 50-100 PJ/year bagasse demand which means only 15-35% of the actual amount generated was utilised.
Investments in biomass have increased steadily, aided by European technology and reduced engineering, procurement and construction costs
With extensive but low-temperature geothermal resources (30-90o C in most locations), China has since 1999 been the world’s largest user of geothermal energy for non-electric applications such as space heating and recreation. A few locations have the potential for high-temperature geothermal use, notably in southern Tibet, western Yunnan and western Sichuan, located on the Himalayan Geothermal Belt. However, it remains uncertain whether these resources could be exploited in an economically viable and environmentally benign manner. As a result, China’s geothermal power generation capacity has hovered around 27 MWe for many years (CNREC, 2014). The largest project, Yangbajing Geothermal Power Plant, is located in Tibet with a total capacity of 25.2 MWe and has been in operation since 1977 (built between 1977 and 1991, starting with a 1 MWe capacity). Many other plants with much smaller capacities existed in Tibet, Guangdon and Hunan but have since ceased operation.
No major developments in the sector have taken place in China since 1992 (Worldview, 2012). However, geo-thermal potential for power generation is estimated at between 50 MWe and 90 MWe in Yangbajain (Bertani, 2010) and China aims to arrive at a total installed capac-ity of 60 MWe by 2015 (GEA, 2012).
Transport sector
In the transport sector, two main technology options are liquid biofuels and electric mobility. Fuel ethanol production in China doubled between 2005 and 2012, reaching a total of 2.5 billion litres (CNREC, 2013a). Bio-diesel production in China is rather limited, with about 0.5 million tonnes from a total production capacity of 3 million tonnes in 2009, and production levels remain-ing stagnant today (Qiu et al., 2012; USDA, 2012; CNREC, 2013a).
Cane, sweet sorghum and cassava can be used for etha-nol production. However, the government is concerned about food versus fuel competition. For this reason, ambitious plans for transportation biofuel production based on food crops have been abandoned; instead at-

Renewable Energy Prospects: China 15
tention has focused on advanced biofuels. Of 100 such projects worldwide, 18 of are located in China, which accounts for 40% of the potential capacity (an annual production capacity of 2.5 billion litres per year) (IFPEN, 2013).
The first cassava ethanol plant in the world was built in Guangxi in 2007. The plant has an annual production capacity of 250 million litres per year. Another ethanol plant using sweet sorghum as feedstock was completed in 2012 in Inner Mongolia with a total capacity of 64 million litres per year (USDA, 2013). COFCO/Sinopec with Novozymes as partner is investing in Zhaodong to produce ethanol from agricultural residues with a total capacity of 64 million litres per year. There are also two other projects, one in Shanghai and another in Caofeidian, each with an annual capacity of 0.4 million litres, which aim to produce ethanol from waste carbon monoxide from steel mills. The plant in Shanghai is expected to expand its production to 120 million litres per year (AEC, 2013; E2, 2013). There is a plant in Shengguan based on corn cob residues available onsite (originally a corn to furfural company) with 22 million litres per year capacity. Another plant with 56 million litre capacity in Longlif (originally a conventional biofuel company) also uses corn cobs as feedstock. A smaller plant with 11 million litre-per-year capacity runs in Hennan Shengguan. Finally, another plan in the Anhui province is to invest in a biorefinery for the production of ethanol, bioglycols and power from a mix of wheat straw, corn storver and lignin co-products (Biomass Magazine, 2013).
In addition, a shift in transport modes, such as the use of high-speed trains with renewable power instead of diesel-based trucks or city trams for passenger cars, are other options for the transport sector.
Other end-use sectors
In buildings and the manufacturing industry, conven-tional fuels used to generate space and water heating, cooking and process heating can be substituted with a range of technologies. These include solar thermal, geothermal heat, heat pumps and biomass-based heat. All of these technologies are already deployed in China and have significant further potential. The main chal-lenge is the substitution of traditional uses of biomass in China with modern forms of bioenergy and other renewables.
3.2 Base year renewable energy situation
Sector-level breakdown
In 2010, China consumed 100 EJ of total primary energy (3,410 Mtce) (excluding non-energy use of around 5 EJ) (IEA, 2013a)11, 12. In final energy terms, China’s total en-ergy demand in 2010 was 57 EJ (1,950 Mtce) of which 59% was consumed by industry, 21% by the building sector and 13% by the transport sector (Figure 4). Elec-tricity accounted for 20% of the TFEC of which 75% was consumed in the industrial sector, with the remainder used mainly in buildings. District heat is also important for China. Its production had increased to 3 EJ in 2010. It provides about 4% of the TFEC in each of the industry and building sectors. About 70% of the total district heat demand was consumed in the industrial sector.
The breakdown of TFEC at a sector level has changed in the past three decades (IEA, 2013a). In the 1980s building energy demand accounted for more than half of TFEC and the transport sector had a share of around only 5-6%. The industry sector’s share was about 40%. In comparison, today industrial energy use accounts for more than half of China’s total energy demand, while the share of the transport sector has tripled to 15% at the expense of the building sector, which now only ac-counts for 30%.
Modern and traditional forms of renewable energy ac-counted for 13% of the TFEC in 2010. It is not easy to make a distinction between the amount of biomass used in its traditional and modern forms – depending on the sources used, the traditional use of biomass in China ranges anywhere from 1 EJ to 8 EJ (see Annex I for further details). When this amount is excluded from the mix, modern renewables account for 7% of TFEC (IEA, 2013a)
Renewable energy use is concentrated in the end-use sectors. When excluding electricity and district heat
11 According to CNREC (2013a), the total primary energy consump-tion of China in 2012 was 3,620 Mtce, which is approximately 106 EJ.
12 Primary energy consumption refers to the direct use or supply of all energy carriers (e.g., crude oil) without being converted or transformed to another form of energy (e.g., heat). It is therefore higher than TFEC, which only looks at the consumption of energy carriers such as fuels for the transport sector or electricity for ap-pliances (see footnote 1).

Renewable Energy Prospects: China16
consumption, this amounted to 16% in the building sec-tor. By comparison, renewable energy use is negligible in the industry and transport sectors13. When it comes to power generation, 19% of electricity sources were renewable, while in the district heat sector the share of renewable energy was only 1% in 2010.
Industry accounts for 62% of China’s total final energy consumption, the highest share amongst large economies, but industry sector has the least share of renewables in its fuel mix
The industrial sector is by far the largest energy user in China, accounting for 62% of its TFEC. It is projected that its share will fall slightly below current levels to be-tween 50% and 55% by 2030.
Today, for nearly all bulk materials, such as cement, steel and textile fibres, China accounts for the largest share of production worldwide. The high importance of industry
13 Providing the renewable energy share excluding power and district heat demand provides the contribution of renewable technologies in the sector’s total fuel use only. This is important to know to ex-clude the effect of renewable power and district heating which are often outside the boundaries of end-use sectors.
compared with other sectors is a specific feature of the Chinese energy system. The iron and steel sector was the largest industrial energy user, accounting for 40% of China’s TFEC. Other large industrial energy uses include non-metallic minerals (18%), chemicals and petrochemi-cals (12%) and machinery (6%) (IEA, 2013a).
Industry has a high demand for steam for different pro-cesses. However, the share of industrial combined heat and power (CHP) is rather low, with much of the process heat production coming from boilers (IEA, 2009).
In China most existing CHP production is based on coal. It is often integrated with municipal or industrial district heating systems or tied to power plants selling steam to nearby industrial sites or district heating loops. With in-vestments in new capacity the overall efficiency of these systems are improving, but there are many industrial systems that are based on old, inefficient coal boilers and heating loops (average district heating boiler ef-ficiency in China is 60 to 65%, while the heat loss from district heating pipelines is estimated to be between 20% and as much as 50%) (IEA, 2009).
Besides their comparative lack of energy efficiency, these older forms of CHP also make the reduction
Figure 4: China TFEC breakdown, 2010
47%
15%
12%
21%
5%
Industry fuels Industry electricity Transport fuels
Transport electricity Buildings fuels Buildings electricity
Source: IRENA estimates based on IEA (2013a)

Renewable Energy Prospects: China 17
of pollution and GHG emissions a challenge. How-ever, there is an opportunity for major GHG reductions through the use of localised, customer-based CHP at individual industrial facilities and in new commercial and residential developments – utilising more efficient and clean systems based on natural gas and renewable and waste fuels.
The application of cleaner forms of CHP at the local level could increase energy efficiency and help reduce air pollution
More than three quarters of the transport sector’s ener-gy use is related to road transport. Domestic navigation accounts for another 8%. Rail transport, pipeline trans-port and domestic aviation together account for 13% of the transport sector’s TFEC (IEA, 2013a). More than half of the traffic is on highways (1,676 billion passenger-kilometres out of the total of 3,098 in 2011). Aviation accounts for about 15% of the total passenger transport. Railways are increasingly gaining importance, with their share of total passenger transport reaching 30% in 2011. Nearly half of total freight movements were via naviga-tion in 2011, with road transport accounting for a third and railways about 20% of the total (LBNL, 2013).
In 2011, the number of vehicles (excluding motorcycles and tractors) on the road has reached 93.6 million, of which 74.8 million are categorised as passenger vehi-cles. Trucks represented 17.9 million of the total civil-ian motor vehicle stock (LBNL, 2013). The demand for transportation is growing rapidly. In 2011, 18.5 million vehicles were sold. Further growth is expected but pro-jections are uncertain, amounting to anywhere between 25 million and 75 million cars in the long term (Econo-mist, 2012). By 2030, the vehicle stock will have reached 500-600 million vehicles, according to some estimates (Wang et al., 2013). Ma et al. (2012) project that the ve-hicle population in China will increase to 294 million in 2030, with an average annual growth rate of 11%.
For intercity passenger transportation, the total traffic volume in 2030 will be around 7.6 trillion passenger-km, nearly three times the volume in 2010. The share of aviation in total passenger transportation is expected to double. In 2030, freight traffic volume could double compared to 2010. The share of railways could decrease from 30% to 19% the share of water transport could
increase from 23% to 33%, and highways share to 48% (Ma et al., 2012).
After industry and transport, the building sector is the third largest user of energy. Residential energy use accounts for 86% of the total with the remainder accounted for by the commercial sector. Building energy consumption can be distinguished between urban residential, rural residential and the commercial sector.
Based on literature review, space heating accounts for about 30% of the total residential energy demand (in-cluding electricity use), with that share rising to at least 50% for commercial buildings. More than half of the total energy demand is for cooking in rural areas (Zhou et al., 2007; PNNL, 2012; Xia, 2013; CPI, 2013). However, the breakdown of the data is largely dependent on how biomass is accounted for.
China has more than 20 billion square metres (m2) of ru-ral residential building area. The urban residential build-ing area is about 15 billion m2, while the total area for commercial buildings is about 8 billion m2 (CPI, 2013). Besides these total figures, attention should also be paid to China’s changing demographics and building use. On the one hand, the household size in China is decreasing: in 1980 the average size of a household was five people; in 2004, the figure was fewer than four. On the other hand, the dwelling area is increasing. For example, the period between 1980 and 2004 experienced a more than tripling of the area of the average household, from 35 m2 to 100 m2 (Zhou et al., 2007).
More than half of the energy use in buildings in rural areas is for cooking, while nearly half of the total energy use in commercial buildings is for space heating
China has varying climate zones. The heating period in cold areas such as the northeast and west of the country can last for as long as 200 days. In other areas, it might be as few as 90 days (IEA, 2009). Total energy consumption for heating accounts for nearly a quarter of the total building sector energy demand. The total building heating area in China was about 8.8 billion m2 in 2008. About 38% of this is met by CHP central heat-ing (3.3 billion m2), and another 36% by gas/coal boiler-based central heating (3.2 billion m2). The remaining

Renewable Energy Prospects: China18
26% is provided by distributed systems which also include heat pumps and electric heating (2.3 billion m2) (Xia, 2013).
District heating for hot water is an important technology in China. Half of all major cities in China are connected to district heating systems. According to DEA (n.d.), district heating floor space has reached nearly 4.8 billion m2. This is more than triple the total area in 2001. This increase was a result of national policies and regulations as well as the use of surplus heat from the industrial sector. CHP is gaining a market share in district heat sys-tems and today it accounts for more than half of the to-tal district heating (DEA, n.d.; Euroheat & Power, 2013).
District heating capacity has increased by about a half in recent years, from 224 GWth in 2007 to 339 GWth in 2011. The increase in the length of heating pipelines grew by about the same percentage in the same period, from 102,000 kms to 147,400 kms. The vast majority of all pipelines are used for hot water. The total heat supplied reached about 2.8 EJ in 2011, and can be split into 2.3 EJ hot water and 0.5 EJ steam. Hot water demand is in-creasing whereas the use of steam is slowly decreasing (Euroheat & Power, 2013).
By the end of 2010, China had some 38.5 million house-hold-scale digesters, and around 27,500 large- and medium-scaled biogas plants for agricultural waste (Chen et al., 2012). Installations continue to grow apace. As of the end of 2012, China had nearly 50 million biogas cooking systems in place in rural areas.
Half of all major cities in China are connected to district heating systems, many of which are designed to use surplus heat from industry
Coal still plays a leading role in the energy industry of China. Around half of all coal is used for power generation, accounting for nearly 80% of the total of 4,980 TWh/year generated in 2012. Total generation from natural gas and oil products was less than 2%, while nuclear accounted for 1.2%. Overall, installed fossil fuel and nuclear generation capacities in 2012 were equivalent to 840 GWe, which is 71% of the total generation capacity of 1,144 GWe (CNREC, 2013a). As discussed earlier, renewable energy sources account for about 20% of power production, with hydro by far the biggest form of renewable, followed by wind and biomass.
Figure 5: Renewable power capacity and generation, 2012
0
100
200
300
400
500
600
700
800
900
1000
0
50
100
150
200
250
300
Hydroelectricity Wind onshore Bioenergy Geothermal
Pow
er g
ener
atio
n (T
Wh/
year
)
Inst
alle
d ca
paci
ty (G
We)
GWe capacity (left-axis) TWh generation (right-axis)
Solar PV
Source: IRENA analysis based on CNREC (2013a)

Renewable Energy Prospects: China 19
Hydroelectricity accounts for 85% of the total renewable electricity generation today
In the residential sector, traditional and modern uses of biomass as a source of heating and cooking made up nearly all renewable energy used in 2010. Next to biomass, total installed solar thermal capacity for heat-ing in the building sector in 2010 was 130 GWth (CNREC, 2013a). Excluding traditional uses of biomass, the mod-ern share of renewables was 16% of the sector’s total energy demand. In terms of fossil fuel products, 32% of the sector’s total energy demand was provided by similar amounts of coal and oil products. Natural gas accounted for 7% of demand (IEA, 2013b).
Oil products are the main sources of energy in the trans-port sector, accounting for more than 90% of the total demand, with smaller amounts of natural gas and coal providing the remainder. Around 2 billion litres of biofu-els were consumed, which is less than 1% of the sector’s total energy demand.
Total biomass use in the industrial sector was limited to black liquor combustion of around 100 PJ per year. This quantity, which was excluded from the IEA energy statistics, is estimated based on total chemical pulp production of around 5 Mt per year. The sector relies heavily on coal to meet demand from energy-intensive industries such as steel and cement production.
Traditional uses of biomass
The traditional use of biomass in China deserves special attention because of its size as well as the difficulty in establishing reliable data due to the wide range of sources and variety of estimates. Worldwide, the num-ber of people using solid fuels for cooking and heating has increased over the last decade to 3.2 billion, with about 2.4 billion using traditional biomass. Roughly 800 million today use improved cooking stoves, partly due to efforts in the last two decades in China (Pachauri et al., 2012).
Biomass is the main source of energy in most provinces of rural China for space heating, cooking and water heating (An et al., 2014). In comparison, a negligible amount of biomass is used by the urban population in China. According to the IEA (based on World Health Organisation estimates), about 445 million people in China, who represent three-quarters of the total rural
population, still rely on traditional uses of biomass (IEA, 2013a). According to other sources (e.g., Zhang, Wata-nabe and Lin, 2010), the share of the total rural popula-tion relying on traditional uses of biomass in 2008-2009 was 50-60%.
In China, between 1983 and 1996, improved cooking stoves were distributed to 177 million households. The energy efficiency of improved fuel wood stoves is be-tween 20% and 30%. Although some studies suggest that these stoves are still mostly in use, it is unclear what their status and acceptability is (Pachauri et al., 2012).
Comparison of the literature shows that there is an im-portant issue regarding the actual value of solid biomass used in China in traditional forms for cooking and heat-ing in households. While there is no lack of information, the data vary widely from about 2 EJ to 8 EJ (see Table 1 and Annex I).
While traditional uses of biomass are key in China’s energy mix, consistent and reliable data for the sector are still lacking
In addition to the statistical data, there is also literature which provides estimates for per capita consumption of energy in China. Based on the literature, and the share of the rural population relying on traditional use of bio-mass, total demand could range from between 0.8 EJ and 4.2 EJ (see Annex I).
Based on the comparison of various sources above, we assume that in the rural residential sector, 1.9 EJ (65 Mtce) of fuel wood and about 2 EJ (68 Mtce) of straw14 are used for cooking and heating today. Of this total amount of around 4 EJ (135 Mtce), we assumed that about 0.5 EJ (17 Mtce) is modern biomass used in efficient cookstoves15. However, this is certainly an area which requires further research and data collection.
14 According to Xiajiao (2012), 18% of the 700 Mt of total straw generated is used for energy purposes (1.6 EJ). According to Yishui and Liying (2011), 215 Mt is used for energy generation (2.7 EJ). According to Zhang (2014), 40% of a total of 350 Mt straw available for energy is already used (1.8 EJ).
15 The status of the 180 million modern cookstoves is unknown. As-suming that about 25-75 million are still in use with an average capacity of 1-3 kWth, total demand for modern biomass would be about 500 PJ/year on average in 2010.

Renewable Energy Prospects: China20
Conventional fuel markets
China’s economy is growing rapidly; its urbanisation rates have increased substantially in recent years and are expected to increase even further. Fossil fuels, and in particular coal, play an important role in meeting this energy demand.
In 2012, total coal production reached 3.5 billion tonnes (nearly 80 EJ), which was sufficient to meet domestic demand (CNREC, 2013a). China also produces oil and natural gas. In 2010, its crude oil production exceeded 4 million barrels per day (mb/d), which is around 8 EJ. Natural gas production reached 96.8 billion cubic me-tres in 2010 (4.2 EJ) (see Figure 6).
Crude oil production has shown a steady increase be-tween 1990 and 2012, growing at about 1.8% per year. Northern and western parts of China account for the majority of the output. Heilongjiang, Tianji and Shaanxi provinces contribute a half of the country’s total pro-duction (LBNL, 2012). The oil market is dominated by four national companies, namely China National Petro-leum Corporation (CNPC), Sinopec, China National Off shore Oil Corporation (CNOOC) and Sinochem. In an attempt to meet the surging demand for oil products, China has also invested in refining capacity, pipelines and also port infrastructure. Total oil storage capacity reached 103 million barrels (under the first phase of the Strategic Petroleum Reserve, or SPR). As new phases of the SPR are completed by 2020, combined storage ca-pacity will further increase by a factor of 8 (IEA, 2012b).
In the same period, natural gas production has in-creased by 9.3% per year on average. Compared with two decades ago, when production was mainly used for meeting the demand from industry and the construc-tion sector, today demand from the residential, com-mercial and transport sectors is also high (IEA, 2012b). China aims to increase its production from conventional and unconventional resources even further to improve gas security. The majority of production originates from western provinces including Xinjiang and Sichuan (LBNL, 2012). The same national companies which con-trol the oil industry also dominate upstream natural gas production in China.
China’s coal production increased by an average of about 6% per year between 1990 and 2012. In the period between 2000 and 2006 in particular, production accel-erated, reaching 10% per year growth. Inner Mongolia, Shanxi and Shaanxi provinces account for more than half of the total production (LBNL, 2012).
In addition to fossil fuel production trends, the increase in demand for oil products, natural gas and electricity over the past two decades is striking. Coal use has been increasing steadily since the late 1990s, averaging more than 6% annual growth, mainly as a result of the grow-ing demand in the power generation and manufacturing industry sectors. While coal still predominates, oil and gas demand has been growing rapidly. Though much smaller in volume, the growth in oil products of 7-8% a year outpaced coal growth as a result of the grow-
Table 1: Summary of biomass use in China based on different sources
IEA (2013b)
FAOSTAT (2014)1
LBNL (2013)
Xia (2013) CNREC
Chen, Yao and Li
(2010)
Year data refers to 2011 2011 2007 2011 2012 2008(EJ/year) (EJ/year) (EJ/year) (EJ/year) (EJ/year) (EJ/year)
Solid biomass 8.5 1.9 7.4 3.7 0.6 5.1Residential 8.0 7,4 3.7 5.1Fuel wood 2.7 Crop stalk 4.7 Briquette 0.1 Power & DH generation 0.5 0.5 Liquid biofuels 0.05 0.1 Biogas 0.3 0.2 0.3 Total 8.9 1.9 7.6 3.7 1.0 5.1
1 Data converted from m3 to EJ assuming a density of 450 kg/m3 for coniferous and 700 kg/m3 for non-coniferous wood, and a LHV of 17.5 GJ/t.

Renewable Energy Prospects: China 21
ing demand in the transport sector. Finally, demand for natural gas, particularly over the past decade, has reached more than 20% annual growth. The State Coun-cil of China has approved a coal consumption target to keep it below 4 billion tonnes of coal equivalent by 2015.
Growth from China is accounting for an increasing share of the global demand for oil products and will continue to account for an even larger proportion in the short term due to higher car ownership. The IEA projects overall growth of nearly 70% between 2010 and 2030, which is somewhat lower than the current trends but still significant (IEA, 2012a). Demand for coal is expected to increase by 25% in the same period. Natural gas sup-ply in comparison is projected to increase by at least a factor of four, higher than the growth of both oil and coal, though still accounting for a relatively small pro-portion of the total.
Demand for oil products has grown rapidly in the past decade, driven by a marked increase in car ownership
Demand for natural gas will be met partly by shale gas production, partly by imports by pipeline and in the form of liquefied natural gas (LNG), as well as from do-mestic sources including tight gas, coal-bed methane
and others. China has the largest technically recoverable shale gas resources in the world, amounting to some 25.1 trillion cubic metres (IEA, 2012b). The country has specific shale gas production targets to 2015 of 6.5 bil-lion cubic metres per year with 990 horizontal wells drilled. By 2020, China aims to produce some 80 billion cubic metres annually, however, this target has been recently halved due to technical challenges (Reuters, 2014a). Water scarcity is the main obstacle to meeting these targets. Although the 13.8 million cubic metres a year of water which would be required by the industry in 2014 is less than 1% of total industrial water demand, it may be a challenge to supply this for hydraulic fractur-ing, or fracking, in some provinces where a substantial share of the water is not recoverable (Forbes, 2013).
Trade is an important component of China’s conven-tional energy market. China is a net importer of crude oil and in 2010 crude oil imports reached more than 10 EJ. 55% of the oil consumed is imported, a share which will continue to rise in the future. Half of this total originated from Saudi Arabia (19%), Angola (17%), Iran (9%) and Oman (7%) (LBNL, 2012).
With increasing demand for natural gas, China also started importing LNG in 2006. By 2010, total imports had reached 9.3 billion cubic metres (equivalent to
Figure 6: China coal, crude oil and natural gas production, 1990-2012
0
10
20
30
40
50
60
70
80
90
100
1990 1995 2000 2005 2007 2008 2009 2010 2011 2012
Prod
uctio
n (E
J/ye
ar)
Crude oil Natural gas Coal
Source: IRENA analysis based on IEA (2012a;2013a); CNREC (2013a)

Renewable Energy Prospects: China22
355 PJ). Australia (48%) and Indonesia (18%) account for the majority of LNG supply. Pipelines also play an impor-tant role for the natural gas trade of China. Turkmeni-stan is the largest supplier of natural gas, accounting for more than half of total imports. The most recent devel-opment is the new agreement China signed with Russia in May 2014, to import natural gas worth USD 400 billion over a period of 30 years (to deliver about 40 billion cubic metres of gas per year from 2018). A memoran-dum of understanding was signed on 9 November 2014 to develop a second route between Russia and China for natural gas supply (Al-Jazeerah, 2014). China also continues to invest in gas storage facilities, interregional gas pipelines and LNG terminals as part of its strategy to ensure security of gas supply (IEA, 2012b).
Although China is a major producer of coal, it exports negligible amounts. On the other hand, its imports have grown rapidly, reaching 165 Mt in 2010. One third of this total originated from Indonesia and nearly a quarter from Australia (LBNL, 2012). Since 2011, China has been the largest importer of coal worldwide, with Japan be-ing the second. Despite the huge scale of domestic coal production, there could be various reasons for the rapid increase in imports such as transportation bottlenecks, environmental and safety considerations (related to mining), economic factors or depleting coking coal re-serves (Tu and Johnson-Reiser, 2012).
Renewable energy markets in heating and transport applications
Heating/cooling and motor fuels are the two thermal markets where renewables play a role today. A wood pellet market is emerging in China. Production has reached 0.8 Mt per year. There are about 260 manufac-turers in China producing straw pellets (Xiajiao, 2012). Some of the largest pellet mills worldwide are located in China with capacities ranging between 100 and 200 kilotonnes (kt) per year (see Table 2). Production is dispersed across the country with plants of small size ranging from 10 to 50 kt/year. Production is projected to grow (Vakkilainen, Kuparinen and Heinimoe, 2013; Goh et al., 2013). The target is to grow pellet manufacturing to 50 Mt per year by 2020.
China is also a large producer of charcoal. It ranks sixth in the world following Brazil, several African countries and India, with a total production of 1.7 Mt/year (Vak-kilainen, Kuparinen and Heinimoe, 2013).
In 2010, pulp production in China was 20 Mt/year which is equivalent to 10% of total global production (including mechanical pulp making) (FAOSTAT, 2014). Chemical wood pulp production yields an organic residue called black liquor which is combusted in recovery boilers to generate energy. The total production of chemical pulp is about 5 Mt/year. This would yield about 100 PJ of black liquor (based on 22 GJ per tonne of pulp). Some of the largest recovery boilers are located in China; two of which have total production capacity of 7,000 and 5,000 tonnes black liquor dry solids (BLDS) per day, equivalent to 29 PJ and 21 PJ per year, respectively. An-other large-scale recovery boiler is under construction in Beihai with a daily capacity of 4,000 tonne BLDS.
China has had an ambitious biogas programme for half a century and accounts for 90% of biogas installations worldwide, with around 35 million units in operation in 2010 and 5 million new units being added every year. Most units are small-scale installations in farms integrat-ed to livestock production. The trend is, however, toward centralised and industrial production as more than half of China’s commercial pork originated from industrial scale farms in 2007 (Hallding et al., 2012).
Around 90% of all biogas was produced in small-scale units in 2010. Of the medium and large-scale pig farms, typically only 5% of the potential has been utilised (Hall-ding et al., 2012). Biogas production stood at 16 billion m3 in 2012, or around 0.25 EJ. The installation of house-hold biogas plants has slowed, and there are about 50 million such installations nationwide.
In keeping with this trend, current policies have begun to focus on large-scale applications. Distributed biogas
Table 2: Largest pellet mills in China
Location Production capacity (kt/year)
Linyi, Shandong 200Guangzhou, Guangdong 150Yangzhong, Jiangsu 120Taicang, Jiangsu 120Shenyang, Liaoning 100Feicheng, Shandong 100Nanyang, Henan 100Xuzhou, Jiangsu 100Foshan, Guangdong 100
Source: Vakkilainen, Kuparinen and Heinimoe (2013)

Renewable Energy Prospects: China 23
digesters in rural areas account for more than 85% of biogas production in China. The installations receive investment subsidies in the range of RMB 1300-3500. Also, large-scale projects receive a 25-45% investment subsidy from the national government as well as a 5-25% subsidy from local governments (Van Sambeek et al., 2013). A variety of biogas systems can be dis-cerned that cater to specific needs (IISD, 2014):
● The ‘three-combined’ model. Traditionally in rural China a domestic biogas digester is integrated with the toilet and livestock pen, allowing animal and human waste to be fed in easily.
● The ‘one-plus-three renovation’. This system is also known as a ‘rural biogas digester and three renovations’, because a rural household reno-vates the livestock pen, toilet and kitchen when constructing the biogas digester.
● The ‘three-in-one’ model in southern China. This system prioritises the efficient use of bio-slurry. Originally, the three-in-one name referred to ‘pig-biogas-fruit’, using pig manure for biogas production and then bio-slurry as fertiliser for orange trees. This system has improved both the quality and quantity of fruit production.
● The ‘four-in-one’ model in northern China. A biogas digester, a cattle pen and a toilet are all installed inside a greenhouse, which is also used for vegetable or fruit production. In these colder regions, the higher temperature in a greenhouse enhances biogas production, animal growth and vegetable production.
● The ‘five-in-one’ model in northwest China. De-signed for arid areas with water shortages and long, cold winters, this is similar to the ‘four-in-one’ model, except that the greenhouse is used as a warm enclosure for livestock, and a rainwater
collection cellar is included to meet the water needs of the household and to support biogas production
China has some 1,000 gasification installations, mainly downdraft gasifiers that provide villages with gas for cooking (Chen, 2011). Current developments focus on larger installations with 10-15 MWe capacity, mostly flu-idised beds and circulating fluidised bed units.
Investment in biogas as a source of energy has other spin-off benefits such as an increase in agricultural production
Liquid biofuel use is rather small compared with other forms of biomass in China. The target is to produce 5 billion litres of ethanol and 1.2 billion litres of biodiesel a year by 2015.
Ethanol is produced from corn, wheat and non-grain feedstocks. Biodiesel is largely produced from used cooking oil, waste animal fats and wild oilseed plants (Qiu et al., 2012). The emphasis is on the use of lignocel-lulosic crops to avoid competition with food produc-tion. In 2012, there were 159 ethanol plants recorded in China, of which five are licensed to produce fuel ethanol (see Table 3) (Qiu et al., 2012; USDA, 2013). The plant in Guangxi is the first cassava plant worldwide; it was built in 2007 (USDA, 2013). The only government-approved, cellulosic ethanol plant in operation is in Shandong province. The facility has been operating since October 2012 and produces ethanol from corn cobs, with a to-tal production capacity of 50 kt/year. In 2012, a sweet sorghum-based plant was built in Inner Mongolia with a total production capacity of 50 kt/y; this capacity is pro-jected to reach 100 kt/year by 2015 (USDA, 2012;2013).
Table 3: Five largest ethanol plants in China
Location Production capacity (kt/year) Production (2008) (kt/year)
Feedstock
Jilin 500 450 Maize
Heilongjiang 400 140 Maize
Henan 450 440 Wheat/maize
Anhui 320 320 Maize
Guangxi 200 150 Cassava
Source: Based on Qiu et al. (2012)

Renewable Energy Prospects: China24
For biodiesel, the industry is lobbying the government to make the tax exemption on biodiesel (5%) from waste cooking oil permanent (USDA, 2012).
Biofuel policies in China targets production from feedstocks that do not compete with crops for human consumption
Solar thermal and geothermal also play a role in China in meeting heating and cooling demand. 1,000 geother-mal projects are planned with a heating/cooling area of 50 million m2 while 100 solar thermal heating projects are planned with an area of 1 million m2.
In 2010, China had an installed solar thermal capacity in operation of 130 GWth, which increased to 152 GWth in 2011. By 2012, installed capacity had reached 180 GWth. This was equivalent to 67% of the global total. The majority of the installed capacity by 2012 was accounted for by evacuated tube collectors (ETC) (168 GWth). The remaining 12 GWth is flat plate collectors (FPC) (CNREC, 2013a; AEE-INTEC, 2014).
According to the “2005 Chinese Geothermal Environ-ment Bulletin” released by the Ministry of Land and Resources of China, the direct utilisation of geothermal energy for non-electric purposes reached 10.5 GWh/year. In 2005, installed geothermal energy capacity reached 10,779 MWe (Delman and Chen, 2008). The installed capacity of direct use geothermal plants as of end-2011 was 8.9 GWth which generated about 75 PJ of geothermal heat. The use of geothermal heat pumps (GHP) has grown substantially, with installed capacity reaching 5.2 GWth by the end of 2009 (IEA-GIA, 2013). According to IEA energy statistics (IEA, 2013), geother-mal heat consumption in 2010 was 150 PJ/year. 80 PJ of this was in the residential sector, 44 PJ in commercial buildings and 6 PJ in industry.
Renewables make up a negligible share of total district heat generation (less than 1%) today. The majority of the demand is met by coal. Given the country’s increasing heating demand and technologies available, there is considerable potential for various forms of renewables to play a bigger role.
Electric vehicles
According to the Ministry of Science and Technology’s 12th FYP for electric vehicles and the State Council’s
Energy-Saving and New Energy Automotive Industry Development Plan (2012-2020) which were released in 2012, by 2015, 500 000 electric and plug-in hybrid vehicles are expected to be on the road. This will be sup-ported with 400 000 charging piles and 2 000 charging or battery-switching stations. The nation aims to have 5 million electric and plug-in hybrid vehicles on the road by 2020, less than 3% of all vehicles. Of global annual sales of between 20 and 30 million, more than 90% were in China. In 2010, the total number of electric two -wheelers reached more than 200 million (IEA-ETSAP, 2013).
In September 2013, the Ministry of Finance, the Minis-try of Science & Technology, the Ministry of Industry & Information Technology and the National Development & Reform Commission (NDRC) issued a joint decision approved by the State Council on the extension of sub-sidies for three years from 2013 to 2015 to promote new energy vehicles.
The new subsidy scheme has three main attributes: 1) it expands the scope of pilot cities to 88 across the country, particularly those cities where fine particle pol-lution has posed a serious threat to public health; 2) it provides differentiated subsidies for different types of new energy vehicles; 3) degressive rates of 10% and 20% will be applied to all electric vehicles and plug-in hybrid vehicles excepting buses for 2014 and 2015, respectively from the 2013 subsidy level. In addition, the new subsidy policy unifies the subsidies of all regions, changing the previous situation where subsidies varied across the country.
In July 2014, the State Council issued its Guidance on Accelerating the Use of New Energy Vehicles. The docu-ment proposes waiving a 10% purchase tax for eligible vehicles including electric vehicles, plug-in vehicles and fuel-cell vehicles from 1 September 2014 to 31 December 2017. It is hoped that the reduced purchase cost will make the new energy vehicles more financially attrac-tive. In particular, emphasis was placed on the need for the rapid development of charging infrastructure and the creation of new business models. The council also requested relevant authorities to present proposals for a fiscal stimulus policy for 2016-2020 by the end of 2014.
The output of the 628 models identified in the directory of recommended energy-saving and new energy vehi-cles of the Ministry of Industry and Information Technol-

Renewable Energy Prospects: China 25
ogy reached 24 800 in 2012. This increase is equivalent to 94% per year, and in 2012 included 13 300 electric vehicles, 10 400 conventional hybrid vehicles, and more than 1 000 plug-in hybrid vehicles. Efforts need to be accelerated further to meet government targets.
The total annual amount of new energy vehicles de-ployed in the 25 pilot cities (under the “10 Cities and 1 000 Vehicles” programme) remained at 10 000. This is much lower than the initial goals set by some cities, where the total number of new energy vehicles to be reached was 30 000 within four years. By the end of 2012, more than 27 000 new energy vehicles were on the road in the 25 cities after two years following the implementation of the subsidy policy. Most of these are public vehicles. This is more than half of the goal, and two main factors explain the lacklustre progress:
● First, like elsewhere at present, electric vehicles are relatively expensive in China. Even with subsidies of RMB 120 000 (about USD 17 650) and up to RMB 60 000 RMB (about USD 8 800) from central and local governments (the highest local subsidy exists in Shenzen), the off-the-lot price of a BYD E6 (a popular Chinese-made electric vehicle) is between RMB 170 000 and RMB 180 000 (USD 25 000-26 500). That is twice the price of a conventional internal combustion engine vehicle with similar configuration and performance. As a result, demand is still weak among private consumers.
● Current charging infrastructure does not meet recent trends in demand and more investments are needed if the targets are to be reached. By the end of 2012, the 25 pilot cities had only 8 107 charging piles and 174 charging or battery-switching stations. For example, the number of street charging piles in Shenzen reached 1 000 in April 2013. This is much lower compared to the target to surpass 40 000 by 2012. By end of 2012, 60 charging or battery switching stations and 1 080 charging piles were built. Similarly, this is also much lower than the goals of 256 stations and 42 000 piles by 2015. According to the infor-mation from the State Grid Corporation of China and China Southern Power Grid, only 4% and 13% of the 2015 targets were achieved by 2011 for charging piles and charging or switching sta-tions, respectively. As a result of the shortage and uneven distribution of charging facilities, varying
technology preference and interests between the state grid (favouring battery switching solu-tions) and most automobile companies (prefer-ring charging solutions), makes it inconvenient to own an electric vehicle.
China’s electric vehicle deployment have benefited from ambitious targets and government support in recent years. However, without further coordination of the market and policy incentives by the government, the industry’s future will remain unclear (WRI, 2013a).
Despite attempts to encourage people to buy electric vehicles, their high cost and poor infrastructure have hampered efforts to introduce them
China is also aiming for 30% of new government ve-hicles to be powered by alternative forms of energy by 2016. At least 15% of new vehicles introduced in in 2014 in places such as Beijing and the Pearl River Delta will use new energy. The cabinet announced a new ex-emption law which will apply from 1 September 2014 for battery electric and hybrid vehicles. The law will run until the end of 2017. China will offer subsidies for new-energy vehicles that cost below USD 29 000 and also request local governments to build more facilities (Spiegel, 2014; BNEF, 2014a).
In China, there are also electric vehicle technologies oth-er than cars. K9 is an electric bus manufactured by BYD and it is powered by iron-phosphate battery developed by the manufacturing company. On one single charge, it drives 250 km under urban road conditions. On Sep-tember 2010, the first BYD electric bus was on the road in Changsha city in Hunan province. By the end of 2012, more than 1 200 electric bus offers were received by the BYD from countries across the world (BYD, 2013). Production costs are expected to drop as the company escalates output.
Anhui Ankai Automobile Co., Ltd. is another company producing buses. 44 hybrid and electric buses were in-corporated in the ministry’s directory of recommended new energy and energy-saving vehicles. The company is one of the leading players in the domestic new energy bus sector. By end of 2012, in 27 cities including Beijing, Shanghai, Dalian and Hefei, 1 000 new energy buses were on the road which were manufactured by Ankai (Reports, 2013).

Renewable Energy Prospects: China26
While electric cars have proved hard to introduce, by contrast electric two-wheelers (e-bicycles, e-scooters and e-motorcycles) are rapidly gaining ground. Of global annual sales of two- and three-wheelers between 20 and 30 million, more than 90% were in China. In 2010, the to-tal number of electric two -wheelers reached more than 200 million (IEA-ETSAP, 2013). E-bicycles account for more than three quarters of the market. By 2018, China will have 355 million cumulative sales of such products. This means one vehicle per four persons. To some extent these vehicles substitute cars (GCC, 2012).
The use of urban rail transport is also growing. There were 1,688 kilometres (km) of operating metro railway in 14 cities at the end of 2011. By 2015, there will be 3000 km of metro railway, and by 2020 6200 km are planned. By 2050, mainland cities will have 11700 km of metro railway, accounting for at least half the world’s total (SCMP, 2013).
In Beijing around 40% of all passengers use public transportation, compared with 25% in Shanghai and Kunming. This percentage has been rising in Beijing and Kunming (Yang, 2013).
An aspiration is that by 2030, 39% of all city transporta-tion will consist of cars and 29% of buses; others include two-wheelers (15%), subways (4%) and walking (13%) (Yang, 2013). Within the car park the share of internal combustion engine and hybrid cars would decline to 85%, the remainder including around 7% electric vehi-cles as well as other technologies (Yang, 2013).
Transmission and distribution grids
China has five state-owned power generation com-panies: CDC: China Datang Co.; CGC: China Guodian Co.; CHDC: China Huadian Co.; CHNG: China Huaneng Group; and, CPIC: China Power Investment Co.
China also has two state-owned grid companies, State Grid Corporation of China (SGCC) and China Southern Power Grid Corporation (CSG). SGCC accounts for ap-proximately 80% of the total grid. CSG has the remain-ing 20%. These two companies cover almost all power transmission, distribution, and metering activities in China. SGCC is the largest, covering 26 provinces, whilst CSG covers five provinces in the south.
SGCC is the biggest utility company worldwide. SGCC’s core business is to build and operate power grids; the service area covers 26 of 31 provinces and oversees 88% of China’s territory. By the end of 2013, the installed capacity of SGCC was more than 900 GWe (4,448 TWh generation) and the maximum peak load reached 654 GWe. Coal power accounted for 73.6% of installed capacity, hydro 18%, and wind 7% (70.2 GWe).
China’s power system consists of six regional clusters with weak interconnectors (The north, northeast, north-west, central, eastern and the south regions). Each clus-ter consists of several provinces that act as a balancing area. There are interconnection lines that facilitate trade within the regional clusters.
Table 4: Regional power generation capacities and peak demand of the State Grid Corporation of China
Installed capacity (GWe) Peak demand (GWe)
North China 201 188
North East China 112 52
North West China 123 66
Central China 248 149
Eastern China 243 215
Total 927 654
Based on SGCC (2013)
Note: data represents the situation end of August 2013

Renewable Energy Prospects: China 27
In terms of dispatch and planning, six regional grids and the provinces which belong to them have considerable autonomy. This creates opportunities for local influence on grid operation although, under this system, transmis-sion projects may be underutilised.
Thermal power plants are assigned a fixed number of full load hours every year and the volume of inter-provincial trading is decided a year ahead. Day-ahead dispatching takes these two rules into account. There are fiscal incentives to maximize local production. The variability of wind power, notably, interferes with the al-location of full load hours and trading practices.
Peak loading and transmission constraints make it hard to transport power into high consumption areas. The current transmission system was designed to accom-modate a base load and slowly varying output of coal power. Transmission lines in China reach an annual peak loading on average of 50% of capacity. However, this
average can be misleading because many lines are at full capacity while others are operating sometimes with nearly no capacity (DB, 2012).
Sustained electricity growth requires both long-distance and higher capacity transmission. This is particularly important for China where resource potential is widely distributed and far from demand centres. As a result of concerns over air pollution, railway congestion, and to be able to meet the increasing growth of electricity de-mand, north and western parts of China are becoming electricity production centres.
The China Electricity Council, in its 2014 projections and recommendations, focused on the northeast’s excess capacity problem, recommending that the central gov-ernment “strictly control” new coal and wind construc-tion in the region. It projected a smaller (though still substantial) increase in coal-fired capacity nationwide of 30 GWe. CEC’s other projections for new installations
Figure 7: Installed capacity and peak load of State Grid Corporation of China
西藏�网 East China
North East
SCG
C/L 112GW/52GW
C/L 123 GW/66GW
C/L 248 GW/149GW
Installed Capacity and Peak Load 201 GW/188GW
C/L 243GW/215GW
Tibet
North China
North West
Central China
Note: data represents the situation end of August 2013
Source: SGCC (2013)
Renewable Energy Prospects: China28
in 2014: 23 GWe hydro, 17 GWe wind, 14 GWe solar, 6 GWe nuclear and 5 GWe gas.
Investment in long-distance and higher capacity transmission networks is essential for sustained electricity growth in China
With the air pollution plan, 12 west-east “air pollution control transmission corridors” are being planned. These will reduce coal-fired electricity generation in eastern parts of China where population is high. In the south-ern lines, hydro will be primarily connected whereas in the northern lines wind and coal will be bundled as they originate in areas of development of both energy sources.
A synchronised UHV alternating current (UHV-AC) grid could lead to more centralised control of the national power system. In comparison, an asynchronous UHV direct current (UHV-DC) grid would not necessarily dis-turb the current setup, and it is seen as a hedge against greater monopolisation (Davidson, 2014).
UHV-AC is planned to connect north and central grids (Huainan-Shanghai). UHV-DC is planned to connect the power generation in the west with centres of demand in the east (Hami-Zhengzhou). Total UHV transmission grid capacity is projected to increase to 200 GWe by 2020 (10-15% of total generation capacity). Meanwhile, a UHV-AC synchronous grid is planned for northern, cen-tral and southern areas. The UHV grid lines in China use 900 kV, the highest rating in the world. The grid will give shape to a system of three vertical and three horizontal
axes. The vertical, north-south axis will connect the big-gest coal and wind production areas of Inner Mongolia, Shanxi and Shaanxi to the north central and eastern parts of the country.
An ultra-high transmission corridor to increase the in-tegration of renewable energy resources is outlined in China’s 12th FYP. The 2090-km-long 800 kV UHV-DC Jinping-Sunan transmission line is the second largest in the world, allowing 7.2 GWe to be transmitted, and is owned by SGCC. The project cost USD 3.5 billion, and transports hydroelectricity from power stations along the Yalong river in Sichuan province to the industrialised coastal area of Jiangsu. This power line was built by ABB together with CEPRI and other Chinese partners. And even higher capacities are being developed. The third largest UHVDC transmission network in the world is also in China, comprising the 1980-km-long line that con-nects the Xiangjiaba hydroelectricity plant to industrial users around Shanghai with a rated capacity of 6.4 GWe. It was the first such commercial operation in the world, and completed 30 months ahead of schedule. There are also projects to integrate these HVDC lines into a HVAC grid based on technology by CEPRI.
The latest development suggests that SGCC will spend an additional USD 162.8 billion on eight UHV transmis-sion lines to be built before 2021, both for renewables and coal-fired power stations located further away from the big cities. Another estimate states that by 2020, China would be spending about USD 107 billion in UHV transmission lines and related capacity. Investment in end-points of the transmission lines account for around half of the total investments, for both AC and DC, and
Box 1: Rural grids and mini-gridsSince the 1950s, China has pursued the development of small hydroelectricity plants, firstly in terms of stand-alone projects and later those connected to the national grid as it expanded. In 2002, there were 42,000 small hydroelectricity plants with a total capacity of 28 GWe providing distributed energy. Today, China has roughly 60,000 diesel and hydro mini-grid systems, most of which have been connected to the centralized grid. Be-tween 2003 and 2005, China’s Township Electrification Programme constructed 721 solar PV and PV/wind hybrid systems (20 MWe) along with 146 small hydro stations (264 MWe) to provide electricity to 1.3 million people (LBNL, 2013). A Village Electrification Programme, implemented between 2005 and 2010, connected another 3.5 million people to renewable sources of energy. By the end of 2015, China aims to address the challenge of providing power to another 2.73 million people without electricity, including 1.54 million by grid extension and 1.19 million by independent solar PV power supply utilisation. By the end of 2008, there were more than 400,000 off-grid solar home systems in China (IRENA, forthcoming).

Renewable Energy Prospects: China 29
include transformers, reactive power control devices, circuit breakers, isolation switches, surge arrestors and other related subsystems. The remaining half consists of the cables, insulators and towers (DB, 2012).
Renewables such as pumped hydro can play a key role in balancing output, although there is no scope for arbitrage unless price flexibility is introduced
In addition to these considerable developments in grid expansion, technologies for accommodating the in-creasing share of variable renewables will gain further importance. Pumped hydro can play an important role in balancing variable renewables. However, in the cur-rent system there is no possibility for arbitrage as elec-tricity prices are set by the state and there is no special price for electricity from pumped hydro.
China has over 20 GWe of pumped hydro installed and more than 9 GWe is under construction (see Table 5). Another 120-130 GWe of pumped hydro projects are in the planning stage; the target for 2030 is more than 100 GWe (Perera, 2014). Pumped hydro can help to stabilise power generation from variable renewables.
Total pumped hydro capacity is more or less equally distributed across China’s eastern, southern, northern and central provinces (Perera, 2014).
The development of the smart grid is also very impor-tant to achieve the aims of the 12th FYP, which mandates that 15% of the primary energy consumption has to be provided by non-fossil fuels in order to reduce carbon emissions. The supply and demand of power through the national distribution network are managed more effectively with smart grids. For doing so, smart grids introduce high-tech communications to the system. They also accommodate renewable power sources such as solar and wind more efficiently.
For the future, China has developed a smart grid plan which will be gradually deployed in three phases; con-struction investment entered a large-scale phase in 2012. Since 2009, some 298 demonstration projects have been set up across China (SGCC, 2014). As of 2011, eight substations adapted to smart gird technology had been constructed in regions including Beijing, Shanghai and Chongqin. Also in 2011, the State Grid Company deployed more than 50 million smart meters (ESTELA, 2011).
Table 5: Installed and under construction pumped hydroelectricity
Installed (MWe) Under construction (MWe)
North China 4 300 1 200East China 5 860 4 360Central China 3 790 1 200Northeast 1 500 –Northwest 90 –South 4 800 2 480Total 20 340 9 240
Source: Based on Perera (2014)
Note: data represents the situation end of August 2013
Table 6: Operating performance of pumped hydro plants, 2008 and 2012
2008 2012Average capacity factor (hours/year) 2 649 1 450
Capacity factors (%) 30.2 16.5
Average standby (hours/year) 5 350 6 266
Planned outage (hours/year) 689 849
Source: Based on Perera (2014)

Renewable Energy Prospects: China30
It is worth noting that China’s smart grid development is different from others in the West. In the USA and the EU, for example, the well-established power systems have little or flat future demand for electricity and thereby the focus of smart grid development is on distribu-tion networks. By comparison, in China the focus is on backbone transmission networks due to the continued growth of electricity demand and the mismatch of gen-erators and load centres.
Regarding smart grids for renewables, there are a num-ber of activities that have been promoted. One of the key applications (in terms of investment streams) has been the deployment of smart meters. China has just under 250 million smart meters installed (Worldwatch, 2014). Another area that has been promoted is wind
forecasting to support renewable energy grid integra-tion. There are plans to provide wind forecast data with high spatial and time resolutions (9 km grid, every 5 minutes).
China has more than 250 million smart meters installed, twice as many as the total number of households in the USA
There are also a large number of demonstration pro-jects on smart grid development for renewable energy integration. For example, the Zhangbei Demonstration Project includes 100 MWe of wind, 40 MWe of PV, and 14 MWe of storage combined with smart substations, intelligent control systems, and forecasting methods.
Table 7: China’s three stage smart grid plan
Stages Title Target
Stage 1 (2009-2012)Planning and trial phase
Establishing master plan, carry out key technology research and key equipment development, and proceed with demonstration projects
Stage 2 (2011-2015)Full scale construction phase
Formulate standards and requirements for strong and smart grid, to evaluate construction progress based on the needs and technical development of smart grid and construct smart grid in full scale
Stage 3 (2016-2020)Leading and enhancing phase
Evaluate contraction of smart grid in full range
Source: Based on ESTELA (2011)
Table 8: China’s estimated annual CO2 reductions from strong, smart grid
Mechanism 2005 Figure
2020 Figure
Diference between 2020 and 2005
figures
Avoided CO2 emissions
2020 (Mt CO2)
Raising the consumption of “clean energy”
39 GWe 411 GWe 320 GWe 1,018
Decrease in transmission losses
6.59% 5.7% Save 14.17 million TCE 39
Increase efficiency of coal burning for generation
343 grams/kWh 305 grams/kWh38 grams/kWh; save 189 Mtce
524
Increase in energy efficiency of electricity sector and consumers
18% of consumer energy consumption
is in the form of electricity
26% of consumer energy consumption will be in the form of
electricity
N/ANot yet
calculated
Promotion of electric vehicles
30 000 000 EVs35.5 million tonnes of
petrol use will be avoided68.7
Total 1,649
Source: Based on Lu (2010)

Renewable Energy Prospects: China 31
4 REFERENCE CASE DEVELOPMENTS TO 2030
China’s TFEC is projected to increase from 57 EJ in 2010 to 92 EJ in 2030 (3,130 Mtce). This is an increase of 60% in 20 years. Total fossil fuel demand is expected to increase at a slower rate of 40%. Much of the shortfall is accounted for by a fourfold increase in natural gas demand over the same period. Demand for coal would only increase by 13%.
In the Reference Case, total power generation is expect-ed to more than double (by at least 5 000 TWh) from 4 200 TWh/year in 2010 to approximately 9 300 TWh/year by 2030 (Figure 9). Renewable power generation is projected to increase from about 800 TWh to more than 2 600 TWh. By 2030, hydroelectricity generation will total 1 600 TWh followed by wind with 650 TWh, solar PV and CSP 200 TWh and finally biomass with 190 TWh. Hydroelectricity includes an additional 200 TWh that is related to the increased use of electricity-based technologies in end-use sectors sourcing demand from
This section explains the Reference Case renewable en-ergy trends in China between 2010 and 2030.
The REmap analysis begins with an assessment of the uptake of renewable energy technology options be-tween 2010 and 2030 based on current policies. IEA (2012a) and CNREC estimates are used to develop the Reference Case for the REmap analysis of China. To put this Reference Case in perspective, this section begins with a brief timeline of China’s primary energy demand developments since 1990 (see Figure 8).
The exponential growth in total primary energy supply between 1990 and 2010 will slow down in the following two decades to 2030. Coal consumption will flatten or increase only slightly with most consumption being in natural gas, followed by oil and nuclear power. Growth in other renewables (solar, wind), bioenergy and hydro will follow.
Figure 8: Growth of the total primary energy supply in China, 1990-2030
0
20
40
60
80
100
120
140
160
180
Tota
l prim
ary
ener
gy s
uppl
y (E
J/ye
ar)
Coal Oil Gas Nuclear Hydro Bioenergy Other renewables
1990
1992
1994
1996
1998
2000
2004
2006
2008
2010
20
12 20
14
2016
20
18 20
20
2022
20
2420
2620
2820
30
2002
Source: IRENA analysis based on IEA (2012a;2013b)

Renewable Energy Prospects: China32
renewable power according to the Reference Case, such as heat pumps and electro mobility.
Total renewable energy demand in end-use sectors (excluding renewable electricity and district heat) will see an increase from about 5 EJ/year to 7 EJ/year
(Figure 10). This includes developments in the tradi-tional use of biomass where its demand decreases from 3 400 PJ/year in 2010 to 1 000 PJ/year. As a result of this decrease, total bioenergy demand for heating decreases from 4 000 PJ to around 3 200 PJ per year. Growth is projected in all other resources as well. Solar
Figure 9: Reference Case power generation growth
0
200
400
600
800
1000
1200
1400
1600
1800
Hydroelectricity Wind Solid biomass & biogas Solar PV Geothermal
Pow
er g
ener
atio
n (T
Wh/
year
)
2010 2020 2030
Source: IRENA analysis based on IEA (2012a) and CNREC
Figure 10: Reference Case growth of renewable energy in end-use sectors
0
500
1000
1500
2000
2500
3000
3500
4000
4500
Biomass heat/cooking(incl. traditional biomass)
Solar thermal heat Liquid & gaseous biofuels Geothermal
Fuel
con
sum
ptio
n in
end
-use
sec
tors
(PJ/
year
)
2010 2020 2030
Source: IRENA estimates based on IEA (2012a) and CNREC

Renewable Energy Prospects: China 33
thermal increases by a factor of more than three in the entire period, from 860 PJ to 2 700 PJ per year. All this growth is accounted for by the building sector. Geother-mal heat doubles from 150 PJ to 300 PJ, but its contribu-tion to the total renewable energy share consumption still remains small.
Modern forms of solid biomass use increase by four times, from 500 PJ per year to 2,200 PJ/year. The high-est rate of growth is projected for the manufacturing industry sector, from a total use of 100 PJ/year in the pulp and paper sector alone to 700 PJ/year including its other sub-sectors. Solid biomass in the form of bri-quettes and pellets triples by 2030 compared to with 2010 levels to 1,500 PJ/year. Liquid biofuel and biogas use increases to 2 EJ in 2030.
Further electrification of the transport industry will help increase the share of renewable energy used by the sector
Liquid biofuels use increases from a total of 2.5 Mt to 30 Mt per year in 2030, or from about 2 billion litres to a total of about 23 billion litres in 2030. This is a con-tinuation of the trends between 2010 and 2020 biofuel targets of 12 Mt per year (10 Mt bioethanol and 2 Mt bio-diesel) to 2030. The number of electric vehicles (battery
and plug-in hybrid) is projected to increase from about 30,000 to nearly 17 million. This represents a 3% share of the total vehicle stock. The number of electric two- and three-wheelers is projected to double to 400 million.
Further electrification is key for the transport sector of China. The renewable energy share of 3.5% in 2030 Reference Case with liquid biofuels only, would increase to 5.2% when electricity use for transportation and the related share of renewable electricity is accounted for.
Modern renewable energy as a percentage of TFEC will increase from 7.1% in 2010 to 15.8% by 2030 (excluding traditional use of biomass) (Figure 11). The increase in the Reference Case renewable energy share will be driven mostly by an increase of renewable power generation from 19% in 2010 to 29% in 2030. The transport sector will see an increase of renewable energy from 1% to 4% by 2030, in the form of biofuels but also partly electrification. The share of modern renewable energy use in the industry sector will increase from 4.9% to 11.4% and in the buildings sector from 15.5% to 35% by 2030, both largely driven by biomass. The rapid growth of renewables in the power sector is balanced by the trends in the end-use sectors. The renewable energy share of district heat generation remains the same across the entire period.
Figure 11: China Reference Case – Renewable energy in TFEC
0%
5%
10%
15%
20%
25%
30%
35%
40%
2010 2020 2030
Rene
wab
le e
nerg
y sh
are
in T
FEC
Industry Buildings (excl. traditional biomass) Transport
Electricity District heat Total
Source: IRENA analysis based on IEA (2012a) and CNREC

Renewable Energy Prospects: China34
5 CURRENT POLICY FRAMEWORK
To keep the balance between supply and fast-increasing demand while improving security of supply presents a major challenge which it is only possible to overcome with a whole range of different policies. These are dis-cussed later in this report in Sections 8 and 9.
5.1 Airborne Pollution Prevention and Control Action Plan
Air pollution and its effects on health and the economy are a serious concern for China. According to some es-timates, the total number of mortalities from ambient air pollution (particulate matter and ozone pollution) reached approximately 1.2 million in 2010. China has suc-ceeded in reducing PM levels substantially and slowing the increase in mortalities, but further reductions remain a challenge (OECD, 2014). PM concentration varies across the country; according to 2005 statistics cities in the north have much higher levels (85-160 µg/m3) compared with urban areas in the south (47-125 µg/m3). Based on the analysis of trends between 1975 and 2005, Matus et al. (2012) estimate that ozone and PM concen-trations resulted in a USD 16-69 billion loss of consump-tion and USD 22-112 billion loss of welfare in China’s economy. Besides the effects on human health, research shows that air pollution has also significant impacts on agricultural production. A global risk assessment shows that local crop loss from sulphur dioxide emissions could be an important issue for countries such as China and India (Marshall, Ashmore and Hinchcliffe, 1997).
In response to these concerns, China’s State Council released its Action Plan for Air Pollution Prevention and Control on 12 September 2013. The plan focuses on three key regions, namely the Beijing-Tianjin-Hebei area (Jing-Jin-Ji), the Yangtze River Delta and the Pearl River Delta, and sets targets for the next five years.
The Chinese government recognises that tackling the air pollution crisis will require significant reductions in coal consumption. For the first time, its plans introduce coal consumption caps for provinces. Furthermore, many provinces have been committed since 2013 to reversing the rapid growth in coal use and cutting their overall
Key points
● Renewable energy policy in China has been largely driven by rapidly rising energy demand, reflecting economic growth and related supply-security concerns at a national level.
● Renewables will also play a key role in raising the use of non-coal and non-fossil-fuel sources as a proportion of total energy demand, according to the Action Plan for Air Pollution Prevention and Control.
● At a provincial level, renewable energy targets and the related Renewable Energy Law, which consists of a feed-in-tariff and mandatory grid connection, are key instruments to help increase the use of renewable sources for the power sec-tor.
● Specific support programmes for the expansion of the domestic renewable industry – especially wind and solar PV – focus on research and devel-opment (R&D) as well as an increase in manufac-turing capacity.
● Mandatory market shares – also known as “re-newable portfolio standards” – for utility and grid operators are under discussion, with the possibil-ity of a programme being implemented by 2015.
● Future caps on coal consumption for the whole of China, as well as for specific provinces, may also help the uptake of renewable energy op-tions.
● Grid expansion plans are being implemented, and a smart grid programme is under develop-ment. However, there is no concerted power-grid policy for renewable energy yet.
● Renewable heating policy specifically focuses on solar water heating, while transport sector policy is mostly concentrated on direct subsidies for electric vehicles.
China’s energy demand has grown significantly over the past decade due to rapid economic development. This section starts with an overview of one of the main driv-ers in China’s renewable energy policy – air pollution, and it continues by providing further insight to the poli-cies across all sectors – power, buildings and transport – but puts a clear focus on the renewable power sector.

Renewable Energy Prospects: China 35
coal consumption in just four years. No other major coal-consuming country has ever implemented such ambitious targets. If achieved, the measures will not only fundamentally shift the coal consumption trajec-tory of the world’s largest coal consumer, but also sig-nificantly re-shape the global CO2 emission landscape.
Tackling China’s air pollution crisis will require significant reductions in coal consumption. Shandong province alone burns more coal than Germany and Japan combined
A large share of China’s total coal consumption is covered by the targets. Shandong is the largest coal consumer among Chinese provinces and Hebei ranks fourth. Shaanxi is among the ten provinces that con-sume the most coal. Another two key economic regions – the Yangtze River Delta, comprising Shanghai, Ji-angsu, and Zhejiang, with 11% of national coal consump-tion, and the Pearl River Delta – are aiming for absolute reductions in coal use by the end of 2017.
Liaoning and Jilin will also have to limit growth in their coal consumption to less than 2% per year by 2017. Until recently, with the exception of Beijing, all provinces which were covered by the plan have seen coal con-sumption grow rapidly.
The plan aims to reduce the share of coal in total en-ergy consumption to 65% by 2017, with the share of non-fossil energy reaching 13%. Natural gas will be a key substitute for coal in the generation of power and heat. Twelve provinces which account for 44% of China’s total consumption committed to implement measure to control coal consumption. Six provinces have included absolute targets in their plans, with a 50% reduction targeted in Beijing, 13% in Hebei, 19% in Tianjin, 5% in Shandong, 21% in Chongqing and 13% in Shaanxi by the end of 2017. Beijing is also planning to ban the use of coal by 2020 (Huffington Post, 2014).
While the current air pollution plan runs until 2017, further action could be taken in a review scheduled for 2015, as well as the upcoming FYP for the years 2016-
Box 2: Implications of changes in coal-based power production on water demandChanges in coal use could have considerable implications for China’s water resources. Today, 85% of the country’s total power generation capacity is located in water-scarce regions and 15% of this capacity relies on water-intensive technologies. Northern China in particular is suffering from high demand for water from the coal supply sector. Currently, more than half of China’s industrial water usage is in coal-related sectors, including mining, preparation, power generation, coke production and coal-to-chemical factories. Coal min-ing and coal power generation sectors in the north accounted for 15% of China’s total freshwater withdrawals (98 billion m3) in 2010 (SA, 2013). National water consumption is projected to increase from 599 billion m3 to 630 billion m3 by 2020. By then, the coal sector will be responsible for 27% of withdrawals, with an estimated 34 billion m3 of water per year used by coal-fired power plants alone.
The coal challenge is exacerbated by the fact that almost all of the collieries are in the northwest, which is also one of the country’s driest regions. Coal expansion plans imply that the equivalent of a quarter of the water in the Yellow River would be needed (ca. 10 billion m3/year). This water is not available. Of the planned coal power expansion plans, half are located in high or extremely high water-stressed regions (WRI, 2013b).
Various plans such as water diversion from the south to the north, seawater desalination, east-west pipelines and dry cooling for coal plants (substituting water cooling) are being considered. The South-to-North Water Diversion Project, planned for completion in 2050, will eventually divert 44.8 billion m3/year to the north. The Hami and Tianshan power plants will have air cooling systems by the end of 2014, as will another plant next year in Junzheng Wuhai (PE, 2013). However, dry cooling reduces the efficiency of coal power plants, rais-ing their generation costs. Moreover the quantities involved are too small to make a significant difference to China’s overall water consumption.

Renewable Energy Prospects: China36
2020. Coal caps could be introduced to a number of other key provinces, which would also ensure that pol-luting industries do not simply relocate to areas without coal reduction policies. In addition to these twelve prov-inces, 17 others announced intentions to cap or reduce coal use.
The change of direction is showing results. New capac-ity additions in power generation have begun to follow a new trajectory, with coal accounting for only 26% of new investments as of 2012, while non-fossil sources – hydro, wind, nuclear – made up 72%. In 2012, China added 12 TWh of coal, 26 TWh of wind, and 196 TWh of hydro.
This trend is encouraging, but major effects on air pol-lution levels remain to be seen. Out of the 161 cities monitored in the first half of 2014, only nine of them meet China’s new air quality standards. One of those cities which did not meet the targets was Beijing, due to its high levels of PM2.5 and other pollutants (NY, 2014). In February 2014, the concentration of PM2.5 had reached 505 micrograms per cubic metre, which is sufficient to penetrate into the lungs and the bloodstream (Guard-ian, 2014).
5.2 Renewable energy policy of China
The development of new renewable energy policies can be traced back to 2004, when China announced plans to develop a renewable energy law and to establish a renewable energy development fund16. At the outset, ‘small-hydro’ and small-scale solar PV were identified as key areas for the encouragement of decentralised projects.
The establishment of the CNREC – developed in close cooperation with Denmark – was another national mile-stone. This institution assists China’s energy authorities in renewable energy policy research, industrial man-agement and coordination. China’s 12th FYP, which was launched in 2010, was the first time renewables were identified as an emerging strategic industry.
16 At the “Renewables 2004” conference in Bonn, Germany in June 2004, a follow-up to the 2002 World Summit for Sustainable De-velopment (WSSD).
The main components of China’s renewable energy policy are as follows (Zhang et al., 2013):
● Mandatory market share for renewables by sec-tor and technology
● Tariff based support mechanisms ● Government financial support for renewable en-
ergy projects
Each component is discussed below in more detail.
Mandatory market share (MMS)
The National Development & Reform Commission (NDRC) introduced mandatory market share (MMS, or “renewable portfolio standards” as they are called in the United States) in 2007 in China, linked to the country’s mid-term (2007-2010) and long-term (until 2020) de-velopment plans for renewable energy. The NDRC is a ministry in the central government that is responsible for planning the economic development of the country, and it has been assigned the responsibility for energy and climate change (Lo et al., 2014).
In regions served by centralised power grids, the share of power generation form non-hydro renewable sources should reach 1% of the total by 2010 and 3% by 2020 ac-cording to the plan. Furthermore, power producers with a capacity larger than 5 GWe must increase its actual ownership of power capacity from non-hydro renew-able energy sources to 3% by 2010 and 8% by 2020 (NPC, 2013; Zhang et al., 2013).
Many aspects of the policy have yet to be put into prac-tice, according to Lo et al. (2014). As of 2010, none of the six largest generators had met the 3% renewable energy target, partly due to the lack of monitoring and compli-ance requirements. Furthermore, the focus of MMS is on installed capacity rather than generation. Therefore, there was no incentive for grid companies to act.
To address these problems, the NDRC began to develop an improvement plan in 2011. A four-step programme was developed which introduced changes and addition-al details to improve the renewable portfolio standard (Lo et al., 2014). These included the following:
Individual targets would be assigned to generators and grid companies, depending on their circumstances and

Renewable Energy Prospects: China 37
Box 3: Renewable energy targets in ChinaChina’s 12th FYP identified renewables as an emerging strategic industry and set overall targets for renewables. Table 9 below lists the different sectorial and/or technology targets for 2015 and 2020.
The Chinese government also released targets for renewable energy use under the current 12th FYP. The over-all goal is for total modern renewable energy consumption to reach 14 EJ (478 Mtce), representing 9.5% or more of the overall energy consumption mix by the end of 2015 (this excludes the traditional use of biomass) (CNREC, 2012). In January 2012, as part of its 12th FYP, China published a report on greenhouse emissions control, which establishes goals of reducing carbon intensity by 17% by 2015, compared with 2010 levels, and raising energy use intensity by 16%, relative to GDP.
According to this plan China will meet 11.4% of its primary energy requirements from non-fossil sources by 2015. At the same time coal use is projected to decline, from 67% to 60% by 2020.
China’s total installed power generation capacity is expected to nearly double from 968 GWe in 2010 to 1,786 GWe by 2020. The installed capacity of renewable energy will reach at least 600 GWe by 2020, from 250 GWe in 2010.
In its 12th FYP, finalised in August 2012, China committed about USD 290 billion to clean energy investments. Its goal is to produce 20% of the nation’s electricity from renewable sources by 2015. Total installed hydro-electricity generation capacity is targeted to reach 290 GWe, while wind power will total 100 GWe. Solar power capacity will total 21 GWe in 2015.
In October 2012, China’s State Council released its Energy Policy white paper, updating the previous targets that had been outlined in its five-year plan. The new document extended these targets considerably. China now determined that, by 2015, no less than 30% of its electric power capacity would be based on non-fossil fuel sources – mainly hydro, wind and some solar, as well as nuclear. Installed total wind power generation capacity had already reached 100 GWe by the end of 2013, while solar PV had reached 35 GWe.
capacities, with the aim of making the RPS more practi-cal as well as clarifying the companies’ obligations
● Significantly increased renewable energy targets would be set for grid companies to provide more incentives to purchase renewable electricity. For example, the State Grid, China’s largest grid com-pany, is expected to achieve a 4.8% non-hydro renewable energy share by 2015 (The previous target was 3% by 2020),
● The National Energy Administration (NEA) was given the responsibility of monitoring compliance on a monthly basis. Renewable energy certificates would be used to track the fulfilment of targets, but the certificates had not been made tradable
● The failure to meet targets negatively impacts on managers’ performance evaluations. All genera-
tors and grid companies regulated by the RPS are state-owned enterprises, and their managers are evaluated annually by the State-owned As-sets Supervision and Administration Commission (SASAC).
This draft was released in May 2012 for public consulta-tion (Lo et al., 2014). State-owned enterprises have so far resisted these new requirements, which were still under debate in mid-2014. The MMS is expected to be implemented by the end of 2014 or in 2015.
Tariff based support mechanisms for power generation from renewable energy sources
Since the Renewable Energy Law came into force on January 2006, renewables have been guaranteed grid

Renewable Energy Prospects: China38
connection in China. The law was amended in 2009 (IRENA, 2013; NPC, 2013).
According to this law, purchase price of renewable elec-tricity generation is determined by the NDRC. The law provides the legal basis of the support to renewable en-ergy based electricity generation, regulations for imple-mentation and administrative practices that determine the electricity pricing. There are a number of obligations for power grid companies when entering into intercon-nection agreements with certain projects. They need to provide grid-connection services and related technical support. In addition they need to purchase and dispatch
the entire amount of electricity generated from renew-able energy projects (IRENA, 2013; Zhang et al., 2013).
There is a free connection service provided by the SGCC for distributed solar PV electricity producers which are located close to consumers and for those with installed capacity of less than 6 MWe from 1 November 2012 on-wards. In addition, in February 2013, SGCC expanded its free connection services to all types of distributed electricity sources (Zhang et al., 2013).
Two main methods have been adopted— competi-tive tendering (government-guided pricing; an auc-
Table 9: Renewable energy targets overview
Status Targets2012 2015 2020
Power sector
Biomass power 8 GWe
13 GWe, including8 GWe agricultural and
forest residues2 GWe biogas and
3 GWe urban waste
30 GWe
Hydroelectricity 249 GWe 260 GWe 350 GWe
Pumped hydro 20 GWe 30 GWe 70 GWe
Solar PV 5.4 GWe 50 GWe
100 GWe
(70 GWe by 2017)
CSP 0.014 GWe 1 GWe 3 GWe
On-grid wind power100 GWe onshore 5 GWe offshore
200 GWe onshore30 GWe offshore
Thermal applications
Biogas 47 million households 50 million households
Solar thermal 258 million m2 400 million m2
Solar cooker 2 million sets
Geothermal 4.6 Mtce
15 Mtce580 million m2 building
space (heating), 1.2 million households
(hot water)
Bioethanol 2 Mt 4 Mt 10 Mt
Biodiesel 0.5 Mt 1 Mt 2 Mt
Sources: Based on CNREC (2012); Campbell (2014)

Renewable Energy Prospects: China 39
tion mechanism) and FiTs (government-fixed pricing) (NDRC, 2006; NPC, 2013; The World Bank, 2014). During the period from 2006 to July 2009, the grid-connected power price of wind power projects was determined by a government-guided price set in accordance with the price selected through a public request for tenders.
Under the concession programme (i.e., auctions), in-vestors and developers are selected for renewable energy projects such as large wind farms or solar plants through a competitive bidding process; the government is committed to coordinating connection to the power grid and purchasing all the electricity generated by the concession projects. Between 2003 and 2007, the NDRC initiated five rounds of concession bids for wind power projects (Cozzi, 2012). Auctions were also implemented for solar PV, offshore wind and CSP. Price was the de-terminant factor in deciding successful bidders (IRENA, 2013; Zhang et al., 2013).
These auctions were basis for setting the level for the FiT as the government was able to gather cost informa-
tion from various renewable energy projects (Wang, Barosso and Elizondo, 2014). A categorised on-grid price setting for each individual source of renewable energy generation connected to the grid has been im-plemented to determine the FiT from 2005 onwards. To set the price the following factors are taken into account (Zhang et al., 2013):
● Techno-economic performance of different re-newable energy technologies
● Geographic location ● Availability of renewable energy resources ● The FiT rates evolved over time and have been
continuously reduced according to the cost of development (see Table 10 for the rates as of July 2014).
Government financial support for renewable energy projects
The Chinese government also supports renewable en-ergy projects by providing financial subsidies. In 2009
Table 10: Overview of the current feed-in-tariffs in China by technology and resource
Onshore windI area1 II area2 III area3 Other areas
0.082 0.087 0.093 0.098
Solar PVI area4 II area5 Other areas6
0.145 0.153 0.161
BiomassAgricultural and forest biomass Waste
0.121 0.105
Offshore windNear shore Intertidal
0.137 0.121
Note: Information refers to July 2014 and all values are expressed in USD/kWh with tax included. A currency exchange rate of 1 USD = 6.21 RMB was used referring to 18 July 2014.1 In addition to other areas of Inner Mongolia Chifeng, Tongliao City, Xing’anmeng Hulunbeir; Urumqi, Yili Kazak Autonomous Prefecture,
Changji Hui Autonomous Prefecture, Karamay, Shihezi City.2 Zhangjiakou City, Hebei Province, Chengde City; Chifeng, Tongliao City, Hing’an, Hulun Buir City; Zhangye City, Gansu Province, Jiayuguan,
Jiuquan City.3 Baicheng City, Jilin Province, Songyuan City; Jixi City, Heilongjiang Province, Shuangyashan, Qitaihe City, Suihua City, Yichun City, Mountains
region; Zhangye City in Gansu Province, in addition, Jiayuguan, Jiuquan City than in other regions; Xinjiang addition Urumqi, Yili Kazak Au-tonomous Prefecture, Changji Hui Autonomous Prefecture, Karamay, Shihezi than other regions; Ningxia.
4 Ningxia, Qinghai Haixi, Jiayuguan, Gansu, Wuwei, Zhangye, Jiuquan and Dunhuang, Jinchang, Xinjiang Hami, Tacheng, Altay, Karamay, except Inner Mongolia Chifeng, Tongliao, Xing’anmeng, Hulunbeier area.
5 Beijing, Tianjin, Heilongjiang, Jilin, Liaoning, Sichuan, Yunnan, Inner Mongolia Chifeng, Tongliao, Hing’an, Hulunbeier, Hebei Chengde, Zhangjiakou, Tangshan, Qinhuangdao, Shanxi Datong, Shuozhou, Xinzhou, Shanxi Yulin, Yan’an, Qinghai, Gansu, Xinjiang and other areas in addition to area I.
6 Tibet autonomous region benchmark price will be forthcoming.

Renewable Energy Prospects: China40
the Ministry of Finance (MOF) initiated two national solar PV subsidy programmes to support and expand the domestic solar industry:
● An up-front subsidy for building-integrated PV (BIPV) systems and a subsidy of 50% of the bid-ding price for the supply of critical components are provided (Zhang et al., 2013). Financial sup-port has decreased substantially since the pro-gramme’s inception, reflecting the declining cost of photovoltaic energy. By 2012, the rate had fallen to 9 RMB/W for BIPV (compared with 20 RMB/W in 2009) and 7.5 RMB/W for rooftop systems (from 15 RMB/W in 2009) (Lo et al., 2014).
● The Golden Sun Demonstration Programme pro-vides direct subsidies for on- and off-grid PV systems: equivalent to 50% of the total cost for
on-grid systems and 70% for off-grid systems in rural areas. In 2012, on-grid systems received RMB 5.5/W, while off-grid systems received RMB 7.0/W (Lo et al., 2014).
5.3 Transport sector related policies
There are four key policy mechanisms related to pas-senger cars which aim to reduce energy demand and increase the share of renewable energy use:
● Fuel economy standards and labelling ● Vehicle and fuel taxation ● Subsidies for energy-efficient and electric vehi-
cles
Box 4: Distributed solar PV in China and new policy developmentsDistributed solar PV in China deserves particular attention. It is important for the country because it is an emerging industry and provides opportunities for new local jobs as well as the chance for users to become producers. In addition, distributed solar PV offers cost benefits compared with utility-scale plants that need to be connected to the grid. Particularly because of these benefits, the government has been encouraging investments since late 2013.
Due to the slow uptake of the technology, it had not been expected that production would reach the govern-ment’s 8 GWe target. But by the end of 2013, the total installed distributed solar PV capacity had reached 4 GWe and, in the first quarter of 2014, more than 3 GWe capacity was commissioned. This creates hopes that the 8 GWe target might be achieved in 2014.
In early September 2014, the NEA made its policy updates public which include a range of options (BNEF, 2014b, EnergyTrend, 2014). The policy offers the option to choose between a premium subsidy and a local FiT for solar PV that is connected to a transmission grid. Furthermore, the challenges related to grid connection and payments are also addressed.
The policy update also addresses a number of more specific areas. For example, local governments are en-couraged to include distributed solar PV in their planning and to provide guidance and support to both inves-tor and owners, in particular in development zones, on large company rooftops, on public infrastructure and in areas previously not considered for distributed solar PV. Investments in projects outside the current system boundaries for distributed solar PV are also accounted for, such as plants on abandoned land, greenhouses, lakes or ponds.
While all these policy updates are very encouraging, many barriers remain to the growth of a distributed solar PV market for China. These include the need to improve the quality of equipment available, a lack of standards, lack of financing and risks that involve roof ownership as well as technical issues relating to infra-structure.

Renewable Energy Prospects: China 41
● Incentives for biodiesel use
The State Council considers electric vehicles to be key to transforming the transport sector. There are three types of subsidies for energy-efficient and electric vehicles (Lo et al., 2014):
● Energy-efficient automobiles with fuel consump-tion of between 4.8 litres per 100 km to 6.9 litres per 100 km, depending on weight, are supported with 3,000 RMB,
● Electric vehicles: — Support ranges from 3,000 RMB to a maxi-
mum of 50,000 RMB depending on battery capacity and type of vehicle,
— Plug-in hybrid vehicles (50,000 RMB), — Pure electric vehicles (60,000 RMB)
● Hybrid and electric public vehicles, including bus-es, taxis, official vehicles and municipal service vehicles (e.g., garbage trucks and mail trucks), are subsidised based on the length and type of vehicle, its fuel-saving potential, and the ratio of electric motor and battery type
China is also aiming for 30% of new government ve-hicles to be powered by alternative energy by 2016. In addition to subsidies, there were a number of license plate-based policies (e.g., odd-even, end-number) in Beijing to reduce car use. In Beijing there is also a policy to increase the purchase of small passenger cars with fewer than five seats. Another policy in the city restricts driving by one day a week to reduce car use by 20% during week days (Wang et al., 2013).
While in principle the government is keen to encourage the use of biofuels, there are a number of major con-straints. A variety of feedstocks can be used for ethanol production, including cassava, sugar cane or sweet sorghum. However, land availability is an important is-sue for China in view of the demand for food. Rising domestic grain prices have also led to ambitious plans for transportation biofuel production based on food crops being abandoned.
Instead, attention has focused on advanced biofuels and the main policy for biofuel production in China is to avoid competition with crops for human consump-tion. Since 2008, the government has been tightening controls on the grain processing sector to lower financial support for grain-based ethanol production. By 2015, a
value added tax rebate will also be removed and a 5% tax for grain-based ethanol production will be applied. There are nationwide targets to increase the consump-tion of bioethanol and biodiesel. Each province or city has the authority to implement its own policies. With regard to bioethanol, there are limited incentives for grain-based production and subsidies have been cut. In the case of biodiesel, there are no national or provincial mandates given the small scale of production (USDA, 2013). It should also be noted that, unlike the European car market, in China only trucks use diesel engines. Thus the feedstock for biofuels for domestic consumption in China will differ from other countries.
The future of the biofuel sector is still under discussion – industry development is therefore insecure
5.4 Solar water heating policy for buildings
China has installed the most solar water heaters in the world, accounting for nearly two-thirds of global capac-ity. The adoption of solar thermal heating has acceler-ated without government support; between 2000 and 2012 solar water heater installation increased almost tenfold from 26 million m2 to more than 250 million m2. In 2009, the MOF started a support programme to sub-sidise solar thermal use for rural consumers in China. This programme provided an allowance equivalent to 13% of the product price, with a ceiling of RMB 5,000 per unit for solar water heaters. In June 2012 a new subsidy programme was initiated by the MOF for urban consumers offering up to 550 RMB per installation (Lo et al., 2014).
5.5 Industrial policies for renewable energy
There are important socio-economic benefits of renew-able energy deployment such as increased income, industrial development and job creation (IRENA, 2014e). Hence in addition to policies that focus on renewable energy use, China uses specific supply-side tools to sup-port the development of a national renewable energy

Renewable Energy Prospects: China42
industry. One of them is financial support for research and development (R&D). The 11th FYP classified the development of energy technologies as a top priority and provides short-term targets and goals for China’s R&D and innovation activities as well as listing energy technologies as a key area (Zhang et al., 2013). Three key clean technologies are highlighted:
2–3 MWe wind turbine commercialisation: Among vari-ous publicly funded programmes, the “863” and “973” programmes were the two most important, providing substantial direct funding
● Domestic wind industry across the entire value chain: The Ministry of Finance also established a
special fund to support enterprises in their R&D. These enterprises are either controlled domesti-cally or 100% owned and produce wind power machines and equipment
● Solar PV: Several R&D projects have been gov-ernment-financed, such as polysilicon produc-tion. This enabled bodies such as the state-owned Semiconductor Research Institution to transfer knowledge from its R&D to other manu-facturers in China
Another key area for financial support is renewable energy equipment manufacturing. In order to achieve self-sufficiency in the supply of such equipment, China offers import tax exemptions for complete sets of
Box 5: China s “push & pull” strategy to expand the renewable energy industryChina has used a unique “push & pull” strategy for the expansion of renewable energy over the past decade. The first step occurred in 2006 with the creation of a market for renewable generation based on a FiT pro-gramme that drew heavily on the experience of other such schemes elsewhere, particularly in Germany. As a result, a renewable electricity market was developed that created bankable project developments for new wind turbines.
At the same time, China has actively encouraged the establishment of a local wind industry and a solar PV industry. These “push” mechanisms have included R&D programmes, financial support for renewable energy technologies and local content requirements which have driven a significant expansion of the domestic manufacturing base.
Figure 12: Interactions between renewable energy policy and renewable energy industrial policy
RE policy Industrial policy for RE
RE development & deployment
A�ect RE development and deployment
A�ect RE manufacturing
RE development
RE generation
RE consumption
RE manufacturing
Equipment
Component
Part…
Source: Based on Zhang et al. (2013)
Additionally, a strong export strategy – especially for solar photovoltaic technologies – was established to boost demand for China´s renewable energy manufactured products. The result has been a significant re-duction in the cost of solar PV modules and a market in China that installed 13 GWe of new solar PV in 2013.
Expanding the annual output of renewable energy manufacturers in turn achieves economies of scale which reduce generation costs and lead to cost-competitiveness with conventional forms of power generation. Increased market competitiveness also leads to a decrease in required FiTs. The interaction of lower equip-ment costs and the resulting lower generation costs provides benefits for all involved. These types of positive feedback loops are possible especially in larger economies.

Renewable Energy Prospects: China 43
foreign-made equipment, as well as import tax exemp-tions for foreign-made parts which are necessary for the development of key equipment for domestic enterprises (Zhang et al., 2013).
China is encouraging local renewable equipment manufacturers through a range of tax exemptions as well as direct financial support
State-owned banks and local governments have also provided strong financial support for “strategic emerg-ing industries,” which include the renewable manufac-turing industry. The China Development Bank (CDB) has provided low-cost loans to the top five PV manufactur-ers in the country (USD 30 billion in 2010 alone). Solar PV manufacturing is one of the key industries identified according to the Catalogue of Chinese High-Technology Products for Export which was updated in 2006. Solar PV manufacturers are eligible for additional financial support for R&D and for export credits at preferential rates from the Import–Export Bank of China. They are also eligible for export guarantees and insurance through the China Export and Credit Insurance Corpora-tion (Zhang et al., 2013).
5.6 Carbon policy
China announced in March 2011 that it would develop carbon-emission trading pilot projects to support its 12th FYP carbon intensity target, signalling its increasing interest in the use of market mechanisms (IEPD, 2014; Baron et al., 2012).
Carbon trading in China has been in development since 2008. As policies around climate change and clean energy were being developed, private exchanges be-gan to be set up that year. The first such institutions were the China Beijing Environment Exchange (CBEEX), the Tianjin Climate Exchange (TCX), and the Shanghai Environment and Energy Exchange (SEEE). These in-stitutions initially focused on the clean development mechanism (CDM) and voluntary carbon credit markets (IEPD, 2014).
In January 2012, the NDRC ordered the seven carbon market pilot regions to set a cap on carbon emissions in preparation for the launch of their trading schemes. This notice also required each region to set up a fund to sup-
port the trading scheme and to prepare implementation plans. Guangdong’s plan has already been approved by the NDRC where the province aims to reduce its carbon intensity by 19.5% by 2015 compared to 2010 levels and raise its non-fossil-fuel energy share in total energy consumption to 20% by 2015. The CO2 emissions cap is 660 Mt CO2. Compared to the 2007 emissions of 508 Mt CO2, this allows room for continued growth in its emis-sions (IEPD, 2014).
In June 2014, China announced that it will introduce an absolute cap on emissions from 2016 as its 13th FYP comes into force (Reuters, 2014b). At the same time, the government also launched its seventh pilot carbon mar-ket, the last before a national scheme which is expected to be launched in 2018.
China is promoting emissions trading as one way to drive efficiency and carbon emissions cuts across its heavy industry sector, thus boosting air quality and reducing the country’s contribution to climate change. The government is discussing how and whether a na-tional cap and trade scheme, a carbon tax or pollution limits will be introduced. Five of the seven provinces today have an absolute cap on emissions which could also be applied to a national scheme. Beijing has an intensity-based target (emissions per unit of GDP) (RTCC, 2014).
In order to develop China’s carbon trading system further, all pilot projects will be evaluated. The NDRC developed the following concept for the development of a Certified Emission Reduction trading scheme (Feng, 2014):
● Enhancement of macro policy: — The possible development of an emissions
trading system (ETS) as one of the key tasks in pushing forward reforms of the economy and establishment of a new ecological cul-tural system
— The 12th FYP on Social and Economics Devel-opment
— A working programme on GHG Emission Con-trol, as part of the 12th FYP
— The decision of the Third Plenary Session of the Eighteen Central Committee
● Related preparation works: — CDM cooperation

Renewable Energy Prospects: China44
— The development of a Chinese Certified Emis-sions Reductions (CCER) trading scheme
Since 2011, seven emissions trading pilot programmes have been initiated with the purpose of exploring the best approaches and obtaining the necessary experi-ence for the development of a national ETS scheme in China. According to Feng (2014), the following trading methods are applied in the seven provinces/regions:
● Shenzhen, Tianjin and Hubei: enterprises with compulsive responsibility, other approved organ-izations and individuals are all allowed for trading
● Beijing: enterprises with compulsive responsibil-ity, other approved organisations are both al-lowed for trading
● Guangdong and Shanghai: Only the enterprises with compulsive responsibility are allowed for trading now but are considering to include or-ganisations and individuals
● Beijing and Tianjin: Over-the-counter is allowed.
Jotzo, de Boer and Kater (2013) undertook a survey from late July to early September 2013, eliciting expec-tations about the future of China’s carbon price from 86 China-based experts on carbon pricing and carbon
Table 11: Overview of carbon trading systems in seven provinces of China
Province / Region Launch date Covered Carbon Emissions (Mt)Beijing (BJ) November 2013 60Shanghai (SH) November 2013 136Chongqing (CQ) June 2014 125Guangdong (GD) December 2013 388Tianjin (TJ) December 2013 108Shenzhen (SZ) June 2013 33Hubei (HB) December 2013 324
Table 12: China’s ETS pilots and performance
Legi
slat
ion
GH
G e
mis
sion
ver
ifica
tion
Acc
umul
ated
trad
ing
volu
me
of C
O2
(ton
nes)
Acc
umul
ated
trad
ing
valu
e (R
MB)
Aver
age
pric
e in
tota
l (RM
B/t)
Prov
ince
/ R
egio
n
Legi
slat
ion
leve
l
Adm
inis
trat
ive
leve
l
MRV
gui
delin
e
Scop
e an
d co
vera
ge
Cap
set
Allo
wan
ce a
lloca
tion
Star
t tra
ding
SZ Yes Yes Yes Yes Yes Yes Yes Jun-13 328 559 23 240 598 71SH Yes Yes Yes Yes Yes Yes Nov-13 342 955 13 097 987 38BJ Yes Yes Yes Yes Yes Yes Nov-13 86 983 4 660 401 54GD Yes Yes Yes Yes Yes Yes Dec-13 126 181 7 594 028 60TJ Yes Yes Yes Yes Yes Yes Dec-13 109 060 3 221 618 30HB Yes Yes Yes Yes Yes Apr-14 2 819 876 68 005 497 24
CQ Yes Yes 2014
(estimated)
Source: Based on Feng (2014)
Note: Trading volume until 21 May 2014

Renewable Energy Prospects: China 45
markets. The results indicate confidence that China’s seven pilot ETS projects will be implemented, with prices rising over time and influencing investment deci-sions. However, there remains significant uncertainty about price levels.
There are high expectations that China will introduce national emissions trading in combination with a carbon price. A significant majority of respondents expect that China’s 2020 emissions intensity target will be achieved or surpassed, and almost all expect further targets to be adopted in 2025 and 2030, possibly in the form of absolute limits on emissions.
According to the survey by Jotzo, de Boer and Kater (2013), the average carbon price across all the ETS pilot projects that are in operation is expected to be around RMB 32/t in 2014; RMB 41/t in 2016; and RMB 53/t in 2018. However, there is considerable uncertainty about price levels. For the national ETS, the average price expectation (factoring in no scheme and zero price ex-pectations from some of the respondents) rises steadily from RMB 29/t in 2018, to RMB 51/t in 2020, and to RMB 68/t in 2025. As of early September 2014, NDRC indicat-ed the total emissions it could regulate by 2020. These would range between 3 billion and 4 billion tonnes of CO2 emissions and the market will be worth up to USD 60 billion at the carbon prices suggested by the NDRC
(RE New Economy, 2014). This would make the market twice as big as the EU, which is currently the world’s largest. China plans to start a national market in 2016.
5.7 Electricity pricing
Power prices are generally set by the state for both gen-eration and distribution. The State Electricity Regulatory Commission (SERC) was set up in 2002 independent from the price setting NDRC. Its tasks were mainly to establish and monitor an electricity-trading mechanism between power generators and buyers. This trend is reversed in the new structure.
In terms of pricing, thermal power plants pay a fixed uniform tariff irrespective of the time of day. Prices are set a year ahead. Unlike many other markets, China lacks short-term and real-time trading of electricity. China´s electricity pricing system is controlled by the NDRC.
A central renewable energy fund has been established. This is mainly supplied through a fixed surcharge on all electricity purchases. As renewable growth has picked up in recent years, the fund has faced shortfalls. This may have contributed to late or non-payment to gen-erators. In order to ensure that the fund is solvent
Figure 13: Expected average carbon price – China carbon trading
2014
Aver
age
expe
cted
ETS
pric
e,
all p
ilots
, RM
B/tC
O2
0
10
20
30
40
50
60
70
80
90
2016
Average China Carbon Pricing Survey 2013,ANU/China Carbon Forum
80th percentile
20th percentile
2018
Source: Based on Jotzo, de Boer and Kater (2013)

Renewable Energy Prospects: China46
with more costly solar installations coming online, both revenue streams and subsidy outlays to generators will need to be modified. Historically the high penetration of state-owned energy companies active in the renew-able sector have influenced investment decisions. These state-owned companies have traditionally had responsi-bilities to the state besides turning a profit.
There is a considerable difference between residential and industrial electricity prices. NDRC and the grid com-panies agree on provincial electricity costs for residen-tial consumers which are kept purposefully low. While a large difference exists between the international aver-age and China’s residential electricity prices, industry prices are closer to the global average and much higher than residential sector prices in the country.
The “Increasing block tariff” (IBT) is a common pricing mechanism used to encourage households to conserve electricity. It also divides electricity consumption into several blocks for calculating electricity prices (Lo et al., 2014). The IBT is often used in addition to subsidy programmes for energy-efficient appliances in China to help conserve energy use by rewarding low electricity consumption or by punishing overconsumption. The IBT price of electricity sets a limit beyond which usage is charged at a higher price.
The NDRC approved a shift from the single tariff system in 2010. However, the use of block tariffs was not implemented across China until July 2012 because of the potential negative impacts such as the affordability of electricity and, partly in consequence, social stability (Lo et al., 2014).
China’s IBT has a three-block structure:
● The price for the first block (0–240 kWh per month) is subsidised to ensure residents are able to afford basic electricity and is expected to cov-er approximately 80% of electricity consumption
● The price for the second block (241–4,400 kWh) is set to recover full costs
● Finally, the price on the third block (4,400 kWh) is punitive and considers resource scarcity and pollution externalities. Low-income groups are allowed to consume a certain amount of electric-ity at no cost (Lo et al., 2014)
China has a number of electricity pricing mechanisms – both for supply and demand. Were the electricity market to be established, the entire design of the current power sector would require significant changes
The tariffs paid to generators of wind and solar power were earlier determined by auctions. These auctions were then used as the basis for setting the level for the FiT. Wind and solar power capacity has grown quickly in China. In order to address the issue of solvency of the fund, in August 2013, NDRC doubled the electricity surcharge for industrial customers. Since a large share of China’s total electricity demand is consumed by in-dustrial users, this will make a substantial contribution to the fund. Concurrently FiTs for solar were scaled back through instituting a regional system similar to that de-veloped for wind (Davidson, 2013a).
Additionally, on-site distributed solar electricity will re-ceive a RMB 0.42 per kWh subsidy. Any excess electricity sold back to the grid, where grid connections and policy are in place, will be at the prevailing coal tariff, ranging from RMB 0.3 to RMB 0.5 per kWh (USD 5-8 cents per kWh). It is unclear if these adjustments will mitigate the expected large financial demands required to support solar technologies (whose FiT outlays per kWh are still more than double that of wind) (Davidson, 2013a).

Renewable Energy Prospects: China 47
China has significant conventional energy resources. Potentially, it also has considerable renewable energy sources, most of which are still not utilised. Compared with the technical potentials of onshore wind and solar capacity, which are close to 3,000 GWe, current installed capacities are minimal (Table 13). Resources vary by region. The northern parts of China have the best wind resources while the southeastern and central parts of China have high solar irradiation. The potential for hydro lies at 400–700 GWe. By comparison, installed hydro capacity in 2012 was about 250 GWe, about two-thirds of the total potential.
China is blessed with abundant resources of all types of renewable energy sources, a small proportion of which are used today
China also has abundant biomass resources, little of which are effectively used today. Biomass resources are related mostly to agricultural and forest logging residues, animal waste and industrial and municipal bio-degradable wastes. The straw resource is concentrated in the northeast and lower Yangtse River. Furthermore there are significant wood resources in the northeast and southeast (Sichuan, Shandong, Jilin, Henan).
China produces around 700 Mt straw per year. Some 37% of this total is corn straw, 28% is rice straw and 20% is wheat straw. The remaining 15% includes various other crops. Around half of the straw is used for fodder and fertiliser. This leaves around half (350 Mt/year) for ener-gy. Around 40% of this amount is already used (Zhang, 2014). The livestock industry equates to 135-170 Mt of
animal wastes available for biogas production (Delman and Chen, 2008)
Sweet sorghum has the potential to be grown in differ-ent parts of China. In northern and southern China it is also possible to grow sweet potato. Cassava has a po-tential to be grown in the middle areas and lower Yang-tze River as well as in southwest China (Qiu et al., 2012).
China has limited forest resources and they are not evenly distributed across the country. The solid for-est products industry is therefore dependent on im-ports where much of the hardwoods logs are brought from tropical sources and softwood logs are imported from Pacific Rim nations and Siberia (Bioenergy Crops, 2013b).
Table 15 shows a breakdown of the total biomass sup-ply potential in 2030 by biomass. With the exception of Batidzirai, Smeets and Faaij (2012), no other study provides a potential for energy crops. The total supply potential of forest products, their residues, agricultural residues and waste according to the four studies range from 8 EJ to 19 EJ (273 Mtce to 648 Mtce) (excluding energy crops) by 2030.
There is a biomass supply potential ranging from 8 EJ to 19 EJ in China by 2030 but only a limited amount of this is used effectively today
By 2030, IRENA estimates that the supply costs of bio-mass will range from USD 3 to USD 12 per GJ. The lower
6 RENEWABLES POTENTIALS
Table 13: Renewable energy resource potentials of China
2012 capacity (GWe) Technical potential (GWe)
Hydro 250 400-700
Onshore wind (>50m) 63 1 300-2 600
Offshore wind (at depth 5-25m) 0.3 200
Solar PV (utility) 4 2 200
Solar PV (rooftop) 1.4 500
Source: CNREC (2012)

Renewable Energy Prospects: China48
end of this range refers to agricultural residues (harvest-ing and processing) as well as biogas; the higher end refers to forest products and residues, including fuel wood.
Table 14: Breakdown of total biomass supply in 2030
Batidziari, Smeets and Faaij (2012)
Van Sambeek et al. (2013)
IRENA (2014c)
CNREC estimates
(EJ/year) (EJ/year) (EJ/year) (EJ/year)
Forest products incl. residues 0.9-7.8 5.6 2.1-2.4 6.8
Agricultural residues incl. animal waste 0.4-7.9 13.5 6.9-13.5 7.6
Straw 4.1 4.9
Resides after food crop processing 0.9 0.9
Livestock manure 5.9 0.8
Municipal solid waste 0.38 0.4
Municipal sludge 0.05
Industrial organic wastewater and sludge 2.2 0.6
Energy crops 3.8-11.5
Total supply potential 5.1-27.3 19.1 8-15.9 14.4

Renewable Energy Prospects: China 49
Key points
● Options have been identified that could raise China’s renewable energy use in terms of TFEC to approximately 23 EJ (770 Mtce) by 2030 (equivalent to 26% in the share of TFEC). This includes the full substitution of traditional uses of biomass with modern renewables.
● Some 49% of the total renewable energy use in REmap 2030 is related to renewable power op-tions.
● Various forms of biomass (such as power, heat, motor fuel) and solar (PV, CSP, thermal) would account for 60% of the total renewable energy use in REmap 2030.
● 40% of the REmap Options that have been iden-tified in the power sector are related to solar, one-third to biomass and 20% to wind. The remainder is related to geothermal. REmap Op-tions for renewable heating and transportation account for two-thirds of the total.
● Total wind capacity would increase by 13 times compared with 2012. Solar and geothermal ca-pacity would both increase by a factor of six or seven.
● Total biomass use would double from 2012. While traditional use of biomass is fully substituted be-tween 2010 and 2030, modern uses of biomass increase by five times in the same period.
● Additional biomass use potential is concentrated in heating markets (building and industry), in-cluding the district heat generation sector.
● The total package of REmap Options identified requires additional costs of USD 5.6 per GJ (RMB 1 230 per tce) for consumers and USD 6.9 per GJ (RMB 1 480 per tce) for society (USD 55-60 bln/year additional costs; RMB 375-410 billion per year). These costs exclude savings from the ben-efits of renewable energy from improved human health and reduced CO2 emissions.
● Costs are outweighed by estimated savings due to external effects from air pollution, including a reduction of 1,690 Mt of CO2 per year in 2030.
● There are challenges for wind and biomass relat-ed to connecting supply and demand, and costs associated with these. Furthermore, barriers re-
lated to permitting, licensing and other regula-tory issues need to be resolved in order to build the necessary transmission grid. While a part of the bioenergy demand in end-use sectors could be met with local feedstock availability, domestic logistics for bioenergy trade must be developed to meet demand spread across the country.
The Reference Case (i.e. business as usual) analysis for China utilizes an internally developed REmap tool that incorporates the estimates of the IEA WEO New Poli-cies Scenario and CNREC for the year 2030. The data, assumptions and approach used have been summarised above in Section 4. The tool allows IRENA to enter addi-tional renewable energy options in the end-use sectors of industry, buildings, and transport, as well as for power and district heat generation. The process for the REmap Options was as follows:
1) Reference Case for the period between 2010 and 2030 was created. The results of this projection are explained in Section 4,
2) Commodities and fuel prices were prepared to reflect the national situation,
3) Technology cost and performance criteria (e.g., capacity factors) were prepared to reflect the national situation,
4) Additional renewable energy options for all end-use sectors and the power sector were analysed based on various study and assessments.
The following studies have been used to identify addi-tional renewable energy options beyond the Reference Case:
a. For power sector: CNREC estimates, historical trends, IEA estimates and IRENA renewable en-ergy industry roadmap and its accompanying data were used (for biomass power generation from CHP) (IRENA, 2014b),
b. For transport sector: IRENA estimates were used,c. For industry sector: a recent IRENA renewable
energy in industry roadmap (IRENA, 2014b) and its accompanying data was used; only renewable energy options for new capacity were considered.
7 REMAP OPTIONS

Renewable Energy Prospects: China50
d. For building sector: an internal analysis of Refer-ence Case developments and REmap Options was used in addition to the draft “Roadmap Research of China Solar Thermal Development” (Ruicheng, Tao and Xuan, 2014).
This section is divided into five sub-sections. Section 7.1 focuses on the potentials of different renewable energy technologies in China and also mentions the top re-gions with resource availability. Section 7.2 provides the REmap Options. In Section 7.3, costs of REmap Options are estimated and Section 7.4 presents the cost-supply curves for the REmap Options. Section 7.5 discusses these findings.
7.1 Renewable energy technologies
Wind
The potential for wind lies mainly in the northwest and northeast, and partly in the east of the country. In these regions, wind speeds easily exceed 8-9 m/s and capac-ity factors reach between 20% and 40% (IEA, 2011a; He and Kammen, 2014). However, the ability to deliver electricity to consumers in the southern and eastern parts of the country is a challenge given existing grid infrastructure.
A regional approach has been chosen in determining the potential of wind in China by distinguishing between high and low capacity factor regions. More than two-thirds of the total wind potential is assumed in regions with large wind resources, mainly east and west Inner Mongolia as well as Xinjiang, Gansu and Jiangsu (where capacity factors reach up to 35%). The remaining poten-tial is assumed in regions with moderate availability of wind resources (those with capacity factors of around 20%).
A total of 246 GWe capacity has been assumed as Remap Options on top of the capacity identified in the Reference Case. This results in a total installed capacity of 561 GWe in REmap 2030, which is much lower than the technical potential of approximately 2,500 GWe. Realising this potential would imply the deployment of all possible installed capacity in Inner Mongolia, Xjiang, Gansu, Hebei, Jilin and Jiangsu (IEA, 2011a). To realise this high wind potential, it is also assumed that some of the coal plants built between 2010 and 2030 are retired
early, in particular in western China. The total capacity growth is ambitious requiring about 24 GWe/year of on-shore wind capacity deployment, double current levels. For offshore wind, the growth is about 3 GWe/year.
Solar PV and CSP
In the southwest and to the north of China, solar irradi-ance levels range from 1,500 to 2,000 kWh/m2/year. So far most solar capacity is also installed in this band, notable in Qinghai. Most of the rest of the capacity is assumed to be deployed in this region as well, but with rooftop solar PV distributed in other parts of China as well. The average capacity factor is estimated as 17% for utility-scale projects, and about 15% for rooftop solar PV. An additional 169 GWe in the 2010-2030 period (on top of the 139 GWe in the Reference Case in 2030) was assumed in REmap 2030. In total, by 2030, 309 GWe of solar PV would be installed (of which 118 GWe is rooftop), representing an installation rate of around 16 GWe per year. Most of the utility-scale solar PV will be installed in western parts of China whereas distributed solar PV will be spread across the country, but mainly in the eastern parts of the country.
Solar CSP could also play a further role in China, mainly in parts where solar PV also has potential, such as Xin-jiang and Qinghai. Without storage, the capacity factor would be around 17%. An additional 20 GWe on top of the Reference Case of 12 GWe is assumed in REmap 2030.
Geothermal
Geothermal resources are available in many areas, but in most locations the temperatures are moderate, rang-ing from 30-90o C. Since 1990, the use of geothermal energy for space heating, recreational bathing and spas, and cultivation has evolved rapidly.
High-temperature geothermal resources do exist, but they are limited to a few locations in southern Tibet, western Yunnan and western Sichuan, on the Himala-yan Geothermal Belt. Thus far, total installed capacity is 27 MWe. As of 2006, 181 geothermal systems had been found on mainland China, with an estimated generation potential of 1.74 GWe. This is small compared with the overall power demand needs and most of this capacity is assumed to be deployed in the Reference Case. In REmap Options, no additional capacity is assumed.

Renewable Energy Prospects: China 51
Biomass/biogas
As discussed in Section 5, China has considerable bio-mass potentials which are not utilised to their full extent yet. These include a mix of agricultural residues, waste and forest products. To some extent, straw production is already utilised, so is fuel wood in traditional forms. However, there is also a major potential for the use of modern forms of biomass in the heating sector and partly for power generation, in particular in industrial combined heat and power (CHP) plants.
Central and northeastern parts of China have large stalk and straw potential which accounts for the majority of the total supply in China. The southwest has limited potential for agricultural residues. Fuel wood potential is distributed in the southern and central parts of China. As for animal manure, the main potential is in the southern and central regions as well as in northeastern China (Jingying et al., 2001). Forest-based bioenergy use is in its infancy in China, but there is now a mid-term goal to develop forest-based bioenergy in those southern and eastern parts of China which are in close proximity to ethanol and biodiesel plants (Bioenergy Crops, 2013a).
An additional 27 GWe of biomass power generation (in-cluding 6 GWe CHP used in industry) has been assumed on top of the 38 GWe identified in the Reference Case, as well as an additional 2.2 EJ of modern biomass for heating in industry and buildings (on top of the 3.1 EJ in the Reference Case). All traditional biomass use in the 2030 Reference Case of 2.9 EJ is substituted.
Figure 14 shows total primary bioenergy demand based on REmap 2030 reaching 12 EJ per year (410 Mtce), which based on the biomass supply literature review would represent two-thirds of the high end of the sup-ply potential (8-19 EJ). Compared with the low-end of the total supply potential, demand could be higher. This implies that a large share of the bioenergy resource potential of China would be used. 30% of this total would be consumed in the building sector followed by a quarter for power generation. The demand for biofuel production and for heating in industry and district heat sectors account for 45% of the total demand.
Hydro
Of the total potential for hydroelectricity, all the eco-nomic potential of 400 GWe is assumed to be deployed
Figure 14: Primary biomass demand by sector with REmap Options, 2030
Power and DH,41%
Industry andBuildings, 45%
Transport;14%
Power, 3.1 EJ
District heat, 1.8 EJ
Industry, 1.7 EJ
Buildings, 3.7 EJ
Transport, 1.7 EJ
Total demand: 12 EJ/year

Renewable Energy Prospects: China52
already in the Reference Case. No additional potential is assumed in REmap 2030.
Additional potential of renewables in end-use sectors
The analysis can still be expanded to include additional renewable energy options, particularly in end-use sec-tors where no comprehensive accelerated renewable energy scenarios are available. In industry, retrofits for biomass medium/high temperature process heat (to a large extent increasing the share of biomass and waste in the fuel mix of cement kilns) and solar thermal for low/medium temperature heat could be considered. Assuming about 20% of the total energy demand of the cement industry is provided by biomass and waste by 2030, a total of about 0.6 EJ of fuel would be required. Another 0.5 EJ of biomass for heat production in indus-trial CHP plants and 0.3 EJ of biomass for steam boilers are assumed that would account for about 2% of the sector’s total energy demand for process heat genera-tion (WBCSD, 2009; IRENA, 2014b).
In REmap 2030, total solar thermal capacity in China is expected to reach 1,500 million m2. Hence REmap Options represent an additional potential in 2030 of 700 million m2 compared to the Reference Case of 800 million m2. Building sector accounts for 70% of the capacity installed by 2030 (60% residential and 10%
commercial). The remaining 30% is located in the in-dustry sector. The major task is to substitute traditional uses of biomass with modern cooking stoves and to continue to increase the use of solar thermal for water/space heating.
For the REmap analysis it is assumed that that the package of electric two-wheelers, extended metro and broader use of electric buses can replace 20% of the projected car demand in 2030. As for road transporta-tion, a significant amount of the capacity is needed to haul coal from the mines to the centres of demand. The REmap Options could reduce coal demand by around 5%. It is estimated that this will reduce road transporta-tion demand by around 1% in 2030.
7.2 Roadmap table and implications for renewable energy
REmap results in a significant increase in the amount of renewable energy consumed as a proportion of the total. In 2010, about 7.4 EJ/year of renewable energy was consumed in China. 60% of that was in different forms of biomass. The only other sizable contributions were from renewable electricity in the form of hydro and renewable heating from solar thermal in the build-ing sector.
Figure 15: Increases in renewable energy consumption in TFEC by resource
0
1000
2000
3000
4000
5000
6000
7000
8000
Biomass Solar Hydro Wind Geothermal
Rene
wab
le e
nerg
y in
TFE
C (P
J/ye
ar)
2010 2030 Reference Case REmap 2030

Renewable Energy Prospects: China 53
In the Reference Case for 2030 an additional 7.2 EJ of renewable energy will be consumed, resulting in total renewable energy use of 14.6 EJ. The REmap Options show an additional 8.4 EJ of renewable energy. In REmap 2030, renewable energy use in the TFEC would reach 23 EJ. Compared with 2010 level, this is an addi-tion of 15.6 EJ. Figure 15 shows the anticipated increase for each renewable energy resource. The largest growth in absolute terms is in the use of solar (including both PV and thermal applications), in total approximately 6 EJ between 2010 and 2030. Biomass, wind and hydro additions are each 3 EJ in the same time period.
Biomass may still be the largest source of renewable energy in REmap 2030, but it is actually solar, hydro and wind that show the highest growth rates.
There is scope to more than triple 2010 levels of renewable energy consumption to 23 EJ by 2030, with solar PV and solar thermal accounting for 40% of the total potential beyond the Reference Case
Figure 16 shows the breakdown of renewable energy by consuming sector between 2010 and REmap 2030. Note that biomass as an energy source changes sig-nificantly, as its traditional use in the building sector is replaced with modern alternatives. Also, the growth in
biomass use is not seen in the power sector, rather in the form of biofuels and residue combustion for heating used in industry.
The other changes include a significant increase in solar thermal use in both the building and industrial sec-tors. In the power sector, hydroelectricity remains the largest source of electricity, however wind increases its share tenfold over 2010 levels. Solar PV goes from being almost non-existent in 2010 to comprising 6% of all renewable energy use by 2030, becoming the third most important source of renewable electricity in 2030. The power sector gains nearly a 50% share in the total renewable energy market by 2030, compared with 29% in 2010.
Renewable power and heating applications each would account for about half of the total renewable energy use in 2030 if all REmap Options are implemented
Table 15 below shows the results of these increases on the share of renewable energy. When excluding tradi-tional uses of biomass, modern renewable energy use increases from 7% of the total in 2010 (13% if traditional biomass is included), to over 16% in the Reference Case. When the REmap Options are included the share of modern renewable energy in the total mix can be raised to 26%.
Figure 16: Breakdown of renewable energy use by application and sector, 2010 and REmap 2030
REmap 2030 - 23 EJ2010 - 7.5 EJ
Power 29%
Traditional uses of biomass
45%
Biomass HeatIndustry* 1%
Biomass Heat/District Heat Buildings 7%Biogas Industry*Buildings 4%
GeothermalHeat 2%
Solar ThermalHeat 12%
BiofuelsTransport <1%
BiomassPower 1%
Hydroelectricity26%
Wind 2%
Heat 70%
Transport Fuels <1%
Power 49%
Biomass Heat Industry* 7%
Biomass Heat/District HeatBuildings18%
Geothermal Heat 2%
Solar Thermal Heat 20%
Biofuels Transport 4%Biogas Power 1%Biomass Power 3%
Hydroelectricity21%
Wind17%
Solar PV 6%CSP <1% Geothermal Power 0.1%
Heat 47%
TransportFuels 4%
*incl. combined heat and power and district heat
Pow
er se
ctor
End-use sector
Pow
er s
ecto
r
End-use sector

Renewable Energy Prospects: China54
The building sector leads in terms of renewable use, largely driven by the high levels of solar thermal use and biomass, followed by industry and transport. Renewable energy in power generation increases to almost 40%, with half of that, or 20% of all generation, coming from solar PV, CSP and wind.
Renewable energy use by the manufacturing industry and building sectors (including renewable power consumed in these sectors) would account for 90% of the total renewable energy use in REmap 2030
Figure 17 shows how the REmap Options would change the primary energy fuel mix in 2030. Renewables be-come the second largest contributor of energy services in total primary energy demand (TPED)17 based on both methodologies used to convert renewable energy to primary energy. The “RE high” calculation uses the US Energy Information Agency’s partial substitution meth-od while the “RE low” calculation uses the IEA physical
17 There are different methods applied to estimate the total primary energy demand. The two applied in this study are the “physical energy content” and “substitution” methods. The physical energy content method is used by the IEA and Eurostat where renewable electricity and biofuels are counted as primary energy as they ap-pear in the form of secondary energy, while geothermal, CSP and nuclear are counted using average process efficiencies to convert them into primary energy equivalents. The substitution method is used by the US EIA and BP where renewable electricity and heat are converted into primary energy using the average efficiency of the fossil fuel power and heat plants which would otherwise be required to produce these quantities.
energy content method. These do not represent differ-ent cases, or levels of renewable energy consumption, rather differences in converting renewable electricity and heat into primary equivalents.
In primary terms, renewable energy increases between 42% and 48% over the 2030 Reference Case. Coal sees the most significant reduction, with 18% fuel savings to about 65 EJ of primary fuel (2 220 Mtce) but remains the largest source of primary energy. Natural gas sees the second largest reduction of 9%, and is the fourth largest energy carrier after coal, oil and renewables. Oil is the third largest contributor of primary energy and sees only a 7% reduction. Finally nuclear remains un-changed and the smallest contributor to primary energy (using the IEA method).
Table 16 goes into more detail about the energy system, including data for 2010 (the analysis base year), the 2030 Reference Case, and REmap 2030 which includes the REmap Options. The renewable energy share in the TFEC, when excluding traditional biomass, increases from 7% in 2010 to 16% in 2030 according to the Refer-ence Case (or from 14% to 17% if including traditional use of biomass).
Implementing all REmap Options can raise the renew-able energy share to 26% in REmap 2030. This will result in total renewable energy use of 23 EJ/year (770 Mtce) by 2030. This consists of 0.9 EJ liquid biofuels, 11.5 EJ renewables for heat in end-use sectors and 10.1 EJ re-
Table 15: Breakdown of renewable energy share by sector
Renewable share of: as % of: 2010 2030 Reference Case
REmap 2030
RE use REmap 2030
(EJ/year)
IndustryHeat Heat consumption 1% 2% 10% 2.6
Heat, Electricity & DH Sector TFEC 5% 11% 21% 10.5
BuildingsHeat Heat consumption 16% 39% 64% 7.3
Heat, Electricity & DH Sector TFEC 16% 36% 54% 10.5
TransportFuels Fuel consumption 1% 5% 5% 0.9
Fuels & Electricity Fuel TFEC 1% 7% 8% 1.5
Power Generation 19% 29% 40% 13.2
District Heat Generation 1% 1% 36% 1.4
Total excl. trad. biomass TFEC 7% 16% 26% 22.5Total incl. trad. Biomass TFEC 13% 17% 26% 22.5

Renewable Energy Prospects: China 55
Figure 17: Changes in total primary energy supply in REmap 2030Pr
imar
y En
ergy
(EJ/
year
)
0
10
20
30
40
50
60
70
80
90
Coal Oil Natural Gas Nuclear RE low RE high
18% Reduction
7% Reduction
9% Reduction
48% Increase
42% Increase
No change
Table 16: China REmap 2030 overview
1. Electricity generation Unit 2012 Reference Case 2030
REmap 2030
Difference between REmap 2030 and Reference Case
Inst
alle
d Ca
paci
ty
Renewable energy GWe 345 1 005 1 467 462hydroelectricity (excl. pumped storage)
GWe 249 400 400 0
hydroelectricity pumped storage
GWe 20 100 100 0
Wind onshore GWe 63 269 501 232Wind offshore GWe 0.3 46 60 14Biomass (incl. biogas, industry CHP)
GWe 7.7 38 65 27
Solar PV utility scale GWe 4 98 190 92Solar PV rooftop GWe 1.4 41 118 77Solar CSP GWe 0.014 12 32 20Geothermal & Ocean GWe 0.03 1 1 0
Elec
tric
ity
Gen
erat
ion
Renewable energy TWh 1 006 2 643 3 660 1 109Hydropower TWh 864 1,600 1,600 0Wind TWh 100 647 1,263 692Biomass TWh 38 190 358 168Solar TWh 4 197 446 249Geothermal & Ocean TWh 0 9 9 0
2. Biogas Supply billion m3 16 60 83 23
Biogas users million house-holds
47 175 240 65
Mid-size and large biogas plant billion m3 0 40 80 40
Biogas in tce Mtce 11.0 41.5 571.7 EJ
0.5 EJ

Renewable Energy Prospects: China56
Unit 2012 Reference Case 2030
REmap 2030
Difference between REmap 2030 and Reference Case
3. Heat Supply Solar water heater Mm2 258 865 1 500 - 635
Solar water heater in tce Mtce 29.6 91 1494.4 EJ
2.0 EJ
Geothermal energy for heating in tce
Mtce 5 10 150.5 EJ
0.2 EJ
Heat Supply in tce Mtce 34 101 1644.9 EJ
2.2 EJ
4. Biofuel
Solid biomass Mt 28 85 1332.3 EJ
0.8 EJ
Traditional biomass Mt 225 66 - - -
Modern biomass industry Mt 6 40 881.5 EJ
0.8 EJ
Bioethanol Mt 2 25 2531
bln liter
-
Biodiesel Mt 0.5 5 56 bln liter
-
Total Mtce 148 140 2254.8 EJ
1.6 EJ
5. District heat generation
Biomass Mt 2 2 781.4 EJ
0.3 EJ
6. Electric vehiclesElectric and plug-in hybrid vehicles
(million) .03 17 35 18
Electric two-wheelers
(million) 200 400 500 100
7. Ratio of electricity generation Total installed capacity GWe 1 203 2 306 2 602 330
Gross power generation TWh 4 980 9 315 9 543 205
Capacity ratio of renewables % 28% 39% 53% 15 p.p.
Generation ratio of renewables % 20% 29% 39% 10 p.p.
8.Ratio of energy consumption TFEC Mtce 2 150 3 123 3 055 -68
TFEC EJ 66 91.5 89.5 -2
Renewable electricity (consumed)
EJ 3.3 7.6 10.7 3.1
Renewable gas, heat and fuel EJ 5.2 7.0 12.3 5.3
All renewable energy EJ 8.5 14.6 22.5 8.4
Renewable energy in TFEC (in brackets, excluding traditional use of biomass)
%14% (7%)
17% (16%) 26% 10 p.p.
Note: p.p. percentage point

Renewable Energy Prospects: China 57
newable power. Electrification in end-use sectors results in additional power generation of about 280 TWh/year in REmap 2030 compared with the Reference Case, i.e. 3% additional electricity demand. Biofuels used in trans-port will total 0.9 EJ, with 18% coming from advanced biofuels.
The share of renewable power generation grows to 39% in REmap 2030. Half of this, or 18% of the total power generated, is considered variable power which includes solar PV, CSP and wind. Growth in the power sector’s renewable energy share is substantial compared with the Reference Case. This is due to growth in wind (more than 617 TWh/year), solar PV (233 TWh/year), and bio-mass including industrial CHP (168 TWh/year). Hydro and geothermal see no increase compared with the Reference Case.
Figure 18 shows developments in power capacity. If the trends to 2020 targets are extrapolated assuming exponential growth, the capacity for renewables could grow to 1 200-1 600 GWe in 2030. This is represented by the REmap 2030 total of 1 467 GWe. Wind nearly dou-bles to 561 GWe (including 60 GWe offshore) in REmap
2030, compared with 315 GWe in the Reference Case. Solar PV increases to 308 GWe, up from 109 GWe in the Reference Case. Solar CSP increases to 32 GWe, a three-fold increase over the Reference Case installed capacity of 12 GWe. Total hydroelectricity capacity increases by nearly 150 GWe between 2010 and REmap 2030, from 215 GWe to 400 GWe.
The increases in renewable power substitute coal capac-ity. This results in 180 GWe less coal in REmap 2030 of which 45 GWe is accounted for the early retirement of existing plants and substitution with wind power. There remains over 850 GWe of coal power generation capac-ity in the system, even after the substitution. However, this is less than the total of current installed (750 GWe) and planned coal capacity (350 GWe) as of 2011 (Platts, 2013).
The renewable energy share ranges between 10% and 64% in end-use sectors. This growth is mainly from biomass which accounts for more than half of the total renewable energy fuel use (when excluding electricity). Primary biomass demand for modern and traditional applications in China doubles from 6.1 EJ in 2010 to
Figure 18: Power capacity by renewable energy technology
0
100
200
300
400
500
600In
stal
led
capa
city
(GW
e)
2013 2030 Reference Case REmap 2030
Hyd
ro
Bio
ener
gy
Win
d (o
nsho
re)
Win
d (o
�sh
ore)
Sola
r PV
Geo
ther
mal
CSP

Renewable Energy Prospects: China58
nearly 12 EJ in REmap 2030 if all REmap Options are de-ployed (demand in all sectors). This growth is tempered by the substitution of traditional uses of biomass with modern biomass which is by a factor 2-3 more efficient in comparison.
One third-of the total renewable energy use in REmap 2030 is from biomass, and it has a higher share in end-use sector total renewable energy use of 60%. The con-tribution of non-biomass renewable energy technolo-gies to supply heat in the building and industry sectors is also substantial, with solar thermal at 5 EJ and geo-thermal at 0.3 EJ. Solar thermal capacity in 2030 would reach 1,050 GWth (or 1 500 million m2). About 40% of the total installed capacity would be in the industrial (30%) and commercial (10%) sectors in 2030. The number of electric vehicles increases to 35 million in REmap 2030. This would represent more than 10% of the total car stock in 2030. The number of two-wheelers would reach 500 million in 2030.
7.3 Renewable energy technology cost projections
Table 17 provides an overview of current and projected LCOE for new capacity power plants. In REmap renew-
able power technologies only substitute coal-based generation. In the absence of a carbon price the cost of new coal power is expected to rise to around USD 50 per megawatt-hour (MWh). Substitution of coal genera-tion includes both new capacity and existing capacity, which produces electricity closer to USD 20 per MWh. Due to China’s abundance of coal, renewable tech-nologies do not compete on cost alone, as shown by the USD 16 per GJ substitution cost for the REmap Options in the power sector.
REmap projects that generation costs for wind will re-main relatively stable, at USD 78-95 per MWh. Another ‘remote’ wind onshore option is identified. This refers to wind farms installed in regions which have high capac-ity factors, but which are more distant from the existing grid and may also require higher capital costs for their construction and equipment transportation.
Contrary to the wind, the cost of solar PV will decrease significantly to around USD 60-120 per MWh by 2030. Utility scale plants have an LCOE of USD 60-75 per kWh compared with distributed solar PV plants, which have an LCOE of USD 90-120 per kWh. However, it should be noted that costs related to the integration of various renewables are outside the scope of this study, and according to the IEA could add between USD 5 and USD
Table 17: Comparison of LCOE for power sector technologies
BNEF 2012 IRENA 2013 IEA/NEA 2010 GlobalData 2013 REmap 2030(USD/MWh) (USD/MWh) (USD/MWh) (USD/MWh) (USD/MWh)
Discount rate (%): N/A 10 10 5-8 8
Renewables: Wind onshore 46-124 79 72-125 53-67 78-95
Wind onshore (remote) 70-88
Wind offshore 91-240 95-120 125-160
Solar PV (utility)99-257 191 186-282 70-86
60-75
Solar PV (rooftop) 90-120
Solar CSP 145-200
Landfill gas ICE 42-57
Biomass 28-132 53-67 27-31
Conventional:Coal (new) 43-57
Coal (existing) 15-21
Source: Based on Asia-Pacific Renewable Energy Assessment, BREE 2014, summary of data from BNEF, IRENA, IEA/NEA, GlobalData.

Renewable Energy Prospects: China 59
25 per MWh. These additional costs could have an effect on the ranking of the price of power generation. Landfill gas will remain competitive with new coal power plants.
According to IEA estimates (IEA, 2011a; not shown in the table below), wind power generation costs vary consid-erably depending on the region and as installed capac-ity rises. For example, as the installed capacity increases from 45 GW to about 200 GW in West Inner Mongolia, LCOE increases from USD 54 per MWh to about USD 70 per MWh. For the same installed capacity (for 45 GWe), LCOE ranges from USD 50 per MWh in Gansu to USD 74 per MWh in Heibei. To reach 400 GWe installed capacity by 2030, IEA estimates an LCOE range of USD 64-84 per MWh across the seven regions with the largest wind resources18. This is similar to the REmap 2030 estimates for 467 GWe installed wind onshore capacity.
By 2030, onshore wind, utility-scale solar PV and landfill gas/biomass will be the cheapest sources of renewable power generation
System costs such as transmission can have an im-portant effect on overall estimates. According to the IEA (2011a), by 2020 the estimated average LCOE for wind would be equivalent to USD 56 per MWh, when transmission costs are excluded. When these costs are factored in, the additional cost the LCOE rises to USD 79 per MWh (a 36% increase).
Taking these costs into account, more than 200 GWe of wind capacity could be implemented in high-resource regions by 2020, which would require the continuation of annual capacity development rates today. By 2030, the LCOE (excluding transmission costs) could increase to 60 per MWh, versus tariffs which include transmis-sion costs of USD 80 per MWh. This would result in a total installed capacity of more than 400 GWe by 2030. Transmission costs would add 30-40% to the overall sum.
According to the “high renewable scenario” laid out by the WWF (2014), which foresees a 56% share of renew-able energy in power generation by 2030 (22% from wind and 18% from hydro, with the remainder a 16% mix of solar PV and biomass), there would be a weighted
18 The seven regions analysed by the IEA (2011a) are Gansu, Heibei, Jiangsu, Jilin, East and West Inner Mongolia.
LCOE of USD 85 per MWh (for all technologies including conventional). The cost of transmission and the costs of demand/peak reduction measures and storage would add USD 46 per MWh, resulting in total generation and system costs of USD 131 per MWh by 2030.
BNEF (2013) estimates total capital investment re-quirements of USD 3 256 billion between 2013 and 2030 to increase the installed capacity from 1 124 GWe to 2 867 GWe. Of this total installed capacity, half of it would be renewable energy. Of the total net ca-pacity additions estimated between 2013 and 2030 (1 743 GWe), about two-thirds is renewables (1 110 GWe) and of that about 900 GWe is related to wind and solar PV. Additional investment requirements for supporting infrastructure related to these capacity additions are es-timated as USD 1,123 billion in that period, adding about a third on top of the total capital investment. About 45% of the estimated infrastructure investments are related to transmission lines, while one-third is related to smart grids; and additional 17% is related to storage while the remainder 5% is related to demand response.
In the building and industrial sectors, the outlook is also challenging for renewable energy technologies due to the availability of cheap coal (see Annex E for an over-view of these sector end-use costs). Due to this cheap supply, many types of renewable energy technologies that provide space heating or process heat will find it hard to compete based on price alone, meaning that their substitution costs are a positive factor.
In the transport sector, the outlook for renewable ener-gy is better. Since oil is traded internationally and China is a net importer, the price per barrel of crude in China does not deviate much from increases seen around the world. For REmap a modest price increase is forecast, amounting to a barrel price of around USD 120 by 2030 (based on a lower heating value of 5.4 GJ per barrel of oil equivalent), which translates to a price for petrol that increases from USD 23 in 2010 to USD 32 per GJ in 2030 – an increase of around 50%, assuming no changes in petrol taxes.
Additionally, because China is a rapidly urbanising so-ciety and income levels are increasing, the car stock in China is expected to increase from 100 million in 2012 to about 500 million in 2030. If this were to happen, the increased demand for petrol would put even higher pressure on petroleum prices. This would enable many

Renewable Energy Prospects: China60
types of alternative transport technologies or fuels to compete on a cost-basis. However, because many alter-natives exist, ranging from biofuels to electromobility, and because there are infrastructure costs associated with increased uptake, the cost structure of these tech-nologies are still hard to estimate.
What is clear, however, is that most of these technolo-gies pose a realistic potential to compete with petrol use in transport on a cost-basis, according to the methodol-ogy applied and the cost data (capital and operation and maintenance (O&M) costs, energy prices and dis-count rates) used in this study. This growth also presents an opportunity for China to increase the use of transport modes that consume electricity rather than liquid fuels – so called modal shifts. These include supporting the introduction of local electric bus and tram systems,
as well as long-distance rail for both passengers and freight. This is already being pursued aggressively in China; however, REmap assumes more could be done and at significant cost-savings.
7.4 Summary of REmap Options: cost-supply curves
The previous sections have discussed the technology options and their costs. In this section, the options are aggregated into an overall potential curve, and they are ranked in terms of their cost effectiveness.
The cost-supply curve displays an approximate repre-sentation for the realistic potential of renewable energy
Figure 19: REmap Options cost supply curve, business perspective, by resource
Average weighted cost of substitution (5.6 USD/GJ)
1
2 3 4 5 6
7
8
9
10 11
12
13
14 15
16 17
18
19 20
21 22
23 24
25
26
27
12 14 16 18 20 22 24 26 -40
-30
-20
-10
0
10
20
30
40
Renewable energy share in total final energy consumption (%)
Reference case developments 7%-16%
7% E�ciency
28
Ave
rage
sub
stitu
tion
cost
(USD
2010
/GJ
TFEC
)
Solar PV Hydro
CSP
Solar thermal
Geothermal
Biomass traditionalBiomass otherBiofuelBiogas
Wind onshoreWind o�shore
OceanTransport with renewable electricity
Note 1: See Annex E for the numbered technologies
Note 2: The purple bars represent electrification technologies. The substitution costs of these technologies include their annualised capital (e.g., electric vehicle ownership cost), O&M and energy costs vs those of their conventional counterparts (e.g., ICE passenger car running with gasoline). It is also assumed that each additional electrification technology will result in renewable power generation capacity investments; hence, it is assumed they consume electricity from renewable sources only. These costs are included via the electricity prices that account for the changes in China’s power generation mix. As opposed to depicting the energy demand technologies (e.g., electric vehicle, heat pumps), bars for electrification technologies could also be represented by the renewable electricity supply technologies which consists of 70% wind and 30% solar PV in the case of the China.

Renewable Energy Prospects: China 61
technologies – the REmap Options – which can be de-ployed by 2030 in addition to the Reference Case. The cost supply curve is not used to develop the REmap 2030, but it is a representation of the REmap Options which have been selected.
The REmap Options are a portfolio of technologies for accelerated renewable energy deployment in the power, district heat, and end-use sectors of buildings, industry and transport. This portfolio is not an allocation of the global additional potential based on the GDP of China and the other 25 REmap countries, nor does it repre-sent extrapolations. Further technology portfolios can be generated based on the different understanding of the parameters that constitute REmap Options or other studies looking at the specific case of the China.
The results of the analysis are shown in the cost-supply curves in Figure 19 through Figure 22. This includes two sets of curves: one based on national prices (business perspective) that incorporate the national cost of capi-tal (8% discount rate), commodity prices that include
national taxes or subsidies, and technology cost and performance characteristics; and another (government perspective) based on standard international commodi-ties costs (with differentiation made for coal and natural gas between export and import countries) and a fixed 10% discount rate.
The former reflects factors likely to influence private investment decisions; the latter is more relevant to gov-ernment decisions on policy and spending. Each of these two curves is presented twice, once coloured by resource and once by sector. The national cost supply curves are used to examine the economic cost and financial savings potential of increased renewable energy uptake. The standard international curve is used when considering R&D needs, comparing renewable potential and costs across regions or globally as well as providing insight into cost differences between China and global markets resulting from policy decisions such as energy taxation.
Decision makers will be tempted to pick low-cost op-tions, from the left end of the curve, and to skip high-
Figure 20: REmap Options cost supply curve, business perspective, by sector
Average weighted cost of substitution (5.6 USD/GJ)
123
456
7
8
9
10 11
12 13
14
15 16
17
18 19
2021
2223
2425
26
27
12 1414 16 18 20 22 24 26-40
-30
-20
-10
0
10
20
30
40
Renewable energy share in total final energy consumption (%)
Reference case developments 7%-16%
7% E�ciency
28
Aver
age
subs
titut
ion
cost
(USD
2010
/GJ
TFEC
)
PowerIndustryBuildingsTransportTransport with renewable electricity
Note: see Annex E for the numbered technologies
Color code: dark blue bars: electrification technologies in transport sector; green bars: building sector; red bars: industry sector; yellow bars: power sector. Dark yellow bars: district heat sector

Renewable Energy Prospects: China62
Figure 21: REmap Options cost supply curve, government perspective, by resource
Average weighted cost of substitution (6.9 USD/GJ)
1 2 3
4
5
6
7 8 9 10
11 12 13
14 15
16
17
18 19
20 21
22
23
24 25
26
27
28
12 14 14 16 18 20 22 24 26 -40
-30
-20
-10
0
10
20
30
40
50
Renewable energy share in total final energy consumption (%)
Reference case developments 7%-16%
7% E�ciency
Aver
age
subs
titut
ion
cost
(USD
2010
/GJ
TFEC
)
Solar PV Hydro
CSP
Solar thermal
Geothermal
Biomass traditionalBiomass otherBiofuelBiogas
Wind onshoreWind o�shore
OceanTransport with renewable electricity
Figure 22: REmap Options cost supply curve, government perspective, by sector
12 1414 16 18 2020 22 2424 26
Average weighted cost of substitution (6.9 USD/GJ)
1 2 3
4
5
6
7 8 9 10
11 12 13
14 15
16
17 18
19
20
21 22
23
24 25
26
27
28
-40
-30
-20
-10
0
10
20
30
40
50
Ave
rage
sub
stit
utio
n co
st (U
SD20
10/G
J TF
EC)
Renewable energy share in total final energy consumption (%)
Reference case developments 7%-16%
7% E�ciency
PowerIndustryBuildingsTransportTransport with renewable electricity

Renewable Energy Prospects: China 63
cost options, on the right-hand side; however the figure gives a perspective of the entire country. Decision mak-ers may assume that options represented by individual blocks in the supply curve are homogenous in terms of substitution costs. However, the blocks represent aver-ages based on the assumed deployments in the REm-ap 2030. A focus on the cheapest individual options will not result in the least expensive overall transition; achieving that requires a holistic approach, and only when all of these options are pursued simultaneously can the share of renewables in TFEC of China be raised to 26% by 2030 according to this study.
In Figure 20 (below) the same curve is displayed but with the technologies coloured by sector. This curve shows that the additional potential lies largely in the building, industry and power sectors.
Focusing on the cheapest individual options will not result in the least expensive overall transition; a holistic approach is required
Figure 21 and Figure 22 are the REmap cost-supply curves for China based on standardised international commodity price estimates (which exclude the effects of taxation or subsidy) and a 10% discount rate. The curve is significantly different from the national one, resulting from the changes relating to the discount rate (10% versus 8%), and energy prices. In addition to show-ing cost differences driven by commodity prices that are locked into a local market (such as natural gas), this curve also shows the effects of price differences result-ing from subsidies and taxes on energy and how they can affect technology deployment. This curve is also used to look at regional and international contexts when comparing the results from China.
A sector-based cost curve shows that most additional potential lies in the housing, industry and power sectors
For the REmap cost-supply curves, the Reference Case growth in renewable energy from 2010-2030 is shown by the first horizontal bar, which is coloured based on resource. The resource colouring is consistent with the deployment of renewable energy seen in the Reference Case. The results of the REmap analysis and accelerated deployment of renewable energy (the REmap Options) is plotted in the curve as coloured bars showing the ad-ditional potential of each technology (on the x-axis) and the average incremental cost of substitution of deploy-ing that technology in lieu of a conventional variant (on the y-axis). The Reference Case already includes some significant expansion of renewable resources: wind and solar already see growth in the Reference Case and their incremental potential is lower in the REmap Options. In China, modern renewable energy in TFEC according to the Reference Case is expected to grow from 7% in 2010 to about 16% by 2030.
Cost-curve results by sector and technology
The results presented in these cost supply curves are dependent on projections of technology cost and fuel prices. An overview of the assumptions underlying these projections is available in the Annexes. The technology option mix and costs vary according to sector. Costs as-sociated with the Reference Case are not quantified as they are part of expected energy system developments and outside the boundaries of the REmap analysis.
The results from the REmap cost-supply curves show that some of the REmap Options identified, if viewed from a business perspective (national prices), could be
Table 18: Overview of the average cost of substitution of REmap Options for the China
Business Perspective (national prices) (USD/GJ)
Government Perspective (international prices) (USD/GJ)
Industry 5.7 5.7
Buildings 0.5 2.7
Transport -11.0 -3.7
Power 13.2 14.0
Average of all sectors 5.6 6.9

Renewable Energy Prospects: China64
deployed at a cost-saving when compared with fossil fuel alternatives. Table 15 shows the average cost of substitution for each sector. If viewed from a business perspective, the REmap Options require additional costs of USD 5.6 per GJ. If viewed from the perspective of government (international prices), the cost of substitu-tion increases to USD 6.9 per GJ, assuming the removal of tax on fossil fuels (since biomass is taxed relatively lit-tle and other renewable energy technologies that have no fuel demand are not affected by fuel taxes) and a high discount rate of 10% (most renewable energy tech-nologies have higher capital costs). This is higher than the global average of USD 2.5 per GJ estimated based on the analysis of 26 REmap countries (IRENA, 2014a).
The cost-supply curve results from the business per-spective show that most of the technologies result in incremental costs when compared with their conven-tional alternatives. However, to put these incremental costs into perspective, the incremental cost average of USD 5.6 per GJ of final energy is actually equivalent to an increase of around USD 20 per MWh, or around USD 2 cents per kWh. This is also despite China having some of the lowest fossil fuel prices in the world, particu-larly the extremely cheap coal used in the industry and power sectors. This also explains why most renewable energy options which are cost-effective are those that substitute petroleum products (largely in transport) or fuels used in the building sector (including traditional biomass). However, as shown in Table 21, if externalities are factored into the cost of substitution, the REmap Options as a whole result in cost-savings compared with their conventional alternatives. The cost-supply curves do not display these external costs since both health and environment costs are not internalised into the sub-stitution process – they are apportioned in a later step.
Most cost-effective renewable energy options in China are those that substitute petroleum products (mainly in transport) or fuels used in the building sector
In the power sector all technologies result in incremental costs when compared with conventional alternatives. This is due to low coal prices, and also because some renewables are assumed to replace existing coal power plants. The most competitive renewable energy tech-nology is landfill gas and electricity generated from biomass such as CHP plants that utilise agricultural
residues. Utility-scale solar PV, onshore wind and geo-thermal are next, resulting in incremental costs close to the total average substitution costs of USD 6 per GJ. Solar PV for rooftop applications result in an incremen-tal substitution cost of around USD 17 per GJ. However, it is important to note this is compared with wholesale power cost as for all power generation technologies, not retail electricity. Lastly offshore wind, and wind plants that substitute existing coal plants result in the highest cost of substitution of all technologies.
In the industrial sector results are similar, also due to the availability of cheap coal that does not internalise health or environmental costs. Industrial process heat generated from biomass-fired CHP plants using agricul-tural residues is the most cost-competitive option. Two novel, yet largely unused technologies, follow in terms of competitiveness: solar cooling, which replaces elec-tric cooling, followed by heat pumps providing process heat for temperatures of up to 150 oC. Both of these technologies compete well, with only around USD 3 per GJ incremental costs. The largest potential is found in solar thermal for low-temperature heat applications; however, the cost of substitution is the highest among all technologies in the industry sector (USD 11 per GJ).
The building sector includes renewable technologies that substitute both fossil fuels and traditional use of bi-omass. The most competitive is modern biomass-based space heating that substitutes heating oil, mainly due to high oil product prices. Heat pumps also result in cost-savings when substituting natural gas; however, their potential is lower than biomass. Modern renewable-based cooking results in cost-savings when compared with traditional uses of biomass when modern solid biomass is used. Utilising biogas for heating or cooking applications instead of traditional forms of biomass re-sults in only a small incremental cost. The largest poten-tial is in solar thermal heating, as in the case of industry, which is already very prevalent in China. REmap shows this additional potential can be deployed at a relatively low incremental cost. It is important to note that China has a significant district heating network in many cities, and REmap shows that waste-to-energy systems can provide significant additional potential, however at an incremental cost above the average.
The transport sector has the most competitive set of renewable technology options. This is due to the high cost of oil, which mirrors world prices, relative to the

Renewable Energy Prospects: China 65
lower cost of coal used in the other sectors. Technolo-gies that utilise electricity, which in China is cheap, re-sult in the most cost savings. Developing passenger rail networks that substitute aviation, or urban tram or subway systems that substitute passenger automobiles, result in significant savings. However, China is build-ing significant infrastructure for these technologies, so only limited additional potential is available beyond the Reference Case. Forms of individual electric transit, including various forms of electric vehicles and electric 2-3 wheelers are also cost competitive. However there is significant growth in these technologies already as-sumed in the Reference Case, so additional potential identified in REmap 2030 is also limited. Electric mobil-ity technologies have high efficiency compared with fossil alternatives, so even though they seem small in energy consumption terms, they provide significantly better performance (in terms of passenger miles, for instance) than a comparable unit of petrol or diesel. No liquid biofuel growth has been assumed for China in REmap 2030 beyond the Reference Case.
Benefits of REmap Options
In addition to economic arguments for increased re-newable energy deployment, there is also a strong environmental case. The REmap Options would result in an estimated reduction of 1.7 gigatonnes (Gt) of CO2 by 2030 (Table 19). The largest decrease would occur in the building sector, followed by the power sector. If all REmap Options were fully deployed, China could reduce its CO2-related emissions from energy combustion by around 17% over the 2030 Reference Case.
Reductions in emissions from China would contribute 21% of the global CO2 emission reductions which could
be achieved if all REmap Options required for doubling the global renewable energy share are implemented by 2030 (a total of 1.7 Gt CO2 emission reductions by 2030). Among the 26 REmap countries, China has the largest potential in terms of an absolute reduction in emission volumes. China is followed by the reduction potentials of the USA and India if all REmap Options are to be implemented. These three countries could account for half of the potential reductions in global emissions according to REmap 2030. Deploying renewables and reducing emissions in these countries are essential for a transition in the global energy system and to mitigate climate change.
China, the USA and India together could account for half of global reductions in emissions by 2030 if all Remap Options are implemented
These emission reduction estimates assume that all renewable energy sources are carbon-neutral. While this applies to most renewables, it is not the case for biomass due to GHG emissions during bioenergy harvesting, processing and combustion, in particular when land use change emissions are accounted for. In addition, emission estimates are subject to uncertainty originating from the discrepancies in China’s energy statistics, mainly related to coal use in coal washing and the manufacturing and industrial sectors. For the year 2010, the margin of error for China’s total CO2 output is estimated as 1.4 Gt, which is nearly as high as the total emissions avoided under REmap 2030 (Guan et al., 2014). With better data, total energy use projections and thus CO2 emission saving estimates can be refined.
Table 19: Development of China CO2 emissions, 2010-2030
2010 Reference Case 2030 REmap 2030 Total avoided(Mt/year) (Mt/year) (Mt/year) (Mt/year)
Power and district heat generation 3 595 5 762 4 544 1 218
Industry 2 327 2 746 2 528 217
Transport 529 1 199 1 123 76
Buildings 467 478 298 181
Total emissions from fossil fuel combustion for energy services 6 917 10 185 8 493 1 692

Renewable Energy Prospects: China66
If all REmap Options are implemented in 2030, total emissions from the building and power sectors of China can be reduced by 37% and 20%, respectively
There are also socio-economic benefits to increasing the use of renewables. According to IRENA estimates, about 6.5 million people were already employed in 2013 in the renewable energy industry worldwide, of whom 2.6 million were in China (IRENA, 2014d). By 2010, China had the largest number of people working in the solar PV sector, with 120 000 jobs. In the solar thermal sector the total number of people employed was between 250 000 and 600 000 in the period 2006-2010. The biomass sector also provided about 266 000 direct jobs.
The total number of jobs worldwide could reach 16 mil-lion (in cumulative job-years) by 2030 according to REmap 2030. This implies an equivalent of 0.9 million additional jobs which could be created in the global renewable energy sector (IRENA, 2014a). Given that a large share of the global renewable energy use esti-mated in 2030 would be in China, the country would benefit considerably from these additional jobs cre-ated.
The REmap Options identified in China result in incre-mental system costs of USD 55-60 billion from a gov-ernment perspective (Table 20). System cost calcula-tions from a government perspective exclude energy taxes and subsidies, and use a standard 10% discount rate for capital investment. Incremental system costs
do not include benefits related to reductions of air pollution (health) and CO2 emissions. If such exter-nalities are included, and depending on how these are valued, full deployment of the REmap Options could result in estimated reduced health costs of USD 78-162 billion per year by 2030. These avoided external costs result from a reduction of health complications due to air pollution from fossil power plants, indoor and outdoor air pollution from the traditional use of biomass and other solid fuels as well as fuels used in the transport sector.
If the benefits of the 1.7 Gt of reduced CO2 are taken into account, an additional USD 32-126 billion per year could be saved by 2030 (based on a carbon price of USD 20-80 per tonne CO2). The result of these externalities is a possible reduction in energy system costs of between USD 55 billion and USD 228 billion per year. It is therefore possible to raise the renewable energy share with significant savings if externalities are included, and depending on how these are valued.
For example, today the damage to GDP related to acute mortality (from PM and sulphur dioxide) is equivalent to between 0.65% and 3.81% of China’s total GDP, with premature mortality of 62 000-125 000 per year. Chronic mortality related to particulate matter alone resulted in 561 000 cases of premature mortality annually with a total health damage to GDP of 4.36% (Ho and Nielsen, 2007). With total reductions in coal use of about 16 EJ (or a 18% reduction), total savings could be equivalent to 0.78% of GDP. This would mean
Table 20: Financial indicators of REmap Options, based on government perspective
(USD bln/year)
Changes in costs of the energy system (in 2030)
Incremental system cost 55-60
Reduced human health externalities from -78 to -162
Reduced CO2 externalities from -32 to -126
Net cost-benefits from -55 to -228
Incremental subsidy needs in 2030 60
Investments (average between today and 2030)
Incremental investment needs 40
Total investment needs (REmap Options) 54
Total renewable energy investment needs (REmap Options and Reference Case) 145

Renewable Energy Prospects: China 67
a total saving of up to USD 200 billion per year, as-suming China’s total GDP doubles by 2030 to USD 25 trillion.
Table 20 shows that the total investment needs of the REmap Options would be USD 54 billion per year. The table also shows that in addition to investment, an an-nual subsidy of USD 60 billion would be required to make REmap Options technologies with positive sub-stitution costs “competitive” with fossil technologies. Technologies which require a subsidy lie mainly in the end-use sectors rather than power generation, namely for heating in buildings and industry (solar thermal) and electric vehicles.
This cost would likely be borne by consumers in the form of increased energy costs or taxes. It is important to note that by 2030 many renewable energy technolo-gies should not require a subsidy, and should actually result in lower energy costs, so a better metric for en-ergy prices might be the incremental system cost, which shows that energy prices would increase slightly.
7.5 Discussion of REmap 2030 Options
Technology development challenges
Among the different REmap Options, four technologies need to grow substantially if the estimated potential of renewables in REmap 2030 are to be realised. Onshore wind power needs to grow by about 24 GWe/year, solar PV by about 17 GWe/year (40% of that related to roof-top installations) and solar thermal by about 48 GWth/year (40% related to industrial process heat and other commercial applications). Given that there is very lim-ited deployment of offshore wind today, development of 3 GWe/year is another substantial addition. Biomass as a source of energy for both the power and end-use sectors will also need to grow substantially and its tra-ditional uses will need to be fully substituted according to REmap 2030.
While the growth rates envisioned are slightly higher than current trends, another major issue lies in expand-ing grid transmission capacity. This will require substan-tial investments. Estimates of other studies show that additional infrastructure related to the power sector (transmission, variable renewable energy measures) can add between 30% and 50% in addition to the total
investment costs of power plants. Other grid constraints (e.g., institutional barriers, see Section 8) need to be resolved in the short-term as well to avoid today’s situa-tion of capacity being installed but not necessarily con-nected to the grid.
In addition, inter-provincial transmission infrastructure needs to be built to allow power from the northern, northeastern and northwestern regions to be supplied to central and coastal demand areas. Inter-regional connections need to be strengthened and electricity trading markets will need to be developed. Some of the solar PV and wind development can be pushed to lower resource regions to ease the long-term challenge of building transmission grids. There will also be a focus on southwestern hydroelectricity in the future, given the distribution and development of water resources; however, here too there is a shortfall in planning for long-distance transmission lines. With regard to solar PV, the quality of equipment needs to be improved to ensure long project lifetimes.
In the case of offshore wind, the main challenge will be to increase connection to the mainland grid. China has limited experience in this area so far, particularly when it comes to connecting farms further from the shore. Hence, the challenge will be to develop solutions by 2020 to cope with the potential growth in offshore wind such as the development of offshore substations and sub-sea cabling as well as improving gearbox reliability. In parallel, offshore wind-related equipment manufac-turing output will need to grow to meet the growing demand (Carbontrust, 2014). Furthermore, China needs to focus on developing technologies that can deal with the corrosive effects of seawater on offshore installa-tions as well as typhoon-resistant models.
In addition to technical challenges, costs may also be a problem for solar and wind since, as capacity increases, spatial constraints in certain regions may create issues. Hence today’s economically competitive locations may be less cost-effective in the longer term as their poten-tial is realised.
As solar and wind capacity increases, the most favourable locations may become less cost-competitive due to spatial constraints
Solar thermal heat use in the building sector is already high in China and this is estimated to nearly quadruple

Renewable Energy Prospects: China68
by 2030, from 258 million m2 to 900 million m2. While this is already a challenge in its own right, the main ef-fort will need to focus on deploying 600 million m2 solar thermal in the industrial (450 million m2) and commer-cial (150 million m2) sectors, where installed capacity today is nearly zero. Assuming 10 megawatts-thermal (MWth) of installed capacity per solar thermal facility, this would mean more than 30,000 manufacturing in-dustry plants would be equipped with such technology.
China has a manufacturing industry that is diverse in terms of its energy demand and process heat tempera-ture levels. Although much of industry comprises medi-um- and high-temperature sub-sectors such as cement, chemicals and iron and steel, many food processing and textile manufacturing plants exist which utilise low temperature heat. Given the highly cost-competitive solar thermal equipment available in China, such sectors can benefit from solar thermal if the right policies and targets are put in place for 2020 and 2030.
Bioenergy is estimated to have a potential across all sec-tors. However, the residential and industrial sectors pose particular challenges. In the residential sector, traditional uses of biomass are decreasing, and being substituted with modern forms of fossil fuels such as liquid petro-leum gas (LPG). This change in fuel sources needs to be steered towards modern renewables, including modern forms of biomass. This requires the availability of reliable and affordable modern cook stoves. Earlier experiences showed that such equipment may not necessarily be accepted and used. Thus the challenge here concerns aspects of policy and public awareness as opposed to technical barriers.
Given the focus of China on non-food based liquid biofu-els, the majority of production will need to be provided by advanced biofuel plants. So far production capacity is limited which means that substantial investments will be required to meet the potential demand. The capital costs of these plants are currently higher than conven-tional liquid biofuel plants. This capacity needs to be deployed already by 2020 to meet the assumptions of the Reference Case. Meeting all demand locally would require about 200 advanced biofuel plants, each with a total production capacity of 230 million litres ethanol per year.
The China biodiesel industry needs to compete for feed-stock supply with gutter oil. According to Van Sambeek
et al. (2013), 200-300 million tonnes of gutter oil is pro-duced and sold back to market as edible oil each year.
As with solar thermal, biomass is not a fuel of choice for process heat generation in industry. However, a considerable share of up to 20% of the total demand from cement kilns, which comprise one of the largest manufacturing sectors in China, can be provided by biomass, waste and other fuels without any process modifications. In addition, biomass-fired CHP is an alternative to any fossil fuel-based heating systems and can be considered in investments for new production plants.
Water could be a major challenge with regard to a number of renewable energy technologies, in particular bioenergy and CSP, as is the case today for the coal supply chain. Among the different renewable power generation options, CSP is one of the most water intensive options. In particular, areas where CSP can be deployed (Qinghai, Gansu) are also arid. Water for bioenergy cultivation is another important consideration. Although the liquid biofuel market in China is not as developed as in the USA or India, about three-quarters of the total is assumed to originate from conventional feedstocks which also rely on water. For example, sorghum-based ethanol production is the most water-intensive route, followed by corn- and cassava-based ethanol.
Deployment of the full potential for biomass will depend on the availability of bioenergy supplies. In the high case of biomass supply, demand could utilise up to two-thirds of total available. But if supplies are limited, demand is likely to exceed the domestically available biomass in China. As part of the demand may need to be met from land- and fertiliser-dependent energy crops, improving yields and using marginal land will be important.
Focusing on the energy-land-water nexus and optimis-ing the key routes will be very important if China is to realise its bioenergy potential. China also needs to start now on developing collection and logistics systems to increase the availability of scattered agricultural and forestry bioenergy to end-users. Conversion of feed-stock to higher energy density biomass and related technologies (e.g., torrefaction) will gain importance. Another option to reduce increasing dependency on bioenergy will be to reduce total demand by improving energy efficiency.
Renewable Energy Prospects: China 69
Overcoming these development challenges will require target setting, the development of finance mechanisms and in particular efforts to address transmission-related issues. China is currently putting much effort into these issues, but this effort needs to be sustained in the long term to 2030 and beyond.
The case for electrification
The analysis shows that biomass resources in China ac-count for around 30% of the identified options in REmap 2030. However, affordable and sustainable sourcing of biomass remains an important issue. The concurrent deployment of alternative and complementary renew-able energy resources can help to reduce the potential dependence on biomass.
Electrification offers the potential to reduce fuel use for heating and transport. To further explore and clarify the renewable electricity potential, we have created an additional set of REmap options expressly for this case, Remap-E, which considers a more radical electrification scheme than REmap 2030. It essentially replaces most biomass and some fossil fuels with electricity from re-newables. In REmap-E, we assume the deployment of three technology strategies to reduce biomass depend-ency and increase the share of electricity in end-use sectors. In the building sector, heat pumps deliver the required heat in the building and industry sectors in-stead of biomass (but only for low temperature heat). In the transport sector, modal shifts (public trams, electric buses and trains) can replace liquid biofuel use. Increased electricity demand from these end-use sec-tors would be supplied by additional solar PV and wind capacity.
A more radical electrification plan (REmap-E) could raise the share of renewables in power generation and total final energy consumption
In industry, the options for heating are limited, especially in the case of high-temperature process heat generation in the manufacturing sector, which can only be gener-ated from biomass (or fossil fuels). However, for low and medium temperature applications, heat-pumps could be deployed. In the manufacturing industry an increase in electricity demand resulting from a switch from bio-
mass fuels to heat-pumps results in around 470 TWh/year of additional power demand.
For the transport sector, the additions in biofuel con-sumption identified in REmap 2030 are replaced by a shift from passenger automobile to electric public transport. For this around 20% of this passenger traffic is met by better utilisation of existing public transport lines, and the remaining 80% met through new electric transport infrastructure. In total 38 TWh of additional electricity is needed to power these electric transport systems.
In the power sector, there are plenty of alternatives to substitute biomass use in power production. In REmap-E, 230 TWh of power production from biomass is reduced compared with REmap 2030, or a 66 TWh reduction over the 2030 Reference Case level. It was assumed that this reduction is met by increases in solar PV generation. Additionally, the increased electricity demand resulting from electrification in the end-use sectors of 415 TWh is met with 50% solar PV, 25% of onshore wind and 25% offshore wind.
Figure 23 compares the breakdown of the additions identified in the various REmap cases, as well as the renewable energy share in the energy mix of 2030: REmap 2030 and REmap-E and REmap-U, which shows how a 30% or great renewable energy share could be achieved on a global basis. Note that the share of re-newables in TFEC would be slightly higher with electri-fication technologies replacing biomass, increasing from 26% in REmap 2030 to 29% in REmap-E.
Biomass demand in China is assumed to increase in primary terms to 6.8 EJ by 2030 in REmap-E instead of 11.9 EJ in REmap 2030. This translates to almost no growth in biomass demand compared with today’s levels. Compared with REmap 2030, this is halving the demand for total biomass use.
The effect on the power sector in terms of installed capacity is dramatic. The total capacity of solar PV doubles from just over 300 GWe REmap 2030 to over 600 GWe in REmap-E. For wind, including both offshore and onshore, around 100 GWe of additional capac-ity is added, resulting in around 630 GWe in REmap-E. Biomass power capacity decreases to about 25 GWe, or around two-thirds the 2010 level. The share of renew-able energy in power increases from 39% in REmap

Renewable Energy Prospects: China70
2030, to 43% in REmap-E. These have the effect of rais-ing the share of variable renewables in generation from 19% in REmap 2030 to 26% in REmap-E, implying that even more efforts will be required to ensure grid stabil-ity compared with the REmap 2030 case.
Another important finding is that REmap-E results in a lower TFEC in 2030 of 83 EJ compared with 90 EJ in REmap 2030, a saving of 8%. The main reason is the higher energy efficiency of electrification technologies over combustion energy systems when viewed in final energy terms. As a result, even with a smaller increase in EJ from the REmap Options in REmap-E, a similar share of renewables can be achieved as in REmap 2030.
Another strategy for doubling the global renewable energy share is represented by the case of REmap-U
(also shown in Figure 23). In this case, all countries are assumed to reach at least 36% renewable energy share by 2030 regardless of where they stand today, using a generic mix of different renewable energy technologies. While some countries would need to substantially in-crease their renewable energy shares from today’s very low levels to 30%, others would meet, or even surpass, this level according to their Reference Case develop-ments.
A number of technology options and strategies are required to ensure that all countries reach at least 30% by 2030. According to REmap-U, the first strategy for all countries is to reduce energy demand by implementing ener gy efficiency measures. The reduction potential would differ for each country, varying with the growth of energy consumption and the current level and dis-
Figure 23: Renewable energy technology options in the cases of REmap 2030, REmap-E and REmap-U, 2030
-1500
500
2500
4500
6500
8500
REmap 2030 REmap-E REmap-U
Add
ition
al re
new
able
ene
rgy
in T
FEC
(PJ/
year
)
Traditional biomass
Wind o�shore
Wind onshore
Geothermal
CSP
Solar PV
Solar thermal
Biomass (power)
Modern biomass (liquid)
Modern biomass (solid)
28% RE share
30% RE share
26% RE share
Note: All cases result in a reduction of traditional uses of biomass and REmap-E results in a reduction of biomass use for power generation, these are shown with the negative values in the graph

Renewable Energy Prospects: China 71
tribution of energy intensity. For China an energy ef-ficiency improvement of 5% was assumed.
The second strategy involves using in creased electrifi-cation technologies for countries that do not achieve a 30% renewable energy share after the REmap Options and energy efficiency improvements are considered. This includes China, which only achieves slightly more than 28% in REmap-U when only energy efficiency
improvements are taken into account. The electrifica-tion technologies chosen for China are those used in REmap-E, with the exception of industry reloca-tion, which is not considered. As shown in Figure 23, REmap-U takes China’s renewables share to 32%.
There are increased costs associated with both of these cases. These increased costs are in addition to the sub-stitution cost already incurred when deploying biomass
Figure 24: Comparison of REmap 2030 with the findings of other studies for power sector, 2030
2010
Referen
ce Cas
e
REmap
CNREC (2014
), Idea
l
Greenp
eace
(2012)
, ER
IEA (2013c
)
WW
F (2014
), High R
E
WW
F (2014
), Low C
BNEF (2013)
Jiang
(2014
)
2010
Referen
ce Cas
e
REmap
CNREC (2014
), Idea
l
Greenp
eace
(2012)
, ER
IEA (2013c
)
WW
F (2014
), High R
E
WW
F (2014
), Low C
BNEF (2013)
Jiang
(2014
)
19%
28% 39%
46%
43% 40%
56% 52% 39%
0
2000
4000
6000
8000
10000
12000
Pow
er g
ener
atio
n (T
Wh/
year
)
Coal Natural gas Oil Nuclear
Hydro Biomass Solar PV CSP
Wind onshore Wind o hore Geothermal Ocean / Tide / Wave
0
500
1000
1500
2000
2500
3000
3500
Inst
alle
d ca
paci
ty (G
We)

Renewable Energy Prospects: China72
technologies. In REmap-E, for the building sector, the in-crease amounts to only around USD 1 per GJ to the sub-stitution cost. For the transport sector this increase rises to around USD 10 per GJ for the impacted technologies. In industry the use of heat pumps adds around USD 2 per GJ to the substitution cost. For REmap-U, similar costs are associated with increased electrification, the assumed energy efficiency improvements yielding cost savings since less renewable energy capacity is re-quired. As a result, the cost impact of REmap-U is lower than REmap-E.
Comparisons with other studies
Figure 24 provides a comparison of the REmap 2030 findings for the power sector with those of a number of other scenario studies. The most ambitious renewable energy scenario has been chosen from these studies for comparison with the REmap 2030.
IRENA’s total power generation estimates of 9 595 TWh/year are in the middle of the range found by other studies, which span from about 8 000 TWh/year to 11 000 TWh/year in 2030. In terms of the renewable en-ergy share in power generation, REmap 2030 estimates are 5-15 percentage points lower than others. This is partly due to higher forecasts for coal-based power generation of around 4 300 TWh/year in REmap 2030, compared with between 2 600 TWh and 3 400 TWh/year in other studies.
Hydroelectricity generation is among the highest in REmap 2030, with about 1 600 TWh/year compared with total installed capacity of around 400 GWe in most other studies. The difference is explained by the higher capacity factors of 4 000 hours assumed in REmap 2030.
Total power generation from wind of 1 300 TWh/year is lower than other studies. With regard to biomass and geothermal power generation, REmap 2030 is compa-rable to projections in other studies. Greenpeace (2012) projects much higher generation for offshore wind, geothermal and ocean technologies compared with any other studies.
A comprehensive review of various modelling tools looking into China’s energy future has been carried out by Mischke and Karlsson (2014). According to the review of 10 energy models, the total energy demand of China could grow by anywhere between 50% and 125% by 2030 compared with 2010 levels. In the Reference Case of this study, total final energy consumption grows by about 60%, which falls in the middle of this range.
Forecasts of China’s energy demand growth by 2030 vary widely; projections in the Reference Case of this study fall in the middle of the range

Renewable Energy Prospects: China 73
8.1 Barriers and opportunities in the power sector
Conventional fuels
As a result of its coal dependence and size of the econo-my, China has the highest CO2 emissions of all countries. Moreover China currently accounts for 70% of new CO2 emissions each year. Burning coal also results in massive local and regional air pollution problems. The record air pollution in January 2013 resulted in increased efforts to limit coal use, especially in the populated and industrial areas of eastern China. The government has recognised these environmental problems and is trying to diversify its energy mix.
Around 95% of the total power generation capacity in China has been built since 1990 and will still be op-erational in 2030. Therefore replacement investments play a secondary role in the transition to renewables unless the costly early retirement of some coal-fired plants is considered, as has been addressed in the case of onshore wind power in this study. However, demand growth is projected to continue and double between 2010 and 2030. This translates to about 1 000 GWe of fu-ture coal power generation capacity. Overall, more than 500 GW of capacity additions are planned of which 70% are coal-based (Platts, 2013).
Transmission and grid infrastructure
The distribution of energy resources in China is diverse. More than 80% of the potential energy resources, such as coal, oil, natural gas, hydroelectricity, wind power and solar energy, are distributed in the northern and western parts of China. Around 80% of onshore wind energy capacity is distributed in the “3-North” regions (North, Northeast and Northwest). Two-thirds of hydroelectric-ity is located in the southeast. The spatial distribution of supply and demand creates challenges. Significant transmission capacity is planned, but not yet in place. Moreover, renewable power competes with coal power for the same transmission capacity.
By contrast, 70% of the total demand is in central and coastal parts of China (Hammons, 2011). The distance between the best resources for renewable energy gen-eration and the main areas of demand is a major ob-stacle because of the large investment needs for new transmission and distribution capacity.
This has already constrained the rapid expansion of renewables. There is a considerable lag between addi-tions in wind power capacity and the proportion that has been connected to the grid (DB, 2012; Zhang et al., 2014). In 2012, 22% of installed wind power was run-ning idle, mainly due to the fact that coal-fired power plants have, in practice, priority grid access and grid capacity is limited. As of the same year, 20% of China’s wind farms were not connected to a power grid. This is caused by a combination of factors that include, rapid capacity expansion, limited coordination between pro-ject developers and grid planners, lack of transmission capacity and technical concerns of regional utilities that the intermittency of wind power could be disruptive to normal operations19 (Zhang et al., 2014).
Restrictions to inter-regional grid connections mean that cross-regional trade represented 4% of total pro-duction in 2009. Much of this is due to the fact that coal power plants still have priority (IEA, 2011b; Davidson, 2013b). The effect might be small in Liaoning, Ninxiang, Yunnan and Xinjiang but it falls 1-3 percentage points off capacity factors in Jilin, Inner Mongolia, Gansu, Heilongjiang and Hebei. The effective capacity factor of Chinese wind is 22-23%, compared with 31-32% for the United States (2013 data). Curtailment rates ranged from 13% to 25% in 2012, although these restrictions are falling. Between January and June 2014, the nation-wide curtailment rate was 8.5%. According to China’s renewable energy policy, wind farm owners should be compensated for curtailment, but in reality no economic compensation is paid.
19 Different accounting systems for annual wind market statistics have led to different information about the status of wind farm connection to the grid; thus different values are found in the litera-ture.
8 BARRIERS AND OPPORTUNITIES FOR RENEWABLE ENERGY TRANSITION

Renewable Energy Prospects: China74
Grid is a key enabler and the future of wind energy is closely connected to the future development of grid policies. So far, high curtailment rates related to prob-lems with grid connections, the lack of priority dispatch and missing power grid capacity have led to uncer-tainty and financial losses. In 2013, wind saw a capac-ity increase, possibly as a result of improved measures to reduce curtailment. In addition to curtailment, the second other big system challenge which China’s wind sector is facing today is grid interconnection, but China made considerable progress related to that as well since both new installations grew and the percentage of non-connected capacity fell.
With regard to solar PV, curtailment in the first half of 2014 reached up to 30% for many plants, and in particu-lar in provinces where solar PV capacity is high. Some 70-80% of the overall capacity comprised utility-scale plants facing significant grid curtailment constraints (notably in the northern and northwestern regions).
Despite the improvements in wind power, a number of institutional barriers continue to stand against in-creased transmission. These include disagreements on the engineering and economic merits of AC vs DC lines, fragmented transmission authorities (implying the need for centralisation of dispatch and transmission), and non-market and semi-transparent transmission pricing (Davidson, 2013b).
Each of the three independent grid companies in China, namely SGCC, China State Grid Corporation (CSGC) and the Western Inner Mongolia Grid Corporation, is responsible for its own profit and loss. This limits incentives for inter-company co-operation. Furthermore, the current electricity trading structure is an obstacle. Without changes to the current system, the expansion of grid transmission capacity may not be a solution. Spot market electricity trading is small
(14% of the total power generated in 2009); otherwise inter-regional and provincial trading is determined by multi-year contracts, both in terms of the volume and price (IEA, 2011b).
Solar photovoltaics
China had 21 GWe of solar capacity installed as of the end of 2013. In the same year, a distributed FiT was introduced. For solar PV, the deployment strategy has changed in recent years. Before 2013, the focus was on large-scale solar PV installations. There has been movement on this front and since then the focus has begun to shift towards distributed solar PV applications. NEA recently approved 1.8 GWe of distributed industrial/commercial solar PV demonstration projects, and more than 3 GWe of capacity was commissioned in the first half of 2014, with cumulative distributed PV capacity reaching 4 GWe by the end of June 2014 (CREIA, 2014b). This is a considerable increase compared to end of 2013 where only 800 MWe capacity was installed. But current solar PV leasing models have encountered a number of issues related to uncertainties about ownership of a property over the contract period. Such uncertainties could put developers into a situation where the contract might not be respected if the business owner has changed. Moreover, although the saved tariff and received subsidies should be shared between the developer and roof owners, the developers might face difficulties in receiving their share timely or fully as agreed in the contract.
Execution of projects has so far also been hampered by a number of other factors. These include financial returns determined by FiTs which are less attractive as current policy prefers a 100% self-generation and self-consumption model instead of selling self-generated power to the grid. In addition, multi-point grid connec-tions are not allowed, while residential power prices are
Box 6: Inner Mongolia case study: The need for connectionIn 2010, Inner Mongolia had total power generation capacity of 34 GWe. In comparison, demand is only 18 GWe. Of the remaining 16 GWe, only 4 GWe can be exported to the northern China grid. This means there is an overcapacity of 12 GWe. This problem will grow as more wind farms are built. In the 12th FYP, Inner Mongolia requested the following grid expansion: seven 600 kV AC lines, one 660 kV DC line, and one 800 kV Ultra High Voltage Direct Current (UHVDC) line which can bundle hydro, thermal and wind power and transmit 30 GWe outside of the province (Lu, 2010).

Renewable Energy Prospects: China 75
much lower than the industrial and commercial rates. This makes residential schemes comparatively unat-tractive: there is an unguaranteed stability of the load, and as discussed above no standardised roof leasing contracts are available, and the ownership and poor structural stability of roofs is often unclear. All of these risks help to limit the confidence of banks in providing loans to distributed solar PV investors. Quality of equip-ment (affecting lifetime, return on investments, etc.) and standards are also key issues.
To address these issues, Chinese authorities released a number of policy updates in September 2014 to ensure that the installation target of 8 GWe of distributed gen-eration can be reached.
Standardised grid connection regulation for solar PV electricity generators with a capacity below 2.5 MWe can guarantee private investors access, connection and priority dispatch for the distribution grid one month after the completion of construction. In combination with standardised building regulation, this should help to achieve the 2020 distributed solar PV targets. Public buildings might get permission to lease rooftops to in-vestors, benefiting both parties.
Wind offshore
While offshore wind today is more expensive in China than onshore wind, it is a technology of high strategic importance. The cost reduction potential for offshore wind installations is significant. The majority of China´s mega cities are close to its long coastline and relatively short distances for new power lines are required to con-nect offshore wind farms with cities and industrial areas. However, current offshore wind targets are low and a mid-term programme to accelerate installation rates would help to boost the industry.
Bioenergy
Bioenergy for power generation is a mature market, but today feedstock collection and the unstable prices of feedstock are major problems to its deployment. Resi-dues have a large potential, but agricultural production is mostly small-scale and geographically scattered. Sup-ply chains are not yet established to collect and deliver the required quantities to end-users. Despite the large availability of straw, for example, its harvest period is short (six weeks), meaning large-scale storage is re-
quired, as are distribution networks to make the most of the resource.
As a result, the growth of biomass power generation capacity has been very moderate. Waste-to-energy technologies exist, but problems arise over the pricing of waste treatment services and the allocation of energy recovery benefits. Related environmental impacts are another issue limiting the further use of waste for power generation.
Feed-in Tariffs
China has chosen to use FiTs to support the deployment of renewable energy. So far the experience has been good in general, despite problems with long delays in reimbursing producers. But the total costs of the FiT system are growing rapidly and the Chinese govern-ment aims to gradually reduce the amount of tariff spending with the aim of stopping FiTs for new installa-tions by 2020. A smooth transition is required in order to secure the future development and growth of the renewable energy industry. Parallel to the phasing out of FiTs, the current “FiT” – a guaranteed price per MWh which is set by the NDRC for thermal plants – should be phased out at the same time in order to achieve a level playing field.
It is not only the FiTs, but grid regulations which could be the backbone of the renewable energy sector in the future. If that would be the case, renewable energy sec-tor will need more regulatory support after 2025 and less monetary support. Priority dispatch and mandatory grid connections will be key policy instruments as they are expected to enter full competitiveness with conven-tional power generation technologies between 2020 and 2025. A minimum tariff for all renewable energy generators – based on the annual average generation costs of the previous year – could remain as a fall-back-option in order to lower the risk to investors.
Renewable energy equipment manufacture
China has a large wind turbine and solar PV production capacity. The massive scale-up of solar PV production in the country has contributed significantly to the rapid decrease of solar PV investment costs. Some two-thirds of all solar water heaters and 90% of biogas installations are also located in China. A combination of market size, industrial capacity and the application of policies to

Renewable Energy Prospects: China76
specific areas of renewable energy use has enabled this development.
While it may not be the case today, China might face several challenges to developing its renewable energy industry further over the coming decades, including the increasing export orientation of the wind industry and increased imports related to the domestic solar PV market. Targets for equipment manufacturing capacities (solar PV and wind) in terms of GW/year, which take into account the medium and long-term goals for the do-mestic market, require re-powering needs. The overall assumed development of the global market size could be useful in this respect. Long-term certainty helps to achieve cost stability for renewable energy policies as well.
Improving the quality of products is important for a number of reasons. Better products enhance the life-time and durability of plants, thereby ensuring a higher return on investments. As a consequence, this creates more confidence for both investors and financiers. Fur-thermore, there is a need for continuous innovation and R&D to improve the efficiency of plants.
8.2 Power market reform
Power market reforms have been on the Chinese gov-ernment’s agenda since 2002, and several local tests have been conducted. On the national level, however, there is only limited progress. Power market reforms on the wholesale and retail side are closely linked to power sector restructuring with more transparent pricing of grid services and clearer division of roles regarding grid development and system operation.
In essence, the power sector can be broken down into three independent areas: power production, transmission and distribution. Transparent regulation for grid access, grid services and dispatch and wheeling fees/regulations enable private and public investors to enter the power market. Unbundling the sector from a transmission grid operator (TSO) and distribution grid operator (DSO) is possible both with private and state-owned ownership structures. Liberalisation of the power sector in Europe over the past 20 years has shown that state-owned grids can still provide access to private investors.
Each entity must be independent, with a legal frame-work which guarantees a level playing field without the discrimination of third parties. The lack of progress in that regard creates challenges for the renewable energy sector.
Firstly, delays in power sector reform create serious problems for the integration of renewable energy. The state-owned power generation companies have their power production prices set by the government; oper-ating hours are set on a yearly basis for coal plants that represent the bulk of generation capacity. This makes it difficult to ensure that the electricity system is efficient. The power uptake of renewables is regulated through state-regulated hydro expansion and portfolio stand-ards combined with FiT for solar, wind and bioenergy, and it has been difficult to coordinate the deployment of these technologies with plans for local grid develop-ment.
8.3 Barriers and opportunities in end-use sectors
In 2030, power consumption would only account for 30% of China’s total final energy consumption. 70% would be related to fuel use in end-use sectors for heat-ing and transport. This means efforts in end-use sectors to overcome related barriers, thereby accelerating the use of renewables will be essential.
Heating demand can be divided into four components. Heating in buildings is for cooking as well as space and water. In the manufacturing industry, it is process heat for production in the form of steam, hot water or direct use.
So far, most policy attention has been related to im-proving efficiency, but some renewable technologies achieved considerable success. Today there is a sup-port programme which covers both urban and rural consumers regarding the increased use of solar thermal for water heating. However, its capacity in the industry sector is negligible. Biomass also plays a negligible role in industry, with the exception of some non-metallic mineral production processes that use charcoal or bri-quettes as well as the use of black liquor in the pulp and paper industry. There is no policy focus to accelerate the use of renewables in the sector.

Renewable Energy Prospects: China 77
District heating plays an important role in urban areas of northern China. The heat is however predominately produced from coal-fired CHP. Biomass-fired district heat generation and other non-biomass renewables are alternatives. Some of the solar heating and geothermal related targets of the 12th FYP may create synergies for the district heat sector. To date, there are a number of solar thermal pilot projects for district heat generation.
China’s biogas programme has resulted in the rapid expansion of biogas digesters; today around 100 million rural people benefit from such systems. In view of the changing socio-economic landscape (e.g., decreasing rural population), policies need to be adapted to ensure continuity in growing biogas use.
One of the key challenges in the residential sector is the traditional use of biomass. The first priority is improving knowledge about the actual use of traditional biomass, hence measuring current demand. There is a wide range in statistics about the number of people relying on biomass for cooking in rural areas. The Chinese gov-ernment provided 180 million improved cooking stoves to households across the country that use biomass,
however, their status is unknown. Without better data, it is not possible to set targets and develop policies. The second priority is to create a market for efficient, reliable and affordable cooking stoves and ensure their acceptability.
In order to draw up appropriate policies for traditional biomass use, the priority is to acquire better data on the sector and measure current demand
For the transport sector, the policy focus is on improving efficiency through fuel economy standards, labelling, improving the quality of fuels, as well as subsidies and taxation of vehicle and fuels. There are subsidies which are specific to electric vehicles, the amounts depending on the vehicle type and battery capacity. Regarding biofuels, targets exist for 2020, and the government encourages the use of marginal land and non-food feedstock for their production. However, mandates and market support for ethanol only covers nine provinces so far and the government does not support and/or incentivise specific biodiesel mechanisms.

Renewable Energy Prospects: China78
9 SUGGESTIONS FOR ACCELERATED RENEWABLE ENERGY UPTAKE
The development and use of renewable energy is a high priority for China in order to address growing environ-mental challenges and the need to enhance the security of energy supply. Reaching higher shares of renewable energy use also has an important role to play in meet-ing China’s policy objectives in respect to job creation, new economic activity and a better trade balance. In the beginning of the 2000s, China decided to boost the de-velopment of renewable energy through energy policies as well as industry policy measures. As a result, China is today a global leader in renewable energy.
This study showed that there is a potential to increase this growth further which can lead to 26% renewable energy share in China’s total energy mix. At the same time, there remains a number of challenge and barriers which must be overcome to realise this potential. Based on the discussion in this study, the following high level policy recommendations have been identified to help accelerate the deployment of modern renewables in China from 2010 to 2030 and to account for some of the requirements during the transition period:
Renewable energy policy:
● Develop a comprehensive national energy plan that accounts for the needed infrastructure for transmission and distribution of electricity, heat and gas
● Introduce taxation, caps, and/or CO2 trading sys-tems to account for the damage of CO2 emission and other air pollution from coal combustion
● Assess the socio-economic, energy security, health, land and water use impact of various technologies
● Set targets for renewables in manufacturing, buildings and transport
Power market design:
● Establish national power market, creating incen-tives for flexible operation, and bringing in new investors
● Develop the grid to better integrate renewable energy, enhance trade and deal with variability
Technology focused policies:
● Enhance government support for innovation, research and development to reduce renewable energy costs
● Support development of next-generation renew-able energy technologies
● Improve knowledge and data collection on bio-mass and develop a working biomass feedstock market
In addition to these high-level policy recommendations, the rest of this section provides more detailed recom-mendations grouped under five areas of policy action. These recommendations emerge from the outcomes of the China REmap 2030 analysis. The policy action areas are defined based on IRENA’s country analysis in consultation with the national experts.
Planning transition pathways:
— Diversify technology deployment to include op-tions which are being deployed slowly today, including offshore wind, CSP, large biogas and waste to energy
— Target cost reductions and power system market re-design for the short term, and integration of large shares of renewables into the system for the long term
— Ensure grid development as part of the develop-ment strategy for renewables
— Cooperate with neighbouring countries in grid integration to allow renewable electricity trade

Renewable Energy Prospects: China 79
(e.g., wind and solar with Mongolia, hydro with Siberia and South East Asia)
— Continue to focus on renewable energy use for end-use sectors, and expand target setting
Creating an enabling business environment:
— Allow prices to reflect the marginal cost realisti-cally (i.e., spot markets, day/hour ahead markets)
— Continue using subsidy schemes until technolo-gies reach a mature level, in a way that supports cost reduction and efficient use of renewable energy
— Revise renewable power subsidies to enhance ef-fectiveness by rewarding both construction and operation, reach power generators in a timely manner, and avoid delays in reimbursements
Ensuring smooth integration of renewables into the system:
— Ensure economic incentives for flexible operation of thermal power plants and grids
— Develop solutions for pumped hydro business as part of the power sector market reform
— Strengthen decentralised solutions, notably for rooftop solar PV, including leasing models and policies such as net metering and smart grids
— Improve planning and organisation to stabilise biomass feedstock supply and improve feedstock logistics
— Improve planning for effective utilisation of straw residues as an energy source
Creating and managing knowledge:
— Support the building of qualified human and institutional capacity for deployment of renewa-bles and related infrastructure
— Improve data collection as well as the quality of biomass statistics (modern, traditional)
— Increase the availability of provincial level data and improve access to data through the internet for load and production of electricity and heat
Unleashing innovation:
— Assess best practice technology and policies abroad and evaluate their applicability to China conditions
— Consider biomass co-firing and waste use in coal-fired power plants and co-combustion in cement kilns
— Refurbish small-hydroelectricity dams with a view to increase efficiency of power generation
— Explore options for advanced biofuels from lig-nocellulosic feedstock, and develop innovative solutions for energy-intensive industries that ac-count for large industrial energy use share
— Develop solar heat for industrial process heat generation and solar absorption cooling for com-mercial buildings
— Strengthen electric vehicle and modal-shift pro-grammes in tandem with an increasingly large share of renewables in power generation
— Strengthen renewable energy use in newly con-structed buildings in cities

Renewable Energy Prospects: China80
3TIER (2009), “Inc. Global Wind Dataset: Annual Mean Validation”, October 2009, Presented via IRENA’s Global Atlas platform.
AEA Technology Environment (2005), Damages per Tonne Emissions of PM2.5, NH3, SO2, NOx and VOCs from Each EU25 Member State (Excluding Cyprus) and Surrounding Seas, AEA Technology Environment, Didcot, www.doc88.com/p-476118345143.html.
AEC (Advanced Ethanol Council) (2013), Cellulosic Biofuels, Industry Progress Report 2012-2013, AEC, http://ethanolrfa.3cdn.net/d9d44cd750f32071c6_h2m6vaik3.pdf.
AEE-Intec (Institute for Sustainable Technologies) (2007-2014), “Solar Heat Worldwide 2007-2014”, Annual Reports, AEE-Intec, Gleisdorf, www.aee-intec.at/index.php?seitenId=40&lang=en.
Al-Jazeerah (20104), “Chinese, Russian Presidents vow to enhance energy cooperation, sign agreement about gas supplies, ahead of APEC summit“, 9 November 2014, Al-Jazeerah, http://www.aljazeerah.info/News/2014/November/9%20n/Chinese,%20Russian%20presidents%20Vow%20to%20Enhance%20Energy%20Cooperation,%20Sign%20Agreement%20About%20Gas%20Supplies,%20Ahead%20of%20APEC%20Summit,%20November%209,%202014.htm
Baron, R. et al. (2012), Policy Options for Low-Carbon Power Generation in China: Designing an emissions trading system for China’s electricity sector, OECD/IEA, Paris, http://www.iea.org/publications/insights/Insight_PolicyOptions_LowCarbon_China.pdf.
Batidzirai, B., Smeets, E.W.M. and Faaij, A.P.C. (2012), “Harmonising bioenergy resource potentials—Methodological lessons from review of state of the art bioenergy potential assessments”, Renewable and Sustainable Energy Reviews, Vol. 16, October 2012, pp. 6589-6630.
Bertani, R. (2010), “Geothermal power update in the world: 2005-2010 Update Report”, Proceedings World Geothermal Congress 2010, 25-29 April 2010, Bali, http://geotermia.org.mx/geotermia/pdf/WorldUpdate2010-Ruggero.pdf.
Bioenergy Crops (2013a), Most relevant limiting factors for huge expected bioenergy growth in China for the
next years, 2 February 2013, http://bioenergycrops.com/blog/2013/02/02/some-limiting-factors-for-bioenergy-growth-in-china/.
Bioenergy Crops (2013b), Asian biomass co-firing grows: China, Japan and South Korea are the main consumers, 13 May 2013, http://bioenergycrops.com/blog/2013/05/13/asian-biomass-co-firing-grows-china-japan-and-south-korea-are-the-main-consumers/.
Biomass Magazine (2013), Beta renewable technology to make ethanol, bioglycols in China, 18 November 2013, http://biomassmagazine.com/articles/9683/beta-renewables-technology-to-make-ethanol-bioglycols-in-china.
BNEF (Bloomberg New Energy Finance) (2013), The future of China’s power sector: From centralised and coal powered to distributed and renewable?, Executive Summary, 27 August 2013, http://news.nost.org.cn/wp-content/uploads/2013/10/BNEF_the_future_of_chinas_power_sector.pdf.
BNEF (2014), China Requires 30% of State Cars Use Alternative Energy, Bloomberg News, 14 July 2014, http://www.bloomberg.com/news/2014-07-13/china-targets-30-new-government-vehicles-use-alternative-energy.html
BREE (Bureau of Resources and Energy Economics) (2014), Asia-Pacific Renewable Energy Assessment, July 2014, BREE and Clean Energy Solutions Center.
Brendstrup, A. (2012), Lessons learned from high efficiency biomass power plants in China, Clean Tech, http://www.npti.in/Download/Renewable/POWERGEN%20PRSTN_Renewable%20April2012/High%20Eff ic iency%20Biomass%20Power%20Plants%20in%20China.pdf.
Campbell, R. J. (2014), China and the United States – A comparison of Green Energy Programmes and Policies, April 30 2014, Congressional Research Service, http://fas.org/sgp/crs/row/R41748.pdf.
Carbontrust (2014), Detailed appraisal of the offshore wind industry in China, July 2014, Carbontrust, http://www.carbontrust.com/media/510530/detailed-appraisal-of-the-offshore-wind-industry-in-china.pdf.
Chen, C-Y., Yao C-S., and Li, M. (2010), Analysis of rural residential energy consumption and its carbon
REFERENCES

Renewable Energy Prospects: China 81
emissions in China, 2001-2010, Energy Policy, Vol. 41, February 2012, pp. 445-450.
Chen, L. (2011), “Insight: State-of-the-art biomass gasification in China”, 5th International Conference on Application of Biomass Gasification, 11 February 2011. http://gasifiers.bioenergylists.org/sites/all/files/IKAB-LiChen-GasificationstatusinChina.pdf
Chen, L., Zhao, L. and Wang, F. (2012), The progress and prospects of rural biogas production in China, Energy Policy, Vol. 51, December 2012, pp. 58–63.
Cho, R. (2011), “How China is dealing with its water crisis”, State of the planet – Blogs from the Earth Inistitute, 5 May 2011, http://blogs.ei.columbia.edu/2011/05/05/how-china-is-dealing-with-its-water-crisis/.
CHPDI (Chinese Hydropower Planning and Design Institute) (2014), “Status and Outlook of China Renewable Energy Development and Application”, presentation delivered by Mr. Wang Minhao (Executive Vice President), World Future Energy Summit 2014, Abu Dhabi.
CNREC (China National Renewable Energy Centre) (2012), Key information at a glance. China 12th Five-Year Plan for Renewable Energy Development (2011-2015), September 2012, China National Energy Administration, CNREC, Beijing.
CNREC (2013a), 2012 China Renewable Energy Outline, December 2013, CNREC, Beijing, China.
CNREC (2013b), Personal communication with Mr. Wang Wei, February 2013, CNREC, Beijing, China.
CNREC (2014), “CNREC 2013 - Activities within the China National Renewable Energy Centre”, March 2014, CNREC, Beijing, China.
Cozzi, P. (2012), “Assessing reverse auctions as a policy tool for Renewable Energy Development”, Energy, Climate, and Innovation Program (ECI), Number 7, Center for International Environment and Resource Policy, Tufts University, http://fletcher.tufts.edu/CIERP/Publications/more/~/media/Fletcher/Microsites/CIERP/Publications/2012/May12CozziReverseAuctions.pdf
CPI (Climate Policy Initiative) (2013), Buildings Energy Efficiency in China, Germany and the United States, April 2013, CPI, San Francisco, CA., http://cl imatepolicyinit iat ive.org/wp-content/uploads/2013/04/Buildings-Energy-Efficiency-in-China-Germany-and-the-United-States.pdf.
CREIA (China Renewable Energy Industry Association) (2014a), China Wind Power Review and Outlook 2014, Chinese Renewable Energy Industry Association, 2014.
CREIA (2014b), “Innovation of Distribution Generation with Solar PV Systems”, Presentations at China Solar PV Summit, 11-12 September, 2014, Beijing.
CWEA (2014), Statistics of Chinese Installed Wind Power Capacity 2013, Chinese Wind Energy Association, http://www.cwea.org.cn/upload/2013年中国风电装机容量统计.pdf
Daioglou, V., van Ruijven, B. and van Vuuren, D.P. (2012), “Model projections for household energy use in developing countries”, Energy, Vol. 37, January 2012, pp. 601-615.
Davidson, M. (2013a), “ Transforming China’s Grid: Sustaining the Renewable Energy Push” 24 September 2013. The Energy Collective, http://theenergycollective.com/michael-davidson/279091/transforming-china-s-grid-sustaining-renewable-energy-push.
Davidson, M. (2013b), “Politics of power in China: Institutional Bottlenecks to Reducing Wind Curtailment Through Improved Transmission”, Fourth Quarter 2013, pp. 40-42, International Association for Energy Economics, http://www.iaee.org/en/publications/newsletterdl.aspx?id=216.
Davidson, M. (2014), “Primetime Debate: Will an Ultra-High Voltage Transmission Supergrid Solve China’s Air Pollution Crisis?” 24 April 2014. The Energy Collective, http://theenergycollective.com/michael-davidson/371396/primetime-debate-will-ultra-high-voltage-transmission-supergrid-solve-china-.
DB (Deutsche Bank) (2012), Scaling wind and solar power in China: Building the grid to meet targets, February 2012, https://www.db.com/cr/en/docs/China_Wind_and_Solar-Feb2012.pdf
DEA (Danish Energy Agency) (n.d.), District heating – Danish and Chinese experience, Danish Energy Agency, http://www.ens.dk/sites/ens.dk/files/energistyrelsen/Nyheder/district_heating_danish-chinese_experiences.pdf.
Delman, J. and Chen, Y. (2008), Nordic Collaboration with China in Energy Research and Development, Nordic Institute of Asian Studies, Copenhagen.
E2 (Environmental Entrepreneurs) (2013), Advanced biofuel market report 2013: Capacity through 2016, Environmental Entrepreneurs,
Renewable Energy Prospects: China82
San Francisco, CA., http://www.e2.org/ext/doc/E2AdvancedBiofuelMarketReport2013.pdf.
Economist (2012), “Chinese carmakers still in second gear”, 5 May 2012, pp. 61-62, The Economist.
Eggleston H.S. et al. (2006), “2006 IPCC Guidelines for National Greenhouse Gas Inventories”, National Greenhouse Gas Inventories Programmes, IPCC (Intergovernmental Panel on Climate Change), IGES, Kanagawa, www.ipcc-nggip.iges.or.jp/public/2006gl/index.html.
EnergyTrend (2014), “China issues new policy to boost distributed PV market”, 12 September 2014, http://pv.energytrend.com/price/20140912-7407.html.
ESTELA (European Solar Thermal Electricity Association) (2011), Solar Thermal Electricity in China in 2011 and Future Outlook, Cayetano Hernández Lluna, European Solar Thermal Electricity Association (ESTELA), Renewable Energy House, Brussels.
ESTELA (2012), Solar thermal electricity in China in 2011 and future outlook, July 2012, ESTELA, Brussels, http://www.estelasolar.eu/fileadmin/ESTELAdocs/documents/Publications/STE_in_China_By_C.Hernandez_ESTELA_July2012_WEB.pdf.
EurObserv’ER (2014), Solar thermal and concentrated solar power barometer, May 2014, EurObserv’ER, http://www.energies-renouvelables.org/observ-er/stat_baro/observ/baro221_en.pdf.
Euroheat & Power (2013), “District heating and cooling: Country by Country 2013 Survey”, 21 May 2013, Euroheat & Power, Brussels.
FAOSTAT (2014), “ForesSTAT”, Food and Agriculture Organization of the United Nations, Rome.
Feng, L., (2014), Update on China´s Carbon Market, 25 May 2014, Department of Climate Change, NDRC, Cologne. https://www.thepmr.org/system/fi les/documents/CHINA%20Update%20on%20China%E2%80%99s%20ETS%20Pilots%2020140521.pdf.
Forbes, S.M. (2013), The United States and China: Moving toward Responsible Shale Gas Development, September 2013, World Resources Institute, http://www.brookings.edu/~/media/events/2014/2/06%20china%20clean%20energy/uschina%20moving%20toward%20responsible%20shale%20gas%20development_sforbes.
GEA (Geothermal Energy Association) (2012), “Geothermal: International Market Overview Report”, May 2012, GEA, Washington, DC., http://geo-energy.org/pdf/reports/2012-GEA_International_Overview.pdf.
GCC (Green Car Congress) (2012), “BYD bringing electric buses to Uruguay; targeting more than 500 by 2015”, 19 July 2012, Green Car Congress, http://www.greencarcongress.com/2012/07/byd-20120719.html.
Guan, D. et al. (2014), “The gigatonne gap in China’s carbon dioxide inventories”, Natura Climate Change, Vol. 2, pp. 672-675.
Guardian (2014), “China’s toxic air pollution resembles nuclear winter, say scientists”, 25 February 2014, The Guardian, http://www.theguardian.com/world/2014/feb/25/china-toxic-air-pollution-nuclear-winter-scientists.
GWEC (Global Wind Energy Council) (2014a), Global offshore current status future prospects, http://www.gwec.net/global-offshore-current-status-future-prospects/, Last accessed on: 20 June 2014.
GWEC (2014b), “Global Wind Statistics 2013”, Global Wind Statistics, annual, Global Wind Energy Council, http://www.gwec.net/wp-content/uploads/2014/02/GWEC-PRstats-2013_EN.pdf.
Hallding, K. et al. (2012), Learning from previous failures: scaling up biogas production in the Chinese countryside, Climate and Development, Vol. 4, Issue 3, 199-209.
Hammons, T.J. (2011), Developments in power generation and transmission infrastructures in China, Electricity Infrastructures in the Global Marketplace, Ed: T.J. Hammons, http://cdn.intechopen.com/pdfs-wm/16034.pdf.
Haugwitz, F. (2014), “China’s domestic solar PV market dynamics during the 12th Five-Year-Plan (2011-2015) Period”, 7th Meeting of the Asia Solar Energy Forum 2014, 16 October 2014, Seoul.
He, G., and Kammen, D.M. (2014), “Where, when and how much wind is available? A provincial-scale wind resource assessment for China”, Energy Policy, Vol. 74, November 2014, pp. 116-122.
Ho, M.S. and Nielsen, C.P. (2007), Clearing the Air. The Health and Economic Damages of Air Pollution in China, MIT Press, http://chinaproject.harvard.edu/clearing-the-air.
Huffington Post (2014), “In effort to fight pollution, Beijing plans to ban all coal use by 2020”, 5 August 2014, http://www.huffingtonpost.com/2014/08/05/beijing-coal-ban_n_5650244.html.
IEA (International Energy Agency) (2009), CHP and DHC in China: An assessment of market and policy

Renewable Energy Prospects: China 83
potential, OECD/IEA, Paris. http://www.iea.org/media/files/chp/profiles/China.pdf.
IEA (2011a), “China Wind Energy Development Roadmap 2050. Technology Roadmap”. OECD/IEA, Paris.
IEA (2011b), Integration of Renewables: Status and challenges in China, Working Paper, OECD/IEA, Paris, http://www.iea.org/publications/freepublications/publication/Integration_of_Renewables.pdf.
IEA (2012a), “World Energy Outlook 2012”, World Energy Outlook, annual, OECD/IEA, Paris.
IEA (2012b), People’s Republic of China: Oil & Gas Security Emergency Response of IEA Countries, OECD/IEA, Paris, http://www.iea.org/publications/freepublications/publication/China_2012.pdf.
IEA (2013a), “World Energy Outlook 2013”, World Energy Outlook, annual, OECD/IEA, Paris.
IEA (2013b), Medium-Term Renewable Energy Market Report 2013: Market Trends and Projections to 2018, OECD/IEA, Paris, http://www.iea.org/textbase/npsum/mtrenew2013sum.pdf.
IEA (2013c), “World Energy Balances”, IEA Statistics, OECD/IEA, Paris, http://www.iea.org/statistics/topics/energybalances/.
IEA-ETSAP (IEA Energy Transition System Analysis Program) (2013), “Two- and three-wheeled electric vehicles and quadricycles”, IEA ETSAP Technology Brief T19, January 2013, IEA ETSAP, http://iea-etsap.org/web/HIGHLIGHTS%20PDF/T19_2-3W_GG_Jan2013_final_GSOK%201.pdf.
IEA-GIA (IEA Geothermal Implementing Agreement) (2013), “Annual Report 2011”, 4 October 2013, IEA-GIA, http://iea-gia.org/wp-content/uploads/2013/10/2011-GIA-Annual-Report-Final-4Oct13.pdf.
IEPD (Industrial Efficiency Policy Database) (2014), Carbon Emission Trading Pilots, CN-9, July 2014, http://iepd.iipnetwork.org/policy/carbon-emissions-trading-pilots.
IFPEN (IFP Energies Nouvelles) (2013), Overview of second-generation biofuel projects, Panorama 2014, December 2013, IFPEN, Rueil-Malmaison.
IIASA (International Institute for Applied Systems Analysis) (2014), “GAINS GLOBAL (Greenhouse Gas – Air Pollution Interac tions and Synergies)”, IIASA, Laxenburg, http://gains.iiasa.ac.at/gains/GOD/index.login?logout=1.
IISD (International Institute for Sustainable Development) (2014), “China’s domestic biogas sector
must adjust to changing conditions”, IISD, http://pubs.iied.org/17185IIED
IPCC (Intergovernmental Panel on Climate Change) (2007), “Sum mary for Policymakers”, in: B. Metz, et al. (eds.), Climate Change 2007: Mitigation, Fourth Assessment Report, IPCC, Cambridge University Press, Cambridge and New York, www.ipcc.ch/pdf/assessment-report/ar4/wg3/ar4-wg3-spm.pdf.
IRENA (International Renewable Energy Agency) (2013), Renewable Energy Auctions in Developing Countries, IRENA, Abu Dhabi.
IRENA (2014a), REmap 2030: A Renewable Energy Roadmap, IRENA, Abu Dhabi, http://www.irena.org/remap/REmap_Report_June_2014.pdf.
IRENA (2014b), Renewable Energy in Manufacturing: A technology roadmap to REmap 2030. IRENA, Abu Dhabi, http://www.irena.org/remap/REmap%202030%20Renewable-Energy-in-Manufacturing.pdf.
IRENA (2014c), Global bioenergy supply and demand projections: A working paper for REmap 2030, IRENA, Abu Dhabi, http://www.irena.org/remap/IRENA_REmap_2030_Biomass_paper_2014.pdf.
IRENA (2014d), Renewable Energy and Jobs 2013, IRENA, Abu Dhabi, http://www.irena.org/rejobs.pdf.
IRENA (2014e), “Economic Value Creation of Renewable Energy Deployment”, Presentation by Rabia Ferroukhi in Delhi, April 2013, IRENA, http://www.irena.org/menu/..%5CDocumentDownloads%5Cevents%5CDelhiEvent%5C2.1%20IRENA%20Econ%20Value%20Creation.pdf.
IRENA (forthcoming), Renewable off-grid systems: Status report 2014 and methodological issues, IRENA, Abu Dhabi.
Jiang, K. (2014), Recent global and China’s modelling for low carbon scenario, Energy Research Institute, Beijing.
Jingying, L. et al. (2001), “Biomass energy in China and its potential”, Energy for Sustainable Development, Vol. 5, Issue 4, pp. 66-80.
LBNL (Lawrence Berkeley National Laboratory) (2012), Key China Energy Statistics, June 2012, LBNL, Berkeley, CA., http://china.lbl.gov/sites/all/files/key-china-energy-statistics-2012-june-2012.pdf.
LBNL (2013), “China Energy Databook Version 8.0”, September 2013, LBNL, Berkeley, CA.
Lee, W.Y. (2014), “Financing CSP in People’s Republic of China”, Presentation at CSP Focus 2014, 24 March 2014, Beijing, China, Asia Development Bank.

Renewable Energy Prospects: China84
Lixin, Z. (2012), “Overview and outlook of agricultural bio-energy development in China”, Presentation at Energy Technology R &D Needs of Emerging Economies Workshop, Center for Energy and Environmental Protection, http://www.iea.org/media/workshops/2012/egrdbeijing/IEAZhaoLixin.pdf.
Lo, K. et al. (2014), “A critical review of China’s rapidly developing renewable energy and energy efficiency policies”, Renewable and Sustainable Energy Reviews, Vol. 29, pp. 508-516.
Lu, A. (2010), A Primer on the (Strong) Smart Grid and its Potential for Reducing GHG Emissions in China and the United States, NRDC Working Paper, Natural Resources Defense Council, October 2010.
Ma, L. et al. (2012), The future demand of transportation in China: 2030 scenario based on a hybrid model, Procedia – Social and Behavioural Sciences, Vol. 54, pp. 428-437.
Mainali, B., Pachauri, S., and Nagai, Y. (2012), “Analysing cooking fuel and stove choices in China till 2030”, Journal of Renewable and Sustainable Energy, Vol. 4, pp. 031805-1-15.
Marshall, F., Ashmore, M., and Hinchcliffe, F. (1997), “A hidden threat to food production: air pollution and agriculture in the developing world”, Gatekeeper Series No. 73, International Institute for Environment and Development, London, http://pubs.iied.org/pdfs/6132IIED.pdf.
Matus, K. et al. (2012), “Health damages from air pollution in China”, Global Environmental Change, Vol. 22, pp. 55-66.
Mischke, P. and Karlsson, K.B. (2014), “Modelling tools to evaluate China’s future energy system – A review of the Chinese perspective”, Energy, Vol. 69, pp. 132-143.
NDRC (National Development & Reform Commission) (2006), Trial Measures for Pricing and Cost Sharing Management for Renewable Energy Power, National Development & Reform Commission.
NPC (National People’s Congress) (2010), Renewable Energy Law of the People’s Republic of China, Ministry of Commerce, December 20, 2013, http://engl ish .mofcom.gov.cn/art ic le/pol icyrelease/questions/201312/20131200432160.shtml
NREL (U.S. National Renewable Energy Laboratory) (2006), “Layer Multiple Countries 40km: Selected Asian Countries – Annual Global Horizontal Solar Radiation”,
Presented via IRENA’s Global Atlas platform, http://en.openei.org/w/index.php?title=File:NREL-asia-glo.pdf
NY (New York Times) (2014), “Only Nine Chinese Cities Pass Clean Air Test”, 7 August 2014, http://mobile.nytimes.com/blogs/sinosphere/2014/08/07/only-9-chinese-cities-pass-clean-air-test/?smid=tw-share.
OECD (Organisation for Economic Co-operation and Development) (2014), The cost of air pollution: Health impacts of road transport, OECD, Paris.
Pachauri, S. et al. (2012), Access to modern energy: Assessment and Outlook for Developing and Emerging Regions, IIASA, Laxenburg.
PE (Power Engineering) (2013), “Dry cooling system headed to coal-fired power plants in China”, 11 April 2013, http://www.power-eng.com/articles/2013/04/dry-cooling-system-headed-to-coal-fired-power-plants-in-china.html.
Perera, P. (2014), Pump storage hydropower a solution to challenges of wind power integration: Regulatory policies and incentive structures in Chinese context, 20 June 2014, Asia Development Bank.
Platts (2013), “World Electric Power Plants Database, December 2013”, McGraw Hill Financial, New York, June 2013, www.platts.com/products/world-electric-power-plants-database.
PNNL (Pacific Northwest National Laboratory) (2012), China’s building energy use: A long-term perspective based on a detailed assessment, January 2012, PNNL, Richland, WA., http://www.pnnl.gov/main/publications/external/technical_reports/PNNL-21073.pdf.
PV Magazine (2014), China erweitert Liste förderfähiger Photovoltaik-Unternehmen, 18 July 2014, PV Magazine, http://www.pv-magazine.de/index.php?id=9&tx_ttnews%5Btt_news%5D=16026&noMobile=1&cHash=1923ee54fd2893ae595401eb736cc1df.
Qiu, H. et al. (2012), “Liquid biofuels in China: Current status, government policies, and future opportunities and challenges”, Renewable and Sustainable Energy Reviews, Vol. 16, pp. 3095-3104.
RE New Economy (2014), “China plans $65 billion carbon market – at around $18/tonne”, 12 September 2014, RE New Economy, http://reneweconomy.com.au/2014/china-plans-65bn-carbon-market-at-around-18tonne-48911.
Reports (2013), “China Electric Vehicle Industry Report, 2013”, PRWEb, http://www.prweb.com/releases/

Renewable Energy Prospects: China 85
china-electric-vehicle/industry-ankai-leads-2013/prweb10712484.htm
Reuters (2014a), “China finds shale gas challenging, halves 2020 output target”, 7 August 2014, Reuters, http://www.reuters.com/article/2014/08/07/us-china-shale-target-idUSKBN0G70GS20140807.
Reuters (2014b), “China plan to cap CO2 emissions seen turning point in climate talks”, 3 June 2014, Reuters, http://www.reuters.com/article/2014/06/03/china-climatechange-idUSL3N0OK1VH20140603.
RTCC (Responding to Climate Change) (2014), “China completes rollout of pilot carbon markets”, 20 June 2014, RTCC, http://www.rtcc.org/2014/06/19/china-completes-rollout-of-pilot-carbon-markets/.
Ruicheng, Z., Tao, H. and Xuan, W. (2014), The Roadmap research of China solar thermal development, Energy Procedia 48, pp. 1642-1649.
SA (Scientific American) (2013), “Water demands of coal-fired power drying up northern China”, 25 March 2013, http://www.scientificamerican.com/article/water-demands-of-coal-fired-power-drying-up-northern-china/
SCMP (2013), “Beijing and other key cities plan for 10-fold expansion of metro railways”, August 26, South China Morning Post, http://www.scmp.com/business/economy/article/1148177/beijing-and-other-key-cities-plan-10-fold-expansion-metro-railways
SGCC (State Grid Corporation of China) (2012), Developing the Smart Grid for Efficient Utilisation of Renewable Energy in the PRC, September 2012, China Electric Power Research Centre, SGCC.
SGCC (2013), “Overview of SGCC and the Integration of Large Wind Power”, September 2013, SGCC.
SGCC (2014), “Developments, challenges, opportunities & prospects of Smart Grid in China”, 15 May 2014, SGCC, http://www.africasmartgridforum2014.org/en/expert/presentationliminaire/chen-yueming-developments-challenges-opportunites-and-prospects-en.pdf.
Sinton, J.E. (2001), Accuracy and reliability of China’s Energy Statistics, LBNL-48919, September 2001.
SolarServer (2014), “Official figures published: China installed 12.92 GW of solar PV capacity in 2013; Shift to distributed generation in 2014”, SolarServer – Global Solar Industry Website, http://www.solarserver.com/solar-magazine/solar-report/solar-report/official-figures-published-china-installed-1292-gw-of-solar-
pv-capacity-in-2013-shift-to-distributed-generation-in-2014.html.
Spiegel (2014), “Kampf gegen Smog: China verzichtet bei Elektroautos auf die Mehrwertsteuer“, 9 July 2014, http://www.spiegel.de/auto/aktuell/china-regierung-in-peking-setzt-mehrwertsteuer-fuer-e-autos-aus-a-980123.html.
The World Bank (2013), SE4All Global Tracking Framework, May 2013, The World Bank, Washington, DC, www.worldbank.org/en/topic/energy/publication/Global-Tracking-Framework-Report.
The World Bank (2014), Performance of Renewable Energy Auctions: Experience in Brazil, China and India, Policy Research Working Paper, The World Bank Group, Energy and Extractives Global Practice Group, Washington, DC.
Tu, K.J. and S. Johnson-Reiser (2012), Understanding China’s Rising Coal Imports, 16 February 2012, Carnegie Endowment for International Peace, Washington, DC., http://carnegieendowment.org/files/china_coal.pdf.
USDA (US Department of Agriculture) (2012), “China – People’s Republic of Biofuels”, Annual Gain Report Number 12044, 9 July 2012, USDA Foreign Agricultural Service, Global Agricultural Information Network, Washington, DC., http://gain.fas.usda.gov/Recent%20GAIN%20Publications/Biofuels%20Annual_Beijing_China%20-%20Peoples%20Republic%20of_7-9-2012.pdf.
USDA (2013), China – “People’s Republic of Biofuels”, Annual Gain Report Number 12044, 9 September 2013, USDA Foreign Agricultural Service, Global Agricultural Information Network, Washington, DC.,http://gain.fas.usda.gov/Recent%20GAIN%20Publications/B i o f u e l s % 2 0 An n u a l _ B e i j i n g _ C h i n a % 2 0 - % 2 0Peoples%20Republic%20of_9-9-2013.pdf.
Vakkilainin, E., Kuparinen, J., Heinimoe, J. (2013), Large Industrial Users of Energy Biomass, Lappeenranta University of Technology, Lappeenranta, www.bioenergytrade.org/downloads/t40-large-industrial-biomass-users.pdf.
Van Sambeek, E. et al. (2013), Bio-energy Co-operation between China and the Netherlands. 26 April 2013, Azure International, Beijing, http://www.rvo.nl/sites/default/files/2014/03/Bioenergy%20China%20Netherlands%20Final%20Azure%20NL%20Agency%2026042013.pdf.
Wang, L. et al. (2013), “Will a driving restriction policy reduce car trips? A case study of Beijing, China”, Environment for Development Discussion Paper Series,

Renewable Energy Prospects: China86
September 2013. http://www.rff.org/RFF/Documents/EfD-DP-13-11.pdf.
Wang, X., Barroso, L. and Elizondo, G. (2014), “Promoting Renewable Energy through Auctions: The Case of China”, Live Wire 2014/14, The World Bank, http://www-wds.worldbank.org/external/default/WDSContentServer/WDSP/IB/2014/06/13/000456286_20140613154552/Rendered/PDF/886970REPLACEM00Box385194B00PUBLIC0.pdf
WBCSD (World Business Council for Sustainable Development) (2009), “Global Cement Technology Roadmap”, Developing technologies for a lower carbon cement industry, WBCSD Cement Sustainability Initiative, Geneva, http://www.wbcsdcement.org/index.php/key-issues/climate-protection/technology-roadmap.
Worldview (2012), “Geothermal potential of China. Worldview Report”, June 2012, New Zealand Geothermal Association, Wellington. http://www.nzgeothermal.org.nz/Publications/Industry_papers/Worldview-Report-Geothermal-Potential-of-China.pdf.
Worldwatch (2014), Smart Grid Investment Grows with Widespread Smart Meter Installations, May 22 2014, WorldWatch Institute, http://vitalsigns.worldwatch.org/sites/default/files/vital_signs_smart_grid_final_pdf.pdf.
WP (2013), “Analysis – China unable to achieve 5 GW offshore wind goal by 2015”, 21 June 2013, WindPower Monthly, http://www.windpowermonthly.com/article/1187293/analysis---china-unable-achieve-5gw-offshore-wind-goal-2015.
WRI (World Resources Institute) (2013a), “China’s electric vehicle development failing to meet ambitious targets”, WRI, Washington, DC., http://blogs.worldwatch.org/revolt/chinas-electric-vehicle-development-failing-to-meet-ambitious-targets/#more-6254.
WRI (2013b), “Majority of China’s Proposed Coal-Fired Power Plants Located in Water-Stressed Regions”, 26 August 2013, WRI, Washington, DC., http://www.wri.org/blog/2013/08/majority-china%E2%80%99s-proposed-coal-fired-power-plants-located-water-stressed-regions.
WRI (2014), “What are China’s national climate and energy targets?” 22 May 2014, WRI, Washington, DC, http://www.chinafaqs.org/files/chinainfo/ChinaFAQs_table_China_climate_energy_targets_0.pdf.
WWF (World Wide Fund for Nature) (2014), China’s Future Generation: Assessing the Maximum Potential for
Renewable Power Sources in China to 2050, February 2014, WWF.
Xia, J. (2013), CHP/DHC role in Chinese energy future, 28 November 2013, Building Energy Research Centre, Tsinghua University, http://www.cleanenergyministerial.org/Portals/2/pdfs/CHP%20Workshop/Xia%20Jianjun_CHP-DHC%20role%20in%20Chinese%20energy%20future.pdf.
Yang, Y. (2013), China 2050 Pathway, Energy Research Institute, https://workspace.imperial.ac.uk/climatechange/Public/pdfs/Events/20.03.12%20China%202050%20ERI%20lecture/China%202050%20-%20Yang%20Yufeng.pdf
Yishui, T. and Liying, S. (2011), “Resource, Policy and Status and Prospect on Agricultural Bio-energy in China”, Presentation at 2nd Regional Bioenergy Policy Dialogue, 3 June 2011, Chinese Academy of Agricultural Engineering, http://www.fao.org/fileadmin/templates/rap/files/meetings/2011/110603_china.pdf
Zhang, Q., Watanabe, M. and Lin, T. (2010), Rural Biomass Energy 2020: People’s Republic of China, Asian Development Bank, Mandaluyong City, http://mpra.ub.uni-muenchen.de/24987/1/MPRA_paper_24987.pdf
Zhang, S. et al. (2013), “Interactions between renewable energy policy and renewable energy industrial policy: A critical analysis of China’s policy approach to renewable energies”, August 2013, Energy Policy 2013, Vol. 62, pp. 342–353.
Zhang, D. et al. (2014), “An integrated assessment of China’s wind energy potential”, Report No. 261, April 2014, MIT Joint Programme on the Science and Policy of Global Change, Cambridge, MA., http://globalchange.mit.edu/CECP/files/document/MITJPSPGC_Rpt261.pdf.
Zhang, X. (2014), “Introduction of utilization of straw energy in china”, Beijing Shengcheng Bioenergy S&T Co. Ltd., Beijing, http://veranstaltungen.fnr.de/fileadmin/allgemein/pdf/veranstaltungen/Strohenergie2012/10_Zhang-freigegeben.pdf.
Zhou, N. et al. (2007), Energy use in China: Sectoral trends and Future Outlook, January 2007, LBNL, Berkeley, CA., http://china.lbl.gov/sites/all/files/lbl-61904-sectoral-energy-trendjan-2007.pdf.
Zhou, N., McNeil, M.A., Levine, M. (2009), Energy for 500 million homes: drivers and outlook for residential energy consumption in China, ECEE, http://www.eceee.org/library/conference_proceedings/eceee_Summer_Studies/2009/Panel_4/4.359/paper.

Renewable Energy Prospects: China 87
AC alternating current
BEV battery-electric vehicle
BIPV building integrated photovoltaics
CBEEX China Beijing Environment Exchange
CC combined cycle
CCS carbon capture and storage
CCER China Certified Emissions Reductions
CDB China Development Bank
CDC China Datang Co.
CDM clean development mechanism
CEC China Electricity Council
CGC China Guodian Co.
CHDC China Huadian Co.
CHNG China Huaneng Group
CHP combined heat and power
CNREC China National Renewable Energy Centre
CNPC China National Petroleum Corporation
CNOOC China National Offshore Oil Corporation
CO2 carbon dioxide
CPIC China Power Investment Co.
CSG Southern Power Grid Corporation
CSGC China State Grid Corporation
CSP concentrated solar power
DC direct current
EJ exajoule
ETS emissions trading system
EU European Union
FiT feed-in tariff
FYP five-year plan
Gcal gigacalories
GDP gross domestic product
GHG greenhouse gas
GJ gigajoule
Gt gigatonne
GW gigawatt
GWe gigawatt-electric
GWth gigawatt-thermal
HHV higher heating value
IBT increasing block tariff
IEA International Energy Agency
IPCC Intergovernmental Panel on Climate Change
IPP independent power producer
IRENA International Renewable Energy Agency
km kilometre
kt kilotonne
kV kilovolt
kW kilowatt
kWh kilowatt-hour
kWe kilowatt-electric
LCOE levelised cost of electricity
LHV lower heating value
LNG liquefied natural gas
LIST OF ABBREVIATIONS

Renewable Energy Prospects: China88
LPG liquid petroleum gas
MMS mandatory market share
MOF Ministry of Finance
Mt megatonne
Mtce million tonnes of coal equivalent
MW megawatt
MWh megawatt-hour
MWe megawatt-electric
MWth megawatt-thermal
NDRC National Development & Reform Commission
NEA National Energy Administration
NOx mono-nitrogen oxide
O&M operation and maintenance
OECD Organization for Economic Co-operation and Development
PJ petajoule
PM particulate matter
PV photovoltaic
R&D research and development
RD&D research, development and deployment
RMB renminbi
SASAC Supervision and Administration Commission
SE4All Sustainable Energy for All
SEEE Shanghai Environment and Energy Exchange
SERC State Electricity Regulatory Commission
SGCC State Grid Corporation of China
SO2 sulphur dioxide
tcf trillion cubic feet
TCX Tianjin Climate Exchange
TFC total final consumption
TFEC total final energy consumption
tce tonnes of coal equivalent
TPED total primary energy demand
TWh terawatt-hour
UHV ultra high voltage
UN United Nations
USA United States of America
USD US dollars
WEO World Energy Outlook
WHO World Health Organisation

Renewable Energy Prospects: China 89
Capital costs
O&M Costs
Conversion efficiency
Capacity factor
(USD/kW) (USD/kW/year) (%) (%)
PowerRenewables:
Wind onshore 1 300 52 100 22
Wind onshore (remote) 1 500 80 100 30
Wind offshore 3 000 150 100 32
Solar PV (rooftop) 1 400 14 100 15
Solar PV (utility) 1 000 10 100 16.5
Solar CSP (no storage) 2 700 27 100 16.5
Landfill gas 2 250 57 100 80
Wind onshore (remote) 2 000 80 100 25
Wind offshore (remote) 4 050 200 100 32
Conventional:
Coal 1 300 52 30 57
Buildings
Renewables:
Air-to-air heat pumps 500 13 350 50
Solar water heating 220 6 100 14
Biogas boiler 1 000 25 80 50
Pellet burners 300 8 85 30
Cooking (solid biomass) 15 1 30 10
Conventional:
Coal boiler 175 6 90 85
Oil boiler 175 6 85 85
Traditional biomass cooking 30 0 10 10
Industry
Renewables:
Solar thermal 400 6 100 10
Geothermal 1 400 35 100 55
Air-to-air heat pumps 400 10 350 50
Biomass CHP 1 000 24 80 50
Conventional:
Coal boiler 400 10 90 85
ANNEX A:
Technology cost and performance data assumptions

Renewable Energy Prospects: China90
Capital costs O&M Costs Conversion efficiency
Activity per year
(USD / vehicle)
(USD / vehicle / year)
(MJ/p or tkm)
(p or tkm / year / vehicle)
Transport
Renewables:
Liquid biofuel passenger car 28000 2800 1.64 15000
Biodiesel truck 120000 12000 1.15 110000
Plug-in hybrid (passenger road vehicles) 30000 3000 0.98 15000
Battery electric (passenger road vehicles) 32000 2880 0.69 15000
Battery electric two-wheeler (passenger road) 4000 10000 0.07 5000
Conventional fuels:
Petroleum passenger car 28000 2800 1.6 15000
Petroleum truck 120000 12000 1.16 110000
Petroleum two-wheeler 3750 375 0.6 5000

Renewable Energy Prospects: China 91
ANNEX B:
Energy price assumptions
National energy prices in 2030 (USD/GJ)
Crude oil 21.9
Steam coal 1.5
Electricity Household (USD/kWh) 0.055
Electricity Industry (USD/kWh) 0.039
Natural gas Household 18.2
Natural gas Industry 16.8
Petroleum products 29.0
Diesel 43.5
Gasoline 50.9
Biodiesel 43.9
Conventional ethanol 53.9
Advanced ethanol 46.8
Primary biomass 1 – fuelwood 11.9
Primary biomass 2 – biogas 2.8
Biomass residues 1 – ag. residues 3.9
Biomass residues 2 – forest residues 12.2
Traditional biomass 3.5
Municipal waste 1.2

Renewable Energy Prospects: China92
Two examples are provided to explain how the substitu-tion costs are estimated:
● Biomass boiler substituting LPG-based boiler: The difference between the annualised capital, operation and maintenance and energy costs of the two boiler systems to deliver the same amount of heat are estimated, thereby taking into account the conversion efficiency, size of capacity, lifetime, capacity factors, etc. This is divided by the total final biomass demand of the boiler required to deliver that heat.
● Wind power substituting existing coal-based power: The difference between the annualised capital, operation and maintenance and energy costs of the two power systems to deliver the same amount of electricity are estimated, there-by taking into account the conversion efficiency, size of capacity, lifetime, capacity factors, etc. In the case of existing coal-based power, there are no capital costs as the capacity is assumed to be depreciated already. This difference is divided by the total renewable electricity generated from the wind power capacity.
For the business case, energy prices were estimated based on a number of methods. For some multipliers, expected developments in energy prices for the period between 2010 and 2030 were used based on the IEA
projections and these were applied to national 2010 prices (IEA, 2012a). For the case of coal, import prices were used; for natural gas, Asian regional import prices were used; for oil products, IEA crude oil import price projections were used. For conventional liquid biofuel prices, growth in price was matched to expected devel-opment in petroleum prices; advanced biofuel estimates originated from IRENA’s own estimates. All biomass feedstock prices are based on IRENA bottom-up analy-sis (IRENA, 2014c). Electricity prices were assumed to increase 30% over 2010 levels, which is based on the average price increase of conventional energy carriers, but also taking into account the changes in the fuel mix of the power sector with renewables.
In the government case, for coal, China was assumed to largely remain a domestic producer, therefore the lower price option was used. Electricity prices are based on national prices as described in the business case, but with the effect of taxes removed. For natural gas China was assumed to be an importer of natural gas and the higher price was used. Natural gas and coal prices were based on import/export price estimates from the IEA (2012a). Petroleum prices are standardised for the world and indexed to expected developments in the price of crude oil based on IEA (2012a). Liquid biofuel prices are IRENA estimates with the effect of taxes or subsidies removed. Biomass fuel prices are regionalised to the Asia (non-OECD) region.
ANNEX C:
Details of REmap cost methodology

Renewable Energy Prospects: China 93
ANNEX D:
Reference Case
Sector Renewable energy deployment in Reference Case in 2030
Power sector (incl. CHP) (TWh/year)
Total electricity production 9312
Hydro 1600
Geothermal 9
Solar PV 197
CSP 18
Wind 648
Solid biomass 192
Liquid & gaseous biofuels 0
Solar thermal
District heat sector (incl. CHP) (PJ/year)
Total heat production 5884
Geothermal
Solid biomass 805
Liquid & gaseous biofuels
Solar thermal
Industry (PJ/year)
Total consumption 46027
Electricity consumption 18255
Solid biomass 875
Liquid & gaseous biofuels
Solar thermal
Transport (PJ/year)
Total consumption 18171
Electricity consumption 1256
Liquid & gaseous biofuels 600
Buildings (PJ/year)
Total consumption 20996
Electricity consumption 7052
Solid biomass 2516
Liquid & gaseous biofuels 1130
Solar thermal 2675
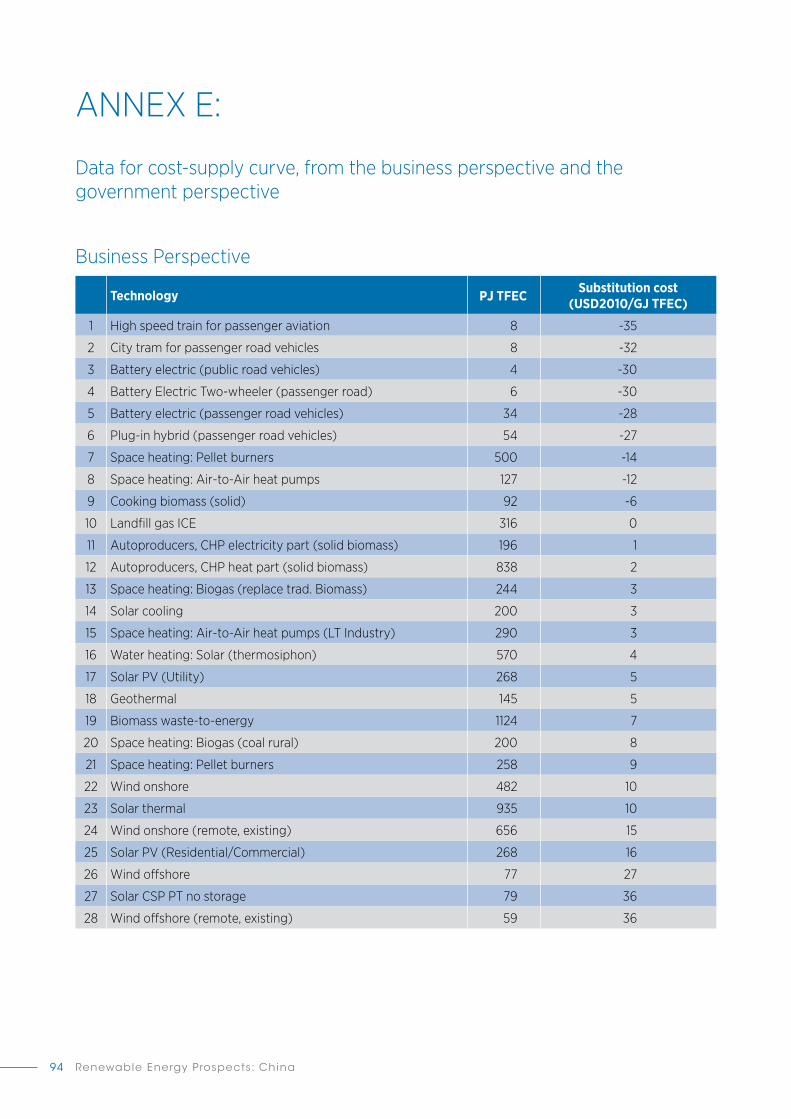
Renewable Energy Prospects: China94
ANNEX E:
Data for cost-supply curve, from the business perspective and the government perspective
Business Perspective
Technology PJ TFEC Substitution cost (USD2010/GJ TFEC)
1 High speed train for passenger aviation 8 -35
2 City tram for passenger road vehicles 8 -32
3 Battery electric (public road vehicles) 4 -30
4 Battery Electric Two-wheeler (passenger road) 6 -30
5 Battery electric (passenger road vehicles) 34 -28
6 Plug-in hybrid (passenger road vehicles) 54 -27
7 Space heating: Pellet burners 500 -14
8 Space heating: Air-to-Air heat pumps 127 -12
9 Cooking biomass (solid) 92 -6
10 Landfill gas ICE 316 0
11 Autoproducers, CHP electricity part (solid biomass) 196 1
12 Autoproducers, CHP heat part (solid biomass) 838 2
13 Space heating: Biogas (replace trad. Biomass) 244 3
14 Solar cooling 200 3
15 Space heating: Air-to-Air heat pumps (LT Industry) 290 3
16 Water heating: Solar (thermosiphon) 570 4
17 Solar PV (Utility) 268 5
18 Geothermal 145 5
19 Biomass waste-to-energy 1124 7
20 Space heating: Biogas (coal rural) 200 8
21 Space heating: Pellet burners 258 9
22 Wind onshore 482 10
23 Solar thermal 935 10
24 Wind onshore (remote, existing) 656 15
25 Solar PV (Residential/Commercial) 268 16
26 Wind offshore 77 27
27 Solar CSP PT no storage 79 36
28 Wind offshore (remote, existing) 59 36

Renewable Energy Prospects: China 95
Government Perspective
Technology PJ TFEC Substitution cost (USD2010/GJ TFEC)
1 High speed train for passenger aviation 8 -35
2 City tram for passenger road vehicles 8 -34
3 Battery Electric Two-wheeler (passenger road) 6 -31
4 Battery electric (public road vehicles) 4 -22
5 Space heating: Air-to-Air heat pumps 127 -16
6 Cooking biomass (solid) 92 -4
7 Plug-in hybrid (passenger road vehicles) 54 -3
8 Space heating: Pellet burners 500 -2
9 Landfill gas ICE 316 -2
10 Autoproducers, CHP electricity part (solid biomass) 196 -1
11 Autoproducers, CHP heat part (solid biomass) 838 1
12 Space heating: Air-to-Air heat pumps (LT Industry) 290 3
13 Space heating: Biogas (replace trad. Biomass) 244 4
14 Water heating: Solar (thermosiphon) 570 4
15 Solar cooling 200 5
16 Solar PV (Utility) 268 5
17 Geothermal 145 6
18 Biomass waste-to-energy 1124 7
19 Battery electric (passenger road vehicles) 34 8
20 Space heating: Biogas (coal rural) 200 8
21 Space heating: Pellet burners 258 10
22 Wind onshore 482 11
23 Solar thermal 935 12
24 Wind onshore (remote, existing) 656 16
25 Solar PV (Residential/Commercial) 268 18
26 Wind offshore 77 30
27 Wind offshore (remote, existing) 59 40
28 Solar CSP PT no storage 79 42

Renewable Energy Prospects: China96
USD/GJ USD/GJ
Industry
Autoproducers, CHP electricity part (solid biomass)
17
Autoproducers, CHP heat part (solid biomass)
17 Coal (steam boiler) 5
Solar thermal 14 Coal (steam boiler existing) 3
Geothermal 9
Heat Pumps (LT Industry) 8
Buildings
Water heating: Solar 6 Space heating: coal (boiler) 3
Space heating: petroleum products (boiler)
35
Space heating: Pellet burners 9 Heating/cooking traditional biomass 24
Space heating: biogas 14
Space heating: Air-to-Air heat pumps
9 Space heating: Natural gas (boiler) 21
Cooking biomass/gas 41
USD/p or t-km
USD/p or t-km
Transport
First generation bioethanol (passenger road vehicles)
0.52Petroleum products (passenger road vehicles)
0.52
Second generation bioethanol (passenger road vehicles)
0.52Petroleum products (freight road vehicles)
0.31
Biodiesel (freight road) 0.25 Petroleum products (two-wheeler) 0.23
High speed rail for aviation 0.01Petroleum products (passenger aviation)
0.29
City trams 0.4
Plug-in hybrid (passenger road vehicles)
0.5
Battery electric (public road vehicles)
0.48
Battery electric (passenger road vehicles)
0.51
Battery electric (two-wheeler) 0.23
ANNEX F:
Levelised costs of renewable and conventional technologies in end-use sectors in 2030

Renewable Energy Prospects: China 97
ANNEX G:
Resource maps
Solar
Source: NREL (2006)
Wind
Source: 3TIER (2009)

Renewable Energy Prospects: China98
ANNEX H:
Detailed roadmap table
Total primary energy supply (PJ/year) 2010 Reference 2030 REmap 2030
Coal 61 561 81 944 67 400Oil 11 460 21 083 19 552Natural gas 2 863 13 633 12 454Nuclear 806 9 575 9 575Hydro 2 600 5 760 5 760Traditional biomass 3 400 1 008 0Modern bioenergy (incl. biogas, biofuels) 1 357 6 429 11 246Solar thermal 860 2 674 4 482Solar PV 3 709 1 602Wind 161 2 332 4 804Geothermal 156 353 643Ocean / Tide / Wave / Other 0 0 0Total 85 229 145 500 137 519Total final energy consumption (PJ/year)
Coal 24 945 25 874 22 800Oil 11 082 20 676 19 145Natural gas 2 006 7 501 6 322Traditional biomass 3 400 1 008 0Modern biomass (incl. biogas) 607 3 424 5 312Modern biomass (liquid) 343 858 858Solar thermal 500 2 667 4 365Geothermal 140 293 439Other renewables 0 0 0Electricity 11 338 26 563 27 099District Heat 2 424 2 918 2 918Total 56 785 91 780 89 257Gross electricity generation (TWh/year)
Coal 3 262 5 099 4 269Natural gas 83 663 663Oil 13 12 12Nuclear 74 878 878Hydro 722 1 600 1 600Biomass 33 192 358Solar PV 1 197 445CSP 0 18 46Wind onshore 43 465 1 105Wind offshore 0 182 158Geothermal 1 9 9Ocean / Tide / Wave 0 0 0Total 4 233 9 315 9 543

Renewable Energy Prospects: China 99
Electricity capacity (GW)
Coal 671 1 020 854Natural gas 35 257 257Oil 15 5 5Nuclear 11 119 119Hydro (excl. pumped hydro) 213 400 400Biomass 6 38 65Solar PV (utility) 1 98 190Solar PV (rooftop) 1 41 118CSP 0 12 32Wind onshore 45 269 501Wind offshore 0 46 60Geothermal 0 1 1Ocean / Tide / Wave 0 0 0Total 999 2 306 2 602CO2 emissions (Mt CO2)
Total emissions from fossil fuel combustion 6 917 10 185 8 493Renewable energy indicators (%)
Renewable energy share electricity - generation 19% 29% 40% VRE share electricity - generation 1% 9% 18%Renewable energy share electricity - capacity 28% 39% 53% VRE share electricity - capacity 5% 20% 35%District heat 1% 1% 36%Industry 0.5% 2% 10% incl. renewable electricity and DH 5% 11% 21%Transport 1% 5% 5% incl. renewable electricity and DH 1% 7% 8%Buildings (excl. trad. biomass) 16% 39% 64% incl. renewable electricity and DH 16% 36% 54%TFEC (excl. trad. biomass) 7% 16% 26%TPES (excl. trad. biomass) 6% 13% 21%Financial indicators (in USD2010)
Substitution Cost - Business Perspective (USD/GJ) 5.6Substitution Cost - Government Perspective (USD/GJ) 6.9Incremental system cost (bln USD/year) 55-60Reduced human health externalities (bln USD/year) -78 to -162Reduced CO2 externalities (bln USD/year) -32 to -126Incremental subsidy needs in 2030 (bln USD/year) 60Incremental investment needs (bln USD/year) 40Investment needs Reference Case (bln USD/year) 91Investment needs REmap Options (bln USD/year) 54Total investment needs RE (bln USD/year) 145Biomass supply (PJ/year)
Total supply potential 8000 - 19000Total demand 12004

Renewable Energy Prospects: China100
ANNEX I:
Traditional use of biomass in China
While studies provide indications of the total population relying on biomass in China, it is not entirely clear how much traditional biomass is actually used according to the energy statistics available.
There are, however, a number of organisations which look into the total biomass demand by sector. The time series for the years between 1990 and 2013 based on the IEA (2013a), LBNL (2013) and FAOSTAT (2014) are provided in Figure 29. The main findings based on these three sources are discussed below:
(i) According to the IEA (2013a), in 2011 the resi-dential sector used around 8 EJ of solid biomass; this was followed by the power generation sec-tor where demand was 0.45 EJ. The residential sector also used a total of 0.3 EJ of biogas. Solid biomass use in the residential sector is decreas-ing whereas the demand for other applications is increasing. From these statistics it is not clear which part of the total solid biomass use in the residential sector is actually traditional. Accord-ing to the IEA definition, all biomass use in the residential sector of the non-OECD countries should be traditional unless otherwise stated. If this definition is followed, the total traditional use of biomass in China in 2011 was 8 EJ. The IEA states in its methodology that data collected for biofuels and waste are estimates based on per capita average consumption according to various surveys and studies.
(ii) The FAO provides figures for fuel wood produc-tion and trade statistics by country. According to the organisation, the total fuel wood con-sumed (equivalent to production) in China has decreased from 3 EJ in 1990 to 1.9 EJ in 2010 (FAOSTAT, 2014)20. This decrease is a strong in-dication that much of this demand is related to
20 The FAO reports wood fuel used in traditional form separately, if countries report the related quantities. This was not the case in China.
traditional uses of biomass in rural areas since an increasing share of China’s population is moving to urban areas; in addition, fuel mix changes in the residential sector are increasing the availabil-ity of LPG from urban to rural areas. According to the FAO, fuel wood includes all demand for power generation, heating and cooking. Exclud-ing biomass demand related to power genera-tion, we estimate the total wood fuel used for heating and cooking in the residential sector to be 1.6 EJ in 2011. However, it is not possible to pro-vide a further breakdown about how much of the demand is traditional and how much is modern.
(iii) Another source which provides bioenergy use data is the LBNL China Energy Databook (LBNL, 2013). This source provides a breakdown of bio-energy use for three types of biomass, name-ly crop stalk, firewood and biogas. The source states that biomass data for rural household consumption should be treated with caution, saying that “…since sources vary, official esti-mates of biomass use for various years may not be comparable”21. According to LBNL, in 2007 the total demand for solid biomass had reached 7.4 EJ, which is similar to what is reported by the IEA (2013a) for the residential sector in the same year. Biogas data is identical to the IEA statistics. Crop stalks (5.2 EJ) accounted for two-thirds of the total demand for rural biomass household consumption with the remaining third coming from firewood (2.8 EJ) in 2007. Firewood data provided by the LBNL databook show strong similarities with the fuel wood data from the FAO.
In addition to these energy statistics, a number of other studies provide estimates for the total use of traditional biomass in the rural residential sector. According to Chen, Yao and Li (2010), rural residential energy con-
21 The following sources have been quoted for the energy data in the statistics: EB, National Rural Energy Planning, 1990; SPC, Energy Conservation in China, 1997; NBS, China Energy Statistical Year-book, various years; NBS, China Statistical Yearbook, various years; EB, China Rural Energy Statistical Yearbook, 1998-1999.

Renewable Energy Prospects: China 101
sumption has shown a considerable shift from tradi-tional to modern biomass use. The share of traditional biomass decreased from 82% in 2001 to 71% in 2008 of the total non-commercial energy use. The absolute volume of traditional use of biomass is shown in Table 18. In 2008, about 5.1 EJ of traditional biomass was used in China, according to the study. This is much lower than the data provided by the IEA statistics and LBNL data-book, but higher than the values according to the FAO.
Xia (2013) reports that rural biomass energy use for the residential sector in China in 2011 was 127 million tonnes of coal equivalent, or 3.7 EJ per year.
Another source of data is the CNREC, which provides a breakdown of total biomass demand for power genera-tion, as briquettes in heating, biogas and finally liquid biofuels. According to the CNREC, total demand for
biomass was 0.7 EJ and 1 EJ per year in 2010 and 2012, respectively. CNREC data for power generation, liquid biofuels and biogas are very similar to the values ac-cording to the IEA statistics and the LBNL databook. However, data for solid biomass (88 PJ) is much lower than what is reported by other sources.
According to Mainali, Pachauri and Nagai (2012), house-hold energy consumption in China ranged between 3.1 GJ and 10 GJ per capita per year (GJ/cap/year) in 2005. About 2-4 GJ/cap/year was related to biomass for cooking and heating. Based on a total rural popula-tion of about 670 million people, the study estimates to-tal biomass demand for cooking was 2.1 EJ/year in 2005.
According to the data provided by Zhou, McNeil and Levine (2009), we estimate the total per capita energy demand in China for cooking and space/water heat-
Figure 28: Comparison of China total biomass use based on different sources, 1990-2013
0
1000
2000
3000
4000
5000
6000
7000
8000
9000
1990 1992 1994 1996 1998 2000 2002 2004 2006 2008 2010 2012
Biom
ass
use
(PJ/
year
)
Residential total solid biomass, IEA Residential total biogas, IEA
Residential fuel wood, FAO Residential crop stalk, LBNL
Residential firewood, LBNL Residential biogas, LBNL
Source: IEA (2013a); LBNL (2013); FAOSTAT (2014)

Renewable Energy Prospects: China102
ing as 2.2 GJ/cap/year in 2010. Half of this is for water heating and the other half is split between 80% space heating and 20% cooking.
Other studies also provide values for similar indicators. According to Daioglou, van Ruijven and van Vuuren (2012), total annual rural energy use per capita in 2007 was 12 GJ. Of this total, about 8.5 GJ/cap/year was re-
lated to cooking and 3 GJ/cap/year was related to space and water heating, of which space heating accounted for a considerably larger share.
Based on these per capita demand estimates and de-pending on the share of the total rural population rely-ing on traditional uses of biomass, total demand in 2010 would be 0.8-4.2 EJ in China.

Renewable Energy Prospects: China 103
P.O. Box 236, Abu Dhabi United Arab Emirates
IRENA Innovation and Technology Centre
Rober t-Schuman-Platz 353175 Bonn
Germany
www.irena.org
IRENA Headquarters

www.irena.org
Copyright©IRENA 2014