IPSOS Brand Equity
6
Brand Equity This paper was originally presented by Dave Walker, Senior Vice President, Research Director Ipsos-ASI at the ARF Week of Workshops on October 8, 2002. Through Advertising Building Learning from Brand Equity Research to Build Ads That Build Brands Years of research have shown that consumer perceptions and attitudes - measured collectively, and commonly described as consumer Brand Equity - have a direct relationship to a brand's market position and business results. Marketers rely on advertising as one primary tool to develop and nurture Brand Equity. This paper will share some findings that look at advertising, as a contributor to Brand Equity - specifically, how Brand Equity measures can contribute to the development and evaluation of advertising at the pretest stage, in a copytest. Short-Term Impact and Long-Term Brand Equity Historically, pretest (copytest) measures are designed primarily to evaluate an ad's potential impact in the short term. We use standardized measures of the ad's potential to be noticed and remembered; to register the brand name and convey its message or image; to reinforce loyalty or preference among current buyers; and to persuade consumers to buy or use the brand. Previous studies, many of them presented at the ARF over the years, have validated these pretest measures in relation to in- market results - typically in terms of sales volume or share, and sometimes awareness, for the period during or immediately following the ad's run. So these pretest measures have a demonstrated ability to identify and quantify the short-term effectiveness of individual ads 1 . But marketers also want advertising to build their brands in the long term. Some studies have focused on the long-term effects of advertising, a year or more beyond the ad's run. They show that some ads are effective in the short term and the long term, while some are effective only while they run. However, we have yet to see any evidence of ads that contribute to business results in the long term without any measurable short-term impact. So we could say that short-term effectiveness is necessary, but not sufficient, to produce long-term results 2 . This raises the obvious question, how can we measure an ad's potential to build the brand in the long term - to develop or reinforce Brand Equity? One approach comes from our learning about Brand Equity. To show how that applies to copytesting, we have to start at the other end: with measures of consumer Brand Equity, in market. Measuring Brand Equity Our measure of Brand Equity comes from a model that uses a handful of standardized attitude measures that are generalizable across brands, business sectors, and markets. In a study representing 200 different brands from 40 different product and service categories, comprising over 12,000 consumer interviews for over 200,000 individual brand assessments, these measures have been validated in relation to market variables and business outcomes - what we like to call "Brand Health."
Transcript of IPSOS Brand Equity
Brand Equity
This paper was originally presented by Dave Walker, Senior Vice President, Research Director Ipsos-ASI at the ARF Week of Workshops on October 8, 2002.
Through AdvertisingBuilding
Learning from Brand Equity Research to Build Ads That Build BrandsYears of research have shown that consumer perceptions and attitudes − measured collectively, and commonly described as consumer Brand Equity − have a direct relationship to a brand's market position and business results. Marketers rely on advertising as one primary tool to develop and nurture Brand Equity. This paper will share some findings that look at advertising, as a contributor to Brand Equity − specifically, how Brand Equity measures can contribute to the development and evaluation of advertising at the pretest stage, in a copytest.
Short-Term Impact and �Long-Term Brand EquityHistorically, pretest (copytest) measures are designed primarily to evaluate an ad's potential impact in the short term. We use standardized measures of the ad's potential to be noticed and remembered; to register the brand name and convey its message or image; to reinforce loyalty or preference among
current buyers; and to persuade consumers to buy or use the brand. Previous studies, many of them presented at the ARF over the years, have validated these pretest measures in relation to in-market results − typically in terms of sales volume or share, and sometimes awareness, for the period during or immediately following the ad's run. So these pretest measures have a demonstrated ability to identify and quantify the short-term effectiveness of individual ads1.
But marketers also want advertising to build their brands in the long term. Some studies have focused on the long-term effects of advertising, a year or more beyond the ad's run. They show that some ads are effective in the short term and the long term, while some are effective only while they run. However, we have yet to see any evidence of ads that contribute to business results in the long term without any measurable short-term impact. So we could say that short-term effectiveness is necessary, but not sufficient, to produce long-term results2.
This raises the obvious question, how can we measure an ad's potential to build the brand in the long term − to develop or reinforce Brand Equity? One approach comes from our learning about Brand Equity. To show how that applies to copytesting, we have to start at the other end: with measures of consumer Brand Equity, in market.
Measuring Brand EquityOur measure of Brand Equity comes from a model that uses a handful of standardized attitude measures that are generalizable across brands, business sectors, and markets. In a study representing 200 different brands from 40 different product and service categories, comprising over 12,000 consumer interviews for over 200,000 individual brand assessments, these measures have been validated in relation to market variables and business outcomes − what we like to call "Brand Health."
Ipsos-ASI is the largest provider of advertising pre-testing services in the world. We are committed to working with our clients to build brand health and maximize the return on their advertising investment by helping them make decisions that improve and optimize their marketing communications.
All of Ipsos-ASI's advertising pre-testing services provide multiple measures of recall, persuasion, and diagnostics. Ipsos-ASI Next*TV®, an in-home, video-based system, offers local, regional, and multinational advertisers a truly global copy testing system with methods providing comparable measures around the world. Other pre-testing services include Next*Print, Next*Kids, and Next*Idea.
Ipsos-ASI provides a full range of advertising research services with Advertising Testing, Tracking and Brand Equity, backed by a dedicated team of advertising research experts whose mission is to deliver the answers that will add value to your business anywhere in the world.
Ipsos-ASI, The Advertising Research Company
North America
Ipsos-ASI, Inc.�Norwalk, CT �USA�Tel: +1.203.840.3400�Fax: +1.203.840.3450
Ipsos-ASI, Inc.�Cincinnati, OH �USA�Tel: +1.513.552.1100�Fax: +1.513.552.1110
Ipsos-ASI, Inc.�Chicago, IL �USA�Tel: +1.773.871.4020�Fax: +1.773.871.4021
Ipsos-ASI, Ltd. �Toronto, Ontario�Canada�Tel: +1.416.925.4444�Fax: +1.416.925.1867
Ipsos-ASI, Ltd. �Montreal, Quebec �Canada�Tel: +1.514.934.5555�Fax: +1.514.934.1600
Latin America
Ipsos-ASI�Buenos Aires, Argentina�Tel: +54.11.4783.4198�Fax: +54.11.4784.7246
Ipsos-ASI�São Paulo, Brazil�Tel: +55.11.3168.8447�Fax: +55.11.3167.3224
Ipsos-ASI Andina�Bogotá, Colombia�Tel: +57.1.611.1176�Fax: +57.1.530.0486
Ipsos-ASI�Mexico DF, Mexico�Tel: +52.55.580.0288�Fax: +52.55.395.8647
Ipsos-ASI�Caracas, Venezuela�Tel/Fax: +58.212.761.9868
Europe
Ipsos-ASI at�Ipsos-Insight Marketing�Montrouge, France�Tel: +33.1.53.68.45.29�Fax: +33.1.53.68.01.87
Ipsos-ASI at�Ipsos Deutschland�Hamburg, Germany�Tel: +49.40.800.960�Fax: +49.40.800.96100
Ipsos-ASI �Milan, Italy�Tel: +39.02.67330.1�Fax: +39.02.67330.902
Ipsos-ASI at�Ipsos-Eco Consulting�Barcelona, Spain�Tel: +34.93.452.21.00�Fax: +34.93.452.21.01
Ipsos-ASI at�Ipsos-Eco Consulting�Madrid, Spain�Tel: +34.91.767.21.99�Fax: +34.91.302.43.86
Ipsos-ASI at Ipsos-UK�Harrow, United Kingdom�Tel: +44.20.8861.8000�Fax: +44.20.8861.5515
Asia-Pacific
Ipsos-ASI at�Ipsos-Australia�North Sydney, Australia�Tel: +61.2.9954. 0319�Fax: +61.2.9954.0284
Ipsos-ASI at Ipsos-Link�Beijing, �People's Republic of China�Tel: +86.10.8403.9070.75 �Fax: +86.10.8403.9069
Ipsos-ASI at Ipsos-Link�Shanghai, �People's Republic of China�Tel.: +86.21.5403.3933�Fax: +86.21.5403.3299
Strategy
Storyboards
Development
Assessment
Solutions
6
ConclusionsWe've demonstrated an ability to evaluate and differentiate ads on the basis of their potential to enhance or reinforce Brand Equity. But more than that, the relationship between sales −validated measures of short-term advertising impact, on the one hand, and market-validated measures of Brand Equity, on the other, is both compelling and useful.
It shows that immediate and long-term objectives are compatible, and may be mutually supportive. It means the Equity ratings add a new Diagnostic dimension to the copytest, to help advertisers understand and optimize performance on the short-term measures. As some of these tested ads find their way into media schedules and the brands are measured again in our longitudinal studies, we expect to see that ads that move these Equity ratings, in the copytest, will build Brand Equity in the long term.
1Brigitte Biteau and David Brandt, "Pre-Testing and Sales Validation," Admap, February 2000; Dave Walker, "Better Validation, Better Copytesting: Reaching for a Higher Standard."ARF Advertising and Copy Research Workshop, NY: Advertising Research Foundation, 1995.
2Abundant testimony includes Simon Broadbent, "Measuring the long-term impact of advertising to the advertiser's satisfaction." Monitoring Advertising Performance - Admap seminar, 1996; John Philip Jones, When Ads Work. New York: Lexington Books, 1995; Kevin Keller, Building, Measuring and Managing Brand Equity. Prentice Hall, 1998;�Larry Light, "Brand Loyalty Marketing: A Top Management Perspective." ARF Annual Research Conference, NY: Advertising Research Foundation, 1995; Leonard Lodish, "Key Findings from the 'How Advertising Works' Study," and Beth Lubetkin, "Additional Major Findings from the 'How Advertising Works' Study" ARF Conference, Nov. 1991.
3John Hallward, Ipsos-ASI. "The Creators of Brand Equity." ARF Week of Workshops 2001, Chicago.
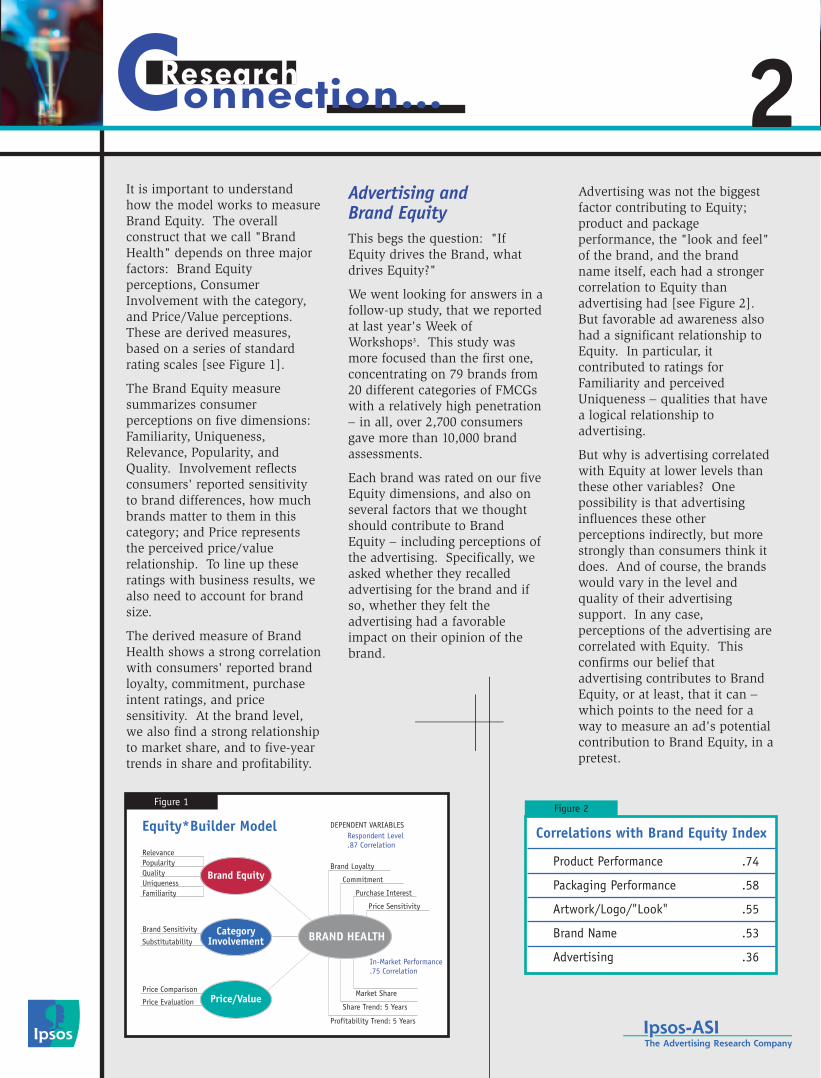
It is important to understand how the model works to measure Brand Equity. The overall construct that we call "Brand Health" depends on three major factors: Brand Equity perceptions, Consumer Involvement with the category, and Price/Value perceptions. These are derived measures, based on a series of standard rating scales [see Figure 1].
The Brand Equity measure summarizes consumer perceptions on five dimensions: Familiarity, Uniqueness, Relevance, Popularity, and Quality. Involvement reflects consumers' reported sensitivity to brand differences, how much brands matter to them in this category; and Price represents the perceived price/value relationship. To line up these ratings with business results, we also need to account for brand size.
The derived measure of Brand Health shows a strong correlation with consumers' reported brand loyalty, commitment, purchase intent ratings, and price sensitivity. At the brand level, we also find a strong relationship to market share, and to five-year trends in share and profitability.
Advertising and �Brand EquityThis begs the question: "If Equity drives the Brand, what drives Equity?"
We went looking for answers in a follow-up study, that we reported at last year's Week of Workshops3. This study was more focused than the first one, concentrating on 79 brands from 20 different categories of FMCGs with a relatively high penetration − in all, over 2,700 consumers gave more than 10,000 brand assessments.
Each brand was rated on our five Equity dimensions, and also on several factors that we thought should contribute to Brand Equity − including perceptions of the advertising. Specifically, we asked whether they recalled advertising for the brand and if so, whether they felt the advertising had a favorable impact on their opinion of the brand.
Advertising was not the biggest factor contributing to Equity; product and package performance, the "look and feel" of the brand, and the brand name itself, each had a stronger correlation to Equity than advertising had [see Figure 2]. But favorable ad awareness also had a significant relationship to Equity. In particular, it contributed to ratings for Familiarity and perceived Uniqueness − qualities that have a logical relationship to advertising.
But why is advertising correlated with Equity at lower levels than these other variables? One possibility is that advertising influences these other perceptions indirectly, but more strongly than consumers think it does. And of course, the brands would vary in the level and quality of their advertising support. In any case, perceptions of the advertising are correlated with Equity. This confirms our belief that advertising contributes to Brand Equity, or at least, that it can − which points to the need for a way to measure an ad's potential contribution to Brand Equity, in a pretest.
2
Correlations with Brand Equity Index
Product Performance
Packaging Performance
Artwork/Logo/"Look"
Brand Name
Advertising
.74�
.58�
.55�
.53�
.36
Figure 2
Equity Measures and Persuasive ImpactWe already know, from our Brand Equity studies, that the Equity Index and its components are directly correlated with Purchase Intent (PI) for the brand. In our copytest, we turn Purchase Intent into a Persuasion measure by evaluating the change in PI for the ad, compared to its matched Control group with no ad exposure.
Since the Equity measures are already correlated with PI in the Control group, we need to take the Equity ratings for each ad as a change score too, relative to its Control group levels. When we do, we find a direct relationship to persuasion: ads that produce a bigger change in the Brand Equity ratings produce a bigger change in Purchase Intent [see Figure 8].
This relationship holds for each of the components of the Equity Index: Familiarity, Uniqueness, Relevance, Popularity, and Quality.
Average Change in Purchase Intent (Definitely/Probably Buy) byChange vs. Control (Tertiles) for Equity Index and Ratings
n=90 AdTests vs. Control
Brand Equity Index
Familiarity
Uniqueness
Relevance
Popularity
Quality
Top 1/3
9.0�
7.6�
8.5�
10.3�
9.2�
7.3
Middle 1/3
4.2�
4.1�
5.2�
2.3�
3.7�
7.1
Bottom 1/3�
2.3
3.8�
1.7�
2.8�
2.6�
0.7
Figure 8
Brand Sensitivity
Substitutability
Price Comparison
Price Evaluation
UniquenessFamiliarity
Relevance
Figure 1
Price Sensitivity
Purchase Interest
Market Share
Commitment
Brand Loyalty
Profitability Trend: 5 Years
DEPENDENT VARIABLESRespondent Level.87 Correlation
In-Market Performance.75 Correlation
Share Trend: 5 Years
QualityPopularity
Equity*Builder Model
BRAND HEALTH
Brand Equity
CategoryInvolvement
Price/Value
5
Copy Test Measures for�Brand EquityAt around the same time as this study, we began to include the five Equity ratings in the Diagnostic segment of our copytest. Of course, "equity" is not a property of an individual ad; it's a property of the brand. But in a copytest that measures consumers' perceptions and reactions to an ad execution, we should be able to measure its potential to enhance or reinforce brand perceptions. Equity studies typically reference attributes specific to a brand or category, to identify the unique "equities" that position and differentiate individual brands. We often evaluate these in copytests, too. But by adding the validated, generalizable items from the Equity*Builder model, we should be able to assess ads at the pretest stage in terms of their potential to build Brand Equity.
Here's a quick summary of the copytest methodology that we call Next*TV: A nationally distributed sample is recruited to the survey by telephone, in the guise of a "program evaluation study." Qualified recruits get a packet in the mail with a VHS tape that has a half-hour sitcom, with commercials embedded in the program, and instructions for the study. The next day we contact them again by phone to ask questions about the program, and to collect day-after recall measures for the test ads.
After the recall measures, we administer a monadic exposure to selected test ads, which are "hidden" at the end of the tape. From this monadic exposure, we collect communication and reaction measures, Purchase
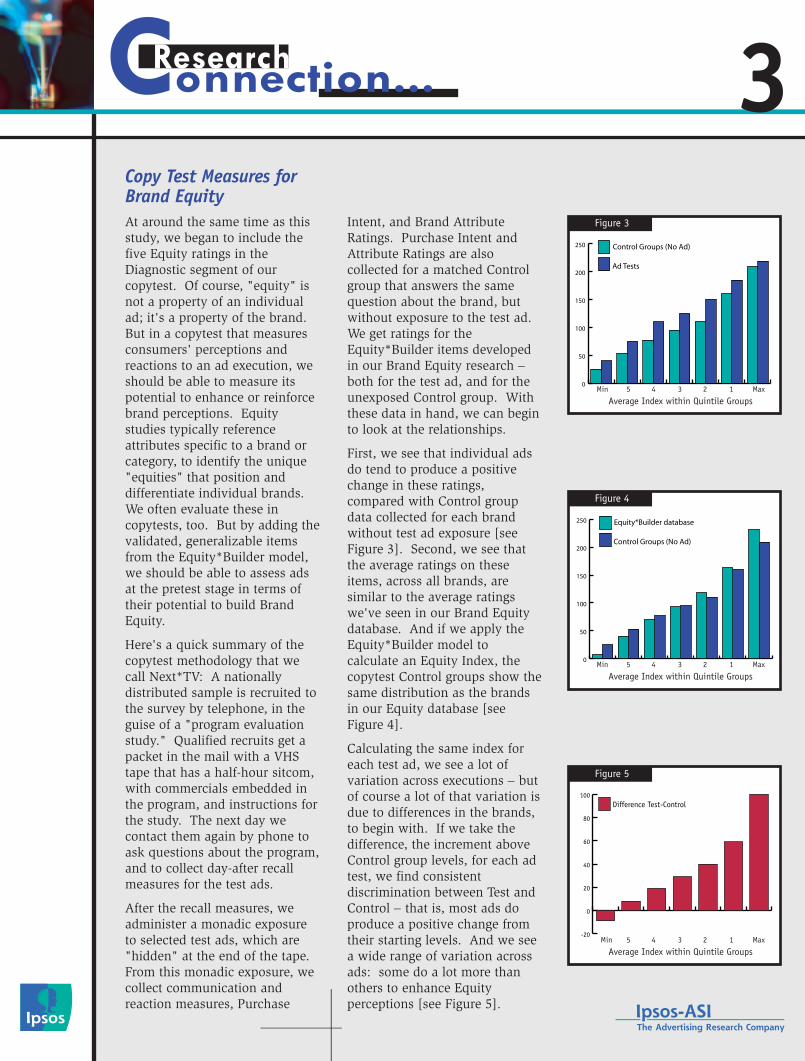
Intent, and Brand Attribute Ratings. Purchase Intent and Attribute Ratings are also collected for a matched Control group that answers the same question about the brand, but without exposure to the test ad. We get ratings for the Equity*Builder items developed in our Brand Equity research − both for the test ad, and for the unexposed Control group. With these data in hand, we can begin to look at the relationships.
First, we see that individual ads do tend to produce a positive change in these ratings, compared with Control group data collected for each brand without test ad exposure [see Figure 3]. Second, we see that the average ratings on these items, across all brands, are similar to the average ratings we've seen in our Brand Equity database. And if we apply the Equity*Builder model to calculate an Equity Index, the copytest Control groups show the same distribution as the brands in our Equity database [see Figure 4].
Calculating the same index for each test ad, we see a lot of variation across executions − but of course a lot of that variation is due to differences in the brands, to begin with. If we take the difference, the increment above Control group levels, for each ad test, we find consistent discrimination between Test and Control − that is, most ads do produce a positive change from their starting levels. And we see a wide range of variation across ads: some do a lot more than others to enhance Equity perceptions [see Figure 5].
3Figure 3
Average Index within Quintile GroupsMin 5 4 3 2 1 Max
Figure 4
Average Index within Quintile GroupsMin 5 4 3 2 1 Max
Figure 5
Average Index within Quintile Groups4 3 2 1 Max
-20
0
20
40
60
80
100Difference Test-Control
Min 5
0
50
100
150
200
250
Control Groups (No Ad)
Equity*Builder database
0
50
100
150
200
250
Ad Tests
Control Groups (No Ad)
These results confirm our expectations. The data show that:
AValidated Brand Equity measures can be transferred to the copytest;
AData distributions indicate we are measuring substantially the same things; so
AWe can evaluate and discriminate between individual ads, based on their potential to enhance or reinforce perceptions that drive Brand Equity.
This is useful in itself, because it provides an added dimension to the pretest assessment. For individual ads, however, the traditional measures of immediate impact remain the primary criterion for evaluation. How are these related to the Brand Equity measures?
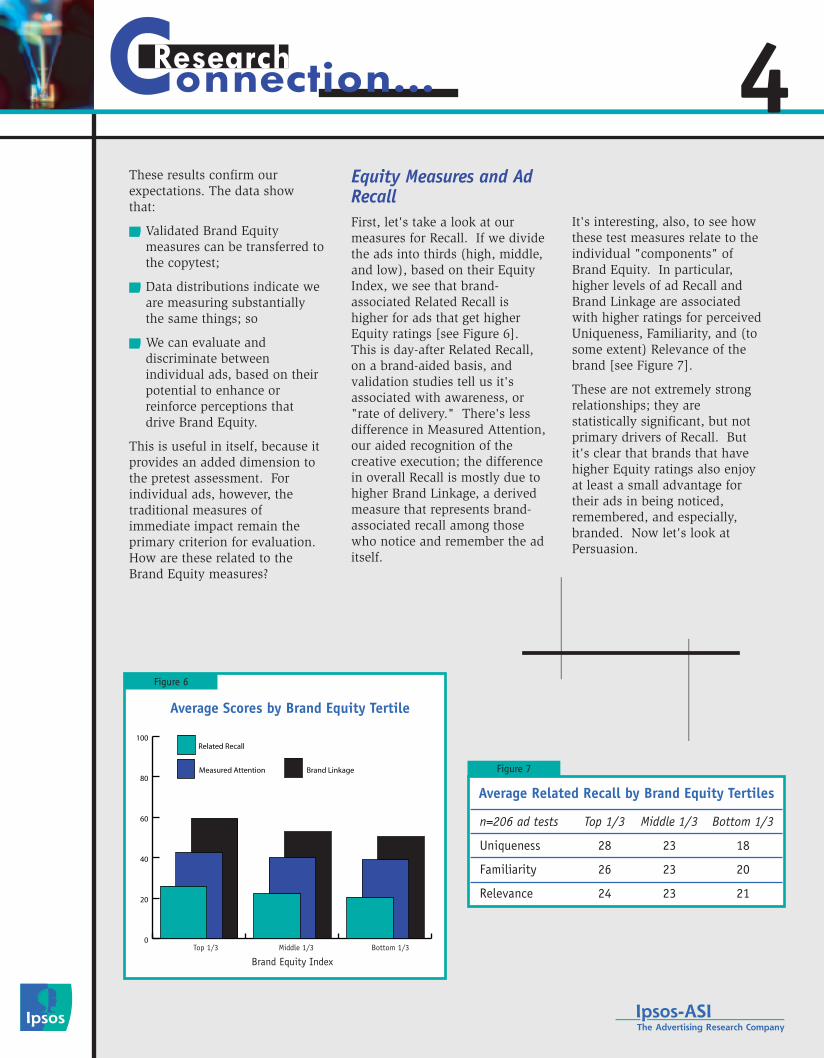
Equity Measures and Ad RecallFirst, let's take a look at our measures for Recall. If we divide the ads into thirds (high, middle, and low), based on their Equity Index, we see that brand-associated Related Recall is higher for ads that get higher Equity ratings [see Figure 6]. This is day-after Related Recall, on a brand-aided basis, and validation studies tell us it's associated with awareness, or "rate of delivery." There's less difference in Measured Attention, our aided recognition of the creative execution; the difference in overall Recall is mostly due to higher Brand Linkage, a derived measure that represents brand-associated recall among those who notice and remember the ad itself.
It's interesting, also, to see how these test measures relate to the individual "components" of Brand Equity. In particular, higher levels of ad Recall and Brand Linkage are associated with higher ratings for perceived Uniqueness, Familiarity, and (to some extent) Relevance of the brand [see Figure 7].
These are not extremely strong relationships; they are statistically significant, but not primary drivers of Recall. But it's clear that brands that have higher Equity ratings also enjoy at least a small advantage for their ads in being noticed, remembered, and especially, branded. Now let's look at Persuasion.
4
Average Related Recall by Brand Equity Tertiles
n=206 ad tests
Uniqueness
Familiarity
Relevance
Top 1/3
28�
26�
24
Middle 1/3�
23�
23�
23
Bottom 1/3�
18�
20�
21
Figure 7
Brand Equity Index
0
20
40
60
80
100
Brand LinkageMeasured Attention
Related Recall
Figure 6
Average Scores by Brand Equity Tertile
Top 1/3 Middle 1/3 Bottom 1/3

ConclusionsWe've demonstrated an ability to evaluate and differentiate ads on the basis of their potential to enhance or reinforce Brand Equity. But more than that, the relationship between sales −validated measures of short-term advertising impact, on the one hand, and market-validated measures of Brand Equity, on the other, is both compelling and useful.
It shows that immediate and long-term objectives are compatible, and may be mutually supportive. It means the Equity ratings add a new Diagnostic dimension to the copytest, to help advertisers understand and optimize performance on the short-term measures. As some of these tested ads find their way into media schedules and the brands are measured again in our longitudinal studies, we expect to see that ads that move these Equity ratings, in the copytest, will build Brand Equity in the long term.
1Brigitte Biteau and David Brandt, "Pre-Testing and Sales Validation," Admap, February 2000; Dave Walker, "Better Validation, Better Copytesting: Reaching for a Higher Standard."ARF Advertising and Copy Research Workshop, NY: Advertising Research Foundation, 1995.
2Abundant testimony includes Simon Broadbent, "Measuring the long-term impact of advertising to the advertiser's satisfaction." Monitoring Advertising Performance - Admap seminar, 1996; John Philip Jones, When Ads Work. New York: Lexington Books, 1995; Kevin Keller, Building, Measuring and Managing Brand Equity. Prentice Hall, 1998;�Larry Light, "Brand Loyalty Marketing: A Top Management Perspective." ARF Annual Research Conference, NY: Advertising Research Foundation, 1995; Leonard Lodish, "Key Findings from the 'How Advertising Works' Study," and Beth Lubetkin, "Additional Major Findings from the 'How Advertising Works' Study" ARF Conference, Nov. 1991.
3John Hallward, Ipsos-ASI. "The Creators of Brand Equity." ARF Week of Workshops 2001, Chicago.
It is important to understand how the model works to measure Brand Equity. The overall construct that we call "Brand Health" depends on three major factors: Brand Equity perceptions, Consumer Involvement with the category, and Price/Value perceptions. These are derived measures, based on a series of standard rating scales [see Figure 1].
The Brand Equity measure summarizes consumer perceptions on five dimensions: Familiarity, Uniqueness, Relevance, Popularity, and Quality. Involvement reflects consumers' reported sensitivity to brand differences, how much brands matter to them in this category; and Price represents the perceived price/value relationship. To line up these ratings with business results, we also need to account for brand size.
The derived measure of Brand Health shows a strong correlation with consumers' reported brand loyalty, commitment, purchase intent ratings, and price sensitivity. At the brand level, we also find a strong relationship to market share, and to five-year trends in share and profitability.
Advertising and �Brand EquityThis begs the question: "If Equity drives the Brand, what drives Equity?"
We went looking for answers in a follow-up study, that we reported at last year's Week of Workshops3. This study was more focused than the first one, concentrating on 79 brands from 20 different categories of FMCGs with a relatively high penetration − in all, over 2,700 consumers gave more than 10,000 brand assessments.
Each brand was rated on our five Equity dimensions, and also on several factors that we thought should contribute to Brand Equity − including perceptions of the advertising. Specifically, we asked whether they recalled advertising for the brand and if so, whether they felt the advertising had a favorable impact on their opinion of the brand.
Advertising was not the biggest factor contributing to Equity; product and package performance, the "look and feel" of the brand, and the brand name itself, each had a stronger correlation to Equity than advertising had [see Figure 2]. But favorable ad awareness also had a significant relationship to Equity. In particular, it contributed to ratings for Familiarity and perceived Uniqueness − qualities that have a logical relationship to advertising.
But why is advertising correlated with Equity at lower levels than these other variables? One possibility is that advertising influences these other perceptions indirectly, but more strongly than consumers think it does. And of course, the brands would vary in the level and quality of their advertising support. In any case, perceptions of the advertising are correlated with Equity. This confirms our belief that advertising contributes to Brand Equity, or at least, that it can − which points to the need for a way to measure an ad's potential contribution to Brand Equity, in a pretest.
2
Correlations with Brand Equity Index
Product Performance
Packaging Performance
Artwork/Logo/"Look"
Brand Name
Advertising
.74�
.58�
.55�
.53�
.36
Figure 2
Equity Measures and Persuasive ImpactWe already know, from our Brand Equity studies, that the Equity Index and its components are directly correlated with Purchase Intent (PI) for the brand. In our copytest, we turn Purchase Intent into a Persuasion measure by evaluating the change in PI for the ad, compared to its matched Control group with no ad exposure.
Since the Equity measures are already correlated with PI in the Control group, we need to take the Equity ratings for each ad as a change score too, relative to its Control group levels. When we do, we find a direct relationship to persuasion: ads that produce a bigger change in the Brand Equity ratings produce a bigger change in Purchase Intent [see Figure 8].
This relationship holds for each of the components of the Equity Index: Familiarity, Uniqueness, Relevance, Popularity, and Quality.
Average Change in Purchase Intent (Definitely/Probably Buy) byChange vs. Control (Tertiles) for Equity Index and Ratings
n=90 AdTests vs. Control
Brand Equity Index
Familiarity
Uniqueness
Relevance
Popularity
Quality
Top 1/3
9.0�
7.6�
8.5�
10.3�
9.2�
7.3
Middle 1/3
4.2�
4.1�
5.2�
2.3�
3.7�
7.1
Bottom 1/3�
2.3
3.8�
1.7�
2.8�
2.6�
0.7
Figure 8
Brand Sensitivity
Substitutability
Price Comparison
Price Evaluation
UniquenessFamiliarity
Relevance
Figure 1
Price Sensitivity
Purchase Interest
Market Share
Commitment
Brand Loyalty
Profitability Trend: 5 Years
DEPENDENT VARIABLESRespondent Level.87 Correlation
In-Market Performance.75 Correlation
Share Trend: 5 Years
QualityPopularity
Equity*Builder Model
BRAND HEALTH
Brand Equity
CategoryInvolvement
Price/Value
5
Brand Equity
This paper was originally presented by Dave Walker, Senior Vice President, Research Director Ipsos-ASI at the ARF Week of Workshops on October 8, 2002.
Through AdvertisingBuilding
Learning from Brand Equity Research to Build Ads That Build BrandsYears of research have shown that consumer perceptions and attitudes − measured collectively, and commonly described as consumer Brand Equity − have a direct relationship to a brand's market position and business results. Marketers rely on advertising as one primary tool to develop and nurture Brand Equity. This paper will share some findings that look at advertising, as a contributor to Brand Equity − specifically, how Brand Equity measures can contribute to the development and evaluation of advertising at the pretest stage, in a copytest.
Short-Term Impact and �Long-Term Brand EquityHistorically, pretest (copytest) measures are designed primarily to evaluate an ad's potential impact in the short term. We use standardized measures of the ad's potential to be noticed and remembered; to register the brand name and convey its message or image; to reinforce loyalty or preference among
current buyers; and to persuade consumers to buy or use the brand. Previous studies, many of them presented at the ARF over the years, have validated these pretest measures in relation to in-market results − typically in terms of sales volume or share, and sometimes awareness, for the period during or immediately following the ad's run. So these pretest measures have a demonstrated ability to identify and quantify the short-term effectiveness of individual ads1.
But marketers also want advertising to build their brands in the long term. Some studies have focused on the long-term effects of advertising, a year or more beyond the ad's run. They show that some ads are effective in the short term and the long term, while some are effective only while they run. However, we have yet to see any evidence of ads that contribute to business results in the long term without any measurable short-term impact. So we could say that short-term effectiveness is necessary, but not sufficient, to produce long-term results2.
This raises the obvious question, how can we measure an ad's potential to build the brand in the long term − to develop or reinforce Brand Equity? One approach comes from our learning about Brand Equity. To show how that applies to copytesting, we have to start at the other end: with measures of consumer Brand Equity, in market.
Measuring Brand EquityOur measure of Brand Equity comes from a model that uses a handful of standardized attitude measures that are generalizable across brands, business sectors, and markets. In a study representing 200 different brands from 40 different product and service categories, comprising over 12,000 consumer interviews for over 200,000 individual brand assessments, these measures have been validated in relation to market variables and business outcomes − what we like to call "Brand Health."
Ipsos-ASI is the largest provider of advertising pre-testing services in the world. We are committed to working with our clients to build brand health and maximize the return on their advertising investment by helping them make decisions that improve and optimize their marketing communications.
All of Ipsos-ASI's advertising pre-testing services provide multiple measures of recall, persuasion, and diagnostics. Ipsos-ASI Next*TV®, an in-home, video-based system, offers local, regional, and multinational advertisers a truly global copy testing system with methods providing comparable measures around the world. Other pre-testing services include Next*Print, Next*Kids, and Next*Idea.
Ipsos-ASI provides a full range of advertising research services with Advertising Testing, Tracking and Brand Equity, backed by a dedicated team of advertising research experts whose mission is to deliver the answers that will add value to your business anywhere in the world.
Ipsos-ASI, The Advertising Research Company
North America
Ipsos-ASI, Inc.�Norwalk, CT �USA�Tel: +1.203.840.3400�Fax: +1.203.840.3450
Ipsos-ASI, Inc.�Cincinnati, OH �USA�Tel: +1.513.552.1100�Fax: +1.513.552.1110
Ipsos-ASI, Inc.�Chicago, IL �USA�Tel: +1.773.871.4020�Fax: +1.773.871.4021
Ipsos-ASI, Ltd. �Toronto, Ontario�Canada�Tel: +1.416.925.4444�Fax: +1.416.925.1867
Ipsos-ASI, Ltd. �Montreal, Quebec �Canada�Tel: +1.514.934.5555�Fax: +1.514.934.1600
Latin America
Ipsos-ASI�Buenos Aires, Argentina�Tel: +54.11.4783.4198�Fax: +54.11.4784.7246
Ipsos-ASI�São Paulo, Brazil�Tel: +55.11.3168.8447�Fax: +55.11.3167.3224
Ipsos-ASI Andina�Bogotá, Colombia�Tel: +57.1.611.1176�Fax: +57.1.530.0486
Ipsos-ASI�Mexico DF, Mexico�Tel: +52.55.580.0288�Fax: +52.55.395.8647
Ipsos-ASI�Caracas, Venezuela�Tel/Fax: +58.212.761.9868
Europe
Ipsos-ASI at�Ipsos-Insight Marketing�Montrouge, France�Tel: +33.1.53.68.45.29�Fax: +33.1.53.68.01.87
Ipsos-ASI at�Ipsos Deutschland�Hamburg, Germany�Tel: +49.40.800.960�Fax: +49.40.800.96100
Ipsos-ASI �Milan, Italy�Tel: +39.02.67330.1�Fax: +39.02.67330.902
Ipsos-ASI at�Ipsos-Eco Consulting�Barcelona, Spain�Tel: +34.93.452.21.00�Fax: +34.93.452.21.01
Ipsos-ASI at�Ipsos-Eco Consulting�Madrid, Spain�Tel: +34.91.767.21.99�Fax: +34.91.302.43.86
Ipsos-ASI at Ipsos-UK�Harrow, United Kingdom�Tel: +44.20.8861.8000�Fax: +44.20.8861.5515
Asia-Pacific
Ipsos-ASI at�Ipsos-Australia�North Sydney, Australia�Tel: +61.2.9954. 0319�Fax: +61.2.9954.0284
Ipsos-ASI at Ipsos-Link�Beijing, �People's Republic of China�Tel: +86.10.8403.9070.75 �Fax: +86.10.8403.9069
Ipsos-ASI at Ipsos-Link�Shanghai, �People's Republic of China�Tel.: +86.21.5403.3933�Fax: +86.21.5403.3299
Strategy
Storyboards
Development
Assessment
Solutions
6