IoT Traffic Management and Integration in the QoS ...
19
352 IEEE INTERNET OF THINGS JOURNAL, VOL. 5, NO. 1, FEBRUARY 2018 IoT Traffic Management and Integration in the QoS Supported Network Basim K. J. Al-Shammari , Graduate Student Member, IEEE, Nadia Al-Aboody , Member, IEEE, and Hamed S. Al-Raweshidy, Senior Member, IEEE Abstract—This paper proposes: 1) a traffic flow management policy, which allocates and organizes machine type communica- tion (MTC) traffic flows network resources sharing within evolved packet system (EPS); 2) an access element as a wireless sen- sor network gateway for providing an overlaying access channel between the machine type devices and EPS; and 3) it addresses the effect and interaction in the heterogeneity of applications, services and terminal devices, and the related quality of service (QoS) issues among them. This paper overcomes the problems of network resource starvation by preventing deterioration of network performance. The scheme is validated through simula- tion, which indicates the proposed traffic flow management policy outperforms the current traffic management policy. Specifically, simulation results show that the proposed model achieves an enhancement in QoS performance for the MTC traffic flows, including a decrease of 99.45% in packet loss rate (PLR), a decrease of 99.89% in packet end to end (E2E) delay, a decrease of 99.21% in packet delay variation (PDV). Furthermore, it retains the perceived quality of experience of the real time appli- cation users within high satisfaction levels, such as the voice over long term evolution service possessing a mean opinion score (MOS) of 4.349 and enhancing the QoS of a video con- ference service within the standardized values of a 3GPP body, with a decrease of 85.28% in PLR, a decrease of 85% in packet E2E delay and a decrease of 88.5% in PDV. Index Terms—Application quality of service (AQoS), end to end (E2E) delay, gateway, human type communication (HTC), Internet of Things (IoT), jitter, machine type communication (MTC), network QoS (NQoS), quality of experience (QoE), QoS class identifier (QCI), traffic policy. NOMENCLATURE List of Abbreviations 3G, 4G, 5G 3rd, 4th, 5th generation. AC Admission control. ARP Allocation and retention priority. AQoS Application QoS. BS Base station. CoAP Constrained application protocol. DL Downlink. DSCP Differentiated services code point. E2E End to end. Manuscript received May 25, 2017; revised November 19, 2017; accepted December 14, 2017. Date of publication December 19, 2017; date of current version February 9, 2018. (Corresponding author: Basim K. J. Al-Shammari.) The authors are with the Department of Electronic and Computer Engineering, Brunel University London, London UB8 3PH, U.K. (e-mail: [email protected]). Digital Object Identifier 10.1109/JIOT.2017.2785219 eNB evolved NodeB. EPS Evolved packet system. UE User equipment. FTP File transfer protocol. GBR Guaranteed bit rate. H2H Human-to-human. HTC Human type communication. HTD Human type device. IoT Internet of Things. IP Internet protocol. KPI Key performance indicator. KQIs Key quality indicators. LPWAN Low power WAN. LTE Long term evolution. LTE-A LTE Advanced. LTE-APro LTE-A proximity. M2M Machine to machine. MAC Medium access control. MBR Maximum bit rate. MC Mission critical. MCN Mobile cellular networks. MOS Mean opinion score. MTC Machine type communication. MTD Machine type devices. NAS Non access stratum. NB-IoT Narrow band IoT. NGBR Non-guaranteed bit rate. NGN Next generation network. NQoS Network QoS. PDB Packet delay budget. PDCCH Physical downlink control channel. PDV Packet delay variation. PDN Packet data network. PCEF Policy control enforcement function. PCC Policy charging and control. PLR Packet loss rate. PRACH Physical random access channel. PS Packet switching. PUSCH Physical uplink shared channel. QoE Quality of experience. QoS Quality of service. QCI QoS class identifier. RAN Radio access network. SDF Service data flow. SN Sensor node. TFT Traffic flow template. This work is licensed under a Creative Commons Attribution 3.0 License. For more information, see http://creativecommons.org/licenses/by/3.0/
Transcript of IoT Traffic Management and Integration in the QoS ...
352 IEEE INTERNET OF THINGS JOURNAL, VOL. 5, NO. 1, FEBRUARY 2018
IoT Traffic Management and Integrationin the QoS Supported Network
Basim K. J. Al-Shammari , Graduate Student Member, IEEE, Nadia Al-Aboody , Member, IEEE,and Hamed S. Al-Raweshidy, Senior Member, IEEE
Abstract—This paper proposes: 1) a traffic flow managementpolicy, which allocates and organizes machine type communica-tion (MTC) traffic flows network resources sharing within evolvedpacket system (EPS); 2) an access element as a wireless sen-sor network gateway for providing an overlaying access channelbetween the machine type devices and EPS; and 3) it addressesthe effect and interaction in the heterogeneity of applications,services and terminal devices, and the related quality of service(QoS) issues among them. This paper overcomes the problemsof network resource starvation by preventing deterioration ofnetwork performance. The scheme is validated through simula-tion, which indicates the proposed traffic flow management policyoutperforms the current traffic management policy. Specifically,simulation results show that the proposed model achieves anenhancement in QoS performance for the MTC traffic flows,including a decrease of 99.45% in packet loss rate (PLR), adecrease of 99.89% in packet end to end (E2E) delay, a decreaseof 99.21% in packet delay variation (PDV). Furthermore, itretains the perceived quality of experience of the real time appli-cation users within high satisfaction levels, such as the voiceover long term evolution service possessing a mean opinionscore (MOS) of 4.349 and enhancing the QoS of a video con-ference service within the standardized values of a 3GPP body,with a decrease of 85.28% in PLR, a decrease of 85% in packetE2E delay and a decrease of 88.5% in PDV.
Index Terms—Application quality of service (AQoS), end toend (E2E) delay, gateway, human type communication (HTC),Internet of Things (IoT), jitter, machine type communication(MTC), network QoS (NQoS), quality of experience (QoE), QoSclass identifier (QCI), traffic policy.
NOMENCLATURE
List of Abbreviations
3G, 4G, 5G 3rd, 4th, 5th generation.AC Admission control.ARP Allocation and retention priority.AQoS Application QoS.BS Base station.CoAP Constrained application protocol.DL Downlink.DSCP Differentiated services code point.E2E End to end.
Manuscript received May 25, 2017; revised November 19, 2017; acceptedDecember 14, 2017. Date of publication December 19, 2017; date of currentversion February 9, 2018. (Corresponding author: Basim K. J. Al-Shammari.)
The authors are with the Department of Electronic and ComputerEngineering, Brunel University London, London UB8 3PH, U.K. (e-mail:[email protected]).
Digital Object Identifier 10.1109/JIOT.2017.2785219
eNB evolved NodeB.EPS Evolved packet system.UE User equipment.FTP File transfer protocol.GBR Guaranteed bit rate.H2H Human-to-human.HTC Human type communication.HTD Human type device.IoT Internet of Things.IP Internet protocol.KPI Key performance indicator.KQIs Key quality indicators.LPWAN Low power WAN.LTE Long term evolution.LTE-A LTE Advanced.LTE-APro LTE-A proximity.M2M Machine to machine.MAC Medium access control.MBR Maximum bit rate.MC Mission critical.MCN Mobile cellular networks.MOS Mean opinion score.MTC Machine type communication.MTD Machine type devices.NAS Non access stratum.NB-IoT Narrow band IoT.NGBR Non-guaranteed bit rate.NGN Next generation network.NQoS Network QoS.PDB Packet delay budget.PDCCH Physical downlink control channel.PDV Packet delay variation.PDN Packet data network.PCEF Policy control enforcement function.PCC Policy charging and control.PLR Packet loss rate.PRACH Physical random access channel.PS Packet switching.PUSCH Physical uplink shared channel.QoE Quality of experience.QoS Quality of service.QCI QoS class identifier.RAN Radio access network.SDF Service data flow.SN Sensor node.TFT Traffic flow template.
This work is licensed under a Creative Commons Attribution 3.0 License. For more information, see http://creativecommons.org/licenses/by/3.0/
AL-SHAMMARI et al.: IoT TRAFFIC MANAGEMENT AND INTEGRATION IN QoS SUPPORTED NETWORK 353
TTI Transmission time interval.UL Uplink.VoLTE Voice over LTE.WAN Wide area network.WSN Wireless sensor network.
I. INTRODUCTION AND RELATED WORK
MTC (or M2M communication) introduces the conceptof enabling networked devices (wireless and/or wired),
electronic devices, dubbed MTC devices and/or communica-tion from MTC devices to a central MTC server or a set ofMTC servers, for exchanging data or control without humaninterference. This includes the mechanisms, algorithms, andthe technologies used to enable MTC communication. Whichinvolves connecting large number of devices or piece of soft-ware with the creation of the IoT. MTC developments aredriven by the unlimited potential of IoT everyday applica-tions, as a result from the connected objects to grow moreintelligent. These applications presented in the form of smartgrids, healthcare systems, smart cities, building automation,and many other. Such systems can be implemented throughthe use of WSN, within which the utilization of cooperatingdevices can achieve intelligent monitoring and management.
IoT presents a massive ecosystem of new elements, appli-cations, functions, and services. Existing transmits of MTCtraffic flows for IoT devices run over wireless WAN, 3G and4G networks. However, 5G is expected to become the mainplatform for meeting the requirements of IoT traffic demandin the very near future. EPS protocols and architectures wereaimed and enhanced to handle HTC traffic flows. With theanticipated mass deployment of MTDs, there are concernsfrom the network operators side, the service provider sideand from the application consumers perspective. The fear isthat the network ecosystem may become exhausted and/or theavailable network resources will not be able to meet AQoStraffic flow requirements for both HTC and MTC traffic flowssimultaneously. Moreover, MTC traffic characteristics of IoTdevices are different from those of HTC and can augment therisk of network performance deterioration.
Future networks will gradually be converted into integratedentities with high broadband and large-scale traffic due to theinterconnection of social medias, virtual systems, and physi-cal networks [1]. It is estimated that between 50 to 100 billionMTC devices will be connected to the Internet by 2020 [2], [3]and that the majority of these devices will be run through cel-lular wireless networks and WSNs. However, cellular networkswere mainly designed for H2H communication, where the ULresource allocation is less than the DL. In contrast, the M2Mtraffic could produce more data in the UL channels, which canlead to a deterioration of the human QoE or could overloadthe network. To overcome this challenge, an efficient resourceallocation model can be used to take full advantage of theopportunities created by a global MTC market over cellularnetworks. The 3GPP and the IEEE standardization bodies haveinitiated their working groups for facilitating such applicationsthrough various releases of their standards [4].
LTE-A is very close to reach the technologically possibleefficiency limits in the currently available bands, accordingto 3GPP, hence, it is expected that LTE will remain as thebaseline technology for wide area broadband coverage alsoin the 5G era. However, integrating M2M communicationwith LTE-A can have a dramatic negative impact on LTEnetwork performance in terms of QoS and throughput [5].Consequently, 3GPP will continue working on enhancing LTEto make it more suitable for M2M communication from a radioperspective as well as from a service delivery one and hence,mobile M2M traffic must not be neglected.
Costantino et al. [6] evaluated the performance of an LTEgateway using the CoAP, with the M2M traffic patterns and thenetwork configurations being presented through simulations.The authors argued that the traffic patterns highly dependingon the application used in the terminal devices, however, theydid not describe or justify their choices. Their work focused onthe effect of signals interference, in radio access node, relatedto the number of connected MTDs.
Lo et al. [7] studied the impact of data aggregation for M2Mon QoS in an LTE-A network. In their work, they utilized arelay node as an aggregation and entry point of MTD trafficto improve LTE-A UL efficiency. Specifically, their work wasbased on tunneling and aggregation of the MTDs, which wererelated to a specific destination server or node, via the relaynode tunnel entry point and by considering the priority of theclass of service. Whilst a significant reduction in signalingoverhead was achieved, there was an increase in the delay ofthe received packet at the destination point and an increase inthe number of aggregated MTDs at the entry point.
There have been several attempts at delivering M2M com-munication integration with LTE-A. The current state ofstandardization efforts in M2M communication and the poten-tial M2M problems, including physical layer transmissionswere discussed in [8], who proposed a solution to provideQoS guarantees by facilitating M2M applications with hardtiming constraints. Moreover, the features of M2M commu-nication in 3GPP, an overview of the network architecture,random access procedure (RAP), and radio resources alloca-tions were provided. Kang et al. [9] considered one serviceand proposed a cooperative strategy for energy efficient MTDvideo transmission with a good NQoS. They achieved promis-ing results, however, in the future, networks with differentservice and network components will be used in a het-erogeneous environment. A relay node was proposed byMarwat et al. [10] to facilitate the integration of M2M, withthe proposed work being focused on a relaying feature inLTE-A. Zhang et al. [11] examined the network convergencebetween MCNs and WSNs, proposing that the mobile termi-nals in MCN should act as both SNs and gateways for WSNin the converged networks. Their work neither guaranteed theE2E connectivity nor specified RANs technology involved.There has been no work, as yet, to the best of our knowl-edge, proposing an entirely heterogeneous model that servesdifferent networks with different services.
Another strand of research considered the radio accessinterface, including the new LPWANs, such as NB-IoT in thelicensed spectrum as well as its competitors LoRa, SigFox,
354 IEEE INTERNET OF THINGS JOURNAL, VOL. 5, NO. 1, FEBRUARY 2018
and Ingenu in the unlicensed spectrum [12]. The unlicensednetworks have been deployed around the world since the firstquarter of 2016, which motivated 3GPP to introduce NB-IoTin the second quarter of 2016. NB-IoT uses the guard bandsin the 3G and 4G licensed frequency spectrum bands to pro-vide a dedicated radio access for IoT devices within the radiospectrum of the currently deployed 3G and 4G RANs [13].In the same context, the authors in [14]–[16] presented aconnection-less integration of low rate IoT traffic within thePRACH frequency-time slot of LTE access technology. Thepreviously listed technologies and research attempts did notaddress the effect of the heterogeneity of MTC applicationtraffic and related QoS performance of HTC application whenthe network ecosystem resources have to be shared in such away. This paper’s main contributions are as follows.
1) Proposing an access WSN gateway to provide accessand connectivity for MTD traffic within an LTE-AProeNB license spectrum radio interface.
2) Proposing a traffic flow management policy to define theexistence of IoT traffic with H2H traffic over an EPSnetwork and provide an acceptable level of NQoS forMTC traffic flows, whilst preserving the QoE of HTCs.
3) Introducing specific QCIs, which are elected to classifythe MTC traffic flows, whilst taking into account theheterogeneity of SNs services and applications, over anEPS network, in order to discriminate the treatment ofEPS from the NQoS point of view from the standardQCIs of HTC traffic flows.
The rest of this paper is organized as follows: the nextsection presents a background to MTC traffic characteris-tics and QoS in EPS provision and management. Section IIIpresents the design of the proposed traffic flow managementmodel. Section IV introduces the simulation setup and presentsthe main results. A performance discussion is presented inSection V. Finally, Section VI concludes this paper and alsoputs forward suggestions for future work.
II. BACKGROUND
A. MTC Traffic Characteristics
MTC terminals or SN can communicate with one or manyservers and their traffic characteristics have been discussedin detail in [17]. They can be considered as data cen-tric communication for sending constant size packets towardserver [18], [19]. Their traffic main characteristics are asfollows.
1) SDF of MTC traffic is typically from the SN towardPDN, which will be more dominant in the UL direction.Whereas HTC’s SDF traffic depends on the service typeand its AQoS demands during the call session or servicerequest.
2) In much of MTC applications traffic, the SN harvestsa small amount of information. This can be transferredat a specific data rate, which matches the applicationsneeds.
3) In the NGN, the MTC traffic has a share of the networkresources and they will be not limited just for HTC. TheMTC are going to join the use of licensed spectrum and
take a share of the mobile broadband network accessresources.
4) In general, MTC traffic is delay tolerant and for themost part, it can be considered as having low priority.3GPP in release 10 introduces delay tolerant access inthe RAP as part of control plane signaling to provide alower priority in the PRACH for MTC traffic than HTCTraffic [16]. However, some MTC traffic is excludedfrom using this procedure, such as industrial controlsystems, fire alarms, and live monitoring, as they areneed to be transmitted with high priority. LTE-A release13 introduces new QCI to provide a high priority SDFfor emergency service application use cases [20], [21].
5) SN data transmission is irregular and depends on manyfactors, which relate to the WSN type and deploymentpattern. This irregularity in traffic generation can pro-duce high traffic peaks, which could lead to starvation inthe network resources, specifically in the wireless accesspart.
The basic concern in MTC within the NGN is how to pro-vide the required NQoS levels or KPIs, which will meet theAQoS of MTC traffic or KQIs, with a massive deployment ofSNs, while guaranteeing high levels of expected and perceivedquality or QoE of real time application users, simultaneously.
In order to integrate the IoT traffic in the LTE-A standardEPS resources need to be used. Consequently, it is necessaryto provide a specific NQoS for MTCs applications traffic soas to avoid the substantial impact on the performance of HTCtraffic, such as voice, video, and file transfer and to keep theQoE at a satisfaction level.
B. QoS in EPS Provision and Management
Applications traffic, including that of HTC and MTC inPS networks has specific AQoS characteristics and demands.They require specific levels of NQoS parameters, which canbe described in terms of PLR packet one-way E2E delay,packet jitter at the end point, and link throughput at the IPlayer [22], [23]. Packet jitter refers to the variation in the timechange between two consecutive packets leaving the sourcenode with time stamps t1 and t2; they are played back at thedestination node at t3 and t4, with the jitter being calculatedas [24]
Jitter = (t4 − t3) − (t2 − t1). (1)
In EPS, these diverse NQoS quantitative performanceparameters are provisioned via a standardized and effectivemechanism, which is a class-based EPS QoS concept [25].This mechanism allows service providers to deliver servicedifferentiation via NQoS control in the access and backhaulnetworks, thereby solving the issue of over-provisioning of thevaluable network resources.
NQoS control mechanism-based service differentiation isperformed on the EPS bearer level, with this bearer being alogical unidirectional connection between PDN-GW and UEas well as it being the core element of NQoS control treatmentin EPS. The EPS bearer type and level define the SDFs QoSrequirements among all the EPS nodes. EPS introduces two
AL-SHAMMARI et al.: IoT TRAFFIC MANAGEMENT AND INTEGRATION IN QoS SUPPORTED NETWORK 355
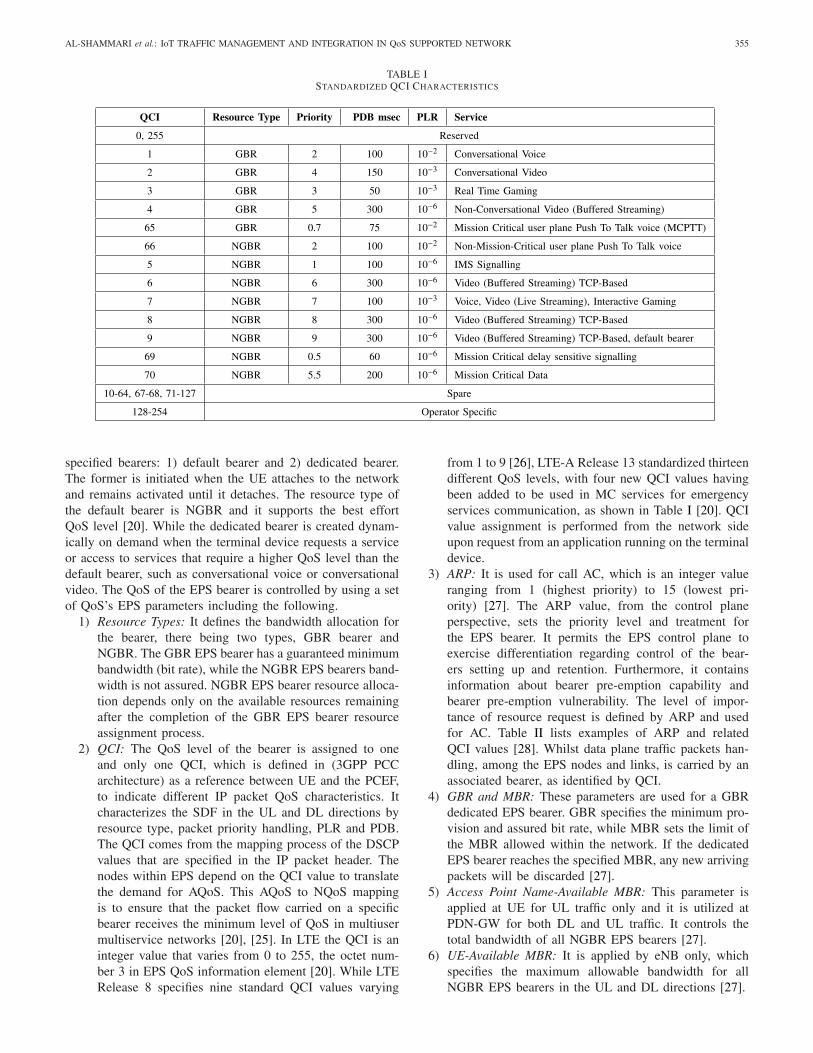
TABLE ISTANDARDIZED QCI CHARACTERISTICS
specified bearers: 1) default bearer and 2) dedicated bearer.The former is initiated when the UE attaches to the networkand remains activated until it detaches. The resource type ofthe default bearer is NGBR and it supports the best effortQoS level [20]. While the dedicated bearer is created dynam-ically on demand when the terminal device requests a serviceor access to services that require a higher QoS level than thedefault bearer, such as conversational voice or conversationalvideo. The QoS of the EPS bearer is controlled by using a setof QoS’s EPS parameters including the following.
1) Resource Types: It defines the bandwidth allocation forthe bearer, there being two types, GBR bearer andNGBR. The GBR EPS bearer has a guaranteed minimumbandwidth (bit rate), while the NGBR EPS bearers band-width is not assured. NGBR EPS bearer resource alloca-tion depends only on the available resources remainingafter the completion of the GBR EPS bearer resourceassignment process.
2) QCI: The QoS level of the bearer is assigned to oneand only one QCI, which is defined in (3GPP PCCarchitecture) as a reference between UE and the PCEF,to indicate different IP packet QoS characteristics. Itcharacterizes the SDF in the UL and DL directions byresource type, packet priority handling, PLR and PDB.The QCI comes from the mapping process of the DSCPvalues that are specified in the IP packet header. Thenodes within EPS depend on the QCI value to translatethe demand for AQoS. This AQoS to NQoS mappingis to ensure that the packet flow carried on a specificbearer receives the minimum level of QoS in multiusermultiservice networks [20], [25]. In LTE the QCI is aninteger value that varies from 0 to 255, the octet num-ber 3 in EPS QoS information element [20]. While LTERelease 8 specifies nine standard QCI values varying
from 1 to 9 [26], LTE-A Release 13 standardized thirteendifferent QoS levels, with four new QCI values havingbeen added to be used in MC services for emergencyservices communication, as shown in Table I [20]. QCIvalue assignment is performed from the network sideupon request from an application running on the terminaldevice.
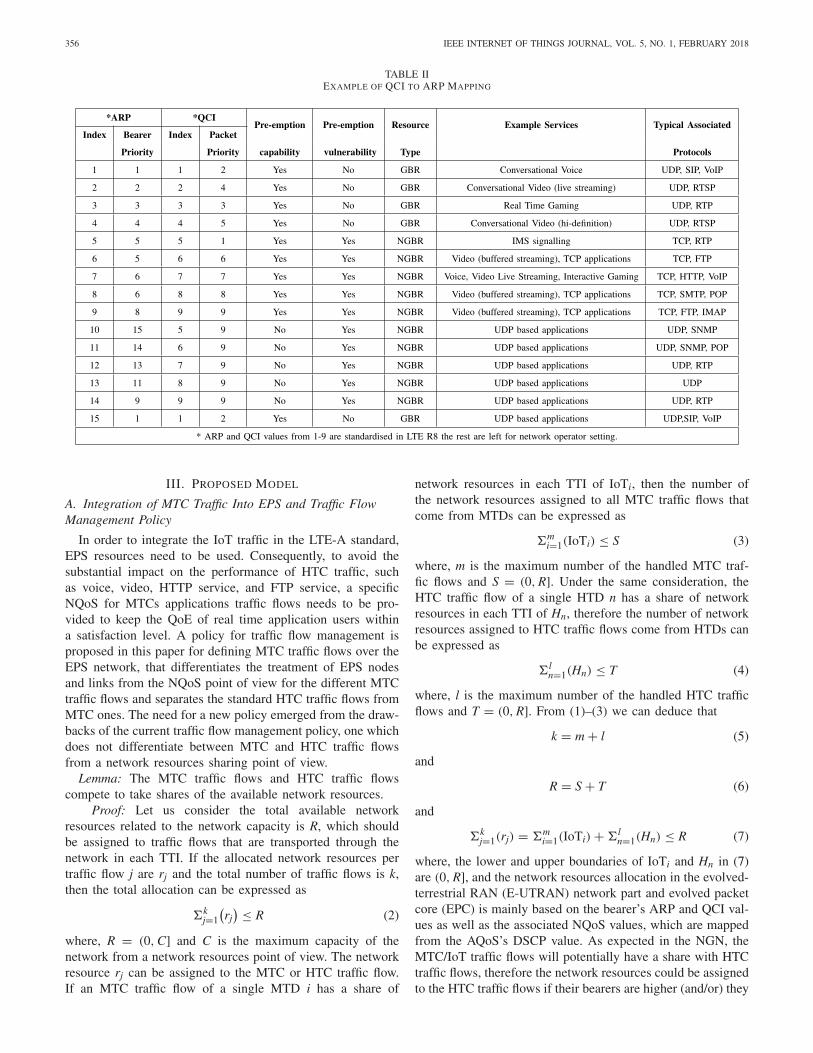
3) ARP: It is used for call AC, which is an integer valueranging from 1 (highest priority) to 15 (lowest pri-ority) [27]. The ARP value, from the control planeperspective, sets the priority level and treatment forthe EPS bearer. It permits the EPS control plane toexercise differentiation regarding control of the bear-ers setting up and retention. Furthermore, it containsinformation about bearer pre-emption capability andbearer pre-emption vulnerability. The level of impor-tance of resource request is defined by ARP and usedfor AC. Table II lists examples of ARP and relatedQCI values [28]. Whilst data plane traffic packets han-dling, among the EPS nodes and links, is carried by anassociated bearer, as identified by QCI.
4) GBR and MBR: These parameters are used for a GBRdedicated EPS bearer. GBR specifies the minimum pro-vision and assured bit rate, while MBR sets the limit ofthe MBR allowed within the network. If the dedicatedEPS bearer reaches the specified MBR, any new arrivingpackets will be discarded [27].
5) Access Point Name-Available MBR: This parameter isapplied at UE for UL traffic only and it is utilized atPDN-GW for both DL and UL traffic. It controls thetotal bandwidth of all NGBR EPS bearers [27].
6) UE-Available MBR: It is applied by eNB only, whichspecifies the maximum allowable bandwidth for allNGBR EPS bearers in the UL and DL directions [27].
356 IEEE INTERNET OF THINGS JOURNAL, VOL. 5, NO. 1, FEBRUARY 2018
TABLE IIEXAMPLE OF QCI TO ARP MAPPING
III. PROPOSED MODEL
A. Integration of MTC Traffic Into EPS and Traffic FlowManagement Policy
In order to integrate the IoT traffic in the LTE-A standard,EPS resources need to be used. Consequently, to avoid thesubstantial impact on the performance of HTC traffic, suchas voice, video, HTTP service, and FTP service, a specificNQoS for MTCs applications traffic flows needs to be pro-vided to keep the QoE of real time application users withina satisfaction level. A policy for traffic flow management isproposed in this paper for defining MTC traffic flows over theEPS network, that differentiates the treatment of EPS nodesand links from the NQoS point of view for the different MTCtraffic flows and separates the standard HTC traffic flows fromMTC ones. The need for a new policy emerged from the draw-backs of the current traffic flow management policy, one whichdoes not differentiate between MTC and HTC traffic flowsfrom a network resources sharing point of view.
Lemma: The MTC traffic flows and HTC traffic flowscompete to take shares of the available network resources.
Proof: Let us consider the total available networkresources related to the network capacity is R, which shouldbe assigned to traffic flows that are transported through thenetwork in each TTI. If the allocated network resources pertraffic flow j are rj and the total number of traffic flows is k,then the total allocation can be expressed as
�kj=1
(rj) ≤ R (2)
where, R = (0, C] and C is the maximum capacity of thenetwork from a network resources point of view. The networkresource rj can be assigned to the MTC or HTC traffic flow.If an MTC traffic flow of a single MTD i has a share of
network resources in each TTI of IoTi, then the number ofthe network resources assigned to all MTC traffic flows thatcome from MTDs can be expressed as
�mi=1(IoTi) ≤ S (3)
where, m is the maximum number of the handled MTC traf-fic flows and S = (0, R]. Under the same consideration, theHTC traffic flow of a single HTD n has a share of networkresources in each TTI of Hn, therefore the number of networkresources assigned to HTC traffic flows come from HTDs canbe expressed as
�ln=1(Hn) ≤ T (4)
where, l is the maximum number of the handled HTC trafficflows and T = (0, R]. From (1)–(3) we can deduce that
k = m + l (5)
and
R = S + T (6)
and
�kj=1(rj) = �m
i=1(IoTi) + �ln=1(Hn) ≤ R (7)
where, the lower and upper boundaries of IoTi and Hn in (7)are (0, R], and the network resources allocation in the evolved-terrestrial RAN (E-UTRAN) network part and evolved packetcore (EPC) is mainly based on the bearer’s ARP and QCI val-ues as well as the associated NQoS values, which are mappedfrom the AQoS’s DSCP value. As expected in the NGN, theMTC/IoT traffic flows will potentially have a share with HTCtraffic flows, therefore the network resources could be assignedto the HTC traffic flows if their bearers are higher (and/or) they
AL-SHAMMARI et al.: IoT TRAFFIC MANAGEMENT AND INTEGRATION IN QoS SUPPORTED NETWORK 357
have network supported ARPs and QCIs comparative to MTCtraffic flows bearers, and vice versa. If the MTCs’ traffic flowbearers get a resource allocation higher than those of HTC,without determining the management of network resourcessharing among them, this will produce some serious issuesregarding the offered NQoS and users’ QoE. This deterio-ration in network performance will be clear in NGBR HTCapplications, such as FTP and HTTP services.
A proposed solution for the issue of NQoS deteriorationis presented here by isolating the available network resources(R), which takes the form of adaptive shared (R) networkresources between the MTC network resources share (S) andHTC network resources share (T ), by means of two disjointsets. The size of the two shares (S and T ) is a percentageof available (R), which can be adaptively adjusted based ona dynamic change in the network resources loading share,according to traffic flows conditions. Furthermore, the percent-age can be customarily set on a static basis for supporting HTCtraffic flows over MTC traffic flows and to reduce the impact ofincreased network signaling overhead between the E-UTRANnetwork part and EPC. Therefore, (6) can be rewritten as
R = S + T (8)
S = βR (9)
T = αR (10)
β + α = 1 (11)
where, α is the percentage of network resources share allo-cated/assigned to the HTC traffic flows and the remainingnetwork resources percentage is β. For adaptive and dynamicoperation, α and β are set as a function of AQoS demands toensure the provision of NQoS in terms of network resourcesfor all traffic flows in the network nodes and transmissionlinks. The EPS system primarily depends on the bearers set-tings to provide the required NQoS metrics and to cover theneeds of AQoS represented by the Terminal Type and DSCP.From 11, α’s and/or β’s can be used as tuning parametersto provide the required percentage value of network resourcesshare, which are the bearer’s setting, binding and modificationparameters. In the CN and precisely in the policy and chargingrule function (PCRF), PCEF, and mobility management entityfunctions units, these parameters as NQoS are Resource Type,ARP, QCI, PDB, and PLR. Then, it is possible to demonstrateα and β as a function of AQoS and/or NQoS. Furthermore,they can be a function of the aforementioned AQoS needs andNQoS provided (from network side) to cover/meet the requiredperformance and to optimize network resources utilization as
α&β = f (AQoS, NQoS)
= f (TerminalType, DSCP, ResourceType, ARP, QCI
PDB, PLR) (12)
where, (TerminalType, DSCP) represent the AQoS require-ments and (ResourceType, ARP, QCI, PDB, PLR) representthe NQoS offered.
The dynamic variations of α and β in every TTI can bedeployed in EPC individually to set traffic policy manage-ment into a flavor of terminal device type user (human or
TABLE IIIPROPOSED ESTIMATED VALUES OF α, β AND ASSOCIATED
NETWORK RESOURCES SHARE
machine) and the required network resources for the needs ofthe users’ traffic flows, according to (9) and (10). Traffic man-agement policy is realized via an active PCC rule setting or canbe applied according to the local policy configuration in thenetwork gateways or from the PCRF network core elements.
The aforementioned PCC rule setting is presented as anadaptive algorithm conferring to the network traffic flows.Another methodology can be interpreted from the previousanalysis, for the setting of control mechanism of traffic flowmanagement policy. It consists of two components representedby α and β. Each one can work with a distinct approachregarding the network resources allocation, separately withinits allowable limit, such as optimization and scheduling ofnetwork resources usage over different parts of the network.This approach sets a traffic flow management policy by defin-ing a fixed network resource share between HTC and MTCtraffic flows. Equation (12) can be rewritten to extract and setthe related AQoS and NQoS metrics as follows:
f −1(α) = (HTCTerminal, DSCP, ARP, QCI, PDB, PLR)
(13)
f −1(β) = (MTCTerminal, DSCP, ARP, QCI, PDB, PLR).
(14)
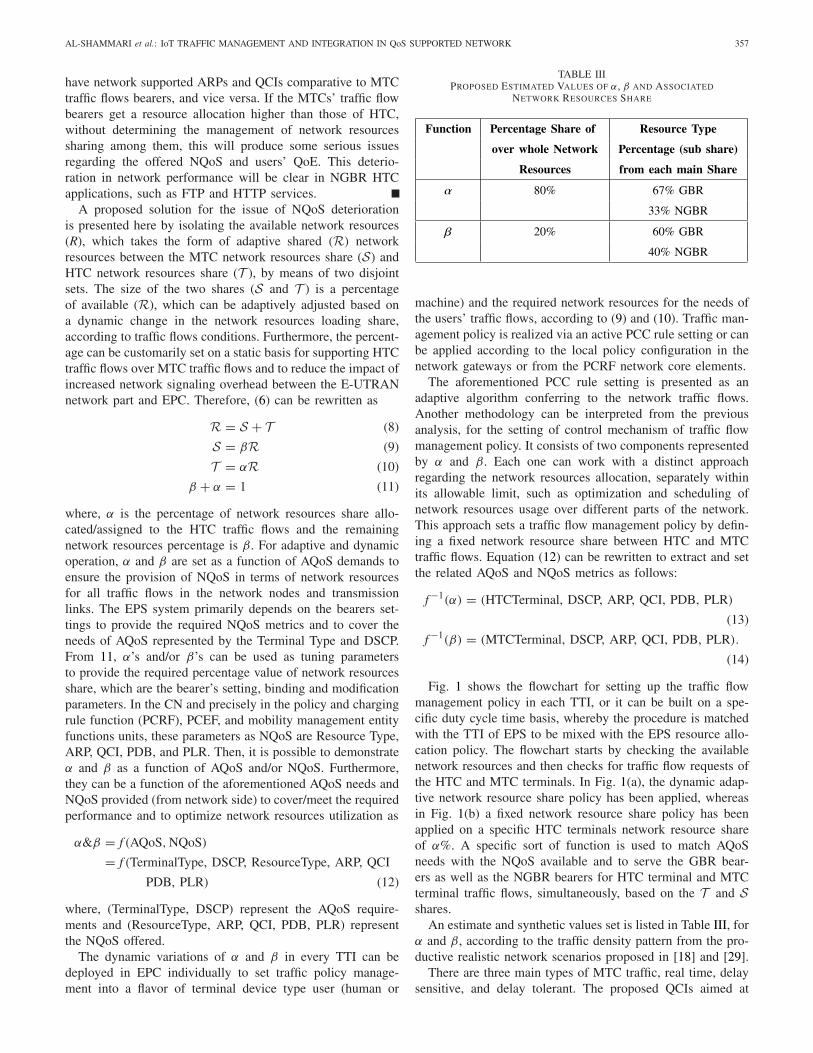
Fig. 1 shows the flowchart for setting up the traffic flowmanagement policy in each TTI, or it can be built on a spe-cific duty cycle time basis, whereby the procedure is matchedwith the TTI of EPS to be mixed with the EPS resource allo-cation policy. The flowchart starts by checking the availablenetwork resources and then checks for traffic flow requests ofthe HTC and MTC terminals. In Fig. 1(a), the dynamic adap-tive network resource share policy has been applied, whereasin Fig. 1(b) a fixed network resource share policy has beenapplied on a specific HTC terminals network resource shareof α%. A specific sort of function is used to match AQoSneeds with the NQoS available and to serve the GBR bear-ers as well as the NGBR bearers for HTC terminal and MTCterminal traffic flows, simultaneously, based on the T and Sshares.
An estimate and synthetic values set is listed in Table III, forα and β, according to the traffic density pattern from the pro-ductive realistic network scenarios proposed in [18] and [29].
There are three main types of MTC traffic, real time, delaysensitive, and delay tolerant. The proposed QCIs aimed at
358 IEEE INTERNET OF THINGS JOURNAL, VOL. 5, NO. 1, FEBRUARY 2018
(a) (b)
Fig. 1. Traffic flow management policy setting. (a) Dynamic network resources share policy. (b) Fixed network resources share policy.
TABLE IVPROPOSED MTC QCIS
these three types, as a base line in this paper, could be extendedto provide precise differentiation if needed. The index valuesof the new QCIs are 71, 72, and 73, which are shown inTable IV and chosen from the spare QCI values.
In Table IV, the GBR resource type has been specified to thereal time and delay sensitive MTC traffic, the NGBR resourcetype has been specified to the delay tolerant MTC traffic, thepriority setting is related to the MTC traffic, in order to pro-vide seamlessly integration manner with the standard QCIsassigned priority values. PDB and PLR are specified to fulfilthe minimum NQoS required to provide acceptable levels toAQoS needs for MTC traffic.
B. Proposed Network Architecture
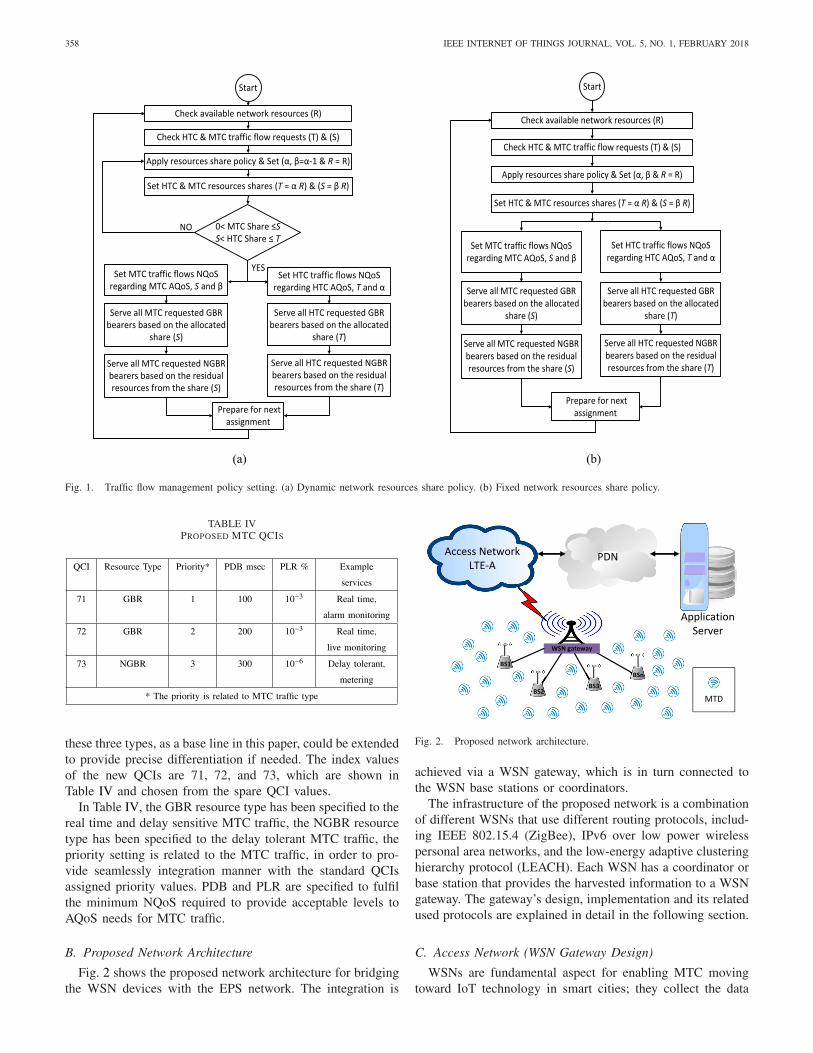
Fig. 2 shows the proposed network architecture for bridgingthe WSN devices with the EPS network. The integration is
Fig. 2. Proposed network architecture.
achieved via a WSN gateway, which is in turn connected tothe WSN base stations or coordinators.
The infrastructure of the proposed network is a combinationof different WSNs that use different routing protocols, includ-ing IEEE 802.15.4 (ZigBee), IPv6 over low power wirelesspersonal area networks, and the low-energy adaptive clusteringhierarchy protocol (LEACH). Each WSN has a coordinator orbase station that provides the harvested information to a WSNgateway. The gateway’s design, implementation and its relatedused protocols are explained in detail in the following section.
C. Access Network (WSN Gateway Design)
WSNs are fundamental aspect for enabling MTC movingtoward IoT technology in smart cities; they collect the data
AL-SHAMMARI et al.: IoT TRAFFIC MANAGEMENT AND INTEGRATION IN QoS SUPPORTED NETWORK 359
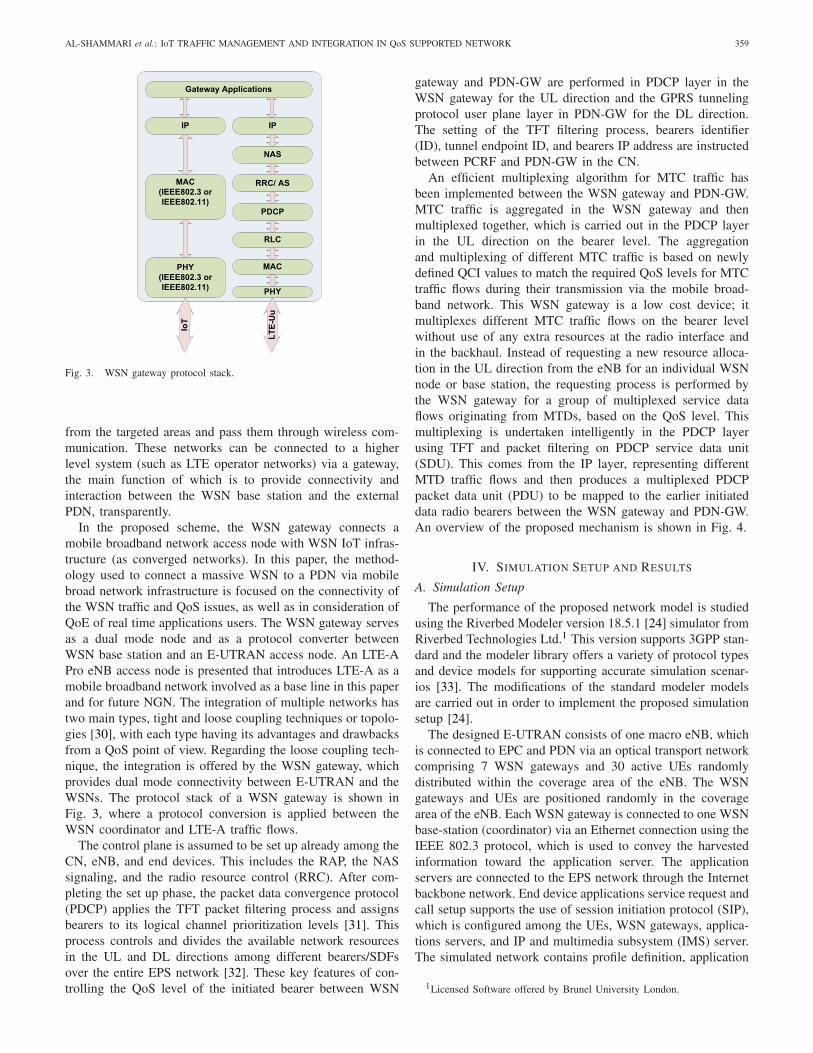
Fig. 3. WSN gateway protocol stack.
from the targeted areas and pass them through wireless com-munication. These networks can be connected to a higherlevel system (such as LTE operator networks) via a gateway,the main function of which is to provide connectivity andinteraction between the WSN base station and the externalPDN, transparently.
In the proposed scheme, the WSN gateway connects amobile broadband network access node with WSN IoT infras-tructure (as converged networks). In this paper, the method-ology used to connect a massive WSN to a PDN via mobilebroad network infrastructure is focused on the connectivity ofthe WSN traffic and QoS issues, as well as in consideration ofQoE of real time applications users. The WSN gateway servesas a dual mode node and as a protocol converter betweenWSN base station and an E-UTRAN access node. An LTE-APro eNB access node is presented that introduces LTE-A as amobile broadband network involved as a base line in this paperand for future NGN. The integration of multiple networks hastwo main types, tight and loose coupling techniques or topolo-gies [30], with each type having its advantages and drawbacksfrom a QoS point of view. Regarding the loose coupling tech-nique, the integration is offered by the WSN gateway, whichprovides dual mode connectivity between E-UTRAN and theWSNs. The protocol stack of a WSN gateway is shown inFig. 3, where a protocol conversion is applied between theWSN coordinator and LTE-A traffic flows.
The control plane is assumed to be set up already among theCN, eNB, and end devices. This includes the RAP, the NASsignaling, and the radio resource control (RRC). After com-pleting the set up phase, the packet data convergence protocol(PDCP) applies the TFT packet filtering process and assignsbearers to its logical channel prioritization levels [31]. Thisprocess controls and divides the available network resourcesin the UL and DL directions among different bearers/SDFsover the entire EPS network [32]. These key features of con-trolling the QoS level of the initiated bearer between WSN
gateway and PDN-GW are performed in PDCP layer in theWSN gateway for the UL direction and the GPRS tunnelingprotocol user plane layer in PDN-GW for the DL direction.The setting of the TFT filtering process, bearers identifier(ID), tunnel endpoint ID, and bearers IP address are instructedbetween PCRF and PDN-GW in the CN.
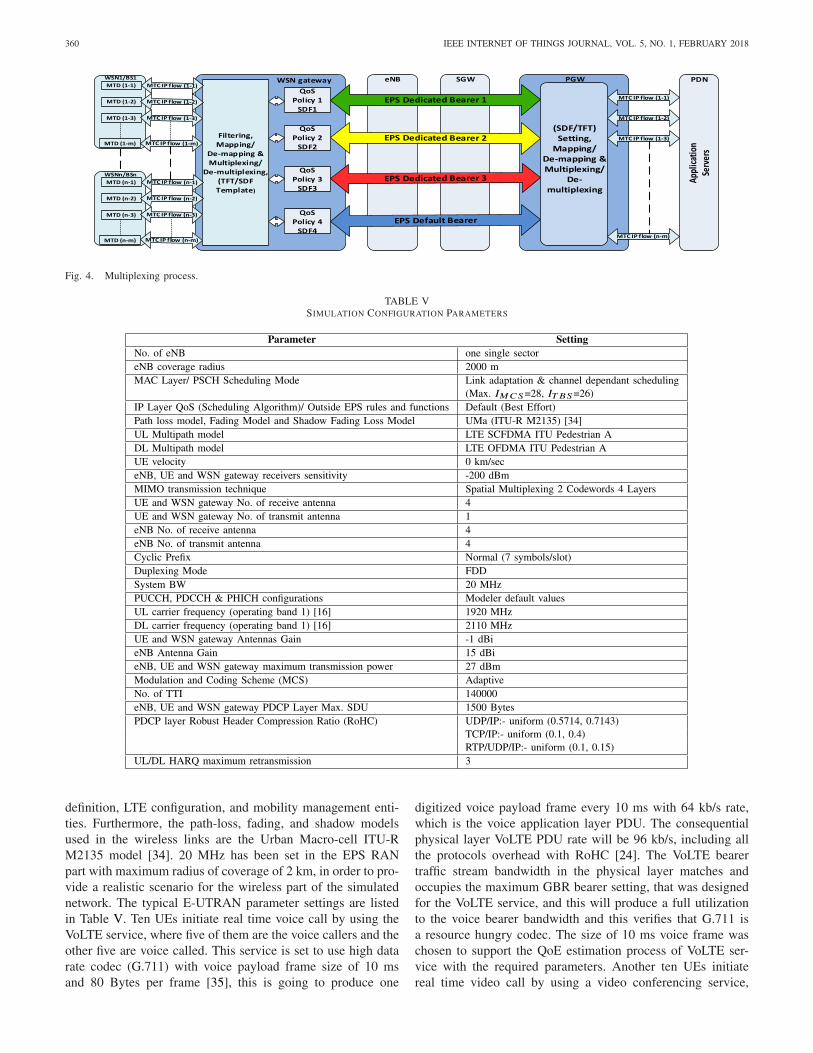
An efficient multiplexing algorithm for MTC traffic hasbeen implemented between the WSN gateway and PDN-GW.MTC traffic is aggregated in the WSN gateway and thenmultiplexed together, which is carried out in the PDCP layerin the UL direction on the bearer level. The aggregationand multiplexing of different MTC traffic is based on newlydefined QCI values to match the required QoS levels for MTCtraffic flows during their transmission via the mobile broad-band network. This WSN gateway is a low cost device; itmultiplexes different MTC traffic flows on the bearer levelwithout use of any extra resources at the radio interface andin the backhaul. Instead of requesting a new resource alloca-tion in the UL direction from the eNB for an individual WSNnode or base station, the requesting process is performed bythe WSN gateway for a group of multiplexed service dataflows originating from MTDs, based on the QoS level. Thismultiplexing is undertaken intelligently in the PDCP layerusing TFT and packet filtering on PDCP service data unit(SDU). This comes from the IP layer, representing differentMTD traffic flows and then produces a multiplexed PDCPpacket data unit (PDU) to be mapped to the earlier initiateddata radio bearers between the WSN gateway and PDN-GW.An overview of the proposed mechanism is shown in Fig. 4.
IV. SIMULATION SETUP AND RESULTS
A. Simulation Setup
The performance of the proposed network model is studiedusing the Riverbed Modeler version 18.5.1 [24] simulator fromRiverbed Technologies Ltd.1 This version supports 3GPP stan-dard and the modeler library offers a variety of protocol typesand device models for supporting accurate simulation scenar-ios [33]. The modifications of the standard modeler modelsare carried out in order to implement the proposed simulationsetup [24].
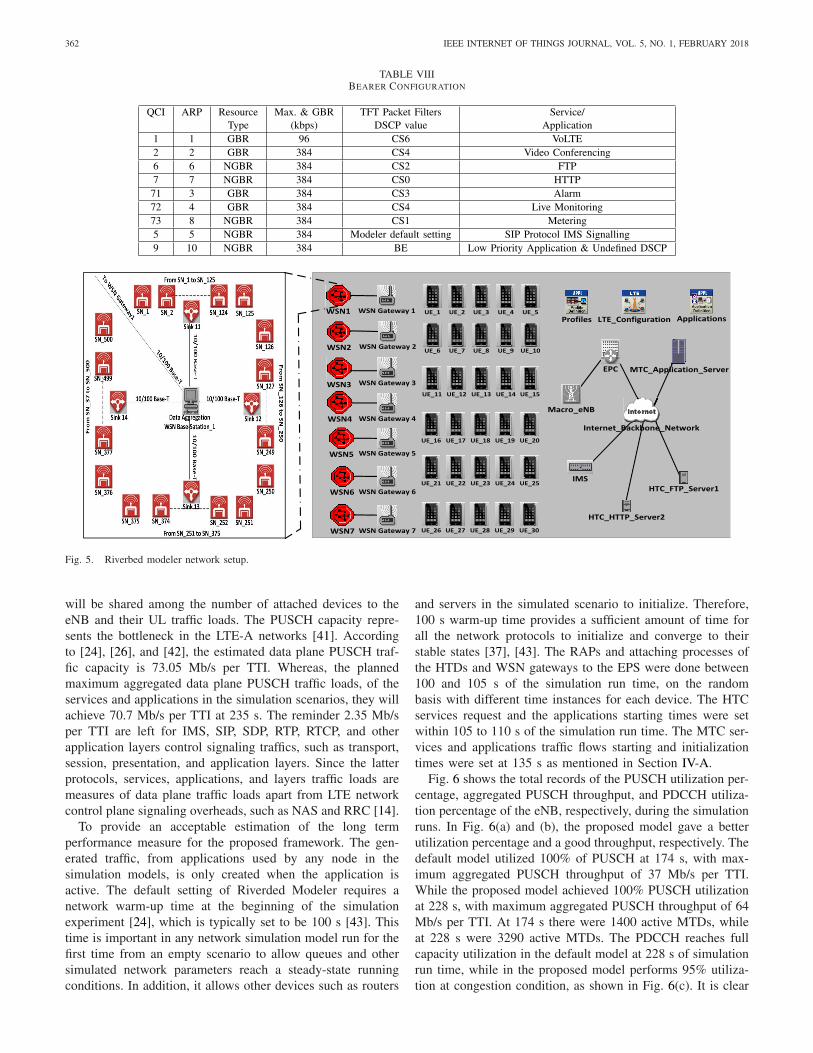
The designed E-UTRAN consists of one macro eNB, whichis connected to EPC and PDN via an optical transport networkcomprising 7 WSN gateways and 30 active UEs randomlydistributed within the coverage area of the eNB. The WSNgateways and UEs are positioned randomly in the coveragearea of the eNB. Each WSN gateway is connected to one WSNbase-station (coordinator) via an Ethernet connection using theIEEE 802.3 protocol, which is used to convey the harvestedinformation toward the application server. The applicationservers are connected to the EPS network through the Internetbackbone network. End device applications service request andcall setup supports the use of session initiation protocol (SIP),which is configured among the UEs, WSN gateways, applica-tions servers, and IP and multimedia subsystem (IMS) server.The simulated network contains profile definition, application
1Licensed Software offered by Brunel University London.
360 IEEE INTERNET OF THINGS JOURNAL, VOL. 5, NO. 1, FEBRUARY 2018
Fig. 4. Multiplexing process.
TABLE VSIMULATION CONFIGURATION PARAMETERS
definition, LTE configuration, and mobility management enti-ties. Furthermore, the path-loss, fading, and shadow modelsused in the wireless links are the Urban Macro-cell ITU-RM2135 model [34]. 20 MHz has been set in the EPS RANpart with maximum radius of coverage of 2 km, in order to pro-vide a realistic scenario for the wireless part of the simulatednetwork. The typical E-UTRAN parameter settings are listedin Table V. Ten UEs initiate real time voice call by using theVoLTE service, where five of them are the voice callers and theother five are voice called. This service is set to use high datarate codec (G.711) with voice payload frame size of 10 msand 80 Bytes per frame [35], this is going to produce one
digitized voice payload frame every 10 ms with 64 kb/s rate,which is the voice application layer PDU. The consequentialphysical layer VoLTE PDU rate will be 96 kb/s, including allthe protocols overhead with RoHC [24]. The VoLTE bearertraffic stream bandwidth in the physical layer matches andoccupies the maximum GBR bearer setting, that was designedfor the VoLTE service, and this will produce a full utilizationto the voice bearer bandwidth and this verifies that G.711 isa resource hungry codec. The size of 10 ms voice frame waschosen to support the QoE estimation process of VoLTE ser-vice with the required parameters. Another ten UEs initiatereal time video call by using a video conferencing service,
AL-SHAMMARI et al.: IoT TRAFFIC MANAGEMENT AND INTEGRATION IN QoS SUPPORTED NETWORK 361
TABLE VIH2H SERVICE AND APPLICATION CHARACTERISTICS
TABLE VIIMTD’S TRAFFIC CHARACTERISTICS
where five of them are the callers and the rest are called.Regarding the remaining ten UEs, 5 uses the FTP applicationto communicate with remote server 1 and the other five utilizesthe HTTP application to communicate with remote server 2.The H2H services and application characteristics are listed inTable VI.
The seven WSN gateways receive traffic generated from theMTDs, which is routed via the WSN coordinators. Each MTDis programmed to generate its traffic as a time based eventactivation. The rate of activation of the MTDs at each WSNplatform is 5 MTD per second in an accumulating fashion,starting at 135 s and continuing until the end of the simu-lation. By the end of the simulation, each base station andWSN gateway will have received and routed the traffic of 500MTDs. The metering MTDs have an 80% share of the gener-ated traffic, while alarm and live monitoring MTDs have 10%for each of them. The MTDs generated traffic is proposedas being created from one of following WSN protocols: con-stant bit rate routing protocol, LEACH or ZigBee, and theMTDs traffic characteristics are listed in Table VII, which arerelated to MTDs traffic settings in [36]. Moreover, the bearerconfiguration settings in the Riverbed modeler are listed inTable VIII.
Two identical and separated simulation scenarios were buildin a single Riverbed modeler project in order to facilitate thescenarios run sequencing process as well as the comparisonsprocedures of the measurements. The first one was pertainedto considering MTC traffic as a best effort traffic flow, whereasthe second was about using the proposed policy for traffic flowmanagement. Each scenario was run for 30 times sequentiallywith randomly chosen seeds [37], [38], since producing datafrom a single execution cannot give a correct picture of the
performance of the framework [39]. Furthermore, these sce-narios run replications were set with multiseed value settingsof the random number initializer, in order to get an outcomewith a confidence interval of 95% as an estimated validityof the results, which is the resultant from above mentionedreplications count [24], [37], [39]. Specifically, this approachis designed in Riverbed Modeler software to support confi-dence estimation for scalar data reporting [24], [40], which iscollected in multiseed parametric runs. The confidence intervalmarker is not shown in the results figures, in order to emphasisand highlights the assessment concerning the aforementionedtwo scenarios. The designed baseline EPS network model isshown in Fig. 5.
B. Simulation Results
Two Riverbed Modeler simulation scenarios with theproposed WSN gateway have been conducted in order to eval-uate and validate the performance of the suggested system.For both scenarios, the simulation run time was set at 240 s.This time was specified to match the estimated traffic capac-ity of the PUSCH, with respect to the number of the attacheddevices and their aggregated UL traffic loads rates at theeNB. Furthermore, to inspect how the conducted simulationof proposed traffic management policy on the bearers levelprovoked at the physical layer level. In this regard PUSCHutilization and throughput, once the bearers are starting thecompetition when there is a scarcity in the network resources.UL capacity mainly depends on the proposed physical layerstructure parameters, PUCCH and random access configura-tions as shown in Table V of eNB, UEs, and WSN gateways.When the UL traffic loads reach the estimated UL capacity, it
362 IEEE INTERNET OF THINGS JOURNAL, VOL. 5, NO. 1, FEBRUARY 2018
TABLE VIIIBEARER CONFIGURATION
Fig. 5. Riverbed modeler network setup.
will be shared among the number of attached devices to theeNB and their UL traffic loads. The PUSCH capacity repre-sents the bottleneck in the LTE-A networks [41]. Accordingto [24], [26], and [42], the estimated data plane PUSCH traf-fic capacity is 73.05 Mb/s per TTI. Whereas, the plannedmaximum aggregated data plane PUSCH traffic loads, of theservices and applications in the simulation scenarios, they willachieve 70.7 Mb/s per TTI at 235 s. The reminder 2.35 Mb/sper TTI are left for IMS, SIP, SDP, RTP, RTCP, and otherapplication layers control signaling traffics, such as transport,session, presentation, and application layers. Since the latterprotocols, services, applications, and layers traffic loads aremeasures of data plane traffic loads apart from LTE networkcontrol plane signaling overheads, such as NAS and RRC [14].
To provide an acceptable estimation of the long termperformance measure for the proposed framework. The gen-erated traffic, from applications used by any node in thesimulation models, is only created when the application isactive. The default setting of Riverded Modeler requires anetwork warm-up time at the beginning of the simulationexperiment [24], which is typically set to be 100 s [43]. Thistime is important in any network simulation model run for thefirst time from an empty scenario to allow queues and othersimulated network parameters reach a steady-state runningconditions. In addition, it allows other devices such as routers
and servers in the simulated scenario to initialize. Therefore,100 s warm-up time provides a sufficient amount of time forall the network protocols to initialize and converge to theirstable states [37], [43]. The RAPs and attaching processes ofthe HTDs and WSN gateways to the EPS were done between100 and 105 s of the simulation run time, on the randombasis with different time instances for each device. The HTCservices request and the applications starting times were setwithin 105 to 110 s of the simulation run time. The MTC ser-vices and applications traffic flows starting and initializationtimes were set at 135 s as mentioned in Section IV-A.
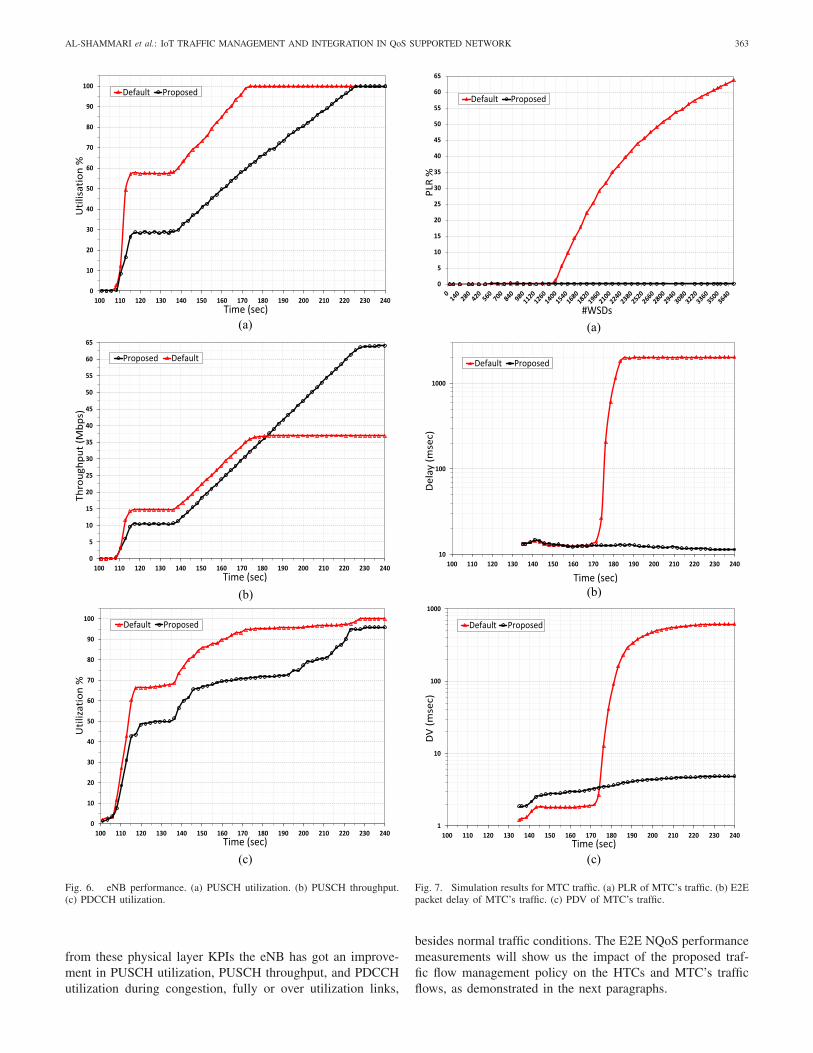
Fig. 6 shows the total records of the PUSCH utilization per-centage, aggregated PUSCH throughput, and PDCCH utiliza-tion percentage of the eNB, respectively, during the simulationruns. In Fig. 6(a) and (b), the proposed model gave a betterutilization percentage and a good throughput, respectively. Thedefault model utilized 100% of PUSCH at 174 s, with max-imum aggregated PUSCH throughput of 37 Mb/s per TTI.While the proposed model achieved 100% PUSCH utilizationat 228 s, with maximum aggregated PUSCH throughput of 64Mb/s per TTI. At 174 s there were 1400 active MTDs, whileat 228 s were 3290 active MTDs. The PDCCH reaches fullcapacity utilization in the default model at 228 s of simulationrun time, while in the proposed model performs 95% utiliza-tion at congestion condition, as shown in Fig. 6(c). It is clear
AL-SHAMMARI et al.: IoT TRAFFIC MANAGEMENT AND INTEGRATION IN QoS SUPPORTED NETWORK 363
(c)
(b)
(a)
Fig. 6. eNB performance. (a) PUSCH utilization. (b) PUSCH throughput.(c) PDCCH utilization.
from these physical layer KPIs the eNB has got an improve-ment in PUSCH utilization, PUSCH throughput, and PDCCHutilization during congestion, fully or over utilization links,
(c)
(b)
(a)
Fig. 7. Simulation results for MTC traffic. (a) PLR of MTC’s traffic. (b) E2Epacket delay of MTC’s traffic. (c) PDV of MTC’s traffic.
besides normal traffic conditions. The E2E NQoS performancemeasurements will show us the impact of the proposed traf-fic flow management policy on the HTCs and MTC’s trafficflows, as demonstrated in the next paragraphs.
364 IEEE INTERNET OF THINGS JOURNAL, VOL. 5, NO. 1, FEBRUARY 2018
(a) (b)
(c) (d)
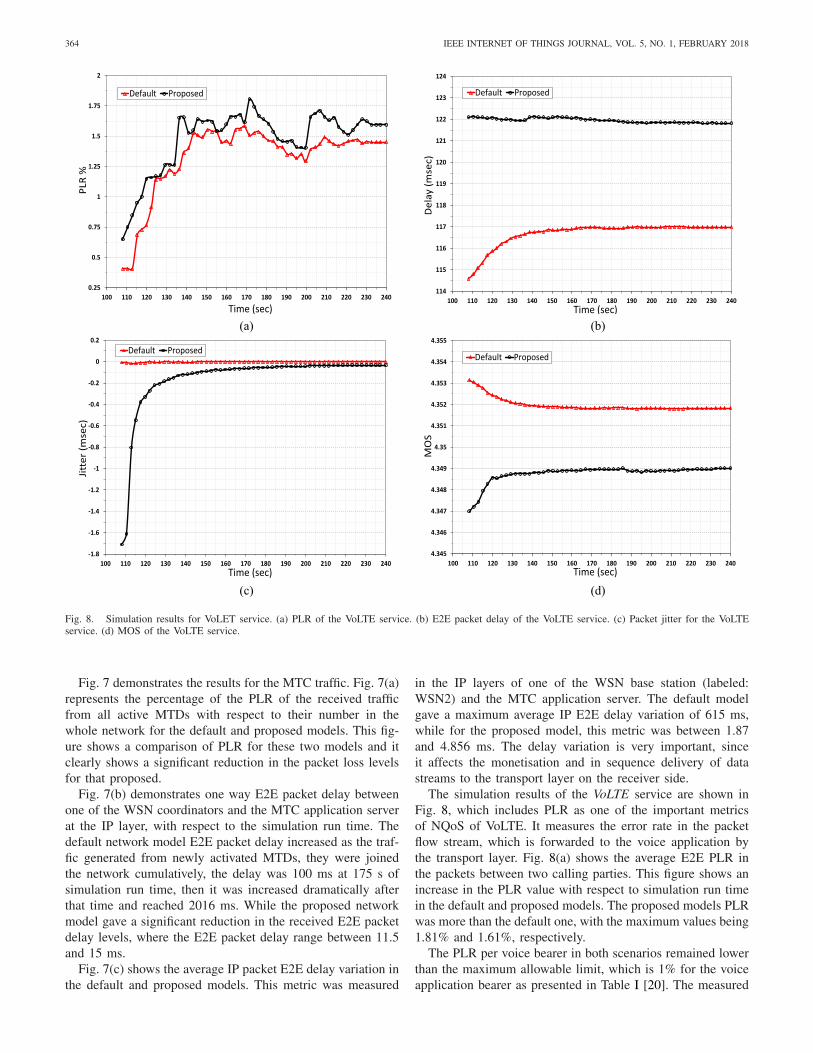
Fig. 8. Simulation results for VoLET service. (a) PLR of the VoLTE service. (b) E2E packet delay of the VoLTE service. (c) Packet jitter for the VoLTEservice. (d) MOS of the VoLTE service.
Fig. 7 demonstrates the results for the MTC traffic. Fig. 7(a)represents the percentage of the PLR of the received trafficfrom all active MTDs with respect to their number in thewhole network for the default and proposed models. This fig-ure shows a comparison of PLR for these two models and itclearly shows a significant reduction in the packet loss levelsfor that proposed.
Fig. 7(b) demonstrates one way E2E packet delay betweenone of the WSN coordinators and the MTC application serverat the IP layer, with respect to the simulation run time. Thedefault network model E2E packet delay increased as the traf-fic generated from newly activated MTDs, they were joinedthe network cumulatively, the delay was 100 ms at 175 s ofsimulation run time, then it was increased dramatically afterthat time and reached 2016 ms. While the proposed networkmodel gave a significant reduction in the received E2E packetdelay levels, where the E2E packet delay range between 11.5and 15 ms.
Fig. 7(c) shows the average IP packet E2E delay variation inthe default and proposed models. This metric was measured
in the IP layers of one of the WSN base station (labeled:WSN2) and the MTC application server. The default modelgave a maximum average IP E2E delay variation of 615 ms,while for the proposed model, this metric was between 1.87and 4.856 ms. The delay variation is very important, sinceit affects the monetisation and in sequence delivery of datastreams to the transport layer on the receiver side.
The simulation results of the VoLTE service are shown inFig. 8, which includes PLR as one of the important metricsof NQoS of VoLTE. It measures the error rate in the packetflow stream, which is forwarded to the voice application bythe transport layer. Fig. 8(a) shows the average E2E PLR inthe packets between two calling parties. This figure shows anincrease in the PLR value with respect to simulation run timein the default and proposed models. The proposed models PLRwas more than the default one, with the maximum values being1.81% and 1.61%, respectively.
The PLR per voice bearer in both scenarios remained lowerthan the maximum allowable limit, which is 1% for the voiceapplication bearer as presented in Table I [20]. The measured
AL-SHAMMARI et al.: IoT TRAFFIC MANAGEMENT AND INTEGRATION IN QoS SUPPORTED NETWORK 365
value represents the total accumulated E2E PLR in the ULand DL directions, while the maximum defined voice bearerPLR limit represents a one direction PLR. Therefore, the aver-age of the maximum achieved E2E PLR per voice bearer(UL and DL voice bearers) of the proposed model is 0.905%,whereas for the default model is 0.805%, which is a goodlevel, since most of the up-to-date voice codecs perform wellup to 1% PLR [44]. The irregular variation of the PLR duringthe simulation run time was due to the radio interface envi-ronment variation (path loss and fading effects in the UMamodel) between eNB and the calling parties as well as theincreased traffic loads, during the simulation runs. The conse-quence of increased traffic loads was throttling the UL, whichcreated congestion in the PUSCH. VoLTE service packet delayis called mouth to ear delay, which is one of the most impor-tant factors to be considered when dealing with the QoS ofreal time voice service in PS, such as the VoLTE service in ournetwork model. Fig. 8(b) shows the average E2E packet delayof the VoLTE in the default and proposed network models.
The default model average E2E packet delay started at114.58 ms and reached 116.9 ms at 150 s of the simulationrun time, then remaining at this value until the end of thesimulation run. Whereas the proposed network model kept itsaverage E2E packet delay at 122±0.1 ms from the start of theVoLTE service traffic flow until the end of the simulation run.This measure was taken as E2E, which means it was in theUL/DL directions. Obviously, there was a little degradationin this NQoS, because the proposed model gave higher delayvalues (about 7 ms) than the default model. These values ofaverage E2E delay in the default and proposed models wouldstill fulfil the 3GPP and the ITU-R standardizations as well asthe requirements for VoLTE service E2E packet delay, wherethe maximum allowable one way packet delay is 150 ms inorder to accomplish high QoE [25], [45], [46].
Packet jitter is one of the most important QoS metrics of realtime services. Fig. 8(c) shows the average jitter of the VoLTEservice in the proposed and default models. In this figure, thedefault network model gave a better packet jitter performancethan the proposed network model. The average packet jit-ter values of the default model were between −0.00844 and−0.000974 ms for the received packets of the VoLTE ser-vice traffic up until the end of simulation run time. Whilst theproposed model’s average packet jitter value for the VoLTEservice traffic flow started at −1.7 ms and by the end of thesimulation it had decreased to −0.0326 ms. Clearly, there isdegradation in this NQoS metric, for a consequence of theincreased average packet jitter will be an increase in the timedelay of the received packets in the de-jitter buffer [47]. Thevalue of the average packet jitter in the proposed model wasreduced. The ITU-R has recommended 25 ms jitter as anacceptable value for the delay variation [48].
The users QoE levels of real time voice call are a measureof users satisfaction levels when engaging with the VoLTEservice. The MOS is a well-known metric to measure QoEby using its E-Model, according to ITU-T G107 [49]. ThisQoE metric can be reported as sampled, interval or cumulativemetrics, using a modified instantaneous E-Model [50], [51].MOS statistics are collected using instantaneous E-Model, it
was set in the simulation models to report MOS value as asample mean of 100 MOS instantaneous sampled statisticsevery 2 s, which is called bucket mode [24]. Each one of the100 MOS instantaneous sample statistic is collected within20 ms time interval. Whereas, the voice codec frame sizeis set to treat 1 digitized voice frame every 10 ms, mean-ing that the voice traffic has an interarrival time of 10 ms.Therefore, the MOS instantaneous sampled statistics analy-sis relies on 2 current and 2 previous digitized voice framesQoS metrics, such as received voice application, frame delayand error rate [51], [52]. Fig. 8(d) shows the MOS of thedefault and the proposed network models. The default modelstarted with MOS of 4.3532 then dropped to 4.3518, whereasthe proposed network model started at MOS of 4.347 thenincreased to 4.349. Moreover, the levels of QoE representedby the MOS value, maintained within good acceptable levelsduring the whole voice call time for both models.
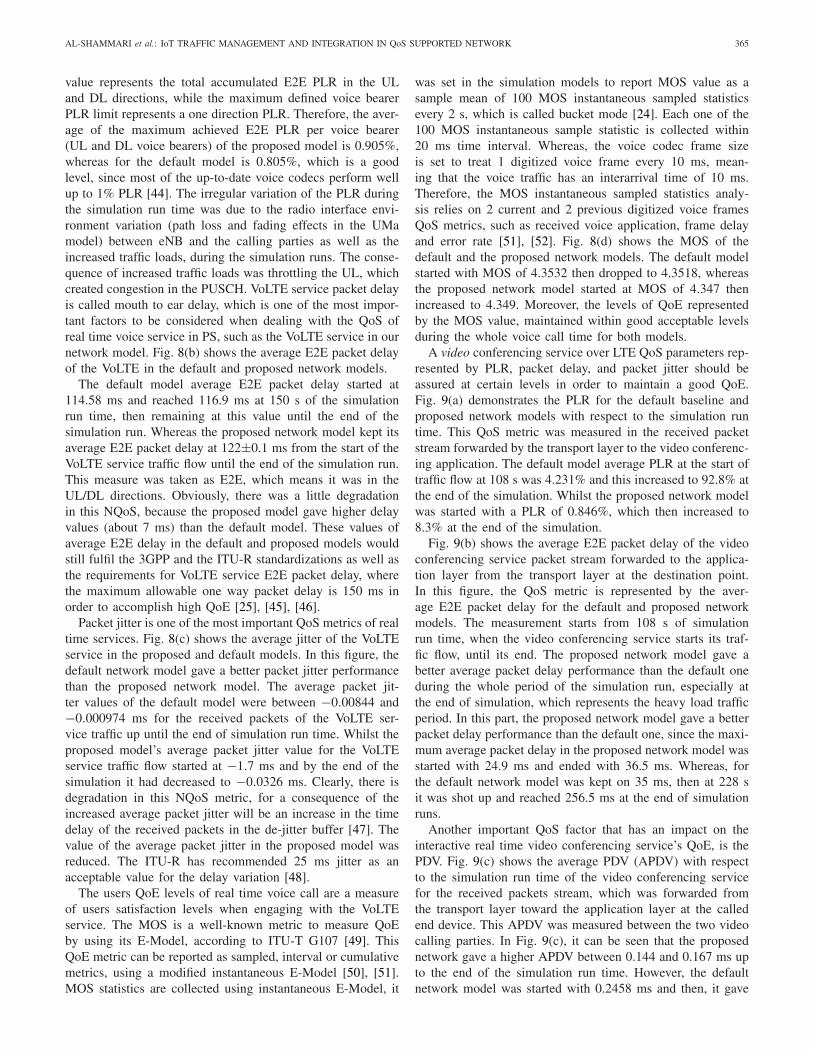
A video conferencing service over LTE QoS parameters rep-resented by PLR, packet delay, and packet jitter should beassured at certain levels in order to maintain a good QoE.Fig. 9(a) demonstrates the PLR for the default baseline andproposed network models with respect to the simulation runtime. This QoS metric was measured in the received packetstream forwarded by the transport layer to the video conferenc-ing application. The default model average PLR at the start oftraffic flow at 108 s was 4.231% and this increased to 92.8% atthe end of the simulation. Whilst the proposed network modelwas started with a PLR of 0.846%, which then increased to8.3% at the end of the simulation.
Fig. 9(b) shows the average E2E packet delay of the videoconferencing service packet stream forwarded to the applica-tion layer from the transport layer at the destination point.In this figure, the QoS metric is represented by the aver-age E2E packet delay for the default and proposed networkmodels. The measurement starts from 108 s of simulationrun time, when the video conferencing service starts its traf-fic flow, until its end. The proposed network model gave abetter average packet delay performance than the default oneduring the whole period of the simulation run, especially atthe end of simulation, which represents the heavy load trafficperiod. In this part, the proposed network model gave a betterpacket delay performance than the default one, since the maxi-mum average packet delay in the proposed network model wasstarted with 24.9 ms and ended with 36.5 ms. Whereas, forthe default network model was kept on 35 ms, then at 228 sit was shot up and reached 256.5 ms at the end of simulationruns.
Another important QoS factor that has an impact on theinteractive real time video conferencing service’s QoE, is thePDV. Fig. 9(c) shows the average PDV (APDV) with respectto the simulation run time of the video conferencing servicefor the received packets stream, which was forwarded fromthe transport layer toward the application layer at the calledend device. This APDV was measured between the two videocalling parties. In Fig. 9(c), it can be seen that the proposednetwork gave a higher APDV between 0.144 and 0.167 ms upto the end of the simulation run time. However, the defaultnetwork model was started with 0.2458 ms and then, it gave
366 IEEE INTERNET OF THINGS JOURNAL, VOL. 5, NO. 1, FEBRUARY 2018
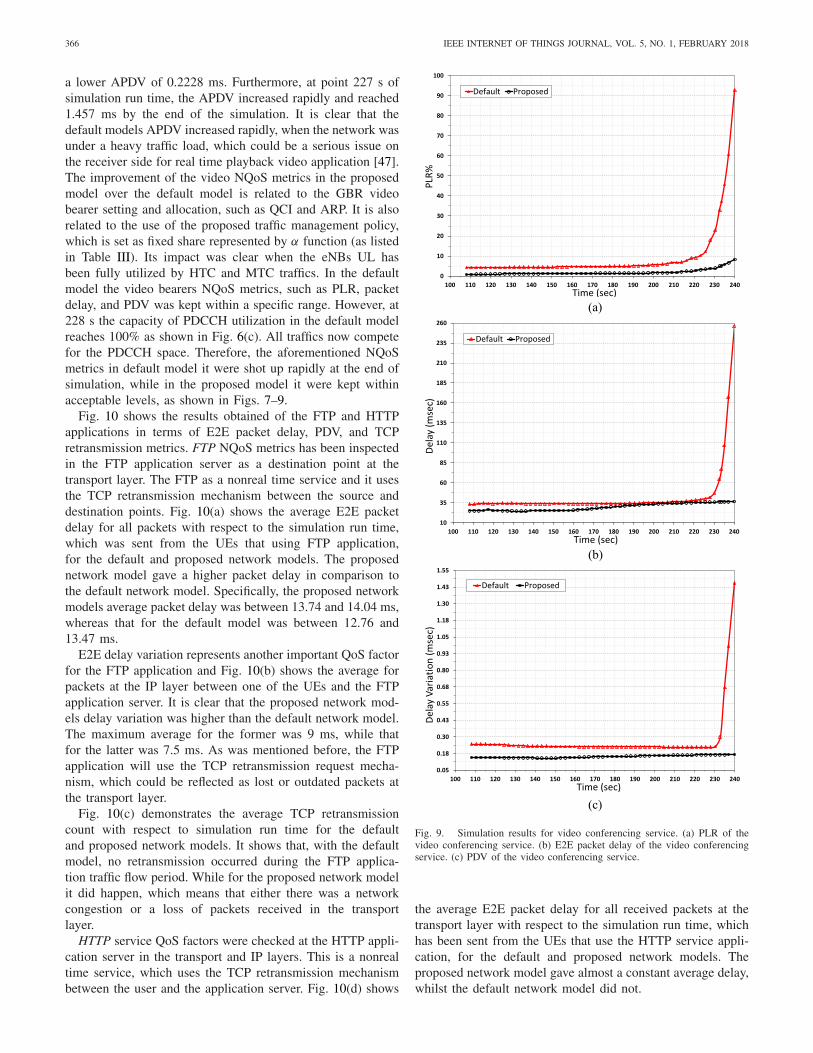
a lower APDV of 0.2228 ms. Furthermore, at point 227 s ofsimulation run time, the APDV increased rapidly and reached1.457 ms by the end of the simulation. It is clear that thedefault models APDV increased rapidly, when the network wasunder a heavy traffic load, which could be a serious issue onthe receiver side for real time playback video application [47].The improvement of the video NQoS metrics in the proposedmodel over the default model is related to the GBR videobearer setting and allocation, such as QCI and ARP. It is alsorelated to the use of the proposed traffic management policy,which is set as fixed share represented by α function (as listedin Table III). Its impact was clear when the eNBs UL hasbeen fully utilized by HTC and MTC traffics. In the defaultmodel the video bearers NQoS metrics, such as PLR, packetdelay, and PDV was kept within a specific range. However, at228 s the capacity of PDCCH utilization in the default modelreaches 100% as shown in Fig. 6(c). All traffics now competefor the PDCCH space. Therefore, the aforementioned NQoSmetrics in default model it were shot up rapidly at the end ofsimulation, while in the proposed model it were kept withinacceptable levels, as shown in Figs. 7–9.
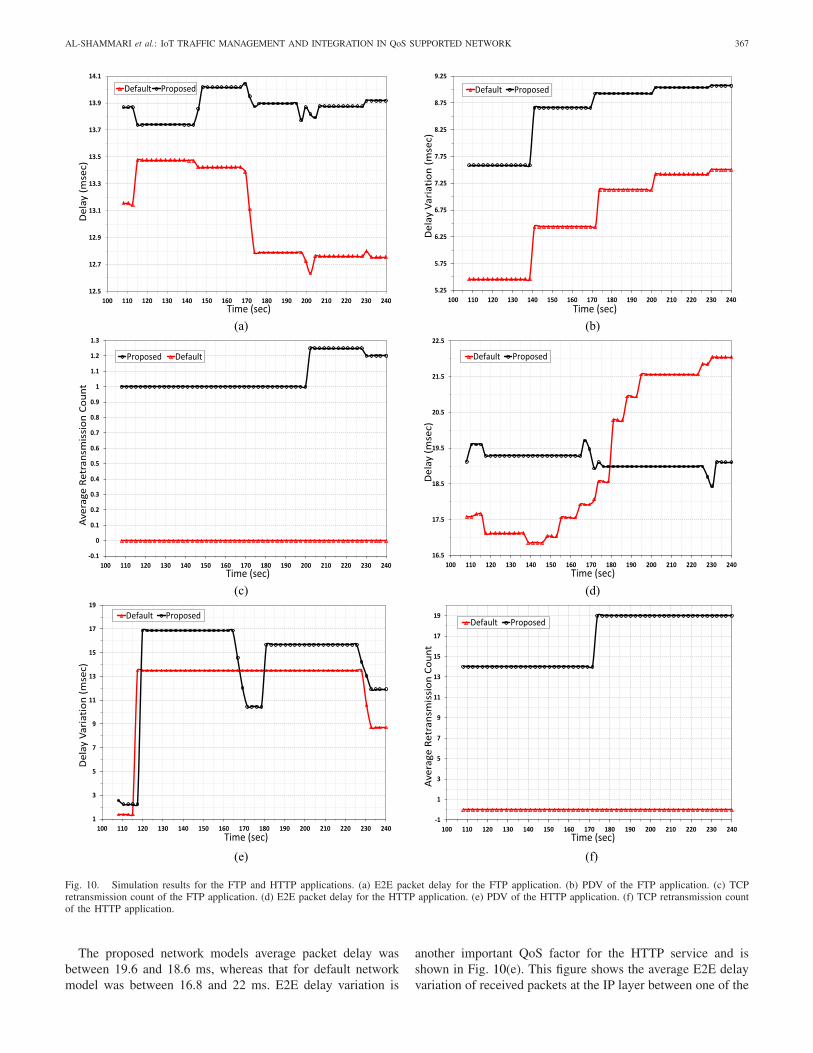
Fig. 10 shows the results obtained of the FTP and HTTPapplications in terms of E2E packet delay, PDV, and TCPretransmission metrics. FTP NQoS metrics has been inspectedin the FTP application server as a destination point at thetransport layer. The FTP as a nonreal time service and it usesthe TCP retransmission mechanism between the source anddestination points. Fig. 10(a) shows the average E2E packetdelay for all packets with respect to the simulation run time,which was sent from the UEs that using FTP application,for the default and proposed network models. The proposednetwork model gave a higher packet delay in comparison tothe default network model. Specifically, the proposed networkmodels average packet delay was between 13.74 and 14.04 ms,whereas that for the default model was between 12.76 and13.47 ms.
E2E delay variation represents another important QoS factorfor the FTP application and Fig. 10(b) shows the average forpackets at the IP layer between one of the UEs and the FTPapplication server. It is clear that the proposed network mod-els delay variation was higher than the default network model.The maximum average for the former was 9 ms, while thatfor the latter was 7.5 ms. As was mentioned before, the FTPapplication will use the TCP retransmission request mecha-nism, which could be reflected as lost or outdated packets atthe transport layer.
Fig. 10(c) demonstrates the average TCP retransmissioncount with respect to simulation run time for the defaultand proposed network models. It shows that, with the defaultmodel, no retransmission occurred during the FTP applica-tion traffic flow period. While for the proposed network modelit did happen, which means that either there was a networkcongestion or a loss of packets received in the transportlayer.
HTTP service QoS factors were checked at the HTTP appli-cation server in the transport and IP layers. This is a nonrealtime service, which uses the TCP retransmission mechanismbetween the user and the application server. Fig. 10(d) shows
(c)
(b)
(a)
Fig. 9. Simulation results for video conferencing service. (a) PLR of thevideo conferencing service. (b) E2E packet delay of the video conferencingservice. (c) PDV of the video conferencing service.
the average E2E packet delay for all received packets at thetransport layer with respect to the simulation run time, whichhas been sent from the UEs that use the HTTP service appli-cation, for the default and proposed network models. Theproposed network model gave almost a constant average delay,whilst the default network model did not.
AL-SHAMMARI et al.: IoT TRAFFIC MANAGEMENT AND INTEGRATION IN QoS SUPPORTED NETWORK 367
(a) (b)
(c) (d)
(e) (f)
Fig. 10. Simulation results for the FTP and HTTP applications. (a) E2E packet delay for the FTP application. (b) PDV of the FTP application. (c) TCPretransmission count of the FTP application. (d) E2E packet delay for the HTTP application. (e) PDV of the HTTP application. (f) TCP retransmission countof the HTTP application.
The proposed network models average packet delay wasbetween 19.6 and 18.6 ms, whereas that for default networkmodel was between 16.8 and 22 ms. E2E delay variation is
another important QoS factor for the HTTP service and isshown in Fig. 10(e). This figure shows the average E2E delayvariation of received packets at the IP layer between one of the
368 IEEE INTERNET OF THINGS JOURNAL, VOL. 5, NO. 1, FEBRUARY 2018
UEs and the HTTP service application server. The proposednetwork models delay variation was higher than for the defaultnetwork model. The maximum average E2E delay variation ofthe former was 16.8 ms, while that for the latter was 13.5 ms.
Fig. 10(f) demonstrates the average TCP retransmissioncount with respect to simulation run time for the default andproposed network models. It shows that, in the default model,no retransmission happened during the HTTP application traf-fic flow. While in the proposed network model this did occur,which reflects that either there was a network congestion or aloss of packets received in the transport layer.
V. DISCUSSION
NQoS is a measure of the reliability and performance ofthe network nodes and links. It is a composite metric, beingbased on various factors that specify the characteristics of thenetwork situation and consequently, deteriorations or improve-ments in the NQoS level can be brought about through somecombined factors so as to fulfil AQoS requirements.
The proposed traffic management policy, with the assis-tance of WSN gateway, achieved high QoS, as presentedby all the NQoS measurements of the MTC and HTC traf-fic flows in this paper at the IP and transport layers. TheeNB performance achievement in terms of the UL and DLcapacity enhancement was in PUSCH utilization, PUSCHthroughput, and PDCCH utilization. In the proposed modelthe PUSCH utilization was reduced on average by 33.6% overthe default model. The PUSCH throughput of the proposedmodel was achieved 73.2% increase over the default model,specifically when congestion was arisen. Another impact ofthe proposed flow management policy, it was on the PDCCHutilization achieve 5% decrease at congestion condition overthe default model. Furthermore, an increase of 179% in theradio access node connectivity, from the number of activeconnected MTDs point of view. The achieved NQoS enhance-ment was in terms of the radio access node physical layerperformance parameters as well as of the MTC traffic flowsexhibiting a decrease of 99.45% in the PLR, a decrease of99.89% in the packet E2E delay, a decrease of 99.21% inthe PDV.
Despite there being an increase of 12.42% with respect tothe default baseline model occurred in terms of the VoLTEservice as represented by its PLR, several offsetting achieve-ments were delivered by the proposed traffic managementpolicy, including a decrease of 9.5% in the PLR with respectto the 3GPP maximum PLR allowable limit for the VoLTEservice, an increase of 4.5% from the baseline model for thepacket E2E delay, a decrease of 18.79% from standard 3GPPmaximum standard packet E2E delay, a reduction of 99.87%from the standard 3GPP maximum jitter value for the packetjitter and a decrease of 0.074% in terms of QoE from thedefault model values, with an increase of 8.73% from thestandard values. The E2E VoLTE NQoS are the PLR, packetdelay, and packet jitter, as a composite metrics. The degradedlevel of them can be improved by using a lower rate voicecodec or adaptive multirate voice codec at the VoLTE appli-cation layer level [53]. It can be also improved by employing
a scheduling algorithm at the physical layer level, specifi-cally for VoLTE service bearer, such as TTI bundling andsemi-persistent scheduling [54]. These scheduling techniquesare exploiting processing delay difference between applica-tion layer voice frame generation process and physical layertransmission procedure [55].
Another NQoS improvement was for video conferencing,specifically at congestion condition, where a reduction of85.75% regarding PLR, 85% of packet delay and 88.5% ofPDV were achieved, when compared with the default modelvalues.
The HTTP service NQoS achievement regarding packet E2Edelay was a decrease of 13.31% and the PDV provided anincrease of 37.26% to those of the baseline model. In spite ofthe obtained increment in the PDV, it represents a decrease of52.26% from the standard maximum specified value.
FTP service NQoS delivered packet delay and delay vari-ation increases of 9.12% and 20.9%, respectively, whencompared to the default model. Compared with the stan-dard specified maximum allowable limits, the proposed policyachieved a rapid decrease of 95.36% in the packet delay anda reduction of 63.71% in delay variation.
Finally, the proposed model achieved the specified bearersettings for the HTDs and MTDs. Moreover, the QoE ofthe real time application users of the VoLTE service wasmaintained within the satisfaction level, as measured by theE-Model’s MOS scale. While the QoE of the video conferenc-ing service has been attained, in the perspective of obtainableNQoS metrics compared to the standard AQoS requirement ofthis service.
VI. CONCLUSION
This paper has addressed the challenges of heterogene-ity by integrating HTC and IoT traffic through their mutualinteraction within network elements (nodes and links), interms of the resultant and distinct E2E NQoS metrics. Themotivation for this paper was based on the fact that the exist-ing LTE-APro PCC rules and procedures do not differentiatebetween the user type of the terminal devices, which producesa lack of NQoS levels being offered and hence, potentially notmeeting the AQoS demands made by the used service.
An access WSN gateway has been proposed to provide E2Econnectivity for MTCs traffic flow within the license spectrumof LTE-APro media. An approach of protocol conversion andfacilitation of the control of the EPS network resources QoSlevel assigned for MTC traffic flows, in the context of PCCfunctions and rules, has been provided. A policy for trafficflow management that defines MTC traffic flows over the EPSnetwork has been put forward, in order to use a fraction ofthe available network resources in a seamless manner, accom-panied by a new specific group of QCIs, assigned to definethe QoS levels of the MTC bearers connectivity. The allo-cation of network resources for MTC traffic flows are tunedbased on terminal type needs, i.e., on the level of importanceof the traffic type sent by MTD. In addition, The QoE of realtime application human users is assured within the perceivedquality levels.
AL-SHAMMARI et al.: IoT TRAFFIC MANAGEMENT AND INTEGRATION IN QoS SUPPORTED NETWORK 369
The simulation results have shown that the proposed pol-icy of traffic flow management within the LTE-APro networkinfrastructure outperforms the current one in terms of NQoSlevels, not only for HTCs traffic flows but also, for those ofMTCs. However, in terms of the VoLTE service, it some degra-dation was encountered with the offered NQoS, due to the useof high rate codec in the application layer and the absence ofa specific scheduling procedure to the VoLTE bearer at theradio interface. Nevertheless, the VoLTE service QoE levelwas retained within the recommended standardization level.
The future work is matching the scope of this paper, and inthe context of the heterogeneity of NGN, the key driver willbe the use of network functions virtualization and softwaredefined network to set the proposed policy in the networkoperating system layer as an engine to drive the control layerelements (controllers) in order to update the QoS mechanismsin the network elements, such as gateways in the CN as wellas central offices in centralized RAN.
REFERENCES
[1] B.-W. Chen, W. Ji, F. Jiang, and S. Rho, “QoE-enabled big video stream-ing for large-scale heterogeneous clients and networks in smart cities,”IEEE Access, vol. 4, pp. 97–107, 2016.
[2] S. Yinbiao, P. Lanctot, and F. Jianbin, “Internet of Things: Wirelesssensor networks,” Geneva, Switzerland, Int. Electrotech. Commission,White Paper, 2014. [Online]. Available: http://www.iec.ch
[3] J. Eckenrode. (2015). The Derivative Effect: How Financial ServicesCan Make IoT Technology Pay Off. [Online]. Available: https://dupress.deloitte.com/dup-us-en/focus/internet-of-things/iot-in-financial-services-industry.html?coll=11711
[4] F. Ghavimi and H.-H. Chen, “M2M communications in 3GPP LTE/LTE-A networks: Architectures, service requirements, challenges, and appli-cations,” IEEE Commun. Surveys Tuts., vol. 17, no. 2, pp. 525–549,2nd Quart., 2015.
[5] S. N. K. Marwat, T. Pötsch, Y. Zaki, T. Weerawardane, and C. Görg,“Addressing the challenges of E-healthcare in future mobile networks,”in Proc. Meeting Eur. Netw. Universities Companies Inf. Commun. Eng.,2013, pp. 90–99.
[6] L. Costantino, N. Buonaccorsi, C. Cicconetti, and R. Mambrini,“Performance analysis of an LTE gateway for the IoT,” in Proc. IEEEInt. Symp. World Wireless Mobile Multimedia Netw. (WoWMoM), 2012,pp. 1–6.
[7] A. Lo, Y. W. Law, and M. Jacobsson, “A cellular-centric service archi-tecture for machine-to-machine (M2M) communications,” IEEE WirelessCommun., vol. 20, no. 5, pp. 143–151, Oct. 2013.
[8] D. Lee, J.-M. Chung, and R. C. Garcia, “Machine-to-machine com-munication standardization trends and end-to-end service enhancementsthrough vertical handover technology,” in Proc. IEEE 55th Int. MidwestSymp. Circuits Syst. (MWSCAS), 2012, pp. 840–844.
[9] S. Kang, W. Ji, S. Rho, V. A. Padigala, and Y. Chen, “Cooperative mobilevideo transmission for traffic surveillance in smart cities,” Comput. Elect.Eng., vol. 54, pp. 16–25, Aug. 2016.
[10] S. N. K. Marwat, Y. Zaki, J. Chen, A. Timm-Giel, and C. Göerg, “Anovel machine-to-machine traffic multiplexing in LTE-A system usingwireless in-band relaying,” in Proc. Int. Conf. Mobile Netw. Manag.,2013, pp. 149–158.
[11] J. Zhang, L. Shan, H. Hu, and Y. Yang, “Mobile cellular networks andwireless sensor networks: Toward convergence,” IEEE Commun. Mag.,vol. 50, no. 3, pp. 164–169, Mar. 2012.
[12] J.-P. Bardyn, T. Melly, O. Seller, and N. Sornin, “IoT: The era ofLPWAN is starting now,” in Proc. 42nd IEEE Eur. Solid State CircuitsConf. (ESSCIRC), 2016, pp. 25–30.
[13] D. Flore, 3GPP Standards for the Internet of Things, QualcommTechnol. Inc., San Diego, CA, USA, 2016.
[14] E. Soltanmohammadi, K. Ghavami, and M. Naraghi-Pour, “A survey oftraffic issues in machine-to-machine communications over LTE,” IEEEInternet Things J., vol. 3, no. 6, pp. 865–884, Dec. 2016.
[15] R. P. Jover and I. Murynets, “Connection-less communication of IoTdevices over LTE mobile networks,” in Proc. 12th Annu. IEEE Int. Conf.Sens. Commun. Netw. (SECON), 2015, pp. 247–255.
[16] C. W. Johnson, LTE in Bullets. Northampton, U.K.: Chris Johnson,2010.
[17] K. M. Koumadi, B. Park, and N. Myoung, “Introducing the latest 3GPPspecifications and their potential for future AMI applications,” KEPCOJ. Elect. Power Energy, vol. 2, no. 2, pp. 245–251, 2016.
[18] I. Abdalla and S. Venkatesan, “A QoE preserving M2M-aware hybridscheduler for LTE uplink,” in Proc. IEEE Int. Conf. Sel. Topics MobileWireless Netw. (MoWNeT), 2013, pp. 127–132.
[19] L. Galluccio, S. Milardo, G. Morabito, and S. Palazzo, “SDN-WISE:Design, prototyping and experimentation of a stateful SDN solutionfor wireless sensor networks,” in Proc. IEEE Conf. Comput. Commun.(INFOCOM), 2015, pp. 513–521.
[20] Digital Cellular Telecommunications System (Phase 2+) (GSM);Universal Mobile Telecommunications System (UMTS); LTE; Policy andCharging Control Architecture, ETSI Standard TS 123 203 V13.6.0(2016-03), 2016.
[21] M. Chiang and T. Zhang, “Fog and IoT: An overview of researchopportunities,” IEEE Internet Things J., vol. 3, no. 6, pp. 854–864,Dec. 2016.
[22] N. Seitz, “ITU-T QoS standards for IP-based networks,” IEEE Commun.Mag., vol. 41, no. 6, pp. 82–89, Jun. 2003.
[23] “Network performance objectives for IP-based services,” Int.Telecommun. Union, Geneva, Switzerland, ITU RecommendationY.1541, Feb. 2006.
[24] O. Modeler. (2016). Riverbed Technology Inc. [Online]. Available:http://www.riverbed.com
[25] H. Ekstrom, “QoS control in the 3GPP evolved packet system,” IEEECommun. Mag., vol. 47, no. 2, pp. 76–83, Feb. 2009.
[26] S. Albasheir and M. Kadoch, “Enhanced control for adaptive resourcereservation of guaranteed services in LTE networks,” IEEE InternetThings J., vol. 3, no. 2, pp. 179–189, Apr. 2016.
[27] N. A. Ali, A.-E. M. Taha, and H. S. Hassanein, “Quality of servicein 3GPP R12 LTE-advanced,” IEEE Commun. Mag., vol. 51, no. 8,pp. 103–109, Aug. 2013.
[28] L. Korowajczuk, How to Dimension User Traffic in 4G Networks(CelPlan Webinar Series). Webinar, Jun. 2014. [Online]. Available:http://www.celplan.com/webinars/webinar-20140507.asp
[29] X. An, F. Pianese, I. Widjaja, and U. G. Acer, “DMME: A distributedLTE mobility management entity,” Bell Labs Tech. J., vol. 17, no. 2,pp. 97–120, 2012.
[30] G. Crosby and F. Vafa, “A novel dual mode gateway for wireless sensornetwork and LTE-A network convergence,” Int. J. Eng. Res. Innovat.,vol. 5, no. 2, pp. 19–27, 2013.
[31] G. Horváth, “End-to-end QoS management across LTE networks,”in Proc. IEEE 21st Int. Conf. Softw. Telecommun. Comput. Netw.(SoftCOM), 2013, pp. 1–6.
[32] “LTE in a nutshell: Protocol architecture,” Markham, ON, Canada,Telesystem Innovations, White Paper, 2010.
[33] A. M. Ghaleb, E. Yaacoub, and D. Chieng, “Physically separated uplinkand downlink transmissions in LTE HetNets based on CoMP concepts,”in Proc. Int. Conf. Front. Commun. Netw. Appl. (ICFCNA Malaysia),2014, pp. 1–6.
[34] H. Holma and A. Toskala, WCDMA for UMTS: HSPA Evolution andLTE. Chichester, U.K.: Wiley, 2010.
[35] Cisco. (2016). Voice Over IP—Per Call BandwidthConsumption. [Online]. Available: http://www.cisco.com/c/en/us/support/docs/voice/voice-quality/7934-bwidth-consume.html
[36] S. J. M. Baygi and M. Mokhtari, “Evaluation performance of protocolsLEACH, 802.15.4 and CBRP, using analysis of QoS in WSNs,” WirelessSensor Netw., vol. 6, no. 10, pp. 221–236, 2014.
[37] S. O. Robert. (2014). Lectures: CSCI 4151 Systems Simulation Class.[Online]. Available: http://www.robertowor.com/csci4151/lecture5.htm
[38] N. Ince and A. Bragg, Recent Advances in Modeling andSimulation Tools for Communication Networks and Services.New York, NY, USA: Springer, 2007. [Online]. Available:https://books.google.co.uk/books?id=pJSqZZmc9_oC
[39] Riverbed_Technology. (2017). Verifying Statistical Validity of DiscreteEvent Simulations. [Online]. Available: http://enterprise14.opnet.com/4dcgi/CL_SessionDetail?ViewCL_SessionID=3172,White_Paper_from_OPNET Verifying_Statistical_Validity_DES.pdf
[40] (2007). OpNet Modeling Concepts. [Online]. Available: http://suraj.lums.edu.pk/te/simandmod/Opnet/07%20Simulation%20Design.pdf
[41] Rohde&Schwarz. (2017). 1MA272: Testing LTE-A Releases 11and 12. [Online]. Available: https://www.rohde-schwarz.com/us/applications/testing-lte-a-releases-11-and-12-application-note_56280-307009.html
370 IEEE INTERNET OF THINGS JOURNAL, VOL. 5, NO. 1, FEBRUARY 2018
[42] Evolved Universal Terrestrial Radio Access (E-UTRA); PhysicalLayer Procedures, 3GPP Standard TS 36.213 V14.2.0 (2017-03),2017. [Online]. Available: https://portal.3gpp.org/desktopmodules/Specifications/SpecificationDetails.aspx?specificationId=2427
[43] A. Sethi and V. Hnatyshin, The Practical OPNET User Guidefor Computer Network Simulation. Boca Raton, FL, USA: Taylor& Francis, 2012. [Online]. Available: https://books.google.co.uk/books?id=3E3wqbSoHQQC
[44] “One voice; voice over IMS profile, V1.0.0,” AT&T, Dallas, TX,USA, Orange, Paris, France, Telefonica, Madrid, Spain, TeliaSonera,Stockholm, Sweden, Verizon, Basking Ridge, NJ, USA, Vodafone,London, U.K., Alcatel-Lucent, Boulogne-Billancourt, France, Ericsson,Stockholm, Sweden, Nokia Siemens Networks, Nokia, Espoo, Finland,Samsung, Seoul, South Korea, and Sony Ericsson, Tokyo, Japan,Nov. 2009. [Online]. Available: http://cdnet.stpi.narl.org.tw/techroom/market/_pdf/2009/eetelecomm_09_009_OneVoiceProfile.pdf
[45] Technical Specification Group Services and System Aspects; Policyand Charging Control Architecture (Release 10), Volume 10.6.0, 3GPPStandard TS 23.203, Mar. 2012.
[46] M. R. Tabany and C. G. Guy, “An end-to-end QoS performance eval-uation of VoLTE in 4G E-UTRAN-based wireless networks,” in Proc.10th Int. Conf. Wireless Mobile Commun., 2014, pp. 90–97.
[47] Cisco. (2005). Cisco Networking Academy Program: IPTelephony v1.0. [Online]. Available: http://www.hh.se/download/18.70cf2e49129168da015800094781/1341267715838/7_6_Jitter.pdf
[48] S. A. Ahson and M. Ilyas, VoIP Handbook: Applications, Technologies,Reliability, and Security, Boca Raton, FL, USA: CRC Press, 2008.
[49] The E-model: A computational model for use in transmission planning,Int. Telecommun. Union, Geneva, Switzerland, ITU RecommendationG.107, Jun. 2015. [Online]. Available: https://www.itu.int/rec/T-REC-G.107-201506-I/en
[50] A. Clark and B. Claise. (2011). Guidelines for ConsideringNew Performance Metric Development. [Online]. Available:https://tools.ietf.org/html/rfc6390.html
[51] A. D. Clark, “Modeling the effects of burst packet loss and recencyon subjective voice quality,” in Proc. Columbia Univ. IP TelephonyWorkshop, 2001.
[52] B. Belmudez, Audiovisual Quality Assessment and Predictionfor Videotelephony (T-Labs Series in TelecommunicationServices). Cham, Switzerland: Springer, 2014. [Online]. Available:https://books.google.co.uk/books?id=ULTzBQAAQBAJ
[53] IMS Profile for Voice and SMS, Version 9.0, document. IR. 92,GSM Assoc., London, U.K., 2015.
[54] VoLTE White Paper, China Mobile, Hong Kong, 2013.[55] “Deployment and the radio access network: The LTE user equipment
perspective,” Sunnyvale, CA, USA, Spirent, White Paper, 2012.
Basim K. J. Al-Shammari (GS’15) received theB.Sc. Eng. degree in electrical and electronic engi-neering/communications and electronic warfare fromthe Military College of Engineering, Baghdad, Iraq,in 1991, and the M.Sc. Eng. degree in electri-cal and electronic engineering/communications fromthe Al-Rasheed College of Engineering & Science,Baghdad, in 2005. He is currently pursuing the Ph.D.degree in communications engineering at BrunelUniversity London, London, U.K.
His current research interests include antenna,propagation, communication system design, QoS, QoE, mobile networkdeployment design, CRAN, NFV, MTC, wireless SDN, and smart IoT servicesand applications.
Nadia Al-Aboody (GS’14–M’16) received the B.Sc.degree in software engineering from Al-MansourUniversity College, Baghdad, Iraq, in 2003 and themaster’s degree in computer networking from theIraqi Commission for Computer and Informatics,Baghdad, in 2007. She is currently pursuing thePh.D. degree in communications engineering atBrunel University London, London, U.K.
Her current research interests include Internet ofThings, machine to machine, and wireless sensornetworks.
Hamed S. Al-Raweshidy (M’92–SM’97) receivedthe B.Eng. and M.Sc. degrees in communicationengineering from the University of Technology,Baghdad, Iraq, in 1977 and 1980, respectively,the Postgraduate Diploma degree from GlasgowUniversity, Glasgow, U.K., in 1987, and the Ph.D.degree from Strathclyde University, Glasgow, in1991.
He is a Professor of communication engineer-ing with the University of Technology. He waswith the Space and Astronomy Research Centre,
Baghdad, PerkinElmer, Waltham, MA, USA, Carl Zeiss, Oberkochen,Germany, British Telecom, Edinburgh, U.K., Oxford University, Oxford, U.K.,Manchester Metropolitan University, Manchester, U.K., and Kent University,Canterbury, U.K. He is currently the Director of the Wireless Networks andCommunications Centre, Brunel University, London, U.K. He has authored orco-authored over 250 papers in international journals and referred conferences.His current research interests include radio over fiber, personal networks, spec-tral efficiency, green radio, cognitive communications, and mesh networks.
Prof. Al-Raweshidy has been a Guest Editor for the International Journal ofWireless Personal Communications. He is an Editorial Board member of sev-eral journals such as the Journal of Communications and Mobile Computingand the Journal of Wireless Personal Communications. He is the Chairman ofExpert Working Group 4, Wired and Wireless Integration for Future Network,in eMobility, which is the top technology platform in Europe and it advisesthe European Commission for research directions in communications for thenext 10–15 years. He is a member of the Senate for Brunel University andthe School of Engineering Research Committee. He is a college memberfor EPSRC/U.K. and a Reviewer for the EU Commission, Hong Kong, andCyprus.