Ionospheric scintillation monitoring and modellingeprints.lancs.ac.uk/68427/1/4595_4862_1_PB.pdf ·...
26
391 ANNALS OF GEOPHYSICS, VOL. 52, N. 3/4, June/August 2009 Key words scintillation – measurement campaigns – phase screen models – radar – wavelets – maps 1. Introduction Transionospheric radio signals may experi- ence amplitude and phase fluctuations due to the propagation through irregularities of the electron density inside ionosphere. These irreg- ularities develop after sunset under several deionization instability processes. They induce random fluctuations of the medium’s refractive index. These signal fluctuations are referred as scintillation. The ionosphere scintillation is re- sponsible for signal degradation from the VHF up to the C band. This can affect in particular, the performance of satellite based navigation systems. The ionosphere drifts with respect to the earth at a velocity in the range of 100 m/s at low latitudes. This drift velocity may reach val- ues ten times higher at high latitudes. Due to Ionospheric scintillation monitoring and modelling Yannick Béniguel ( 1 ), Vincenzo Romano ( 2 ), Lucilla Alfonsi ( 2 ), Marcio Aquino ( 3 ), Alain Bourdillon ( 4 ), Paul Cannon ( 5 ), Giorgiana De Franceschi ( 2 ), Smita Dubey ( 6 ), Biagio Forte ( 7 ), Vadim Gherm ( 8 ), Norbert Jakowski ( 6 ), Massimo Materassi ( 9 ), Thoralf Noack ( 6 ), Mariusz Pozoga ( 10 ), Niel Rogers ( 5 ), Paolo Spalla ( 9 ), Hal J. Strangeways ( 11 ), E. Michael Warrington ( 12 ), Andrzej Wernik ( 10 ), Volker Wilken ( 6 ) and Nikolay Zernov ( 8 ) ( 1 ) IEEA, Paris, France ( 2 ) Istituto Nazionale di Geofisica e Vulcanologia, Roma, Italy ( 3 ) Institute of Engineering Surveying and Space Geodesy, IESSG, Nottingham, UK ( 4 ) IETR Université de Rennes 1, France ( 5 ) Qinetiq, Malvern, UK ( 6 ) DLR, Neustrelitz, Germany ( 7 ) University of Nova Gorica, Slovenia ( 8 ) University of St Petersburg, Russia ( 9 ) Institute for Complex Systems, National Council of Researches, Firenze, Italy ( 10 ) Space Research Center, Warsaw, Poland ( 11 ) School of Electronic and Electrical Engineering, University of Leeds, UK ( 12 ) Department of Engineering, University of Leicester, UK Abstract This paper presents a review of the ionospheric scintillation monitoring and modelling by the European groups involved in COST 296. Several of these groups have organized scintillation measurement campaigns at low and high latitudes. Some characteristic results obtained from the measured data are presented. The paper also ad- dresses the modeling activities: four models, based on phase screen techniques, with different options and appli- cation domains are detailed. Finally some new trends for research topics are given. This includes the wavelet analysis, the high latitudes analysis, the construction of scintillation maps and the mitigation techniques. Mailing address: Dr. Yannick Béniguel, IEEA 13, Pro- menade Paul Dumer, 92400 Courbevoie, France; e-mail: [email protected] Vol52,3,2009 20-09-2009 19:06 Pagina 391
Transcript of Ionospheric scintillation monitoring and modellingeprints.lancs.ac.uk/68427/1/4595_4862_1_PB.pdf ·...

391
ANNALS OF GEOPHYSICS, VOL. 52, N. 3/4, June/August 2009
Key words scintillation – measurement campaigns– phase screen models – radar – wavelets – maps
1. Introduction
Transionospheric radio signals may experi-ence amplitude and phase fluctuations due tothe propagation through irregularities of the
electron density inside ionosphere. These irreg-ularities develop after sunset under severaldeionization instability processes. They inducerandom fluctuations of the medium’s refractiveindex. These signal fluctuations are referred asscintillation. The ionosphere scintillation is re-sponsible for signal degradation from the VHFup to the C band. This can affect in particular,the performance of satellite based navigationsystems.
The ionosphere drifts with respect to theearth at a velocity in the range of 100 m/s atlow latitudes. This drift velocity may reach val-ues ten times higher at high latitudes. Due to
Ionospheric scintillation monitoring and modelling
Yannick Béniguel (1), Vincenzo Romano (2), Lucilla Alfonsi (2), Marcio Aquino (3), Alain Bourdillon (4), Paul Cannon (5), Giorgiana De Franceschi (2), Smita Dubey (6), Biagio Forte (7),
Vadim Gherm (8), Norbert Jakowski (6), Massimo Materassi (9), Thoralf Noack (6), Mariusz Pozoga (10), Niel Rogers (5), Paolo Spalla (9), Hal J. Strangeways (11),
E. Michael Warrington (12), Andrzej Wernik (10), Volker Wilken (6) and Nikolay Zernov (8)(1) IEEA, Paris, France
(2) Istituto Nazionale di Geofisica e Vulcanologia, Roma, Italy(3) Institute of Engineering Surveying and Space Geodesy, IESSG, Nottingham, UK
(4) IETR Université de Rennes 1, France(5) Qinetiq, Malvern, UK
(6) DLR, Neustrelitz, Germany(7) University of Nova Gorica, Slovenia(8) University of St Petersburg, Russia
(9) Institute for Complex Systems, National Council of Researches, Firenze, Italy(10) Space Research Center, Warsaw, Poland
(11) School of Electronic and Electrical Engineering, University of Leeds, UK(12) Department of Engineering, University of Leicester, UK
AbstractThis paper presents a review of the ionospheric scintillation monitoring and modelling by the European groupsinvolved in COST 296. Several of these groups have organized scintillation measurement campaigns at low andhigh latitudes. Some characteristic results obtained from the measured data are presented. The paper also ad-dresses the modeling activities: four models, based on phase screen techniques, with different options and appli-cation domains are detailed. Finally some new trends for research topics are given. This includes the waveletanalysis, the high latitudes analysis, the construction of scintillation maps and the mitigation techniques.
Mailing address: Dr. Yannick Béniguel, IEEA 13, Pro-menade Paul Dumer, 92400 Courbevoie, France; e-mail:[email protected]
Vol52,3,2009 20-09-2009 19:06 Pagina 391

392
Y. Beniguel, V. Romano, L. Alfonsi, M. Aquino, A. Bourdillon, P. Cannon, G. De Franceschi, S. Dubey, B. Forte, V. Gherm, N. Jakowski, M. Materassi, T. Noack, M. Pozoga, N. Rogers, P. Spalla, H.J. Strangeways, M. Warrington, A. Wernik, V. Wilken and N. Zernov
the respective motion of both the transmitter(satellite) and the medium with respect to thereceiver, the signal received exhibits scintilla-tions or deviations depending on the size of theirregularities and on the distance from the ran-dom medium to the receiver as compared to theFresnel distance. The Multi-paths inside themedium cause phase fluctuation and concur-rent intensity fluctuations. The normalisedstandard deviation of the received intensity S4
(Briggs and Parkin, 1963) and the standard de-
viation of the received phase σφ (Yeh and Liu,1982) allow the scintillations to be classifiedinto three categories: weak, medium or strongfluctuations. Observations show that the phaseand intensity standard deviation (in radians forthe phase and normalized for intensity) are cor-related for low and medium fluctuations anduncorrelated for high fluctuations. In additionmany characteristics can be studied such as thescattering function, the correlation properties,the probabilities, the fades statistics, the loss of
Cayenne: Data from June 06 to July 07S4 level: [0.25-0.4], [0.4-0.55], [>0.55]
Elevation > 20 degrees, After multipath correction
Hour (HL)
Eve
nt n
umbe
r
All the year
12
400
300
200
1000
16 20 24 4 8 12
Fig. 1. L band scintillation local time dependency measured in Cayenne (4.82°N 52.36W) during PRIS meas-urement campaign (courtesy CLS, Toulouse).
Fig. 2. Histogram of intensity and phase scintillations recorded in Vietnam (x axis S4 to be multiplied by .1, yaxis the month number, z axis the relative number of occurrences).
Vol52,3,2009 20-09-2009 19:06 Pagina 392

393
Ionospheric scintillation monitoring and modelling
lock, … all these being of interest to developmitigation techniques. Finally it should bementioned that the scintillations occurrenceand level are highly related to the solar andmagnetic activity.
In the frame of the COST 296 action manyinstitutions and companies have collaboratedto study the scintillation phenomena. This wasdone by sharing the results of several measure-ment campaigns (as PRIS under ESA/ESTECcontract (Adam et al., 2008), coordinating themonitoring activity and collaborating for mod-eling development and data analysis. This pa-per reports on this collaborative activity anddescribes the main scientific results.
2. Scintillation characteristics
Scintillations are mainly observed over lowlatitudes at about ±20° around the magneticequator and at auroral and polar zones. At highlatitudes the scintillations are often caused by
patches of enhanced ionization transportedfrom the dayside subauroral latitudes across thepolar cap into auroral oval. When these struc-tures pass through the cusp they are fragmentedinto smaller-scale irregularities and form thepolar cap patches.
At equatorial latitudes the ionospheric irreg-ularities often form rod-like structures extend-ing along the geomagnetic field lines to alti-tudes even higher than 1000 km. Irregularitiesembedded inside these rods may cause intensescintillation effects on satellite radio links fromthe VHF up to the C band. Scintillations can ex-ceptionally be observed at mid latitudes duringintense ionospheric storms (see, e.g., DeFranceschi et al., 2008).
The polar cap patches are predominantly awintertime phenomenon: the polar cap has to bein darkness Hto observe ion patches. Neverthe-less during summertime they are not absent.High plasma density exists in the dayside cuspand in the polar cap produced by direct pho-toionization. This latter condition minimizes
Fig. 3. Geographic distribution of S4 at different levels measured at all satellites received in Bandung in 2006.All S4- indices measured with all GPS - satellites which are greater than 0.2 (green), greater than 0.3 (cyan),greater than 0.4 (magenta), greater than 0.5 (red) of the year 2006 are plotted at their corresponding sub-ionos-pheric locations.
Vol52,3,2009 20-09-2009 19:06 Pagina 393
394
Y. Beniguel, V. Romano, L. Alfonsi, M. Aquino, A. Bourdillon, P. Cannon, G. De Franceschi, S. Dubey, B. Forte, V. Gherm, N. Jakowski, M. Materassi, T. Noack, M. Pozoga, N. Rogers, P. Spalla, H.J. Strangeways, M. Warrington, A. Wernik, V. Wilken and N. Zernov
the formation of plasma density gradients. The following plots show the local time,
seasonal dependency, azimuth and elevation de-pendency and the spectrum.
Figure 2 below, corresponds to data record-ed in Vietnam and presents the intensity (S4)and phase (sigma phi) standard deviations of
scintillations depending on the month. It showsin that case, that the maximum of scintillationactivity occurs during equinoxes.
To interpret the scintillation data correctly,their function of geometrical factors such as az-imuth and elevation must be discussed. Takinginto account the location of Bandung at about
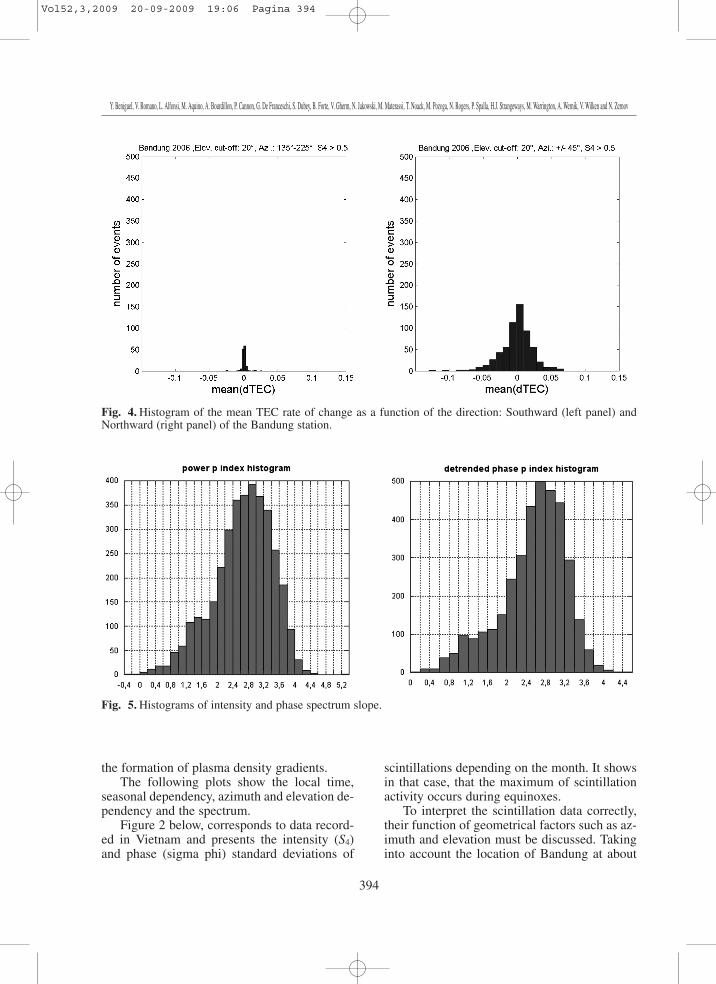
Fig. 4. Histogram of the mean TEC rate of change as a function of the direction: Southward (left panel) andNorthward (right panel) of the Bandung station.
Fig. 5. Histograms of intensity and phase spectrum slope.
Vol52,3,2009 20-09-2009 19:06 Pagina 394

395
Ionospheric scintillation monitoring and modelling
7° S which is southward/below the southwardequatorial anomaly crest region, ionosphericscintillations are expected mainly in northwarddirection at certain elevation angles related toionospheric piercing points within the anomalyregion.
As fig. 4 indicates, severe scintillationsoccur mostly northward of the Bandung sta-tion where the equatorial anomaly region isexpected.
The strong North-South asymmetry is also
well pronounced in the TEC rate. Consideringthe much higher electron density in the equato-rial anomaly region, this result is expected.
The spectrum slope was calculated from theanalysis of the raw data files recorded inCayenne during the PRIS measurement cam-paign. Five days were used for this analysis.Only the samples exhibiting a S4 value greaterthan 0.2 were considered. The results reportedon fig. 5, exhibit a peak value of 2.8 both for in-tensity and phase
Fig. 6,a-b. Frame (a) indicates the tracks of the 250 km pierce points for satellites PRN10, PRN24 andPRN29 on 8 May 2008. The track starts at the labelled end of the trace at the time stated, and the dots indicatethe movement of the pierce point at 30 minute intervals. Frames (b), (b) and (d) show the variation in slant TEC(offset such that the minimum observed value on that satellite pass is shown as zero) and phase scintillation (σφ)as a function of time for satellites PRN10, PRN24 and PRN29 respectively.
a b
c d
Vol52,3,2009 20-09-2009 19:06 Pagina 395

396
Y. Beniguel, V. Romano, L. Alfonsi, M. Aquino, A. Bourdillon, P. Cannon, G. De Franceschi, S. Dubey, B. Forte, V. Gherm, N. Jakowski, M. Materassi, T. Noack, M. Pozoga, N. Rogers, P. Spalla, H.J. Strangeways, M. Warrington, A. Wernik, V. Wilken and N. Zernov
Figure 6 shows the Slant TEC and phasescintillation index (σφ) of the signals receivedfrom three satellites (PRN10, PRN24 andPRN29) observed at Alert on 24 May 2008. Avery clear example of the presence of a series ofpolar patches is shown in frame (c) of this fig-ure in which marked increases in STEC on thepath from satellite PRN24 associated with thesteep electron density gradients correspondingto 3 polar patches are evident.
Peaks in phase scintillation correspondingto either the beginning or end of the time histo-ry of the STEC increase are often evident. Onepatch is observed in the signal received fromsatellite PRN29 (frame (d)) that has a largepeak in phase scintilation associated with theleading edge (in time) of the patch. For thethree patches evident in the measurements fromsatellite PRN24 (frame (c)), the first two havepeaks in phase scintillation corresponding tothe leading edge (in time) of the patches. Incontrast, the signal received from the thirdsatellite (PRN10) exhibits a different behavior(see frame (b)). In this case, the increase inphase scintillation is observed on the trailing (intime) edge of the patch. It is important to note,that at the current stage of investigation, it is notclear which physical edge of the patches corre-spond to the edges observed in the time history(note that the speed of motion of the piercepoint of the path from satellite to receiver andthe speed of the patches have the same order ofmagnitude, and it is therefore possible to ob-serve the physically trailing edge of a patch be-fore the leading edge). Nevertheless, the gener-al behaviour of the signals received from allthree satellites indicates that the border of theF-layer patches is occupied by smaller scaleelectron density irregularities that cause in-creases in phase scintillation.
3. Measurements
The COST 296 action has contributed tosupport and coordinate the ionospheric scintil-lation monitoring activity using high samplingrate GPS amplitude and phase measurements.Several European institutions have installed andmanaged scintillation receivers both at high and
low latitudes. A description of the monitoringactivities follows.
The INGV contributed by the project«Ionospheric Scintillations Arctic CampaignCoordinated Observation (ISACCO)». ISAC-CO was born at the beginning of 2003 as a pro-posal submitted to the call for opportunity2003–2004 for access to the CNR (Italian Na-tional Research Council) Arctic Italian station«Dirigibile Italia» (79.9N, 11.9E, Ny Alesund,Svalbard, Norway). After a positive outcome ofthe application, in September 2003 the firstGISTM (GPS Ionospheric and TEC Monitor,(Van Dierendonck et al., 1993) receiver was in-stalled at Ny Alesund by INGV, Roma. In 2004,a second receiver was located about 1 km awayfrom the first one and a third receiver was set upin Longyearbyen, 125 km from the other two.In January 2006, another GISTM was installedat the «Mario Zucchelli» Italian Antarctic sta-tion, Terra Nova Bay (74.7S, 164.1E) and inJanuary 2008 another receiver was deployed atthe Italian-French Antarctic station of Concor-dia at Dome C (75.0S, 123.0E), on the Antarc-tic plateau.
In the frame of the PRIS measurement cam-paign, IEEA installed a GSV 4004 receiver inN’Djamena, Chad, in 2006, still in operation.The location was chosen to obtain data fromAfrica, in the same region as those collected bythe ESA/ESTEC receiver installed in Douala,Cameroon. The data collected from these tworeceivers have been stored into the PRIS database together with those collected by receiversoperated by University of Rennes in Vietnam,CLS company (Toulouse) in Cayenne, GMVcompany (Madrid) in the Canary Islands andDLR (see table I).
The three DLR receivers are installed athigh (Kiruna, Sweden) and low latitudes (Puer-to de la Cruz, Tenerife, Canary Islands andBandung, Indonesia). The GNSS receiver inKiruna is a 50Hz Javad Legacy EGGD receiverwhich was installed in October 2004. A receiv-er of the same type was installed in Bandungand has been operational since December 2005.At Tenerife a 50Hz Topcon Legacy EGGD+ re-ceiver was installed at the end of August 2006on the rooftop of a lighthouse in the harbour ofPuerto de la Cruz de Tenerife. The raw data
Vol52,3,2009 20-09-2009 19:06 Pagina 396

397
Ionospheric scintillation monitoring and modelling
sampling rate for the receiver in Bandung is re-duced to 25 Hz due to a limited internet band-width. The receiver in Tenerife is working inonline mode with both, 25 or 50 Hz. All raw da-ta from Kiruna are acquired by 50Hz in onlinemode. For steering processes of the sensors aswell as the data exchange the so called Experi-
mentation and Verification Network (EVnet) ofDLR is used. EVnet is a near real-time networkbased on modular configurable and adaptablehardware and software components. The mainfunctionality is to acquire and process GNSSsignals as well as corresponding environmentalinformation. The network structure of the
Table I. Monitoring activity of the institutions involved in the COST 296 community.
Station Coordinates Samp. Data interval Data flow Institution
NyAlesund0 78.9N 11.9E 50Hz From Oct 2003 ftp 15 min INGV Rome
NyAlesund1 78.9N 11.8E 50Hz From Nov 2006 ftp 15 min INGV Rome
Longyearbyen 78.1N 16.0E 50Hz From Nov 2006 ftp 15 min INGV Rome
Hornsund1 77.0N 15.0E 50Hz From Sep 2007 ftp SRC – PAS Warsaw
Hornsund2 77.0N 15.0E 50Hz From Sep 2007 ftp SRC – PAS Warsaw
Hornsund3 77.0N 15.0E 50Hz From Sep 2007 ftp SRC – PAS Warsaw
Bandung 6.9 S 107.6 E 25Hz From Dec 2005 DVD DLR
Kiruna 67.8 N 20.4 E 50 Hz From Oct 2004 On line DLR
Puerto de la Cruz 28.4 N 16.5 W 50 Hz From Sep 2006 On line DLR
Trondheim 63.4N 10.4E 50Hz From Dec 2007 On line IESSG – Un. Nottingham
Nottingham 52.9N 1.2W 50Hz From Jun 2001 ftp 15 min IESSG – Un. Nottingham
Warsaw 52N 21E 50Hz From Sep 2007 ftp SRC – PAS Warsaw
Dourbes 50.1N 4.6E 50Hz From May 2006 DVD IESSG – Un. Nottingham
El Arenosillo 37.1N 6.8W 50Hz In progress ftp 15 min INGV Rome
Chania 35.5N 24.1E 50Hz From Jun 2007 ftp 15 min INGV Rome
Hue 16.4N,107.6E 50Hz From Jan 2006 DVD IETR Rennes
HoChiMinh 10.8N 106.5E 50Hz From Mar 2005 DVD IETR Rennes
Douala 3.7 N 9°7 E 50 Hz 2004 – 2005 CD ESA / ESTEC
N’Djamena 12.1°N,15.07°E 50Hz From Oct 2006 CD IEEA Paris
Cayenne 4.82°N 52.36W 50Hz From Jul 2006 Daily ftp CLS Toulouse
BTN 74.7S 164.1E 50Hz From Jan 2006 Daily ftp INGV Rome
DomeC 75S 123E 50Hz From Jan 2008 Daily ftp INGV Rome
Vol52,3,2009 20-09-2009 19:06 Pagina 397

398
Y. Beniguel, V. Romano, L. Alfonsi, M. Aquino, A. Bourdillon, P. Cannon, G. De Franceschi, S. Dubey, B. Forte, V. Gherm, N. Jakowski, M. Materassi, T. Noack, M. Pozoga, N. Rogers, P. Spalla, H.J. Strangeways, M. Warrington, A. Wernik, V. Wilken and N. Zernov
EVnet implies the possibility to provide thesedata to internal and external users of the net-work by specific services. Because theJavad/Topcon receivers at real time sensor sta-tions are not be able to deliver scintillationbased data directly (in comparison to GSV4004 receiver that contains specific firmware todo this) specific software tools were developedby DLR and GMV to convert binary data intoan ASCII data stream and to compute scintilla-tion values based on the input values comingfrom the Javad/Topcon receivers.
SRC has installed three GISTM receiver atthe Polish Polar Station (PPS) sited in the re-gion of the Hornsund Bay in southern Spitsber-gen (77.00° N, 15.55° E, CGM latitude 74.11°N) (Wernik et al., 2008). This location allowsstudy of the ionosphere, depending on the localtime and magnetic activity, in the auroral zone,dayside cusp and polar cap regions. The threeantennae and GISTM receivers are installed atthe nodes of the right-angle triangle with thelegs 93 and 98 m long. One of the legs is paral-lel to the geographic meridian. Note that themagnetic declination in Hornsund is small(+3.1° CGM) therefore the geographic meridi-an almost coincides with the magnetic meridi-an. Raw data from all three receivers are storedon a hard disc with a capacity of 500 GB. Thisis sufficient to store more than a year of data.Software supplied with the receivers performsdetrending of phase and amplitude data. Fromthe detrended signal various statistical parame-ters are derived, which together with a numberof utility parameters are output every minuteand transmitted via satellite Internet to theSpace Research Center (SRC) in Warsaw. SinceOctober 2007 the post-processed data havebeen available on the web. Spaced-receiverscintillation technique has been used fordecades to measure the drift, orientation andshape of irregularities, and the height of the ir-regularity layer. Numerous measurements havebeen carried out in the equatorial and high lati-tude regions, using radio transmissions fromlow orbiting and geostationary satellites (e.g.Livingston et al., 1982; Rino and Livingston,1982; Wernik et al., 1983; Costa et al., 1988;Basu et al., 1991; Bhattacharyya et al., 2001;Tiwari et al., 2006). It should be noted that low
orbiting satellites are more appropriate for pro-viding information on the anisotropy of irregu-larities. In this case, it is difficult to derive theirregularity drift velocity from the measureddrift of the diffraction pattern controlled main-ly by the fast satellite motion.
The quasi-stationary GPS satellites offer anopportunity for continuous monitoring of ionos-pheric drifts and irregularity anisotropy usinginexpensive equipment. Most GPS-based meas-urements have been made at low latitudes to es-timate the ionospheric zonal irregularity veloci-ties (e.g. Kil et al., 2000; Kintner et al., 2001;2004; Ledvina et al., 2004; Otsuka, 2006).
The Institute of Engineering Surveying andSpace Geodesy (IESSG) of the University ofNottingham pioneered GPS ionospheric scintil-lation monitoring in Europe with GISTM re-ceivers. Between June 2001 and December 2003four units were installed at stations in the UKand Norway, covering geographic latitudes from53oN to 70oN approximately. That project wasfunded by the Engineering and Physical Sci-ences Research Council (EPSRC) in the UK andextensive ionospheric scintillation and TEC datawere collected and analysed. Due to operationallimitations no high rate data was stored andanalyses were based solely on the ionosphericscintillation indices, focusing on statisticalanalyses and impact for GNSS users (Rodrigueset al., 2004; Aquino et al., 2005a; 2005b). Theseunits were deactivated in 2004 and were later re-deployed at Nottingham (52.90oN, 1.20oW),Dourbes (50.10oN, 4.60oE, in collaboration withthe Royal Meteorological Institute of Belgium)and Trondheim (63.40oN, 10.40oE), where cur-rently high rate (50 Hz) data as well as scintilla-tion parameters are being recorded (please referto the table below). Associated with all data col-lected by the IESSG, range data that can be con-verted to the RINEX (Receiver INdependentEXchange) format has also been recorded.
4. The modelling activity
4.1. GISM phase screen model
IEEA has developed the GISM model whichis a mixed climatological/physical model. It
Vol52,3,2009 22-09-2009 17:29 Pagina 398

399
Ionospheric scintillation monitoring and modelling
calculates mean errors and scintillations due topropagation through the ionosphere (Béniguel,2002). Mean errors are obtained by a ray tech-nique using the values of the ionosphere elec-tronic density. This last is obtained withNeQuick model which is included in GISM.
The line of sight being determined, the fluctua-tions are calculated in a second stage using amultiple phase screen technique.
The standard deviations of intensity (S4) andphase (sigma phi) at ground level are calculat-ed. GISM model allows considering either a
Fig. 7. Model-measurements comparisons (PRIS measurement campaign 2006-2007).
Fig. 8. Comparisons model-measurements in Vietnam and Indonesia.
Vol52,3,2009 22-09-2009 17:29 Pagina 399
400
Y. Beniguel, V. Romano, L. Alfonsi, M. Aquino, A. Bourdillon, P. Cannon, G. De Franceschi, S. Dubey, B. Forte, V. Gherm, N. Jakowski, M. Materassi, T. Noack, M. Pozoga, N. Rogers, P. Spalla, H.J. Strangeways, M. Warrington, A. Wernik, V. Wilken and N. Zernov
trajectory described by a list of successivepoints or a constellation (GPS, Galileo orGlonass). An orbit generator has been intro-duced for this capability. The input in that caseis the Yuma file. GISM also produces scintilla-tion maps as presented on the left panel of fig.8. Figure 7 below shows a comparison of meas-urements and modeling in Vietnam during thetwo years of the PRIS measurement campaign.
Four receivers were located in Vietnam andIndonesia, practically at the same longitude.The measurements recorded have been put onthe same plot (cf. fig. 8). It shows the globalpattern. The horizontal stripes between -25°and -10° and between 4° and 10° correspond tothe multi-paths in Hanoï and Bandung. Themodelling results obtained with GISM model(v. 6.45) are given for comparison and show areasonable agreement.
4.2. Hybrid scintillation propagation model
Throughout the duration of the COST 296Action, the St. Petersburg-Leeds team workedto develop its own scintillation propagationmodel for transionospheric paths of propaga-tion. The initial version of this model, valid forthe case of smoothly inhomogeneous back-ground ionosphere (but not containing mid-
scale local inhomogeneities), is particularly ap-propriate for describing a wide variety of situa-tions, including the case of strong scintillationand values of the fractional electron density upto 100% for operating frequencies of 1GHz andabove (Gherm et al., 2005a). (Some additionalmaterial clarifying the content of this paper canalso be found in the companion paper Gherm etal., 2005b). This is found to be possible be-cause, according to our estimates, at this rangeof frequencies the regime of strong scintillationnever occurs inside the ionospheric layer.Therefore, the perturbation theory can be em-ployed to describe the propagation in the iono-sphere and then the field immediately below theionosphere can be determined. Since strongscintillation may well occur for propagation be-low the ionosphere, to convey the field calculat-ed for the level located immediately below theionosphere down to the Earth’s surface, thegeneral theory of the random screen is em-ployed. We term this approach the hybrid scin-tillation propagation model. Different scintilla-tion effects have been described and assessedwithin the range of validity of the developedmodel and these results were presented at anumber of workshops and international confer-ences (Gherm et al., 2006, 2007a,b; Strange-ways et al., 2006).
Recently the hybrid model has been further
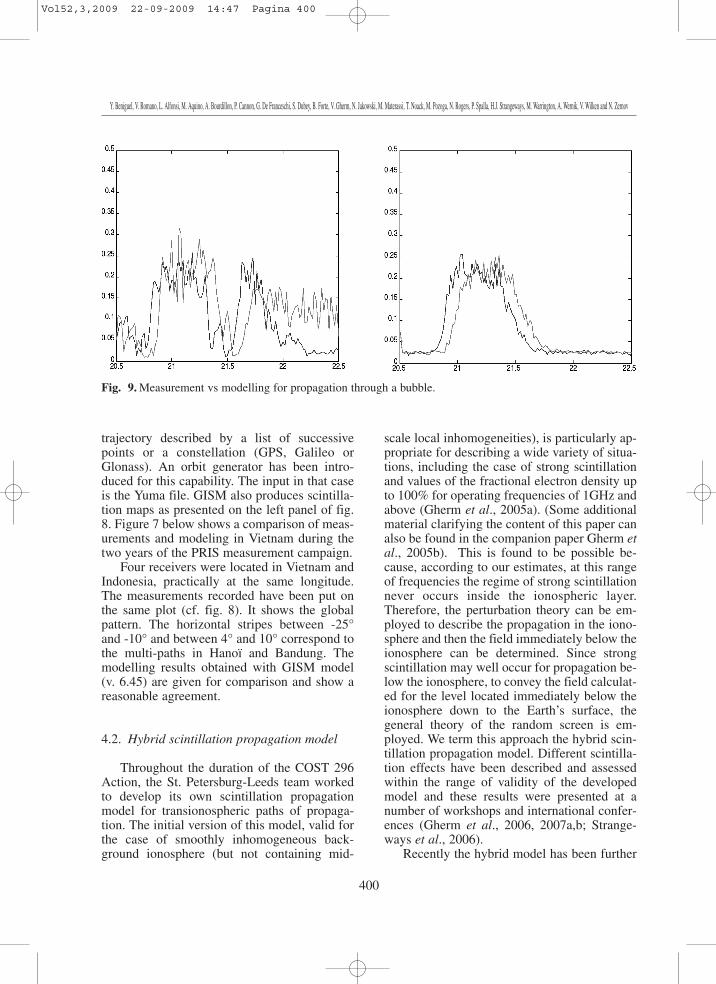
Fig. 9. Measurement vs modelling for propagation through a bubble.
Vol52,3,2009 22-09-2009 14:47 Pagina 400
401
Ionospheric scintillation monitoring and modelling
extended to enable a description of the propaga-tion effects due to local mid-scale (meso-scale)ionospheric inhomogeneities, e.g. bubbles ofthe low-latitude ionosphere, or patches at highlatitudes. The effects for these cases differ es-sentially from effects in the mid-latitude iono-sphere because of the occurrence of the movinglocal inhomogeneities which make the stochas-tic signal essentially statistically non-homoge-neous. Because of this, the hybrid propagationmodel has been significantly modified to ac-count for the effects arising in statistically non-stationary conditions. The extended method hasenabled modelling of a number of scintillationeffects typical for the high-latitude and low-lat-itude ionospheres. The effects due to bubbles ofthe equatorial ionosphere were described andpresented in Gherm et al., 2007c,d,e; Strange-ways et al., 2007a,b and Zernov et al., 2008a,band possible scintillation effects due to patchesin the polar ionosphere were described in Mau-rits et al., 2008 and Zernov et al., 2008a,b.
A very good agreement was achieved be-tween the experimental data of the scintillationeffects due to bubbles and the results of model-ling for the same receiver, location, time andconditions. To illustrate this, the two panels infig. 9 (from Zernov et al., 2008b) presented be-low show the experimental results for the scin-tillation index S4 (courtesy of Dr. B. Arbesser-Rastburg, ESA-ESTEC) and the results of sim-ulation of the enhancement of S4 caused by abubble observed at Douala, Cameroon (400’ N,9042’ E). The variation of the S4 scintillation in-dex is shown for the received signal from twodifferent satellites of the GPS constellationPRN26 (blue) and PRN29 (green) visible on 7June 2004 at Douala, Cameroon in the periodfrom 20.5 h to 21.5 h. In the left panel the ex-perimentally measured time dependence of thescintillation index S4 is presented. The mostpronounced peak of scintillation in both curvescorresponds to a time period around 21:00. Forthis time the elevation angles of the satellitesare 750 and 800. The results of modeling theseevents in the framework of a single bubble scin-tillation propagation model are shown in theright panel. A fairly good correspondence ofthe theory to the experimental results is ob-served, including values of S4, time of start and
finish, and relative delays of the scintillationpatterns for the two satellites.
The comprehensive description of the rangeof possible applications of the extended St. Pe-tersburg-Leeds scintillation propagation modelwas given in the presentation Zernov et al.(2008b) at the IES2008 at Alexandria, Virginia,USA in May, 2008.
In conclusion, a fairly advanced scintillationpropagation model for transionospheric paths ofpropagation has been developed, capable of de-scribing a wide variety of the ionospheric condi-tions of propagation and geometry. It is valid fora range of frequencies where the regime ofstrong fluctuations does not occur inside the in-homogeneous ionospheric layer. The model ac-counts for both quasi-regular and random ionos-pheric structures including the most complicat-ed situations of the low-latitude ionosphere(bubbles) and high-latitude ionosphere (patches,blobs, etc.). It generates random time series of areceived signal and determines its statistical mo-ments (power spectra, correlation functions,scintillation index, etc.). All this comprises thebasis for the simulation of the stochastic signalson transionospheric paths of propagation.
4.3. Amplitude radio scintillation model
The climatological model of amplitude ra-dio scintillation Wernik-Alfonsi-Materassi(WAM) was presented in 2005 in the publica-tion Wernik et al. (2007) (see also Wernik et al.(2004)), and discussed extensively within theCOST community during the workshop«Ionospheric scintillation: scientific aspects,space weather application and services, from 20to 22 February 2008 at the University of Not-tingham, with the talk Materassi et al. (2008).
The WAM model is a model of radio scintil-lation in which the action of the irregular iono-sphere on the radio signal is mimicked via aphase screen. The statistics of this phase screenis constructed analyzing the in situ data of fluc-tuations DN of the ionization density as meas-ured by the satellite Dynamics Explorer 2 (DE-2). The assortment of helio-geophysical condi-tions covered by the three years of mission ofthe DE-2 determines the climatological charac-
Vol52,3,2009 22-09-2009 14:47 Pagina 401

402
Y. Beniguel, V. Romano, L. Alfonsi, M. Aquino, A. Bourdillon, P. Cannon, G. De Franceschi, S. Dubey, B. Forte, V. Gherm, N. Jakowski, M. Materassi, T. Noack, M. Pozoga, N. Rogers, P. Spalla, H.J. Strangeways, M. Warrington, A. Wernik, V. Wilken and N. Zernov
ter of the WAM model. As far as the back-ground ionosphere N0 is concerned, the IRI-95model has been adopted, with corrections forthe topside where the values of N0 given by IRI-95 are clearly unreliable (e.g. at very high lati-tudes).
The WAM model is able to predict the val-ue of the index S4 along an assigned radio link,given the helio-geophysical conditions of thislink: in its present version, WAM classifies thedifferent helio-geophysical conditions accord-ing to the only parameter Kp. The WAM modelalso predicts the confidence with which the val-ues of S4 given should be intended.
Figure 10 reports the results of the WAMprediction for the radio links from GPS satel-lites down to Tromsø and Sondre Stromfjord, inwinter conditions for Kp � 3: this is an exampleof how the model works.
The validation of the model has been initi-ated and has already given encouraging re-sults, as one can see from fig. 11, where thebehavior of S4 as a function of the UT con-structed by the WAM model is compared withthe one of real data, as reported in the paperquoted in the figure.
4.4. Trans Ionospheric propagation simulator
Measurements of scintillation on radar targetreturns were made using the ALTAIR satellite-tracking radar on Kwajalein Island (9.4°N,166.8°E) during 2005/6 (Cannon et al., 2006).The radar tracked low earth orbiting (LEO) cal-ibration spheres of uniform radar cross section(RCS) using chirp waveforms at 158 MHz (7MHz bandwidth) and 422 MHz (18 MHz band-width) with a pulse repetition frequency (PRF)of around 285Hz. The complex impulse re-sponses were recorded for contiguous se-quences of 1024 chirp returns and by taking aFourier transform in each range cell (group de-lay bin) each 3.6-second sequence was present-ed as a single channel scattering function (CSF)which mapped the power of the radar returnsagainst both the group delay and the Dopplerfrequency. The S4 index was also measured from10-second intervals of RCS measurements. Un-der conditions of strong scintillation (high S4)the CSF exhibited a «parabolic» spread of thepower towards increasing excess delay with in-creasing positive or negative Doppler (see ex-ample in figs. 12a and b) (Rogers et al., 2008).
Fig. 10. An example of the prediction possible via the WAM model, giving the amplitude scintillation indexwithin the field of view of an assigned station for certain helio-geophysical conditions.
Vol52,3,2009 22-09-2009 14:47 Pagina 402

403
Ionospheric scintillation monitoring and modelling
Fig. 11. A preliminary validation study for the model WAM, in which the values of the S4 index predicted by itare compared with those from real data reported in the paper Su. Basu et al., Radio Sci., v. 20, 347, 1985 quoted.
Fig. 12. Channel Scattering Functions of ALTAIR radar returns from a calibration sphere at 10:06 UT on 18January 2005 at (a) 158 MHz and b) 422 MHz. Corresponding TIRPS predictions (normalised to 0 dB m2) areshown for c) 158 MHz and d) 422 MHz, appropriate to a PRF=262 Hz, elevation θ=24°, azimuth=9°,CkLsec(θ)=1035, veff =1604 ms-1, p=2.5 and Lo=10 km.
• WAM-predicted S4
compared with the real data as a function of UT:good agreement with theresults by Basu et al.,(continuous line Kp � 3,dashed lines Kp > 3.
Vol52,3,2009 22-09-2009 14:47 Pagina 403

404
Y. Beniguel, V. Romano, L. Alfonsi, M. Aquino, A. Bourdillon, P. Cannon, G. De Franceschi, S. Dubey, B. Forte, V. Gherm, N. Jakowski, M. Materassi, T. Noack, M. Pozoga, N. Rogers, P. Spalla, H.J. Strangeways, M. Warrington, A. Wernik, V. Wilken and N. Zernov
This effect was more pronounced for the lower-frequency waveform (158 MHz).
To simulate these radar measurements Rogerset al. (2008) developed a thin phase screen, split-step Parabolic Equation technique called theTrans-Ionospheric Radio Propagation Simulator(TIRPS). The spectrum of the phase screen was afunction of three variables: the integrated strengthof turbulence, CkL; the spectral index, p; and theouter scale, Lo. TIRPS reproduced the observedparabolic spreading of the power in the CSF underconditions of high CkL (see example figs. 1c andd) and it was demonstrated that a lower value of p(representing greater power in the smaller-scale ir-regularities) produced a greater distribution ofpower into the parabolic «horns» of the CSF, pre-sumably as a result of stronger forward scatteringby small-scale irregularities. The Doppler separa-tion of the CSF horns increased with higher effec-tive scan velocity of the ionospheric pierce point,veff (as defined by Rino (1982).
Rogers et al. (2008) calculated the delay andDoppler spreads from the measured and simulat-ed CSFs and determined the coherence bandwidth(CB) and coherence time (CT) respectively fromthe reciprocals of these spreads. The measured co-herence times (CT) decreased exponentially withS4 (422 MHz) and, up to an S4 of 2.2 (indicativeof Rayleigh fading on a correlated two-way chan-nel), the TIRPS simulations matched this trend us-ing a phase screen with p=3. A higher spectral in-dex (p=4) was required to simulate the CTs ob-served for S4 higher than 2.2; this representsstrong focusing conditions. There was a generaldecrease in CT for higher values of veff and thesimulations provided a good fit to the CT trendwith S4 where an appropriate value of veff was usedin the simulation. These results showed that withan appropriate choice of phase screen parameters,the TIRPS simulator could be used to assist thedesign and operation of trans-ionospheric radarsperforming coherent pulse integration.
5. Advances in scintillation studies
5.1. Wavelet Analysis
Considering that radio scintillation is a non-stationary phenomenon which is better de-
scribed locally than globally with time, thechoice of analyzing amplitude scintillation viacontinuous and discrete wavelets was made.
Both the continuous and the discretewavelet analyses (CWA and DWA) have beentried on amplitude scintillation studies, for twodifferent purposes. CWA is useful to producevery eloquent scalograms where the energy dis-tribution of the signal, as a function of the timescale, is seen to evolve with time. This visuali-zation allows the location and study of the ma-jor singularities and inter-scale processes of theradio scintillation. Figure 13 reports a typicalscalogram. First of all, the time-behavior of thesignal may be studied as depending on the timescale: on the average, smooth features between100 s and 1000 s may be considered the rem-nants of the initial «trend» of the signal, fea-tures between 0.4 s and 100 s are likely to con-tain the full information on the turbulence ofthe medium, while features below the 0.4 sshould be pure (instrumental) noise. It is how-ever remarkable that these scale bands may de-pend on time: the «turbulent» region elongatesdown to scales as small as 0.1 s in correspon-dence of big bursts, for instance at about 13’from the beginning of the time series reported.
Another interesting visualization allowedfor by CWA is to single out periodic features ofnon-geophysical origin, like unwanted inter-satellite interference or multipath. This is theexample reported in fig. 14 (Materassi, 2008),where the «U-features» along the same link arerepeating themselves day after day with a sider-al day periodicity, and are likely to be due tosuch non-geophysical effects.
The usefulness of DWA is instead mainly infiltering, i.e. denoising and detrending the sig-nal. Considering the three-band structure dis-cussed for fig. 13, the extraction of the part ofthe signal containing the most turbulence infor-mation might be done by filtering out thesmoothest part and the noisiest part of thescalogram. This could be done in principle viaFourier band filtering, but discrete wavelet bandfiltering is preferred because it better fits such atime-varying signal. In the paper (Materassi etal., 2009) the average continuous wavelet pow-er is calculated using three different detrendingtechniques, as a function of the time scale.
Vol52,3,2009 22-09-2009 14:47 Pagina 404

405
Ionospheric scintillation monitoring and modelling
Then, scale by scale the spread Σ(l) of thesevalues is calculated and plotted, as in fig. 15.
The threshold scale l1/2 defines the scale atwhich the relative spread becomes equal to 0.5.Results like those in fig. 15 lead the authors of(Materassi et al., 2007) to assess that the prob-ably best way of selecting the part of the signalencoding the information on the turbulentmedium is to filter it via DWA within a timescale band [lmin, lmax]: lmin � 0.02s and lmax is be-tween 20 s and 30 s. Below lmin one has essen-tially noise of probably instrumental origin, andabove lmax the features are given by the regularbehavior of the ionosphere on large scales,hence non interesting for turbulence analysis.
Taking advantage of data collected using thesame type of instruments (i.e. GISTM receivers),
the Istituto Nazionale di Geofisica e Vulcanolo-gia (INGV) and the Institute of Engineering Sur-veying and Space Geodesy (IESSG) of the Uni-versity of Nottingham are cooperating to per-form statistical studies on their data acquired atcusp, auroral and middle latitudes. The behav-iour of the scintillation occurrence as a functionof the magnetic local time and of the correctedmagnetic latitude is under investigation to char-acterize the scintillation climatology. The aim ofthis type of analysis is, once developed over a ro-bust data set, to provide information useful forthe development of nowcasting and forecastingalgorithms. The first results of the analysis con-firm that the scintillations occur primarily duringthe equinoxes and around magnetic noon andmidnight, but also reveal interesting features in-
Fig. 13. An example of scalogram from CWA for amplitude scintillation signals.
Fig. 14. Sideral-periodic features in a scalogram, probably of non-geophysical origin.
Vol52,3,2009 22-09-2009 14:47 Pagina 405

406
Y. Beniguel, V. Romano, L. Alfonsi, M. Aquino, A. Bourdillon, P. Cannon, G. De Franceschi, S. Dubey, B. Forte, V. Gherm, N. Jakowski, M. Materassi, T. Noack, M. Pozoga, N. Rogers, P. Spalla, H.J. Strangeways, M. Warrington, A. Wernik, V. Wilken and N. Zernov
dicating some MLT sectors not being affected byscintillation events (Spogli et al., 2009). Otherstatistical studies made by comparing thebackscattered echoes acquired by the CUTLASSradars of the SuperDARN (SD) chain and thescintillation measurements over Ny Alesundhave demonstrated that it is possible to revealsignatures of the cusp position by looking at thecorrespondence (in MLT and MLat) between theSD backscattering and the enhancement of thescintillation activity (Coco et al., 2007).
5.2. High latitude scintillations
Work at the IESSG, by Rodrigues et al.(2004) and Aquino et al. (2005a), was aimed atcharacterising the occurrence and magnitude ofscintillations over Northern Europe based on along-term data set of scintillation indices(2001-2003). Figure 16 (from Aquino et al.,2005a) shows the curves of the complement ofthe cumulative frequency of occurrence ofphase and amplitude scintillation values for sta-tion Bronnoysund (~65oN) for all days of 2003,for elevation angles over 15o [phase and ampli-tude scintillation are represented respectivelyby the indices σφ and S4]. The curves are pre-sented in 3-hour time bins, to enable correlationanalyses with the 3-hour Kp. The right plotshows that values of S4>0.5 barely occurred inBronnoysund, whereas occurrence of σφ >0.5
was significantly higher (left plot), with valuesreaching 5% of the time on many days, espe-cially during the night time sectors. Similaranalyses at Hammerfest (~71oN) show that oc-currence of S4>0.5 very rarely exceeded 1% onany particular day of 2003. However, as atBronnoysund, occurrence of σφ >0.5 at Ham-merfest reached over 5% on many days. Analy-ses carried out for Nottingham (~53oN) andBergen (~60oN), showed significantly lowerprobabilities. Figure 17 shows the correlationof the maximum daily occurrence of σφ >0.5 for3-hour time bins with the maximum daily valueof Kp for every day of 2002 (left) and 2003(right) at Bronnoysund. Correlation is observedat Bronnoysund, in particular during 2003,when a greater number of Kp>6 occurred. Fur-ther details of these analyses can be found inAquino et al. (2005a).
In the interest of GPS applications requiringhigh levels of availability, long-term analyseswere conducted at the IESSG on the probabilityof a number of GPS satellites simultaneouslyobserving high levels of phase scintillation (Ro-drigues et al., 2004 and Aquino et al., 2005a).The aim was to assess the threat this would rep-resent in case a certain level of phase scintilla-tion leads to loss of satellite lock. It was foundthat there was a probability of about 0.1% of 2satellites being simultaneously affected by σφ
>0.5, when all of the 2002 scintillation data forHammerfest was analysed. When the 2003 data
Fig. 15. The relative spread of the average continuous wavelet power as a function of time scale, among theamplitude scintillation signals detrended in three different ways (see Materassi et al., 2007).
2.0
1.5
1.0
Rel
ativ
e S
prea
d
Scales in secondsThreshold scale in s: 38.801
0.5
0.00.01 0.10 1.00 10.00 100.00 1000.0
Vol52,3,2009 22-09-2009 14:48 Pagina 406

407
Ionospheric scintillation monitoring and modelling
is analysed a probability of about 0.25% of 2satellites being simultaneously affected by σφ >0.5was observed, amounting to about 22 hourswithin the one year period. Similar analysis car-ried out for a 2-day period under severe geomag-netic conditions, during October 29th and 30th,2003, shows a probability of about 3% of 2 satel-lites observing σφ >0.5 simultaneously. In fact,under such severe conditions there was a proba-bility of 1% of 3 satellites observing σφ >0.5 si-multaneously. Critically, over the 2-day period,1% represents 30 minutes in absolute terms, afigure of concern for safety-critical applicationsif these levels of phase scintillation lead to lossof satellite lock. More discussion on this is foundon the references above.
A different scintillation index for high latitudes
Data from the GPS scintillation monitorbased on 50 Hz measurements recorded at Diri-gibile Italia Station (Ny-Alesund, Svalbard) areused to investigate on the possible adoption ofan alternative parameter for the estimate ofphase fluctuations. This parameter is defined asthe standard deviation of the phase rate ofchange (Forte B., 2005):
St
2
22φ
=z c m
The selected time intervals refer to 2007 andare related to disturbed conditions (-70 nT <Dst < -40 nT, Kp > 4) and to different seasons(table II). After selection and visualisation bymeans of the web tool provided by the INGV(Romano et al., 2008), the indices were beencalculated by using raw data directly. Some rep-resentative events are also shown in fig. 18where the scintillation indices, S4, σφ, and Sφ arecalculated by means of a sixth order Butter-worth filter (similar to what routinely done bythe scintillation monitor) for three different de-trending conditions: 0.1 Hz (solid line), 0.3 Hz(dotted line), and 0.5 Hz (dashed line) (ForteB., 2005). Also, the rate of change of TEC(TECu/min) is calculated when both L1 and L2are on lock: data gaps in the rate of change ofTEC are due to a loss of lock on L2. As one cansee from table II, σφ may reach large values(around 1 radian) during particularly disturbedconditions. Large values of σφ are measured bya larger number of satellites during disturbedconditions. The increase in the classical phasescintillation index σφ corresponds to an increasein TEC fluctuations. Nevertheless, during theseevents Sφ and S4 have an almost constant behav-iour with values always below a given thresh-old. Although both S4 and Sφ show some slightmodifications when the detrending cut-off fre-quency is changed, the phase scintillation index
Fig. 16. Cumulative frequency of occurrence of phase and amplitude scintillation values for station Bronnoy-sund (~65oN) for year 2003.
Vol52,3,2009 22-09-2009 17:35 Pagina 407

408
Y. Beniguel, V. Romano, L. Alfonsi, M. Aquino, A. Bourdillon, P. Cannon, G. De Franceschi, S. Dubey, B. Forte, V. Gherm, N. Jakowski, M. Materassi, T. Noack, M. Pozoga, N. Rogers, P. Spalla, H.J. Strangeways, M. Warrington, A. Wernik, V. Wilken and N. Zernov
σφ appears to be critically dependent on this. Inall the case studies here considered, σφ en-hancements correspond to a loss of lock on L2.The classical phase scintillation index σφ, cal-culated by means of the standard cut-off fre-quency (0.1 Hz), shows large values in the pres-ence of large TEC fluctuations, which lead toloss of lock on L2. These large values arestrongly reduced when other cut-off frequen-cies are adopted. The proposed parameter Sφ
provides information on the additional Dopplercaused by small scale plasma density irregular-ities on GPS signals. Moreover, Sφ seems to bemuch more independent from the cut-off fre-quency choice and could offer a tool for retriev-
ing physical information on the irregularitiescausing scintillation, such as the effective driftvelocity.
5.3. Scintilation maps
Although the data availability for mappingsmall scale structure-related scintillations israther poor, DLR has started developing amethod for generating scintillation maps. Thetechnique is analogous to the TEC mappingtechnique developed and used in DLR since1995 (Jakowski, 1996; 1998). Basically, thescintillation maps are created by assimilating
Table II. All the events analysed in 2007. The σφ values are divided into intervals, according to the phase scin-tillation levels that occurred on a particular day. The PRN column shows the number of satellites which meas-ured a σφ in a given range and during a given UT period (UT column) for that particular day. Corresponding val-ues for TEC fluctuations, Sφ and S4 are given in separate columns.
Day Phase PRN UT ∆TEC / ∆t Sφ S4
Scintillation (TECu/min) (rad/s)
2007-01-28 σφ < 0.3 all 00-24 < 0.5 < 2 < 0.2
2007-01-29 0.3 < σφ < 0.6 8 12-13; 18-19 < 1 < 2 < 0.20.6 < σφ < 0.9 2 21-00 < 1.5 � 2
0.3 < σφ < 0.6 10 06-12; 21-23 < 12007-01-30 0.6 < σφ < 0.9 5 20-00 < 1.5 � 2 < 2 < 0.2
0.9 < σφ < 1.2 2 07-08; 18-19 < 2 � 3
0.3 < σφ < 0.6 7 09-16; 21-22 < 12007-05-22 0.6 < σφ < 0.9 3 12-16; 19-20 < 1.5 � 2 < 2 < 0.2
0.9 < σφ < 1.2 3 12-15; 19-20 < 2 � 3
0.3 < σφ < 0.6 4 06-09; 19-20 < 12007-05-23 0.6 < σφ < 0.9 2 23-00 < 1.5 � 2 < 2 < 0.2
0.9 < σφ < 1.2 1 19-20 < 2 � 3
0.3 < σφ < 0.6 9 07-09; 11-13; 16-17; 21-22 < 12007-05-24 0.6 < σφ < 0.9 5 103-05; 06-08; 09-13; 16-18 < 1.5 � 2 < 2 < 0.2
0.9 < σφ < 1.2 1 06-09 < 2 � 3
2007-11-20 0.3 < σφ < 0.6 7 07-10; 20-21 < 1 < 2 < 0.20.6 < σφ < 0.9 3 07-09; 09-11 < 1.5 � 2
2007-11-21 0.3 < σφ < 0.6 7 04-08; 09-10; 20-21 < 1 < 2 < 0.20.6 < σφ < 0.9 2 04-06; 20-21 < 1.5 � 2
2007-11-22 0.3 < σφ < 0.6 10 06-07; 08-14; < 1 < 2 < 0.2
Vol52,3,2009 22-09-2009 14:48 Pagina 408

409
Ionospheric scintillation monitoring and modelling
measured data into a background model. Incase of scintillation mapping a suited scintilla-tion model such as GISM (Béniguel, 2002) isused. Although we are aware of the limitationsof the data density and model accuracy, the gen-eration of scintillation maps is useful to learnmore about mapping of scintillations. Scintilla-tions are measured along the satellite – receiverlinks. For generating 2D – scintillation maps,the link related scintillation data, e.g. S4, mustbe localized.
The measured scintillations are localized byassuming a single layer ionosphere as usuallyassumed for TEC-mapping. Doing so, the loca-tion of the measurement can be defined as thecoordinates of the pierce point between theGPS link with the ionospheric shell at height400 km as introduced earlier. The problem ofmapping scintillation data measured at eleva-tion e into equivalent vertical scintillation inten-sity which may act as a normalized reference isnot yet solved. The definition of a mappingfunction requires more detailed investigation.
Regional scintillation maps are constructedby assimilating actual GPS-based scintillationmeasurements into a well specified scintillationmodel. To ensure a high reliability of the scin-
tillation maps also in case of only a few meas-urements or at greater distances from the meas-uring points, the measured data are assimilatedinto the empirical scintillation model GISM(Béniguel, 2002). To obtain reliable scintillationvalues at the grid points, a weighting processbetween nearest measured and modelled valuesis carried out for each grid point value (e.g. gridspacing 2.5°/5° in latitude/longitude). Thismethod has the advantage that GPS users cancompute scintillation activity from the con-structed scintillation maps even in case of onlya few or even missing observations. The resultsrepresent the measured scintillation data nearthe measuring points whereas at greater dis-tances from measurements somewhat modifiedmodel values are provided. Depending on thenumber of available stations and the correlationlength, the width of the weighting function canbe modified in a proper way. The proceduremay be applied to any scintillation parametersuch as S4 or σϕ. A mapping sample is given infig. 19, where only a few measurements fromBandung were used to construct a scintillationmap for testing the procedure. Here the back-ground model was fixed to the zero plane (nohorizontal structure of scintillation activity).
Fig. 17. Correlation between Kp and phase scintillation at Bronnoysund for the years of 2002 (left) and 2003 (right).
Vol52,3,2009 22-09-2009 14:48 Pagina 409

410
Y. Beniguel, V. Romano, L. Alfonsi, M. Aquino, A. Bourdillon, P. Cannon, G. De Franceschi, S. Dubey, B. Forte, V. Gherm, N. Jakowski, M. Materassi, T. Noack, M. Pozoga, N. Rogers, P. Spalla, H.J. Strangeways, M. Warrington, A. Wernik, V. Wilken and N. Zernov
Applying a high quality scintillation model, ex-isting data gaps can be reduced in a physicalway. Since ionospheric models provide climato-logic information, actual measurements mayconsiderably deviate from the model. Whenconstructing the scintillation maps, the correc-tion is provided by the measurements. The moremeasurements are available, the higher the spa-tial resolution of the maps.
5.4. Mitigation techniques
Although the scintillation indices S4 and σφ
represent a practical measure of the intensity ofamplitude and phase scintillation affectingGNSS receivers, they do not provide sufficientinformation regarding the actual tracking errorsthat degrade GNSS receiver performance whenscintillation occurs. Suitable receiver tracking
models, sensitive to scintillation (Conker et al.,2003), allow the computation of the variance ofthe output error of the receiver PLL (PhaseLocked Loop) and DLL (Delay Locked Loop),which better expresses the quality of the rangemeasurements used to calculate position. Thecapability of incorporating phase and amplitudescintillation effects into the variance of thesetracking errors allows the application of relativeweights (based on the inverse of these variances)to measurements from different satellites. Thisproposed mitigation technique gives the leastsquares stochastic model used for position com-putation a more realistic representation, in par-ticular in a scintillation scenario, where theionospheric irregularities affect each satellitedifferently. Collaboration involving the IESSG,UNESP (Sao Paulo State University, Brazil) andINGV has led to some promising results usingthis approach. Improvement in the height error
Fig. 18. TEC fluctuations and scintillation indices for PRN02 pass from 0700 to 0800 UT on the day 2007-01-30.
Vol52,3,2009 22-09-2009 14:48 Pagina 410

411
Ionospheric scintillation monitoring and modelling
when the technique is applied to relative posi-tioning based on GPS C1 and P2 pseudorangesfor baselines ranging from 1 km to 750 km, atlatitudes from ~50oN to ~79oN, under differentgeomagnetic conditions (4 � Kp � 6), variedbetween 17% and 38%.
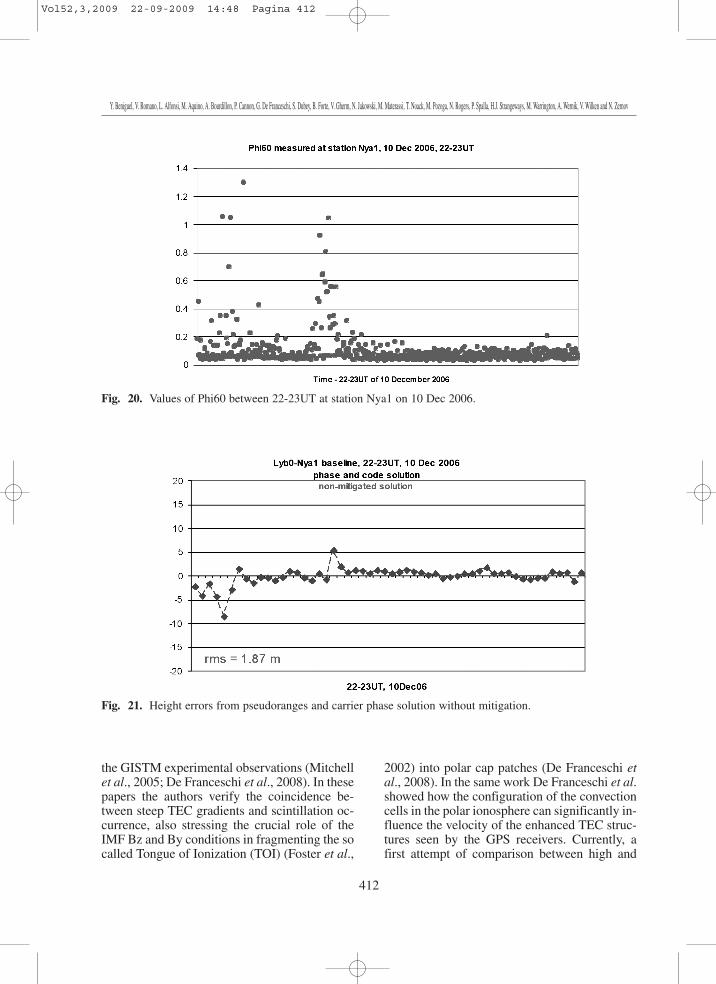
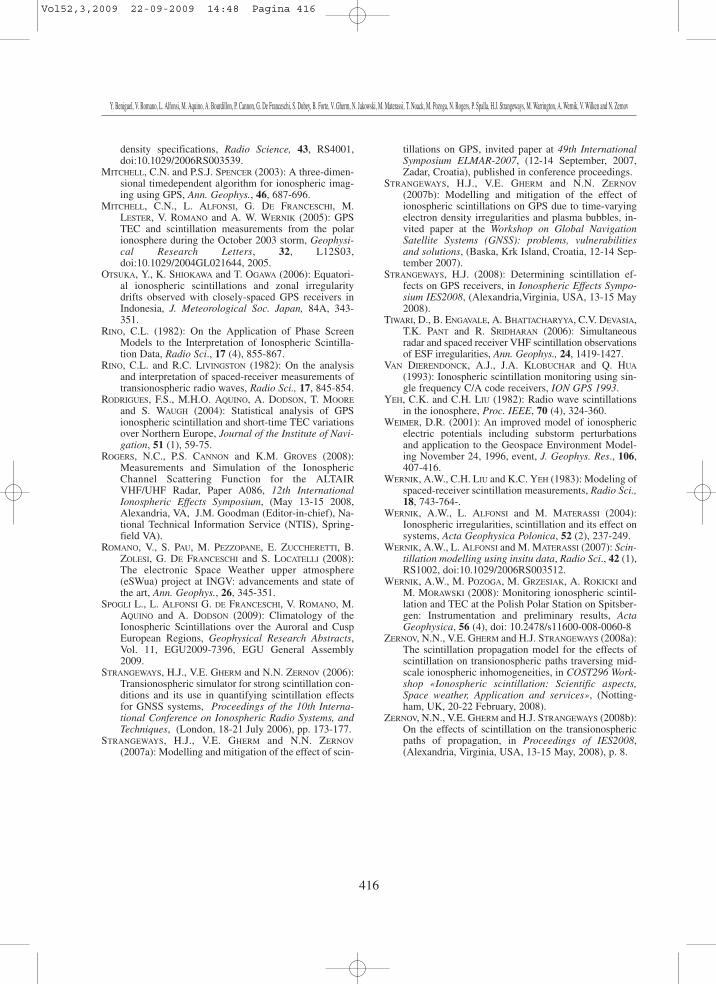
To implement this mitigation approachwhen the carrier phase observable is involved itis necessary to access the power spectral densi-ty (PSD) of fluctuations in the carrier phaseoutput, which is possible with the use of highrate data. Experiments were conducted byAquino et al. (2008) where a mitigated solutionbased on pseudorange and carrier phase meas-urements was implemented and compared withthe non-mitigated solution, for a baseline of~125 km between the INGV stations inLongyearbean (Lyb0) and Ny Alesund (Nya1).During a period of occurrence of high phasescintillation (fig. 20) it was observed that prob-lems related to ambiguity resolution affectingpositioning accuracy (height in particular) werereduced by the use of the proposed mitigatedsolution (figs. 21 and 22).
Details of these experiments are given inAquino et al. (2009) and should be regarded asproof of concept. For practical future use of themethod it is envisaged that the strategy pro-
posed in Aquino et al. (2007) and further dis-cussed in Strangeways (2008) may be applied.
5.5. Case studies
The investigation of case studies plays a cru-cial role in the understanding of the physicalmechanisms causing scintillations on the signalpassing through the ionospheric plasma. Thescintillation effects, in fact, can be due to sever-al phenomena such as electron precipitations,steep TEC gradients due to the presence ofpatchy irregularities, plumes of enhanced ion-ized plasma, etc. The last descending solarphase gave some opportunities of study duringOctober and November 2003, when intensescintillation activity was recorded at high lati-tudes. During that period the IESSG and the IN-GV receivers were in operation and their obser-vations have been carefully analysed in relationto other sources of information. In particular, theadoption of the MIDAS (Multi Instruments Da-ta Analysis System, Mitchell and Spencer,2003) imaging technique, the use of a model toreproduce the ionospheric electrical potential(Weimer, 2001) and the integration with satellitedata have been used to help the interpretation of
Fig. 19. S4 maps based on measurements at the Bandung station.
Vol52,3,2009 22-09-2009 14:48 Pagina 411
412
Y. Beniguel, V. Romano, L. Alfonsi, M. Aquino, A. Bourdillon, P. Cannon, G. De Franceschi, S. Dubey, B. Forte, V. Gherm, N. Jakowski, M. Materassi, T. Noack, M. Pozoga, N. Rogers, P. Spalla, H.J. Strangeways, M. Warrington, A. Wernik, V. Wilken and N. Zernov
the GISTM experimental observations (Mitchellet al., 2005; De Franceschi et al., 2008). In thesepapers the authors verify the coincidence be-tween steep TEC gradients and scintillation oc-currence, also stressing the crucial role of theIMF Bz and By conditions in fragmenting the socalled Tongue of Ionization (TOI) (Foster et al.,
2002) into polar cap patches (De Franceschi etal., 2008). In the same work De Franceschi et al.showed how the configuration of the convectioncells in the polar ionosphere can significantly in-fluence the velocity of the enhanced TEC struc-tures seen by the GPS receivers. Currently, afirst attempt of comparison between high and
Fig. 20. Values of Phi60 between 22-23UT at station Nya1 on 10 Dec 2006.
Fig. 21. Height errors from pseudoranges and carrier phase solution without mitigation.
Vol52,3,2009 22-09-2009 14:48 Pagina 412

413
Ionospheric scintillation monitoring and modelling
low latitudes scintillation effect is in progressanalysing the measurements made by theGISTM receivers deployed in Vietnam by IETR(University of Rennes) and those made by thereceivers located in Ny Alesund and at MarioZucchelli Station. This work aims to highlightthe different physical mechanisms causing scin-tillations over the poles and at the equator.
6. Final remarks and IPDM project
The satellites to ground links may be de-graded due to propagation through the iono-sphere plasma and its irregularities. Thesedegradations may be significant at frequenciesup to the C band. Crucially, this affects a num-ber of applications increasingly relevant to mod-ern society, such as satellite navigation, posi-tioning, communications, remote sensing andearth observation. Ionosphere irregularities withspatial scales ranging from a few meters up tohundreds of metres may cause signal scintilla-tions. Travelling Ionospheric Disturbances,magnetic storms and steep ionization gradientsare also known to cause serious performancedegradation on these systems. As their perform-ance and reliability become more and more im-
portant to the worldwide economy and society’sdaily activities, the need to establish robust inte-grated services to counter these effects becomesparamount. It is therefore a common interest ofall European countries to reduce ionosphericthreats to radio systems operating in quite differ-ent fields of application requiring high levels ofaccuracy, integrity and availability. Today’s ex-panding availability of ground and space basedGlobal Navigation Satellite Systems (GNSS)measurements, e.g. from GPS, GLONASS andGALILEO, lead to a unique combination of op-portunities for continuously sounding the elec-tron density structure of the ionosphere-plasma-sphere system, prompting the idea of establish-ing a corresponding monitoring network. Such amonitoring system shall network and integrateall ionospheric monitoring services which al-ready exist or are planned to be established byinstitutions in different European countries. Thepurpose of such a system will be to detect, mon-itor and forecast Ionospheric threats in a timelyand reliable manner to the wider European usercommunity. Since ionospheric weather is em-bedded in the overall space weather conditions,comprehensive space weather information, e.g.concerning solar radiation, solar wind, magne-tospheric and geomagnetic state must be includ-
Fig. 22. Height errors from pseudoranges and carrier phase solution with mitigation.
Vol52,3,2009 22-09-2009 14:48 Pagina 413

414
Y. Beniguel, V. Romano, L. Alfonsi, M. Aquino, A. Bourdillon, P. Cannon, G. De Franceschi, S. Dubey, B. Forte, V. Gherm, N. Jakowski, M. Materassi, T. Noack, M. Pozoga, N. Rogers, P. Spalla, H.J. Strangeways, M. Warrington, A. Wernik, V. Wilken and N. Zernov
ed in the information and data system.The COST 296 activity has improved the
expertise and capabilities to realize these objec-tives at the highest scientific and technologicallevel in Europe. An established research baseand strong expertise in different countries isavailable with respect to:
• GNSS measurement technique• GNSS data archive, management and
analysis• Ionospheric scintillation research and im-
pact on radio waves• The development of mitigation tech-
niques
The COST 296 community supports estab-lishing an operational European-wide informa-tion service, capable of detecting and monitor-ing the whole spectrum of ionospheric pertur-bations and related scintillations (via geo-plas-ma warnings, now-casts and forecasts) for thewider European user community, includingSME’s, government offices and public users.
Considering existing national activities, andthe cooperation activity supported during theCOST 296 the current situation is mature enoughfor effective networking and integration ofionospheric services and to further develop themat a European level in an objective and concert-ed fashion. As a consequence of projects and sci-entific results obtained in the WP3.3 «ionospher-ic scintillation monitoring and modelling» of theCOST 296, a proposal to form a consortium toestablish an «Ionospheric Perturbation and De-tection Monitoring (IPDM)» network in Europewas introduced. This could be the foundation ofa research initiative and potentially a service thatwould meet the raised expectations.
Acknowledgements
The studies at the Polish Space ResearchCentre are sponsored by the Polish Ministry ofScience and Higher Education through thegrant IPY/280/2006. Part of this work was pos-sible thanks to a free access to NSSDCarchives. Part of the scintillation data used inthis report were kindly provided by C. Mitchell
at the University of Bath (UK) through an EP-SRC project. The INGV authors thank the PN-RA (Italian National Program for Antarctic Re-searches) and POLARNET-CNR. The work byMM has been partially supported by the con-tract ASI/ISMB/ASI N.I./006/07/0. BF thanksthe Slovenian Research Agency for supportinghis activity at the University of Nova Gorica.DLR thanks LAPAN/Indonesia for supportingthe high rate GPS measurements in Bandung.Collaboration between the IESSG, INGV andUNESP has been facilitated by two Royal Soci-ety International Joint Project grants. The workcarried out by the IESSG on the 2001-2003 da-ta was sponsored by an EPSRC grant, which al-so funded the purchase and deployment of theGISTM receivers used in the experiments.
REFERENCES
ADAM, J-P, Y. BÉNIGUEL, N. JAKOWSKI, T. NOACK, V.WILKEN, J-J VALETTE, M. CUETO, A. BOURDILLON, P.LASSUDRIE-DUCHESNE and B. ARBESSER-RASTBURG
(2008): Analysis of scintillation recorded at low andhigh latitudes during the PRIS measurement campaign,(IES Symposium, Alexandria, Va, May 2008).
AQUINO, M., T. MOORE, A. DODSON, S. WAUGH, J. SOUTER
and F.S. RODRIGUES (2005a): Implications of ionos-pheric scintillation for GNSS users in Northern Eu-rope, Journal of Navigation, 58 (2), 241-256.
AQUINO, M., F. RODRIGUES, J. SOUTER, T. MOORE, A. DODSON
and S. WAUGH (2005b): Ionospheric scintillation and im-pact on GNSS users in Northern Europe: Results of a 3year study, Space Communications, 20 (1/2), 17-30.
AQUINO, M., M. ANDREOTTI, A. DODSON and H. STRANGE-WAYS (2007): On the Use of Ionospheric ScintillationIndices as Input to Receiver Tracking Models, JournalAdvances in Space Research, 40 (3), 426-435.
AQUINO, M., J.F.G. MONICO, A. DODSON, H. MARQUES, G. DE
FRANCESCHI, LU. ALFONSI, V. ROMANO and M. ANDREOT-TI (2009): Improving the GNSS Positioning StochasticModel in the Presence of Ionospheric Scintillation, Jour-nal of Geodesy, doi:10.1007/s00190-009-0313-6.
BASU, SU., SA. BASU, E. COSTA, C. BRYANT, C.E. VAL-LADARES and R.C. LIVINGSTON (1991): Interplanetarymagnetic field control of drifts and anisotropy of high-latitude irregularities, Radio Sci., 26, 1079-1103.
BÉNIGUEL, Y. (2002): Global Ionospheric Propagation Mod-el (GIM): a propagation model for scintillations oftransmitted signals, Radio Science, 37 (3).
BHATTACHARYYA, A., S. BASU, K.M. GROVES, C.E. VAL-LADARES and R. SHEEHAN (2001): Dynamics of equato-rial F region irregularities from spaced receiver scintil-lation observations, Geophys. Res. Lett., 28, 119-122.
BRIGGS, B.G. and I.A. PARKIN (1963): On the variation ofradio star and satellite scintillations with zenith angle,J. Atmos. Terr. Phys., 25, 339-365.
Vol52,3,2009 22-09-2009 14:48 Pagina 414

415
Ionospheric scintillation monitoring and modelling
CANNON, P.S., K. GROVES, D.J. FRASER, W.J. DONNELLY andK. PERRIER (2006): Signal distortion on VHF/UHFtransionospheric paths: First results from the WidebandIonospheric Distortion Experiment, Radio Sci., 41,RS5S40, doi:10.1029/2005RS003369.
COCO, I., E. AMATA, G. DE FRANCESCHI, L. ALFONSI, V. RO-MANO, M.F. MARCUCCI, M. LESTER and P.L. DYSON
(2007): Statistical Correlation between GPS Scintilla-tions and HF backscatter, (IUGG XXIV General As-sembly July 2-13, 2007 Perugia, Italy).
CONKER, R.S., M.B. EL-ARINI, C.J. HEGARTY and T. HSIAO
(2003): Modelling the Effects of Ionospheric Scintilla-tion on GPS/Satellite-Based Augmentation SystemAvailability, Radio Science, 38 (1), 1001,doi:10.1029/2000RS002604, 2003.
COSTA, E., P.F. FOUGERE and SA. BASU (1988): Cross-corre-lation analysis and interpretation of spaced-receivermeasurements, Radio Sci., 23, 141-162.
DE FRANCESCHI, G., L. ALFONSI and V. ROMANO (2006):ISACCO: an Italian project to monitor the high lati-tudes ionosphere by means of GPS receivers, GPS So-lution, doi:10.1007/s10291-006-0036-6.
DE FRANCESCHI, G., L. ALFONSI, V. ROMANO, M. AQUINO, A.DODSON, C.N. MITCHELL, P. SPENCER and A.W. WERNIK
(2008): Dynamics of high-latitude patches and associat-ed small-scale irregularities, J. Atmos. Sol.-Terr. Phys.,70, 879-888, doi:10.1016/j.jastp.2007.05.018.
FORTE, B. (2005): Optimum detrending of raw GPS data forscintillation measurements at auroral latitudes, J. At-mos. Sol-Terr. Phys., 67, 1100-1109.
FOSTER, J.C., P.J. ERICKSON, A.J. COSTER, J. GOLDSTEIN andF.J. RICH (2002): Ionospheric signatures of plasmas-pheric tails, Geophys. Res. Lett., 29 (13), 1623,doi:10.1029/2002GL015067.
GHERM, V.E., N.N. ZERNOV and H.J. STRANGEWAYS
(2005a): Propagation Model for TransionosphericFluctuational Paths of Propagation: Simulator of theTransionospheric Channel, Radio Science, 40 (1),RS1003, doi:10.1029/2004RS003097.
GHERM, V.E., N.N. ZERNOV and H.J. STRANGEWAYS
(2005b): HF Propagation in a Wideband IonosphericFluctuating Reflection Channel: Physically BasedSoftware Simulator of the Channel, Radio Science, 40(1), RS1001, doi:10.1029/2004RS003093.
GHERM, V.E., N.N. ZERNOV and H.J. STRANGEWAYS (2006):Effect of scintillations on the correlation of different-frequency L-band satellite navigation signals on thesame transionospheric link, presented at the 1st Euro-pean Conference on Antennas and Propagation (Eu-CAP), (Nice, France, 6-10 November 2006), publishedon Conference Proceedings CD.
GHERM, V.E., N.N. ZERNOV and H.J. STRANGEWAYS
(2007a): Effect of scintillation on the correlation be-tween different frequency L-band transmissions, pre-sented at the International Beacon Satellite Sympo-sium, (Boston, USA, 11-15 June 2007), published onConference CD.
GHERM, V.E., N.N. ZERNOV and H.J. STRANGEWAYS
(2007b): Correlation of different frequency L-bandsatellite navigation signals on the same transionospher-ic link for scintillation conditions, presented at COST296/IRI meeting in Prague, (Czech Republic, 10-14 Ju-ly, 2007), published on the Conference website.
GHERM, V.E., N.N. ZERNOV and H.J. STRANGEWAYS
(2007c): Modelling of the Effect of Strong Scintillationon GPS Signals due to Plasma Bubbles in the Low-Lat-itude Ionosphere, presented at the International Bea-con Satellite Symposium, (Boston, USA, 11-15 June2007), published on Conference Proceedings CD.
GHERM, V.E., N.N. ZERNOV and H.J. STRANGEWAYS
(2007d): Modelling of L-band signals scintillation inthe conditions of equatorial plasma bubbles, paper pre-sented at the 20th UK URSI Colloquium at PortsmouthUniversity, (2-3 July 2007).
GHERM, V.E., N.N. ZERNOV and H.J. STRANGEWAYS
(2007e): Modelling of the effect of strong scintillationon GPS Signals due to plasma bubbles in the low-lati-tude ionosphere, presented at COST 296/IRI meeting inPrague, (Czech Republic, 10 -14 July, 2007), pub-lished on the Conference website.
GSV 4004B (2005): GPS Ionospheric Scintillation & TECMonitor (GISTM) User’s Manual, (GSV GPS SiliconValley).
JAKOWSKI, N. (1996): TEC Monitoring by Using SatellitePositioning Systems, in Modern Ionospheric Science,edited by H. KOHL, R. RÜSTER and K. SCHLEGEL, (EGS,Katlenburg-Lindau, ProduServ GmbH Verlagsservice,Berlin), pp. 371-390.
JAKOWSKI, N. (1998): Generation of TEC Maps Over theCOST Area Based on GPS Measurements, Proc. 2ndCOST251 Workshop, (Ed. A. Vernon), 30-31 March,1998, Side, pp. 51-57.
KIL, H., P.M. KINTNER, E.R. DE PAULA and I.J. KANTOR
(2000): Global Positioning System measurements ofthe ionospheric zonal apparent velocity at CochoeiraPaulista in Brazil, J. Geophys. Res., 105, 5317-5327.
KINTNER, P.M., H. KIL, T.L. BEACH and E.R. DE PAULA
(2001): Fading timescales associated with GPS signalsand potential consequences, Radio Sci., 36, 731-743.
KINTNER, P.M., B.M. LEDVINA, E.R. DE PAULA and I.J. KAN-TOR (2004): Size, shape, orientation, speed, and dura-tion of GPS equatorial anomaly scintillations, RadioSci., 39, RS2012, doi: 10.1029/2003RS002878.
LEDVINA, B.M., P.M. KINTNER and E.R. DE PAULA (2004): Un-derstanding spaced-receiver zonal velocity estimation, J.Geophys. Res., 109, A10306, doi:10.1029/2004JA010489.
LIVINGSTON, R.C., C.L. RINO, J. OWEN and R.T. TSUNODA
(1982): The anisotropy of high-latitude nighttime F re-gion irregularities, J. Geophys. Res., 87, 10519-10526.
MATERASSI, M. (2008): Use of ROSA data in Space Weath-er, invited talk to the URSI XXIX General Assembly,(Chicago 16-17 August 2008).
MATERASSI, M., A.W. WERNIK and L. ALFONSI (2008): TheWAM scintillation model: overview and application toionospheric studies, talk given at the COST Workshop«Ionospheric scintillation: scientific aspects, spaceweather application and services», (Nottingham, UK,20-22 February 2008).
MATERASSI, M., LU. ALFONSI, G. DE FRANCESCHI, V. RO-MANO, C.N. MITCHELL and P. SPALLA (2009): Detrendeffect on the scalograms of GPS amplitude scintilla-tion, J. Adv. Space Res., doi:10.1016/j.asr.2008.01.023.
MAURITS, S.A., V.E. GHERM, N.N. ZERNOV and H.J.STRANGEWAYS (2008): Modeling of scintillation effectson high-latitude transionospheric paths using ionos-pheric model (UAF EPPIM) for background electron
Vol52,3,2009 22-09-2009 14:48 Pagina 415
416
Y. Beniguel, V. Romano, L. Alfonsi, M. Aquino, A. Bourdillon, P. Cannon, G. De Franceschi, S. Dubey, B. Forte, V. Gherm, N. Jakowski, M. Materassi, T. Noack, M. Pozoga, N. Rogers, P. Spalla, H.J. Strangeways, M. Warrington, A. Wernik, V. Wilken and N. Zernov
density specifications, Radio Science, 43, RS4001,doi:10.1029/2006RS003539.
MITCHELL, C.N. and P.S.J. SPENCER (2003): A three-dimen-sional timedependent algorithm for ionospheric imag-ing using GPS, Ann. Geophys., 46, 687-696.
MITCHELL, C.N., L. ALFONSI, G. DE FRANCESCHI, M.LESTER, V. ROMANO and A. W. WERNIK (2005): GPSTEC and scintillation measurements from the polarionosphere during the October 2003 storm, Geophysi-cal Research Letters, 32, L12S03,doi:10.1029/2004GL021644, 2005.
OTSUKA, Y., K. SHIOKAWA and T. OGAWA (2006): Equatori-al ionospheric scintillations and zonal irregularitydrifts observed with closely-spaced GPS receivers inIndonesia, J. Meteorological Soc. Japan, 84A, 343-351.
RINO, C.L. (1982): On the Application of Phase ScreenModels to the Interpretation of Ionospheric Scintilla-tion Data, Radio Sci., 17 (4), 855-867.
RINO, C.L. and R.C. LIVINGSTON (1982): On the analysisand interpretation of spaced-receiver measurements oftransionospheric radio waves, Radio Sci., 17, 845-854.
RODRIGUES, F.S., M.H.O. AQUINO, A. DODSON, T. MOORE
and S. WAUGH (2004): Statistical analysis of GPSionospheric scintillation and short-time TEC variationsover Northern Europe, Journal of the Institute of Navi-gation, 51 (1), 59-75.
ROGERS, N.C., P.S. CANNON and K.M. GROVES (2008):Measurements and Simulation of the IonosphericChannel Scattering Function for the ALTAIRVHF/UHF Radar, Paper A086, 12th InternationalIonospheric Effects Symposium, (May 13-15 2008,Alexandria, VA, J.M. Goodman (Editor-in-chief), Na-tional Technical Information Service (NTIS), Spring-field VA).
ROMANO, V., S. PAU, M. PEZZOPANE, E. ZUCCHERETTI, B.ZOLESI, G. DE FRANCESCHI and S. LOCATELLI (2008):The electronic Space Weather upper atmosphere(eSWua) project at INGV: advancements and state ofthe art, Ann. Geophys., 26, 345-351.
SPOGLI L., L. ALFONSI G. DE FRANCESCHI, V. ROMANO, M.AQUINO and A. DODSON (2009): Climatology of theIonospheric Scintillations over the Auroral and CuspEuropean Regions, Geophysical Research Abstracts,Vol. 11, EGU2009-7396, EGU General Assembly2009.
STRANGEWAYS, H.J., V.E. GHERM and N.N. ZERNOV (2006):Transionospheric simulator for strong scintillation con-ditions and its use in quantifying scintillation effectsfor GNSS systems, Proceedings of the 10th Interna-tional Conference on Ionospheric Radio Systems, andTechniques, (London, 18-21 July 2006), pp. 173-177.
STRANGEWAYS, H.J., V.E. GHERM and N.N. ZERNOV
(2007a): Modelling and mitigation of the effect of scin-
tillations on GPS, invited paper at 49th InternationalSymposium ELMAR-2007, (12-14 September, 2007,Zadar, Croatia), published in conference proceedings.
STRANGEWAYS, H.J., V.E. GHERM and N.N. ZERNOV
(2007b): Modelling and mitigation of the effect ofionospheric scintillations on GPS due to time-varyingelectron density irregularities and plasma bubbles, in-vited paper at the Workshop on Global NavigationSatellite Systems (GNSS): problems, vulnerabilitiesand solutions, (Baska, Krk Island, Croatia, 12-14 Sep-tember 2007).
STRANGEWAYS, H.J. (2008): Determining scintillation ef-fects on GPS receivers, in Ionospheric Effects Sympo-sium IES2008, (Alexandria,Virginia, USA, 13-15 May2008).
TIWARI, D., B. ENGAVALE, A. BHATTACHARYYA, C.V. DEVASIA,T.K. PANT and R. SRIDHARAN (2006): Simultaneousradar and spaced receiver VHF scintillation observationsof ESF irregularities, Ann. Geophys., 24, 1419-1427.
VAN DIERENDONCK, A.J., J.A. KLOBUCHAR and Q. HUA
(1993): Ionospheric scintillation monitoring using sin-gle frequency C/A code receivers, ION GPS 1993.
YEH, C.K. and C.H. LIU (1982): Radio wave scintillationsin the ionosphere, Proc. IEEE, 70 (4), 324-360.
WEIMER, D.R. (2001): An improved model of ionosphericelectric potentials including substorm perturbationsand application to the Geospace Environment Model-ing November 24, 1996, event, J. Geophys. Res., 106,407-416.
WERNIK, A.W., C.H. LIU and K.C. YEH (1983): Modeling ofspaced-receiver scintillation measurements, Radio Sci.,18, 743-764-.
WERNIK, A.W., L. ALFONSI and M. MATERASSI (2004):Ionospheric irregularities, scintillation and its effect onsystems, Acta Geophysica Polonica, 52 (2), 237-249.
WERNIK, A.W., L. ALFONSI and M. MATERASSI (2007): Scin-tillation modelling using insitu data, Radio Sci., 42 (1),RS1002, doi:10.1029/2006RS003512.
WERNIK, A.W., M. POZOGA, M. GRZESIAK, A. ROKICKI andM. MORAWSKI (2008): Monitoring ionospheric scintil-lation and TEC at the Polish Polar Station on Spitsber-gen: Instrumentation and preliminary results, ActaGeophysica, 56 (4), doi: 10.2478/s11600-008-0060-8
ZERNOV, N.N., V.E. GHERM and H.J. STRANGEWAYS (2008a):The scintillation propagation model for the effects ofscintillation on transionospheric paths traversing mid-scale ionospheric inhomogeneities, in COST296 Work-shop «Ionospheric scintillation: Scientific aspects,Space weather, Application and services», (Notting-ham, UK, 20-22 February, 2008).
ZERNOV, N.N., V.E. GHERM and H.J. STRANGEWAYS (2008b):On the effects of scintillation on the transionosphericpaths of propagation, in Proceedings of IES2008,(Alexandria, Virginia, USA, 13-15 May, 2008), p. 8.
Vol52,3,2009 22-09-2009 14:48 Pagina 416