Iodine Perfusion Maps in Computed Tomographic … · 003 How to cite this article: Shu Y T, Ken L,...
6
Review Article Volume 2 Issue 1 - August 2017 DOI: 10.19080/CTCMI.2017.02.555577 Curr Trends Clin Med Imaging Copyright © All rights are reserved by Dee Nandurkar Iodine Perfusion Maps in Computed Tomographic Pulmonary Angiography: What Radiologists Need to Know? Shu Yi Tan 1 , Ken Lau 1,2 , Adina Borsaru 1 , Dana Jackson 1 and Dee Nandurkar 1 * ¹ Diagnostic Imaging, Monash Medical Centre, Australia 2 Faculty of Medicine, Monash University, Australia Submission: June 05, 2017; Published: August 23, 2017 *Corresponding author: Dee Nandurkar, Diagnostic Imaging, Monash Medical Centre, 246 Clayton Road, Clayton, VIC. 3168, Australia, Tel: ; Fax: ; Email: Curr Trends Clin Med Imaging 1(5): CTCMI.MS.ID.555577 (2017) 001 Introduction Figure 1: Occlusive PE in the right upper and left lower lobes on mediastinal window (1a) and associated perfusion defect on iodine map (1b). Abstract Computed tomographic pulmonary angiography is the gold standard in diagnosing pulmonary embolism (PE). There is increasing use of dual energy CT (DECT) scanners in producing iodine perfusion maps. These maps assist in diagnosing a PE. However, many conditions can mimic perfusion defects on iodine maps including artefacts, pleural effusion, pulmonary artery compression, emphysema, vasculitis, pulmonary collapse, interstitial lung disease, MacLeod syndrome, mosaic perfusion and lung masses. It is important for the radiologist to familiarize themselves with these conditions to avoid misinterpreting iodine perfusion maps. Keywords: CT pulmonary angiogram; Dual energy CT; Iodine map; Pulmonary embolism; Perfusion defect Computed tomographic pulmonary angiography (CTPA) has become the mainstay in diagnosis of pulmonary embolism [1]. The advent of DECT has enabled simultaneous acquisition of datasets at two energy spectra; commonly at 80 KVp and 140 KVp. Iodine perfusion maps are generated using the concept of material decomposition, difference in attenuation at different energies [2]. Iodine attenuation is significantly greater at 80 KVp compared to 140 KVp resulting in derivation of an iodine map, representing distribution of iodinated contrast within the lung parenchyma which reflects the perfusion status of the lung [3]. Pulmonary perfusion map may aid the diagnosis of PE, as some emboli, in particular the occlusive type, can lead toper fusion deficits, commonly depicted as well demarcated wedge shaped defects. Perfusion defects detected on iodine maps are, however, not specific to embolic etiology; with vascular compression and diseases, artefact, airways disease and primary pulmonary parenchymal pathology also resulting in perfusion defects [4]. On the contrary, certain lesions in lungs may have increased vascular perfusion and may be seen as increased iodine concentration on iodine maps. The aim of this pictorial review is to demonstrate the appearances of some common pulmonary Pathologiesy which can mimic PE on iodine maps created from DECT. Current Trends in Clinical & Medical Imaging ISSN: 2573-2609
Transcript of Iodine Perfusion Maps in Computed Tomographic … · 003 How to cite this article: Shu Y T, Ken L,...
Review ArticleVolume 2 Issue 1 - August 2017DOI: 10.19080/CTCMI.2017.02.555577
Curr Trends Clin Med ImagingCopyright © All rights are reserved by Dee Nandurkar
Iodine Perfusion Maps in Computed Tomographic Pulmonary Angiography: What Radiologists Need to Know?Shu Yi Tan1, Ken Lau1,2, Adina Borsaru1, Dana Jackson1 and Dee Nandurkar1*¹Diagnostic Imaging, Monash Medical Centre, Australia2Faculty of Medicine, Monash University, Australia
Submission: June 05, 2017; Published: August 23, 2017
*Corresponding author: Dee Nandurkar, Diagnostic Imaging, Monash Medical Centre, 246 Clayton Road, Clayton, VIC. 3168, Australia, Tel: ; Fax: ; Email:
Curr Trends Clin Med Imaging 1(5): CTCMI.MS.ID.555577 (2017) 001
Introduction
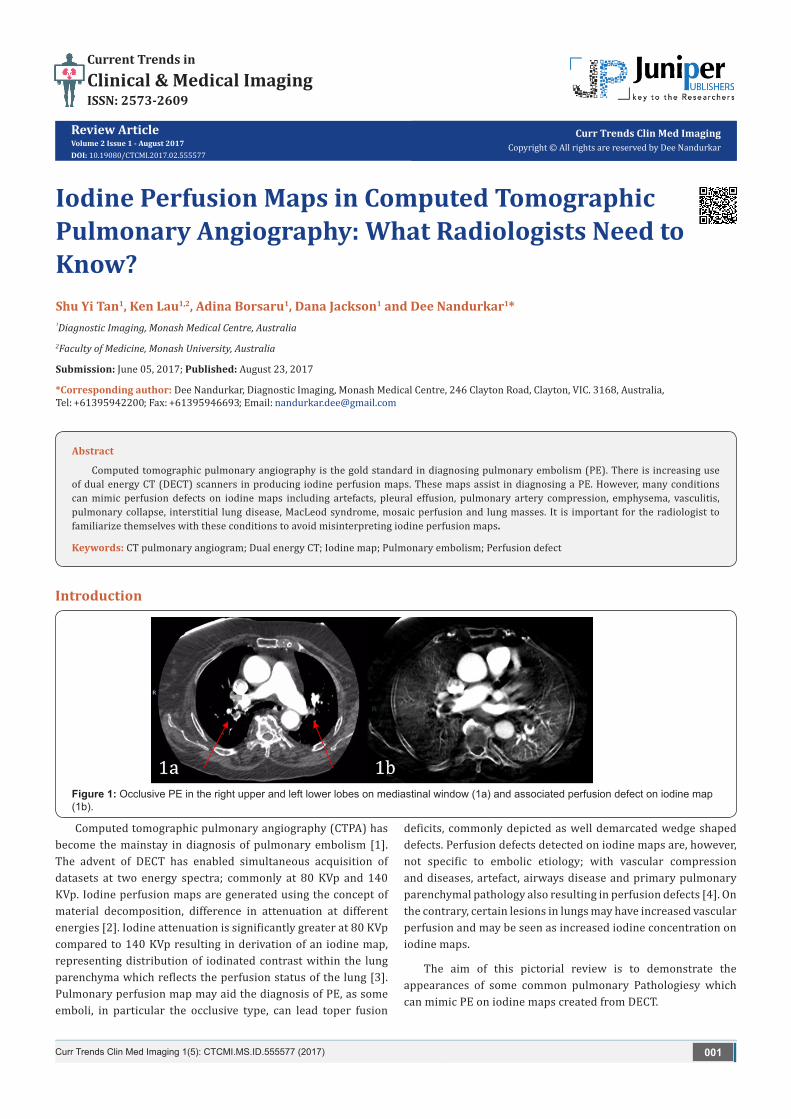
Figure 1: Occlusive PE in the right upper and left lower lobes on mediastinal window (1a) and associated perfusion defect on iodine map (1b).
Abstract
Computed tomographic pulmonary angiography is the gold standard in diagnosing pulmonary embolism (PE). There is increasing use of dual energy CT (DECT) scanners in producing iodine perfusion maps. These maps assist in diagnosing a PE. However, many conditions can mimic perfusion defects on iodine maps including artefacts, pleural effusion, pulmonary artery compression, emphysema, vasculitis, pulmonary collapse, interstitial lung disease, MacLeod syndrome, mosaic perfusion and lung masses. It is important for the radiologist to familiarize themselves with these conditions to avoid misinterpreting iodine perfusion maps.
Keywords: CT pulmonary angiogram; Dual energy CT; Iodine map; Pulmonary embolism; Perfusion defect
Computed tomographic pulmonary angiography (CTPA) has become the mainstay in diagnosis of pulmonary embolism [1]. The advent of DECT has enabled simultaneous acquisition of datasets at two energy spectra; commonly at 80 KVp and 140 KVp. Iodine perfusion maps are generated using the concept of material decomposition, difference in attenuation at different energies [2]. Iodine attenuation is significantly greater at 80 KVp compared to 140 KVp resulting in derivation of an iodine map, representing distribution of iodinated contrast within the lung parenchyma which reflects the perfusion status of the lung [3]. Pulmonary perfusion map may aid the diagnosis of PE, as some emboli, in particular the occlusive type, can lead toper fusion
deficits, commonly depicted as well demarcated wedge shaped defects. Perfusion defects detected on iodine maps are, however, not specific to embolic etiology; with vascular compression and diseases, artefact, airways disease and primary pulmonary parenchymal pathology also resulting in perfusion defects [4]. On the contrary, certain lesions in lungs may have increased vascular perfusion and may be seen as increased iodine concentration on iodine maps.
The aim of this pictorial review is to demonstrate the appearances of some common pulmonary Pathologiesy which can mimic PE on iodine maps created from DECT.
Current Trends in
Clinical & Medical ImagingISSN: 2573-2609
How to cite this article: Shu Y T, Ken L, Adina B, Dana J, Dee N. Iodine Perfusion Maps in Computed Tomographic Pulmonary Angiography: What Radiologists Need to Know?. Curr Trends Clin Med Imaging. 2017; 2(1): 555577. DOI: 10.19080/CTCMI.2017.02.555577002
Current Trends in Clinical & Medical Imaging
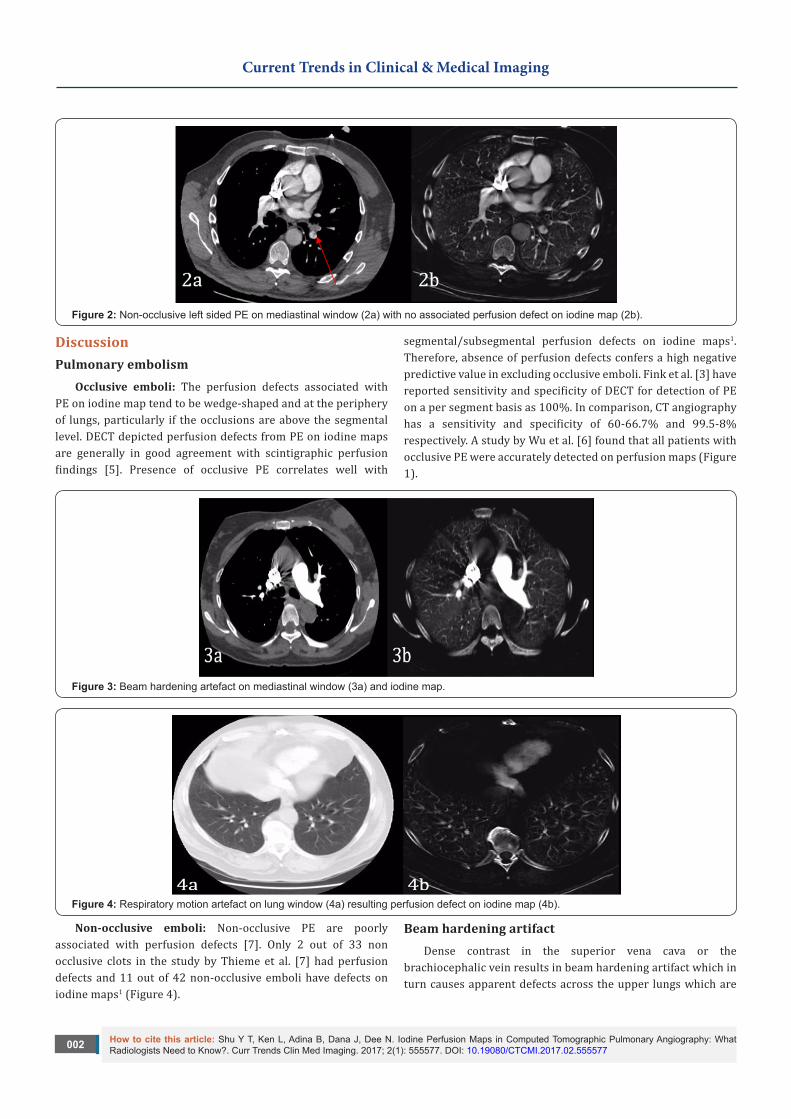
Figure 2: Non-occlusive left sided PE on mediastinal window (2a) with no associated perfusion defect on iodine map (2b).
DiscussionPulmonary embolism
Occlusive emboli: The perfusion defects associated with PE on iodine map tend to be wedge-shaped and at the periphery of lungs, particularly if the occlusions are above the segmental level. DECT depicted perfusion defects from PE on iodine maps are generally in good agreement with scintigraphic perfusion findings [5]. Presence of occlusive PE correlates well with
segmental/subsegmental perfusion defects on iodine maps1. Therefore, absence of perfusion defects confers a high negative predictive value in excluding occlusive emboli. Fink et al. [3] have reported sensitivity and specificity of DECT for detection of PE on a per segment basis as 100%. In comparison, CT angiography has a sensitivity and specificity of 60-66.7% and 99.5-8% respectively. A study by Wu et al. [6] found that all patients with occlusive PE were accurately detected on perfusion maps (Figure 1).
Figure 3: Beam hardening artefact on mediastinal window (3a) and iodine map.
Figure 4: Respiratory motion artefact on lung window (4a) resulting perfusion defect on iodine map (4b).
Non-occlusive emboli: Non-occlusive PE are poorly associated with perfusion defects [7]. Only 2 out of 33 non occlusive clots in the study by Thieme et al. [7] had perfusion defects and 11 out of 42 non-occlusive emboli have defects on iodine maps1 (Figure 4).
Beam hardening artifactDense contrast in the superior vena cava or the
brachiocephalic vein results in beam hardening artifact which in turn causes apparent defects across the upper lungs which are

003 How to cite this article: Shu Y T, Ken L, Adina B, Dana J, Dee N. Iodine Perfusion Maps in Computed Tomographic Pulmonary Angiography: What Radiologists Need to Know?. Curr Trends Clin Med Imaging. 2017; 2(1): 555577. DOI: 10.19080/CTCMI.2017.02.555577
Current Trends in Clinical & Medical Imaging
band-like2. Other patterns such as cresecentic, polygonal and ovoid shapes have also been described with the defects exhibiting sharp margins. These are typically observed in the apical and anterior segment of the right upper lobe and the apico-posterior
and lingular segments of the leftupper lobe [7]. Artefacts can be reduced by caudocranial scan direction with reduction of the amount of iodinated contrast in central veins and by relatively lower contrast flow [1] (Figure 5).
Figure 5: Pleural effusion on mediastinal window (5a) and iodine map (5b).
Motion artifact Motion artifact resulting from cardiac and diaphragmatic
movement results in artifacts in the right middle lobe, lingularsegment of the left upper lobe and the lung bases [2]. The diaphragmatic motion results in apparent curvilinear defects on iodine map. Blurred contours on the mediastinal and lung windows may help to distinguish these artifact from true perfusion artifact associated with PE.
Pleural effusion
Defect created by pleural effusion iodine map is easily recognized by its crescentic peripheral contour which is
concordant with the distribution of pleural fluid. It can also be easily confirmed by reviewing the mediastinal window settings on the CTPA study.
Pulmonary artery compressionExternal pulmonary arterial compression also yields perfusion
defects on iodine maps. Conglomerate nodal or neoplastic mass centrally that compresses or invades the proximal pulmonary artery may result in peripheral wedge shaped perfusion defect on iodine map (Figure 6). Fibrosingmediastinitis causing pulmonary arterial compression has also been demonstrated to yield wedge shaped perfusion defects4.
Figure 6: Pulmonary artery compression on mediastinal window (6a) and associated iodine map defect (6b).
Vasculitis
Figure 7: Emphysema on lung window (7a) and associated non-segmental perfusion defect (7b).

How to cite this article: Shu Y T, Ken L, Adina B, Dana J, Dee N. Iodine Perfusion Maps in Computed Tomographic Pulmonary Angiography: What Radiologists Need to Know?. Curr Trends Clin Med Imaging. 2017; 2(1): 555577. DOI: 10.19080/CTCMI.2017.02.555577004
Current Trends in Clinical & Medical Imaging
Although there are no cases in our patient group. Hypothetically, vasculitis involving the pulmonary arteries will
result in reduced pulmonary arterial caliber and subsequently reduced perfusion within the lungs (Figure 7).
Emphysema
Figure 8: Lung collapse on lung window (8a) and perfusion defect on iodine map (8b).
The emphysematous lung by virtue of lung destruction and paucity of pulmonary parenchyma and vasculature demonstrates deficient iodine content and as a result, perfusion defects on iodine map. These defects do not conform to the segmental
anatomy, but correspond to the extent of emphysema on lung window settings of a CTPA. The degree of perfusion reduction generally correlates well with the degree of emphysema [8] (Figure 8).
Pulmonary collapse
Figure 9: Pulmonary fibrosis in lung window (9a) with associated perfusion defect (9b).
Pulmonary collapse results in altered perfusion with defect on iodine map paralleling the distribution of the pulmonary collapse and is readily recognized on CT images. Material decomposition required in order to obtain perfusion maps need
pulmonary parenchymal density between -960 to -600 HU2. As the density of the collapsed lung falls outside this range, perfusion defects result due to technical failure to produce a perfusion map2 (Figure 9).
Interstitial lung disease
Figure 10: Air trapping in lung window (10a) with associated mosaic perfusion on iodine map (10b).
Interstitial lung disease results in non-segmental perfusion map defects conforming to the distribution of pulmonary fibrosis Ventilation perfusion mismatch is the commonest scintigraphic pattern seen on V/Q scans in patients with idiopathic pulmonary
fibrosis. The cause is vascular destruction by the fibrotic process rather than vasculitis per se [9]. SPECT images have also demonstrated that the perfusion defects on scintigraphy were associated with regions of cystic air spaces shown on CT

005 How to cite this article: Shu Y T, Ken L, Adina B, Dana J, Dee N. Iodine Perfusion Maps in Computed Tomographic Pulmonary Angiography: What Radiologists Need to Know?. Curr Trends Clin Med Imaging. 2017; 2(1): 555577. DOI: 10.19080/CTCMI.2017.02.555577
Current Trends in Clinical & Medical Imaging
scans, the “honeycomb” lung pattern. Hence, this also explains the perfusion defects evident on iodine maps in patients with pulmonary fibrosis. Density of the fibrotic lung falls outside the
range required for material decomposition resulting in perfusion defects [2] (Figure 10).
Mosaic perfusion
Figure 11: McLeod syndrome with relative hypolucency of right lung (11a) with associated perfusion defect (11b).
Mosaic pattern may result from small airways disease related air trapping or pulmonary vascular disease. Various vascular disease such as PE and vasculitis can result in mosaic attenuation. Regional hypoxia from small airways disease such as asthma produces patchy areas lung with differing attenuation. This can also further result in secondary vasoconstriction. Both phenomenon can produce defects on iodine maps (Figure 11).
MacLeod syndromeSwyer-James-Macleod syndrome is a post-infective state
resulting in destruction of the bronchiole. Radiographically, it is characterized by unilateral hyperlucent lung which may be normal or reduced in size with diminished lung and vascular markings and a mediastinal shift to the affected site on inspiration which swings to the contralateral side during expiration suggesting air trapping in the affected lung. The pulmonary artery in these
patients is also markedly diminished in size with near complete absence of perfusion on ventilation/perfusion scintigraphy [10]. These changes are similarly reflected on the iodine perfusion map with extensive deficient perfusion on the affected side.
Lung Mass Chae et al. [11] demonstrated that DECT has the ability to
generate virtual non contrast and contrast enhanced images from a single post contrast acquisition and measure the degree of contrast enhancement without additional radiation. Statistically significant difference was demonstrated in the absolute density and degree of enhancement using DECT between benign and malignant pulmonary nodules, with malignant nodules exhibiting higher density and degree of enhancement. This is demonstrated in the images (Figure 12).
Figure 12: Pulmonary mass on lung window (12a) and increased density peripherally and reduced perfusion centrally on iodine map (12b).
A strong correlation has also been demonstrated between the SUV max and maximum iodine-related attenuation in non–small cell than small cell lung cancer. Differences in tumour biology and different angiogenetic factors between the two different histologic subtypes are some of the proposed explanations for these differences [12].
ConclusionIodine maps generated using DECT scanners are increasingly
used to aid image interpretation of CTPA studies. Whilst
presence of perfusion defects on iodine map would suggest the presence of occlusive PE, these may also be encountered in a multitude of conditions. Absence of perfusion abnormality does not exclude a non-occlusive PE. The iodine maps themselves are also subject to multiple artifacts and are variably affected by many of the commonly encountered parenchymal pulmonary pathologies and pulmonary lesions which would require proper CT characterization. As the use of DECT increases, reporting radiologists would need to familiar with the manifestations of lung pathologies, apart from PE, on the iodine perfusion maps.
Figure 12: Pulmonary mass on lung window (12a) and increased density peripherally and reduced perfusion centrally on iodine map (12b).
How to cite this article: Shu Y T, Ken L, Adina B, Dana J, Dee N. Iodine Perfusion Maps in Computed Tomographic Pulmonary Angiography: What Radiologists Need to Know?. Curr Trends Clin Med Imaging. 2017; 2(1): 555577. DOI: 10.19080/CTCMI.2017.02.555577006
Current Trends in Clinical & Medical Imaging
Conflict of InterestThe authors declare that there is no conflict of interest in the
production of this manuscript.
References1. Thieme SF, Johnson TRC, Lee C, McWilliams J, Becker CR, et al. (2009)
Dual energy CT for assessment of contrast material distribution in the pulmonary parenchyma. AJR 193(1): 144-149.
2. Kang MJ, Park CM, Lee CH, Goo JM, Lee HJ (2010) Dual energy CT: clinical applications in various pulmonary diseases. Radiographics 30(3): 685-698.
3. Fink C, Johnson TR, Michaely HJ, Morhard D, Becker C, et al. (2008) Dual energy CT angiography of the lung in patients with suspected pulmonary embolism: initial results. Rofo 180(10): 879-883.
4. Kim BH, Seo JB, Chae EG, Lee HJ, Hwang HJ, et al. (2012) Analysis of perfusion defects by causes other than acute pulmonary thromboembolism on contrast enhanced dual energy CT in consecutive 537 patients. Eur J Radiol 81(4): 647-652.
5. Thieme SF, Becker CR, Hacker M, Nikolaou K, Reiser MF, et al. (2008) Dual energy CT for assessment of lung perfusion-correlation to scintigraphy. Eur J Radiol 68(3): 369-374.
6. WU WH, Cheng JJ, Li JY, Yin Y, Hua J, et al. (2012) Pulmonary embolism detection and characterization through quantitative iodine based
material decomposition images with spectral computed tomography imaging. Investigative radiology 47(1): 85-91.
7. Kang MJ, Park CM, Lee CH, Goo JM, Lee HJ (2010) Focal iodine defects on color coded iodine perfusion maps of dual energy CT pulmonary angiographic images: a potential diagnostic pitfall. AJR 195(5): W325-W330.
8. Pansini V, Remy-Jardin M, Faivre JB, Schmidt B, Dejardin-Bothelo A, et al. (2009) Assessment of lobar perfusion in smokers according to the presence and severity of pulmonary emphysema: preliminary experience with dual energy CT angiography. Eur Radiol 19(12): 2834-2843.
9. Strickland NH, Hughes JMB, Hart DA, Myers MJ, Lavender JP (1993) Cause of regional ventilation-perfusion mismatch in patients with idiopathic pulmonary fibrosis. A combined Ct and scintigraphic study. AJR 161(4): 719-725.
10. Gottleib LS, Franklin T (1976) Swyer-James (Macleod’s syndrome) variations in pulmonary-bronchial arterial blood flow. Chest 69(1): 62-66.
11. Chae EJ, Song JW, Seo JB, Krauss B, Jang YM, et al. (2012) Clinical utility of dual-energy CT in the evaluation of solitary pulmonary nodules: Initial experience. Radiology 249(2): 671-681.
12. Lu GM, Zhao Y, Zhang LJ, Schoepf UJ (2012) Dual-energy CT of the lung. AJR 199(5): S40-S53.
Your next submission with Juniper Publishers will reach you the below assets
• Quality Editorial service• Swift Peer Review• Reprints availability• E-prints Service• Manuscript Podcast for convenient understanding• Global attainment for your research• Manuscript accessibility in different formats
( Pdf, E-pub, Full Text, Audio) • Unceasing customer service
Track the below URL for one-step submission https://juniperpublishers.com/online-submission.php
This work is licensed under CreativeCommons Attribution 4.0 LicensDOI: 10.19080/CTCMI.2017.02.555577