INVL TECHNOLOGY - LITHUANIAN ICT INVESTMENT FUND
58
TECHNOLOGY 06.04.2021 INVL TECHNOLOGY - LITHUANIAN ICT INVESTMENT FUND
Transcript of INVL TECHNOLOGY - LITHUANIAN ICT INVESTMENT FUND

TECHNOLOGY
06.04.2021
INVL TECHNOLOGY - LITHUANIAN ICT INVESTMENT FUND

INVL Technology is a closed-end investment company which invests in IT businesses and is listed on the Nasdaq Vilnius exchange (INC1L).
The management of the closed-end investment company has been assumed by INVL Asset Management, a part of asset management group Invalda INVL.
On 14 July 2016, the Bank of Lithuania issued a closed-end investment company (CEF) licence to INVL Technology. INVL Technology will operate until 14 July 2026, with extension possible for two more years.
2 INVL TECHNOLOGY OVERVIEW
The strategy of INVL Technology is to invest in national-level European IT businesses with high globalisation potential and grow them into global players by utilizing the sales channels and intellectual capital of the managed companies.
Key investments and development areas: Cyber Security - NRD Cyber Security, Gov-tech and Fintech - NRD Companies (8 companies), IT services and software Novian group (7 companies).
Headquartered in Lithuania, managed companies operate in the Baltics, Norway, Moldova, Bangladesh, Rwanda. Implemented projects in 70+ countries.

3 KEY EXECUTIVES3
Kazimieras TonkūnasCEO, co-founder & managing partner of INVL Technology
Chairman of the Investment Committee
Nerijus DrobavičiusMember of the Investment Committee
Member of the Board of Invalda INVL
20+ years’ executive experience in ICT sector M&A, spin-offs, frontier markets
Vytautas PlunksnisHead of the Private Equity Unit of INVL Asset Management
Member of the Investment Committee
15+ years’ experience in capital markets and M&A 15+ years’ experience in M&A, financial analysis and setting up management controls
Vida TonkūnėINVL Technology Partner of INVL Technology
Member of the Investment Committee
20+ years’ executive experience in ICT sector M&A, spin-offs, frontier markets
More information: https://www.invltechnology.lt/lit/en/about-us/investment-committee

4 INVL TECHNOLOGY SHAREHOLDER STRUCTURE
34,91 %
19,91 %
15,04 %
12,04 %7,47 %
5,55 %
5,08 %
Lietuvos draudimas, AB (110051834)
Kazimieras Tonkūnas
Alvydas Banys
Others
LJB investments, UAB (300822575)
Invalda INVL, AB (121304349)
Irena Ona Mišeikienė
LJB investments UAB, code 300822575, A. Juozapavičiaus str. 9A, Vilnius
Company shareholders (≥ 5%)
Lietuvos draudimas AB, code 110051834, J. Basanavičiaus str. 12, Vilnius
Invalda INVL AB, code 121304349, Gynėjų str. 14, Vilnius
Irena Ona Mišeikienė
Kazimieras Tonkūnas
Alvydas Banys
2,424,152
909,090
1,830,947
1,466,421
675,452
618,745
19.91
7.47
15.04
12.04
5.55
5.08
Name of the shareholder or company
Number of shares held by the right of ownership, units
Share of the authorised capital held, %
Free float – 4 659 425 shares. The total number of shareholders exceeded 3,438 on 31 December 2020.
More information: https://www.invltechnology.lt/lit/en/for-investors/shareholders

5 OWNERSHIP STRUCTURE
99 %95,91 %
1 %
30 %100 %
100 %90 %
TECHNOLOGY
Zissor AS Drammen, Norway
Andmevara AS Tallinn, Estonia
Novian Technologies UAB Vilnius,
Lithuania
Andmevara Services OÜ Tallinn, Estonia
Andmevara SRL Chișinău, Moldova
Novian Systems UAB Vilnius, Lithuania
Norway Registers Development AS
Oslo, Norway
Infobank Uganda Ltd Kampala, Uganda
Novian UAB Vilnius, Lithuania
NRD Companies AS Oslo, Norway
Norway Registers Development AS Lithuanian branch
Vilnius, Lithuania
Norway Registers Development Rwanda Ltd Kigali, Rwanda
NRD Systems UAB Vilnius, Lithuania
Etronika UAB Vilnius, Lithuania
NRD CS UAB Vilnius, Lithuania
NRD Bangladesh Ltd Dhaka, Bangladesh
FINtime UAB Vilnius, Lithuania

6
2015 2016 2019–2020 20262024
INVL Technology AB was merged into BAIP Group UAB and continued operations under the new name INVL Technology AB.
On 3 July 2015, INVL Technology placed a new issue of 6 060 607 shares at a price of 1.65 euros per share and raised 10 million euros. On 8 June 2015, the net asset value was 20,089 thous. EUR.
Norway Registers Development AS acquired 80 per cent of the shares of ETRONIKA.
Formed NRD Cyber Security.
Completed the formation of the NRD Companies and Novian group.
2019 Novian acquired Zissor AS.
Start of exit
INVL Technology ends of operation*
On 14 July 2016, INVL Technology obtained a CEF licence.
Inventio acquired Algoritmų Sistemos.
INVL Technology acquired Andmevara AS with its subsidiary Andmevara SRL.
Period of value creation
2021-2024
Period of business exit
2024-2026
Period of investment
2016-2021
INVL TECHNOLOGY TIMELINE
*Possibility of INVL Technology extension for 2 years.

NET ASSET VALUE AND STOCK PRICE INFORMATION 7
Net asset value of the company, EUR
Net asset value per share, EUR
20,089 24,243 23,906 19,728 23,812 28,025 28,958 33,725
1.99 1.96 1,62 1.96 2.30 2.38 2.771.65
Title 08.07.2015* 31.12.2015**
14.07.2016***
31.12.2016***
31.12.2017 31.12.2018 31.12.2019 31.12.2020 *During the secondary public offering (SPO), finalised on 8 July 2015, the Company has issued 6,060,607 new Shares with the final offer price of EUR 1,65 each, the Company has raised over EUR 10 million. Net asset value as of 2015-07-08 equals offer price times shares outstanding as at 2015-07-08.
**The total equity of the Company of 31 December 2015 was EUR 24,243 thousand.
***Start of CEF activities. The total equity of the Company of 14 June 2016 was EUR 23,906 thousand. Net asset value is equals to the total equity of the Company.
2015-07-08*
3,00
2,50
2,00
1,50
1,00
0,50
0,002016-07-142015-12-30 2016-12-30 2017-12-29 2018-12-28
1,65
2,01
1,801,65
1,51 1,43
1,76
2,08
2,77
2,38
2019-12-30 2020-12-30
2,30
1,961,62
1,961,99
1,76
Stock price in the market Net asset value per share, EUR

SHARE INFORMATION* 88
Number of shares, units
2018
1.49
1.7
1.43
1.44
367,226
0.58
17.53
2019
1.44
2.1
1.44
1.76
418,385
0.68
21.43
2020
1.76
2.14
1.5
2.08
245,739
0.47
25.32
2021**
2.12
2.42
2.06
2.26
177,386
0.39
27.52
2017
1.76
1.76
1.49
1.49
101,324
0.16
18.14
Price
Open price €
High price €
Low price €
Last price €
Traded volume
Turnover mln €
Capitalization mln €
12,175,321
*Source: https://nasdaqbaltic.com/statistics/en/instrument/LT0000128860/historical?date=2020-05-05
**Data for April 12, 2021 are provided

KEY FIGURES OF INVL TECHNOLOGY (THOUSAND EUR)9
31-12-2017
23,811,753
1.9557
31-12-2018
28,024,654
2.3018
31-12-2019
28,958,136
2.3784
12 months of 2019
1,279
185
(531)
933
31-12-2019
25,912
1,401
920
808
39
29,080
122
28,958
29,080
31-12-2020
33,725,239
2.7700
12 months of 2020
6,740
150
(2,123)*
4,767
31-12-2020
32,652
2,191
408
151
2
35,404
1,679
33,725
35,404
31-12–2016
19,727,654
1.6203
12 months of 2018
3,421
1,360
(533)
4,213
31-12-2018
24,229
2,230
1,252
-
439
28,150
125
28,025
28,150
INVL Technology
NAV
NAV per share
Change in the fair value of financial assets
Dividends, interest and other incomes
Operating expenses
Net profit (loss)
Financial assets value
Cash and Cash equivalents
Bonds
Loans
Other assets
TOTAL ASSETS
Other liabilities
Equity
TOTAL EQUITY AND LIABILITIES
*INVL Technology calculated a provision for success and accrued management fee EUR 1,075 thousand and EUR 460 thousand.

INVL TECHNOLOGY FINANCIAL ASSETS (THOUSAND EUR)10
31-12-2018
5,458
12,085
6,455
231
24,229
31-12-2020
7,144
19,740
5,535
233
32,652
31-12-2020
25,912
6,740
32,652
Companies
NRD Companies (includes Etronika UAB, NRD Systems UAB, Norway Registers Development AS and others)
Novian1 (includes Novian Technologies UAB, Novian Systems UAB2, Andmevara Services OU, Andmevara AS, Andmevara SRL, Zissor AS)
NRD CS UAB
„FINtime“ UAB
TOTAL
Change in fair value of financial assets, thous. EUR
Opening balance (2020-01-01)
Revaluation
Closing balance (2020-12-31)
31-12-2019
5,511
15,295
4,880
226
25,912
1 In 2019, the Novian Group was completed. In addition to UAB Novian, UAB Novian Technologies (former name UAB BAIP) and UAB Acena, in 2019 this group included UAB Novian systems (former name UAB Algoritmų sistemos) and Andmevara group of companies, owned directly by INVL Technology, as well as the newly acquired Zissor AS. The comparative value of Novian on 31. 12. 2018 has been calculated by summing the individual Novian on 31. 12. 2018 (includes UAB Novian, UAB BAIP and UAB Acena), UAB Algoritmų sistemos and Andmevara (includes Andmevara AS, Andmevara SRL and Andmevara Services OU).
2 Acena, UAB has been merged into Novian Systems and ceased its operations at the end of 2020.

KEY FIGURES OF INVL TECHNOLOGY PORTFOLIO COMPANIES11
2016 20162017 20172018 20182019 20192020 2020
40 000
35 000
30 000
25 000
20 000
15 000
10 000
5 000
0
3 500
3 000
2 500
2 000
1 500
1000
500
0
H1 H1
H2 H2
Aggregated revenue of INVL Technology portfolio companies (thous. Eur)
Aggregated EBITDA of INVL Technology portfolio companies (thous. Eur)
2017
27,751
NA
1,974
1,395
1,237
2018
32,723
9,935
2,152
1,591
1,120
2019
34,529
9,349
2,181
949
493
2020
36,634
10,246
2,988
1,641
1,097
2016
23,125
NA
857
273
(52)
(Thous. EUR)
Revenue
Gross profit*
EBITDA**
EBIT
Net profit (loss)***
*From 2018 the methodology for calculating gross profit has been changed: by including direct labor costs in the cost. Until 2018, the information was not collected in this section, therefore, due to the lack of comparable data, the data for 2016-2017 are not provided.
**From 2019 IFRS 16 was adopted, which affected the amount of EBITDA, therefore the EBITDA for the periods 2016-2018 and 2019-2020 is not directly comparable.
*** - Net profit (loss) is presented after elimination of dividend income and elimination of one-off and atypical impairments of investments in subsidiaries recognized in standalone company reports.

40 000
35 000
30 000
25 000
20 000
15 000
10 000
5 000
02014 Aggregated revenue
2020Change due to
acquisitionBefore SPO
(2014)2015 Organic
growth2016 2017 20192018 2020
Increase Decrease Total
40 000
35 000
30 000
25 000
20 000
15 000
10 000
5 000
0
Change due to acquisition
Organic growthInitial income level
Total
12 INVL TECHNOLOGY MANAGED COMPANIES GROWTH
Groups of aggregated revenue of INVL Technology portfolio companies 2014-2020
Aggregated revenue of INVL Technology portfolio companies 2014-2020
16 700
14 666
5 182 36 548
16 700
24 668 23 12527 751
32 57334 529
36 548

2012
25 000
20 000
15 000
10 000
5 000
-20142013 2015 2016 2017 2018 2019 2020
13
9 618
2 111
11 706
2 992
10 855
5 845
15 827
8 841
16 584
11 167
21 455
11 268
19 477
15 052
22 615
14 019 14 445
8 680
Lithuania
Others
Total: 142 582
Total: 36 634
Total: 34 5292019
2020
Total: 32 7232018
Total: 27 7512017
Total: 23 1252016
Total: 24 6682015
Total: 16 700 2014
Total: 79 975
14 019 38 %
5 845 35 %
8 841 36 %
8 680 38 %
11 167 40 %
11 268 34 % 15 052
44 %
10 855 65 %
15 827 64 %
14 445 62 %
16 584 60 %
21 455 66 % 19 477
56 %
22 615 62 %
REVENUE OF THE MANAGED COMPANIES DISTRIBUTION IN LITHUANIA AND ABROAD (THOUSAND EUR)

14 REVENUE OF INVL TECHNOLOGY FOR BY COUNTRY (THOUSAND EUR)
Lithuania
Norway
Tanzania
Kyrgyzstan
Estonia
Bangladesh
Sweden
Moldova
Rwanda
Burkina Faso
The United Kingdom
Latvia
The Cayman Islands
Others (36 countries)
Lithuania
Norway
Estonia
Zanzibar
The United Kingdom
Burundi
Rwanda
Barbados
Mauritius
Latvia
Kyrgyzstan
Botswana
Finland
Others (41 countries)
2020
22,615
14,019
36,634
Change
3,138
(1,033)
2,105
2019
19,477
15,052
34,529
(Thous. EUR)
Lithuania
Others
Total
Revenue of INVL Technology of 2019 by country Revenue of INVL Technology of 2020 by country
1 %
56 %
6 %
6 %
6 %
5 %
5 %
3 %
2 %2 %
2 %2 %
2 %2 %
1 %1 %
1 %1 %
1 %1 %
62 %
6 %
6 %
6 %
7 %
2 %2 %
3 %

GLOBAL TECHNOLOGY AND CONSULTING GROUP WITH PROPRIETARY PRODUCTS IN GOV-TECH AND FINTECH

16
NRD Companies is a global information technology and consulting group of companies, specializing in the governance and development of the economic digital infrastructure for Governments, Registries, Tax Administrations, Financial Institutions, Retailers and National Postal Services.
Headquartered in Norway, serve customers from Norway, Lithuania, Bangladesh, Rwanda, Uganda and Tanzania.
The Group employs more than 110 professionals and is controlled by INVL Technology UTIB.
More information:https://www.nrd.no/https://www.linkedin.com/company/norway-registers-development-as

Sustainability• Enabling the business environment & job creation
• Increasing the efficiency of government services
• Facilitating financial inclusion and access to finances
• Supporting domestic resource mobilisation
• Improving the accessibility of social and business services
• Facilitating environmental sustainability
• Securing the digital environment
We embrace the United Nations and World
Bank Sustainability Initiatives through our
contribution to:

Global Footprint
Central America
Sub-Saharan Africa
South & Southeast Asia
NRD Companies implement products and projects in
more than 50 countries worldwide.

Solutions and products

NRD Companies aggregated income according countries (Thousand. EUR)
37%
16%8%
6%
4%
4%
3%
3%
3%
2%
14%
2019 Y AGGREGATED INCOME ACCORDING COUNTRIES
Lithuania
Tanzania
Bangladesh
The Cayman Islands
Estonia
Mauritius
Latvia
Finland
Uganda
Barbados
Others (10 countries)
26%
24%
6%
6%
3%
2%2%
2%2%
27%
2020 Y. AGGREGATED INCOME ACCORDING COUNTRIES
Lithuania
Zanzibar
Barbados
Mauritius
Estonia
Samoa
Anguilla
Uganda
Finland
Others (18 countries)
Thousand. EUR 2019 Y. 2020 Y. Difference
Lithuania 2 736 2 295 (441)
Other countries 4 859 6 352 1 493
Total 7 595 8 647 1 052

NRD Companies key financial indicators (thousands of EUR)
0
1000
2000
3000
4000
5000
6000
7000
8000
9000
10000
2016 2017 2018 2019 2020
Aggregated income
H1 H2-200
-100
0
100
200
300
400
500
600
700
2016 2017 2018 2019 2020
Aggregated EBITDA
H1 H2
* From 2019 IFRS 16 was adopted, which affected the amount of EBITDA, therefore the EBITDA for the periods 2016-2018 and 2019-2020 is not directly comparable.
Thousand. EUR 2016 2017 2018 2019 2020
Aggregated income 6 809 8 172 7 918 7 595 8 647
Aggregated EBITDA*(42) 565 448 171 613

Key profit (loss) items (Thousand. EUR)2
NRD Companies
NRD AS3 NRD Systems3 Etronika 3
2019 2020 2019 2020 2019 2020 2019 2020
Revenue 6,597 6,989 3,127 4,247 1,994 2,430 2,360 1,926
Gross profit 2,031 2,603 850 1,216 354 906 955 618
EBITDA 166 610 126 144 (179) 354 349 128
EBIT (68) 332 121 136 (273) 247 253 3
Net Profit (Loss)(119) 160 102 68 (288) 163 193 (29)
2 Unaudited consolidated results of NRD Companies are presented.3 The results of Etronika UAB and NRD Systems UAB and NRD AS are included into results of NRD Companies. The audit of stand-alone financial statements of these entities are in progress.

Key profit (loss) items (Thousand. EUR)2
„NRD Companies“
NRD AS3 NRD Systems3 Etronika 3
2019 2020 2019 2020 2019 2020 2019 2020
Tangible assets 434 259 14 9 246 142 171 106
Intangible assets 370 220 15 14 2 1 281 171
Other non-current assets 77 343 - 307 57 14 21 23
Current assets 5,079 6,305 3,057 4,107 1,244 2,087 1,396 1,175
of which cash 478 939 65 67 273 545 107 218
Total assets 5,960 7,127 3,086 4,437 1,549 2,244 1,869 1,475
Equity 1,417 1,646 682 701 217 380 628 602
Non-current liabilities 460 558 - - 135 215 314 338
Of which financial debt 395 277 - - 135 215 260 62
Current liabilities 4,083 4,923 2,404 3,736 1,197 1,649 927 535
of which financial debt 1,288 782 676 490 359 244 362 48
Total liabilities and equity 5,960 7,127 3,086 4,437 1,549 2,244 1,869 1,475
2 Unaudited consolidated results of NRD Companies are presented.3 The results of Etronika UAB and NRD Systems UAB and NRD AS are included into results of NRD Companies. The audit of standalone financial statements of these entities are in progress.

NRD Companies business sectors and countries
Revenue in the area of national tax administration systems, civil and business registers have grown significantly over the last three years. The geography of projects has expanded.

BALTIC AND NORDIC MANAGED SERVICES AND DEVOPS COMPANY

Novian companies act in 3 areas
Andmevara ASTallinn, Estonia
Andmevara Services OÜTallinn, Estonia
Andmevara SRLChișinău, Moldova
26
Drammen, Norway
Novian group is strengthening its international presence and increasing value for its clients by offering integrated services.
For that purpose, Novian has refined its operational competencies – the group’s companies operate in three areas.
The market is also being offered integrated services under the shared name of Novian:
At the end of 2020, BAIP became Novian Technologies and Algoritmų Sistemos –Novian Systems.

Focus on regional markets and technological advances
Expand the geography of the
activities of the group’s
companies giving priority to the
Baltic and Nordic markets.
Main directions of the Novian group:
Increase the companies’
competencies in the areas of high-
performance computing devices,
digital transformation, big data and
artificial intelligence.
27

The geography of Novian’s companies and projects
LietuvaLatvijaEstija
Norvegija
Moldova
Offices operate in 5 countries
The companies‘ projects in 2016-2020 took place in 50 countries
28

29
Clients benefit from over 80 solutions and services

30
Services and solutions integrated for unique needs
Business Public sector
The Novian approach
Organization’s need for digitalization
Digital needs analysis
Optimal solution
Fast implementation combining the Novian companies’ experience, capacity and services.
1
2
3
4

Novian group companies' financial indicators (thousands of EUR)
Novian4
Technologies area Software services areaMedia monitoring and
digitization area
Novian Technologies
UAB
Andmevara Services
OU/ „Andmevara
SRL“5
Novian Systems UAB Andmevara AS Acena UAB6 „Zissor AS“
2019 2020 2019 2020 2019 2020 2019 2020 2019 2020 2019 2020 2019 2020
Revenue 23,492 24,113 17,072 18,223 673 651 2,759 2,824 1,023 789 1,257 915 708 711
Gross Profit 5,591 5,725 2,549 2,838 672 651 993 1,144 450 190 347 250 580 652
EBITDA 1,556 1,798 1,258 1,628 93 65 339 473 (108) (256) (12) (69) 78 108
EBIT 755 1,006 684 1,066 76 49 234 348 (171) (318) (18) (74) 43 88
Net Profit (loss)7 385 580 462 761 41 30 190 297 (229) (374) (20) (74) 34 68
4 The unaudited aggregated results of the Novian group are presented, which include the results of the companies and the results of Novian UAB. The audit of standalone financial statements of Novian Technologies UAB, Novian SystemsUAB and Zissor AS is in progress.
5 Represents results of Andmevara Services OU and Andmevara SRL.6 Acena UAB was merged into Novian Systems UAB on 31 December 2020. The Acena UAB merge has completed the liquidation procedures, and all the rights and obligations of Acena have been assumed by Novian Systems UAB, which
will continue Acena UAB activities after the reorganization. The standalone financial statements of Acena UAB will not be prepared and published. The information in this report is presented separately for both companies in order to disclose the actual activities of the companies in 2020 and ensure comparability of data with 2019.
7 Adjusted net profit is represented after eliminating one-off impairments of investments in subsidiaries recognized in standalone reports of Novian Technologies UAB and Novian Systems UAB. In 2019 Novian Technologies UAB eliminatedthe impairment of Acena UAB EUR -117 thousand (additional deferred income tax income- EUR 18 thousand), Novian Systems UAB eliminated the impairment of Andmevara AS EUR -150 thousand (additional deferred income tax income - EUR 23 thousand). In 2020 Novian Systems UAB eliminated the impairment of Andmevara AS EUR-64 thousand (additional deferred income tax income EUR 10 thousand) and impairment of Acena UAB EUR -27 thousand (additional deferred income tax income of EUR 4 thousand). The aggregated net profit of the Novian group was adjusted accordingly.
31

Novian4
Technologies area Software services areaMedia monitoring and
digitization area
Novian Technologies
UAB
Andmevara Services OU / Andmevara
SRL5Novian Systems UAB Andmevara AS Acena UAB6 Zissor AS
2019 2020 2019 2020 2019 2020 2019 2020 2019 2020 2019 2020 2019 2020
Tangible Assets 1,251 1,008 897 611 12 19 296 228 34 138 9 7 1 3
Intangible Assets 1,861 1,840 65 62 4 3 1,768 1,773 2 1 1 - 20 -
Other non-current assets 681 454 812 287 - - 177 386 - - - - 132 104
Current assets 11,404 10,064 7,793 7,228 153 134 1,818 2,236 456 248 875 292 273 426
Of which cash 3,540 2,242 2,016 1,221 29 37 595 377 218 21 596 119 70 274
Total assets 15,197 13,366 9,567 8,188 169 156 4,059 4,623 492 387 885 299 426 533
Equity 5,122 5,693 2,591 3,352 ( 47) ( 19) 2,745 2,964 ( 218) ( 592) 139 65 318 365
Non-current liabilities 687 730 336 154 - - 351 450 - 86 - - - 40
of which financial debt 483 360 328 147 - - 155 87 - 86 - - - 40
Current liabilities 9,388 6,943 6,640 4,682 216 175 963 1,209 710 893 746 234 108 128
Of which financial debt 1,746 1,042 1,205 209 130 50 66 495 345 729 - - - -
Total liabilities and equity 15,197 13,366 9,567 8,188 169 156 4,059 4,623 492 387 885 299 426 533
4 The unaudited aggregated results of the Novian group are presented, which include the results of the companies and the results of Novian UAB. The value of investments in subsidiaries was eliminated by aggregating balance sheet items. The audit of standalonefinancial statements of Novian Technologies UAB, Novian Systems UAB and Zissor AS is in progress.
5 Represents results of Andmevara Services OU and Andmevara SRL.6 Acena UAB was merged into Novian Systems UAB on 31 December 2020. The Acena UAB merge has completed the liquidation procedures, and all the rights and obligations of Acena have been assumed by Novian Systems UAB, which will continue Acena UAB
activities after the reorganization. The standalone financial statements of Acena UAB will not be prepared and published. The information in this report is presented separately for both companies in order to disclose the actual activities of the companies in 2020 and ensure comparability of data with 2019.
32
Novian group companies' financial indicators (thousands of EUR)

Novian group main financial indicators (thousands of EUR)
n Ist half n 2nd halfn 1st half n 2nd half
0
5 000
10 000
15 000
20 000
25 000
30 000
2016 2017 2018 2019 2020
Revenue
0
200
400
600
800
1 000
1 200
1 400
1 600
1 800
2 000
2016 2017 2018 2019 2020
EBITDA
33
Thousands of EUR 2016 2017 2018 2019 2020
Revenue 14,555 15,776 20,317 23,492 24,113
EBITDA* 774 791 1,138 1,556 1,798
• The Novian group’s revenue and EBITDA mainly grew organically. In the 2016-2020 period there was an additional acquisition of the company Zissor,whose impact is not material (annual revenue of approx. EUR 700,000).
• Most of the Novian group’s growth is due to the recent more successful development of Novian Technologies. Strong attention is being given toNovian Systems’ area of operations as well, which it is hoped will also start to demonstrate stable growth in coming periods.
• The activities of Novian Technologies are diversified between the public and private sector, while most of Novian Systems’ activities are concentratedin the public sector.
* IFRS 16 was implemented in 2019 with an impact on the size of EBITDA, thus the EBITDA indicators for 2016-2018 and 2019-2020 are not directly comparable.

Revenue of Novian group by country (thousands of EUR)
Thousands of EUR 2019 2020 Change
Lithuania 14,330 17,186 2,856
Other countries 9,162 6,927 (2,235)
Total 23,492 24,113 621
34
71%
8%
4%
3%
3%
3%
1%1%
1%
5%
2020
Lithuania
Estonia
United Kingdom
Norway
Rwanda
Burundi
Latvia
Kyrgyzstan
Botswana
Other (22 countries)
61%
8%
5%
3%
3%
3%
3%
3%2%
9%2019
Lithuania
Kyrgyzstan
Estonia
Tanzania
Sweden
Rwanda
Moldova
Burkina Faso
Bangladesh
Other (25 countries)

Revenue of Novian group according to the sectors
Revenue of Novian group according to the sectors. Number of the countries
Over the last three years, the Novian group’s earnings in the financial and private sectors have grown.
In 2020, revenues in the private and financial sectors made up 56% of all the Novian group’s revenues.
44%
33%
17%
3% 3%
2019
29%
34%
22%
12%
3%
2020
53%
24%
17%
3% 3%
2018
31
28 30
34
31
0
5
10
15
20
25
30
35
40
2016 2017 2018 2019 2020
Novian group: countries of operations
35
n Public
n Private
n Finance
n Academic
n Inter-company (IC)
40%
34%
23%
1% 2%
2017
43%
27%
26%
1% 3%
2016

Technologies business area*: key income statement and balance sheet items (thousands of EUR)
*Includes Novian Technologies (Lithuania), Andmevara Services OU (Estonia) and Andmevara SRL (Moldova).**Includes the results of Andmevara Services OU and Andmevara SRL.*** Adjusted net profit is represented after eliminating one-off impairment of investment in subsidiaries. Impairment of UAB Acena EUR -117 thousand (additional deferred income tax income- EUR 18 thousand) is eliminated in 2019 Novian Technologies, UAB.
Novian Technologies UAB Andmevara Services OU / Andmevara SRL**
2019 2020 2019 2020
Revenue 17,072 18,223 673 651
Gross profit 2,549 2,838 672 651
EBITDA 1,258 1,628 93 65
EBIT 684 1,066 76 49
Net profit (loss)*** 462 761 41 30
Novian Technologies UAB Andmevara Services OU / Andmevara SRL**
2019 2020 2019 2020
Tangible Assets 897 611 12 19
Intangible Assets 65 62 4 3
Other non-current assets 812 287 - -
Current assets 7,793 7,228 153 134
Of which cash 2,016 1,221 29 37
Total assets 9,567 8,188 169 156
Equity 2,591 3,352 (47) (19)
Non-current liabilities 336 154 - -
Of which financial debt 328 147 - -
Current liabilities 6,640 4,682 216 175
Of which financial debt 1,205 209 130 50
Total liabilities and equity 9,567 8,188 169 156
36

Technologies business area: main financial indicators (thousands of EUR)
n 1st half n 2nd half n 1st half n 2nd half
37
0
5 000
10 000
15 000
20 000
25 000
2016 2017 2018 2019 2020
Revenue
0
200
400
600
800
1 000
1 200
1 400
1 600
1 800
2016 2017 2018 2019 2020
EBITDA
Thousands of EUR 2016 2017 2018 2019 2020
Revenue 9,736 10,065 14,111 17,745 18,874
EBITDA* 341 730 839 1,351 1,693
Novian Technologies business area shows stable growth due to its ability to operate in Lithuanian and foreign markets, allowing it to choose the mostfavorable operating scenario based on market conditions.
*IFRS 16 was implemented in 2019 with an impact on the size of EBITDA, thus the EBITDA indicators for 2016-2018 and 2019-2020 are not directly comparable.

Technologies business area: revenue by country (thousands of EUR)
72%
6%
4%
4%
4%3%
1%
6%
2020
Lithuania
Estonia
Burundi
Norway
Rwanda
United Kingdom
Latvia
Other (23 countries)
Thousands of EUR 2019 2020 Change
Lithuania 10,447 13,561 3,114
Other countries 7,298 5,313 (1,985)
Total 17,745 18,874 1,129
38
59%
10%
4%
4%
4%
4%
3% 12%
2019
Lithuania
Kyrgyzstan
Tanzania
Rwanda
Burkina Faso
Moldova
Sweden
Other (25 countries)

39%
36%
20%
3% 2%
2019
21%
37%
25%
14%
3%
2020
47%
26%
21%
4% 2%
2018
Technologies business area: revenue according to the sectors. Number of the countries
39
Over the last three years, the companies of Novian technologies business area have significantly increased revenues in the privateand financial sectors.
Revenue according to the sectors
Countries of operation
31 28 32 3230
0
5
10
15
20
25
30
35
2016 2017 2018 2019 2020
n Public
n Private
n Finance
n Academic
n Inter-company (IC)
24%
42%
32%
1% 1%
2017
21%
36%
40%
1% 2%
2016
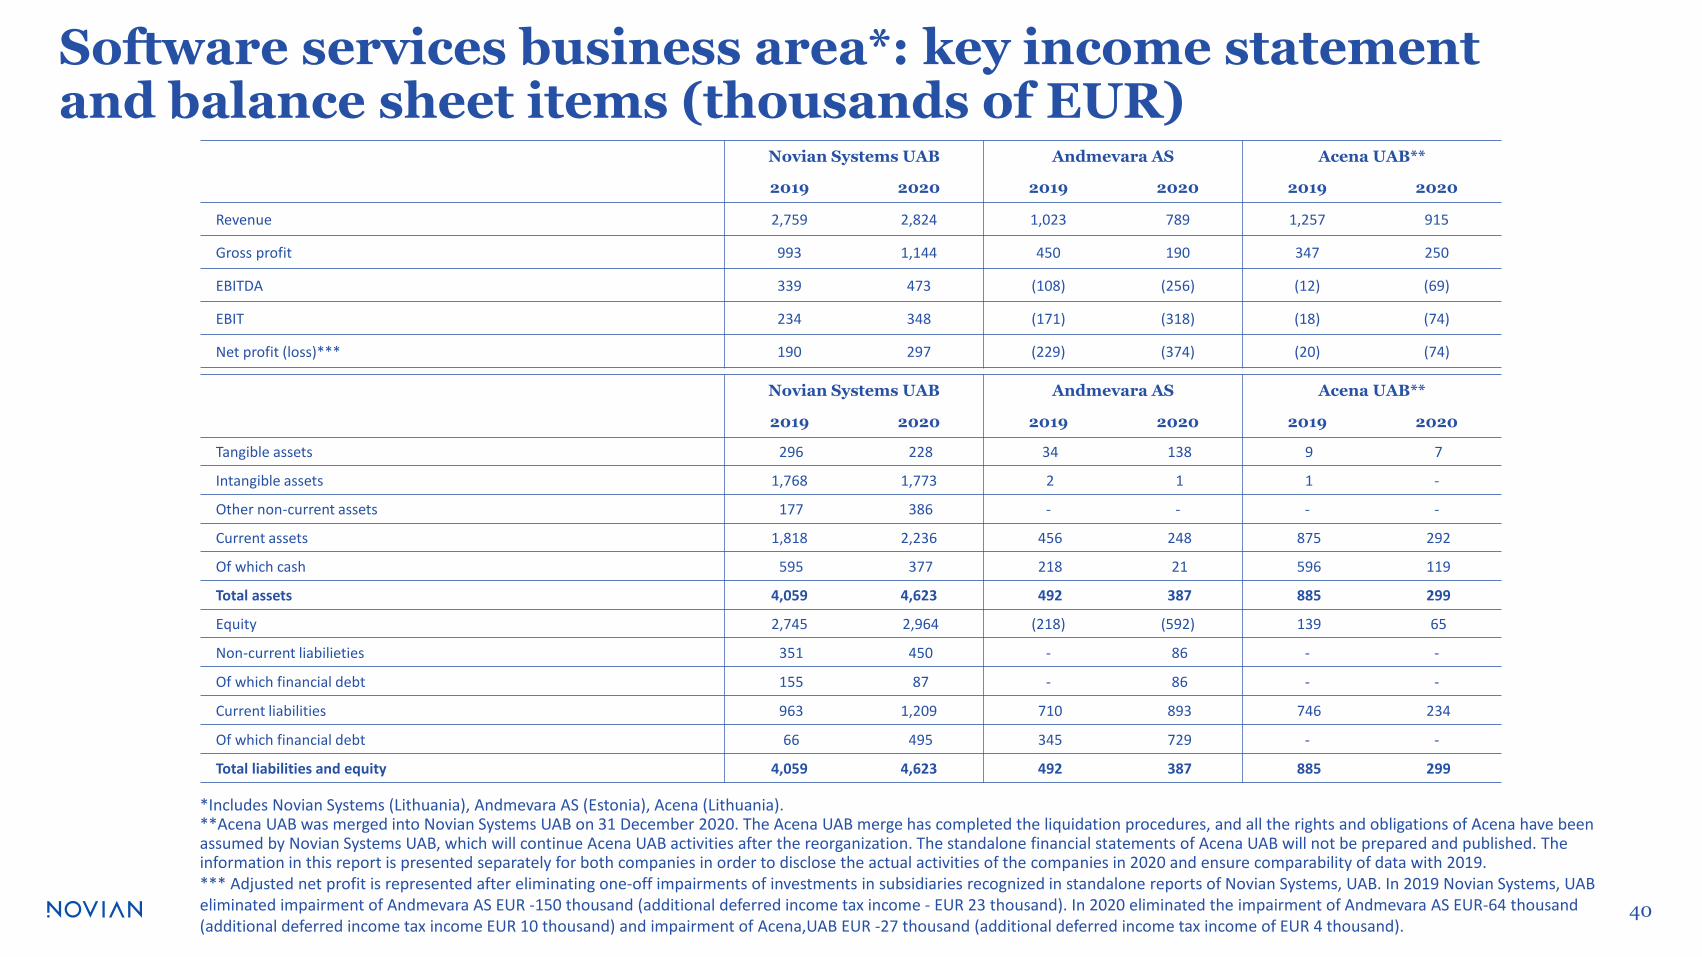
*Includes Novian Systems (Lithuania), Andmevara AS (Estonia), Acena (Lithuania).**Acena UAB was merged into Novian Systems UAB on 31 December 2020. The Acena UAB merge has completed the liquidation procedures, and all the rights and obligations of Acena have been assumed by Novian Systems UAB, which will continue Acena UAB activities after the reorganization. The standalone financial statements of Acena UAB will not be prepared and published. The information in this report is presented separately for both companies in order to disclose the actual activities of the companies in 2020 and ensure comparability of data with 2019.*** Adjusted net profit is represented after eliminating one-off impairments of investments in subsidiaries recognized in standalone reports of Novian Systems, UAB. In 2019 Novian Systems, UAB eliminated impairment of Andmevara AS EUR -150 thousand (additional deferred income tax income - EUR 23 thousand). In 2020 eliminated the impairment of Andmevara AS EUR-64 thousand (additional deferred income tax income EUR 10 thousand) and impairment of Acena,UAB EUR -27 thousand (additional deferred income tax income of EUR 4 thousand).
Novian Systems UAB Andmevara AS Acena UAB**
2019 2020 2019 2020 2019 2020
Tangible assets 296 228 34 138 9 7
Intangible assets 1,768 1,773 2 1 1 -
Other non-current assets 177 386 - - - -
Current assets 1,818 2,236 456 248 875 292
Of which cash 595 377 218 21 596 119
Total assets 4,059 4,623 492 387 885 299
Equity 2,745 2,964 (218) (592) 139 65
Non-current liabilieties 351 450 - 86 - -
Of which financial debt 155 87 - 86 - -
Current liabilities 963 1,209 710 893 746 234
Of which financial debt 66 495 345 729 - -
Total liabilities and equity 4,059 4,623 492 387 885 299
Novian Systems UAB Andmevara AS Acena UAB**
2019 2020 2019 2020 2019 2020
Revenue 2,759 2,824 1,023 789 1,257 915
Gross profit 993 1,144 450 190 347 250
EBITDA 339 473 (108) (256) (12) (69)
EBIT 234 348 (171) (318) (18) (74)
Net profit (loss)*** 190 297 (229) (374) (20) (74)
40
Software services business area*: key income statement and balance sheet items (thousands of EUR)

n 1st half n 2 half n 1st half n 2nd half
41
Thousands of EUR 2016 2017 2018 2019 2020
Revenue 4,819 5,711 6,206 5,037 4,528
EBITDA* 435 103 392 219 149
0
1 000
2 000
3 000
4 000
5 000
6 000
7 000
2016 2017 2018 2019 2020
Revenue
-300
-200
-100
0
100
200
300
400
500
2016 2017 2018 2019 2020
EBITDA
The area’s main company, Novian Systems, is operating stably (CAGR 2016-2020: revenue 6.3%, EBITDA 2.4%), through the group’s revenue has beennegatively affected by a significant reduction in the revenue of Acena UAB in 2019-2020. The drop in EBITDA was mainly due to a loss-making project atAndmevara AS and Acena’s negative operating results for 2019-2020.
* IFRS 16 was implemented in 2019 with an impact on the size of EBITDA, thus the EBITDA indicators for 2016-2018 and 2019-2020 are not directly comparable.
Software services business area: main financial indicators (thousands of EUR)

Thousands of EUR 2019 2020 Change
Lithuania 3,883 3,606 (277)
Other countries 1,154 922 (232)
Total 5,037 4,528 (509)
42
77%
20%
2% 1%
2019
Lithuania
Estonia
Norway
Other (5 countries)
80%
18%
2%
2020
Lithuania
Estonia
Other (6 countries)
Software services business area: revenue by country (thousands of EUR)

Software services business area: revenue according to the sectors. Number of the countries
64%
22%
4%6%
4%
2019
60%24%
8%
6%
2%
2020
66%
20%
8%
5% 1%
2018
Countries of operation
Revenue according to the sectors
3
9 9 8
8
0
1
2
3
4
5
6
7
8
9
10
2016 2017 2018 2019 2020
43
n Public
n Private
n Finance
n Academic
n Inter-company (IC)
69%
19%
9%
3%
2017
79%
12%
4%
5%
2016

Revenue of Zissor by country (thousands of EUR)
39%
28%
17%
6%
5%5%
2019
United Kingdom
Sweden
Finland
Germany
Greece
Other (3 countries)
Thousands of EUR 2019 2020 Change
Lithuania - 19 19
Other countries 708 692 (16)
Total 708 711 3
58%
20%
6%
6%
5%
3% 2%
2020
United Kingdom
Sweden
Norway
Germany
Greece
Lithuania
Other (2 countries)
44

CYBER SECURITY COMPANY

N R D CS . L T
Let’s cooperate on securing
digital environment!
NRD Cyber Security establishes
cybersecurity capacity building practices
and enhances cyber resilience to nations
and organizations.
The company specializes in the
establishment and modernization of
cybersecurity teams (CSIRTs) and
security operations centers (SOCs) as
well as cyber threat intelligence and
managed security services.

FOCUS
CUSTOMERS
Cybersecurity operations build-out, incident detection and
handling, establishment and support of Computer Security
Incident Response Teams (CSIRTs) and cyber capacity
enhancement at organizational and national levels
Governments, public and private sector organizations
KEY MARKETS
▪ Central governments
▪ Critical infrastructure
▪ Enterprise security
▪ Intelligence and law enforcement

4 8 I n r d c s . l t
MAIN ITEMS OF THE INCOME STATEMENT8
MAIN BALANCE SHEET ITEMS8
UAB NRD CS
2019 2020
Revenue 2,836 3,229
Gross profit 1,345 1,519
EBITDA 341 434
EBIT 218 250
Net Profit (Loss) 232 321
UAB NRD CS
2019 2020
Tangible assets 292 181
Intangible assets 92 46
Other non-current assets 213 140
Current assets 1,156 2,079
Of which cash 465 654
Total assets 1,753 2,446
Equity 1,069 1,390
Non-current liabilities 101 57
Of which financial debt 101 57
Current liabilities 583 999
Of which financial debt 42 44
Total liabilities and equity 1,753 2,446
8 The audit of the financial statements of NRD CS UAB are in progress.

4 9 I n r d c s . l t
NRD CYBER SECURITY KEY FINANCIAL DATA
Thous. Eur2016 2017 2018 2019 2020
Revenue 1,577 3,493 3,876 2,836 3,229
EBITDA*110 603 559 341 434
0
500
1 000
1 500
2 000
2 500
3 000
3 500
4 000
4 500
2016 2017 2018 2019 2020
Revenue
H1 H2
0
100
200
300
400
500
600
700
2016 2017 2018 2019 2020
EBITDA
H1 H2
* IFRS 16 was implemented in 2019 with an impact on the size of EBITDA, thus the EBITDA indicators for 2016-2018 and 2019-2020 are not directly comparable.

5 0 I n r d c s . l t
NRD CYBER SECURITY REVENUE BY COUNTRY
Thous. Eur 2019 2020 Change
Lithuania 1,801 2,490 689
Other countries 1,035 739 (296)
Total 2,836 3,229 393
77%
5%
4%
3%
2%2%
2%
5%
2020
Lithuania
Egypt
Norway
Denmark
Greece
Serbia
United Kingdom
Other
64%
27%
2%
1%1%
1% 1%
3%
2019
Lithuania
Norway
Bangladesh
Cyprus
South Africa Republic
Denmark
Switzerland
Other

5 1 I n r d c s . l t
Over the past three years, NRD Cyber Security has been able to diversify its operations
more, increasing the number of customers in the private sector. Revenues from financial
sector customers have also increased over the past two years as more and more
government and commercial banks decide to purchase the services and products
provided by NRD Cyber Security (Cyber SOC, CSIRT services, own products).
NRD CYBER SECURITY REVENUE BY SECTOR AND NUMBER BY COUNTRIES
90%
7%
1% 2%
2018
Public
Private
Financial
Academic
78%
9%
10%
3%
2019
Public
Private
Financial
Academic57%
25%
11%
7%
2020
Public
Private
Financial
Academic
10
16
21
2018 2019 2020
0
5
10
15
20
25
NUMBER COUNTRIES OF OPERATION OF NRDCYBER SECURITY *
*number of countries in which projects have been implemented.

52
NRD CYBER SECURITY PARNERSHIPS

5 3 I n r d c s . l t
NRD CYBER SECURITY PROJECTS
CSIRT/SOC ESTABLISHMENT NATIONAL CYBER
CAPACITY BUILDINGTECHNOLOGY SOLUTIONS
▪ Egypt
Fin-CIRT set-up
▪ Afghanistan
CERT maturity assessment
▪ Nigeria
Fin-CIRT set-up
▪ ENISA
Revising CSIRT/SOC
establishment methodoly
▪ Serbia
Cybersecurity ecosystem
assesment
▪ European Investment
Bank(EIB)
Development of
cybersecurity project
qualification methodology
▪ Cyprus
Cyber sensor technology
▪ Egypt
CollectiveSight platform
▪ Lithuania
Various Technological Solutions

54
NRD CYBER SECURITY PROPRIETARY PRODUCTS
SECURITY COMPUTING SOLUTION CollectiveSightSolution helps monitor cyber space, promptly identify and alert about abnormalities innetworks. It combines multiple network monitoring and analysis as well as automatedcyber sensor technology management. Kam skirtas – sektoriniams ir nacionaliniamsCSIRT/SOC‘ams. Kuriama 2 versija. Pirma jau eksploatuojama
TECHNOLOGIES FOR MANAGED SECURITY
SERVICE PROVIDERS (MSSP)CyberSetSet of technologies and operational procedures which enables the integration andautomation of typical Security Operations Center (SOC) functions for ManagedSecurity Service Providers (MSSP). Kam skirtas, kada bus pradetas pardavineti.
OSINT SOFTWARE MODULE IntEyePurpose: to reduce informational clutter and automate intelligence gathering. NRDCyber Security has created OSINT software module, which empowers users to gatherand monitor information in open sources and report on any relevant topic. Kamskirtas, pardavinejamas.

55
CONTACTS
HQ CONTACTS:
Gynėjų Street 14, Vilnius
LT-01109, Lithuania
E-mail: [email protected]
The person authorized to provide additional information:
Kazimieras Tonkūnas
INVL Technology Managing Partner
Follow us:
Financial information:Reports
Latest news
Company legal documents
Share trading

56
Disclaimer
• Investments in the shares of closed-end investment companies (hereinafter may be reffered as “CEF“) are associated with investment risk and others risks specified in the Articles of Association and
Prospectus of the closed-end investment company. The value of a company’s shares can both rise and fall, and you may recover less than you invested or even lose the entire invested amount. Past results
only show the changes in the value of a company’s shares over a past period. Past results do not guarantee future performance.
• The information provided does not encompass all the information disclosed by the company and should be read together with the company’s publicly announced financial and other information. The
financial data provided should be evaluated together with the financial statements. The data presented reflect the situation for a past period of time and results for a past period are not a reliable indicator of
future performance.
• The closed-end investment company and (or) the Management Company of the closed-end investment company does not guarantee the profitability of investments. The latest values of the shares of the
closed-end investment company are available on the website www.invltechnology.com.
• Before making a decision to invest, you should personally or with the help of investment advisors assess the selected closed-end investment company‘s investment strategy, applicable fees and all
investment-related risks. You should also carefully read closed-end investment company‘s ’s Prospectus, Rules and Key Investor Information Document and other share distribution documents. These
documents are available for review on the website www.invltechnology.com.
• All the information presented is of a promotional-informative nature and cannot be construed as a recommendation, offer or invitation to invest in the shares of the closed-end investment company. The
closed-end investment company and (or) the Management Company of the closed-end investment company is not responsible for any decisions taken by third parties on the basis of information provided in
this website alone and assumes no responsibility for expenses or direct or indirect losses experienced when using only this information. The information provided cannot be the basis for any subsequently
concluded agreement. Although the content of this information of a promotional nature is based on sources considered to be reliable, the closed-end investment company and (or) the Management
Company of the closed-end investment company is not responsible for inaccuracies or changes in the information, or for losses that may arise when investments are based on this information.
• The right of investors in the closed-end investment company to demand redemption of shares which they hold is restricted.

FINANCIAL REPORTING INFORMATION
NRD companies AS
Norway Registers Development AS
NRD systems
Etronika
Novian Technologies
Novian Systems
Zissor
NRD CS
2020
2020
2020
2020
2020
2020
2020
2020
PricewaterhouseCoopers AS
PricewaterhouseCoopers AS
BDO auditas ir apskaita, UAB
BDO auditas ir apskaita, UAB
BDO auditas ir apskaita, UAB
BDO auditas ir apskaita, UAB
Revisorkollegiet AS
BDO auditas ir apskaita, UAB
Company Financial year Auditor
The Company’s financial statements have been prepared in accordance with International Financial Reporting Standards (IFRS) as adopted by the European Union (EU).
Presented Audited results of INVL Technology for 2020:
INVL Technology 2020 Auditor – PricewaterhouseCoopers UABINVL Technology 2020 Independent evaluator - Deloitte verslo konsultacijos UAB

THANK YOU