INVESTOR SEMINAR
48
INVESTOR SEMINAR 12 October 2021
Transcript of INVESTOR SEMINAR

TP ICAP Classification: Public
INVESTOR SEMINAR12 October 2021

TP ICAP Classification: Public2
1. Introduction

TP ICAP Classification: Public3
Introduction
Eric SinclairCEO
Chris DearieDeputy CEO & Chief
Strategy Officer
David PerkinsHead of Post
Trade Solutions
Jonathan CooperChief Revenue Officer
Parameta Solutions Leadership Team and Agenda
1. Introduction
2. Financial Market Data Industry
3. Post Trade Solutions Industry
4. Strategy
○ Product & Demo
○ Distribution
○ Clients
5. Targets and Investment Case
6. Q&A

TP ICAP Classification: Public4
Introduction
Group Structure
Global Broking Energy & Commodities Agency Execution Parameta Solutions
Data & Analytics (D&A)
Post Trade Solutions (PTS)

TP ICAP Classification: Public5
Introduction
Investment Case
1
2
3
Unique Solutions
Focused Strategy
Highly Valuable

TP ICAP Classification: Public
0
50
100
150
2018 2019 2020 H1 2021
6
Introduction
Data & AnalyticsStrong double-digit growth
Revenue (£m)
Contribution (£m)
Operating Profit (£m)
Data & Analytics
✓ World’s leading provider of scarce, neutral OTC pricing data
- 500,000+ instruments
- 1,000+ institutional clients
- 200+ staff globally
✓ Consistent double-digit revenue growth and strong operating margin
✓ 94% recurring reliable, predictable, subscription-based revenue
✓ 2-year rolling license agreements with over 98% renewal rate
Rates
OTC COVERAGE
MoneyMarkets
FX Credit
Fixed IncomeEquity
DerivativesEnergy Commodities
35
29
Note: Graphs presented on a constant currency basis
0
20
40
60
80
2018 2019 2020 H1 2021
72
0
20
40
60
80
2018 2019 2020 H1 2021
TP ICAP Classification: Public
0
5
10
15
20
25
2018 2019 2020 H1 2021
0
5
10
15
20
25
2018 2019 2020 H1 2021
7
Introduction
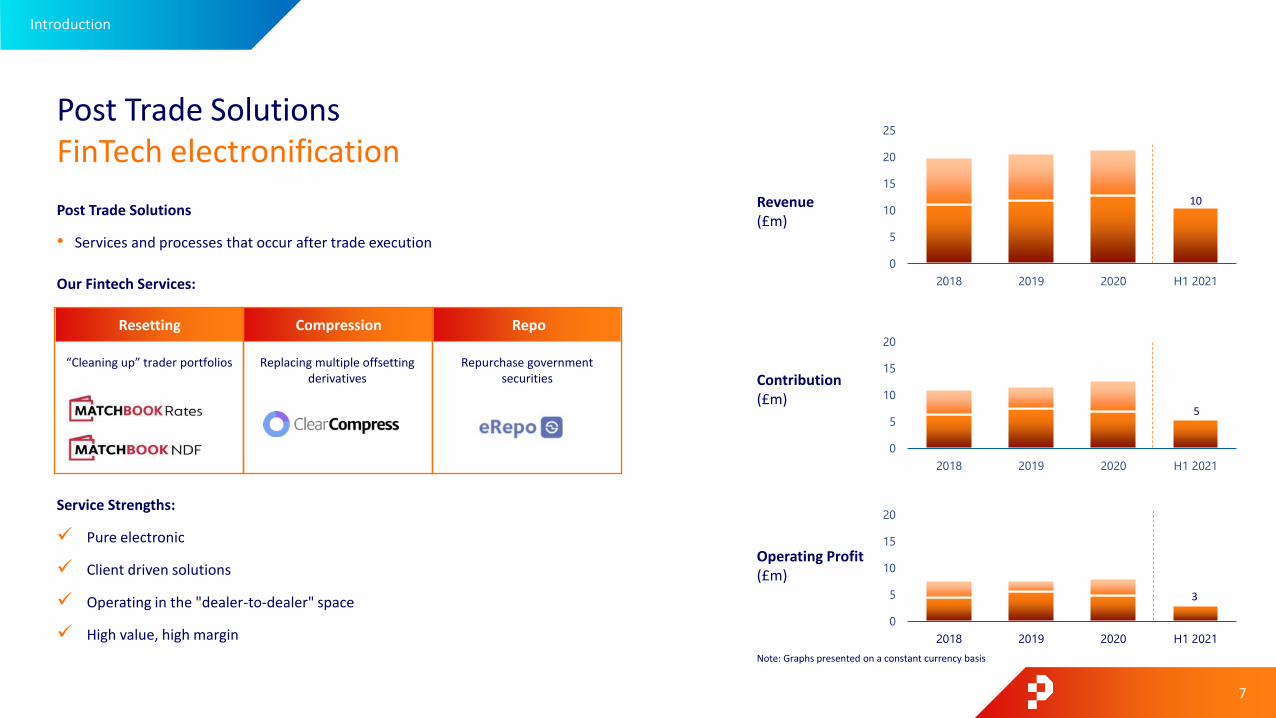
Post Trade SolutionsFinTech electronification
Revenue (£m)
Contribution (£m)
Operating Profit (£m)
Post Trade Solutions
• Services and processes that occur after trade execution
Service Strengths:
✓ Pure electronic
✓ Client driven solutions
✓ Operating in the "dealer-to-dealer" space
✓ High value, high margin
Our Fintech Services:
Resetting Compression Repo
“Cleaning up” trader portfolios Replacing multiple offsetting derivatives
Repurchase government securities
3
5
10
Note: Graphs presented on a constant currency basis
0
5
10
15
20
25
2018 2019 2020 H1 2021

TP ICAP Classification: Public8
2. Financial Market Data Industry
1. Introduction
2. Financial Market Data Industry
3. Post Trade Solutions Industry
4. Strategy
o Product & Demo
o Distribution
o Clients
5. Targets and Investment Case
6. Q&A

TP ICAP Classification: Public
$30.7bn$31.8bn
$33.3bn
$35.3bn
$37.1bn
$39.4bn
2015 2016 2017 2018 2019 2020
Financial Market Data Industry
5% CAGR
Source: Burton-Taylor International Consulting
Clients
• Sell side (e.g. Banks)
• Buy side (e.g. Asset managers and owners)
• Utility providers
• Governments & Central Banks
• Corporates
• Benchmarks and Indices Providers
Users
Content Generators Data Aggregators & Re-distributors
c.$7bn revenues
- Exchanges
- IDBs
- News Organisations
- Alt Data / Research
c.$32bn revenues
- LSEG / Refinitiv
- Bloomberg
- S&P / IHS Markit
- ICE Data Services
Participants
• Compliance & surveillance teams
• Corporate treasurers
• Risk managers
• Traders
• Data scientists and Quants
• Valuation Control Groups
9
Financial Market Data Industry
Financial Market Data Overview$39.4 billion industry growing 5% p.a.

TP ICAP Classification: Public
IDB Data Industry:
• Inter-Dealer-Brokers (“IDBs”) data revenue is 0.8% of industry
• 8% CAGR revenue growth for IDBs
• IDBs produce neutral Over-the-Counter (“OTC”) data
• IDB data used to create value-added products and services
$321m Revenue 2020 – IDB Segment 8% CAGR
Other
Source: Burton Taylor International Consulting
10
Financial Market Data Industry
Parameta Solutions Competitive Advantage:
✓ World’s largest IDB with the most comprehensive OTC data
✓ Largest OTC data global sales force
✓ Global product expertise in highest growth segments
✓ Largest number of direct client relationships in sector
✓ Agile dedicated technology team for clients
IDB Data IndustryParameta Solutions is the leading provider

TP ICAP Classification: Public11
Financial Market Data Industry
Growth Driver Reason
Independent Data Objective source, positions not taken in securities priced World’s largest provider of independent IDB OTC data
RegulationOpportunities in Benchmarks & Indices, Evaluated Pricing and Regulatory Products
Independent, transparent and observable data
Data ScarcityCreates additional opportunities to support price and liquidity discovery
Uniquely qualified to provide this data
Cloud Technology Disrupting legacy distribution models of financial market data Meeting clients in the cloud to increase agility and reduce costs
Risk Management Growing need for secondary risk management solutions Trusted provider and operator of client led solutions
Financial Market Data Growth -Well-placed to capitalise on trends
Our Advantage
Financial Market Data GrowthWell placed to capitalise on trends

TP ICAP Classification: Public
Our Current Growth market:
• IDBs data – c.$321m market with 8% CAGR (our current market)
• IDBs are only 0.8% of the Financial Market Data industry
Our Near-term Target Growth Markets:
• Benchmarks & Indices - $4.1 bn market with 11% CAGR
• Evaluated Pricing - $3.8 bn market with 8% CAGR
• Other opportunities - Regulatory Products and Trade Analytics
$39.4 billion Industry by Sector
12
Financial Market Data Industry
IDB data: $0.3 bn(0.8% of $39 bn market)8% CAGR
Terminals & Data Fees$13.0 bn2% CAGR
Portfolio Mngt & Analytics$6.6 bn7% CAGR
Pricing, Reference & Valuation$5.9 bn10% CAGR
(Evaluated Pricing - $3.8 bn – 8% CAGR) Research
$4.5 bn7% CAGR
Exchanges$2.2 bn6% CAGR
News$1.6 bn1% CAGR
IDB & Other$1.6 bn7% CAGR
Benchmarks & Indices$4.1 bn11% CAGR
Source: Burton-Taylor International ConsultingNote: All CAGRS 5 years except IDBs which are 4yr
Financial Market DataSignificant opportunities in high growth sectors

TP ICAP Classification: Public
Bloomberg36%
ICE Data Services30%
Refinitiv22%
Other providers
12%
13
Financial Market Data Industry
$3.8bn Market in 20208% 5-yr CAGR
Industry Overview
• Risk and Regulation → higher standards in OTC evaluated pricing required
• ‘Observable’ trade and order data → higher value in pricing ‘waterfall’
• Transparent, comprehensive, transactions data (order and trade) for OTC derivatives → not currently available
Market Trends Benefitting Parameta Solutions
• Increasing demand for pricing data transparency
• Existing services have high dependency on model-based data
• Increased demand for actual transaction data vs modelled data
• Transparency of evaluation and observability process increasingly important, perceived to be lacking with existing services
Evaluated Pricing
Targeting Growth SectorsClients require greater observability and transparency
Source: Burton-Taylor International Consulting

TP ICAP Classification: Public
MSCI25%
S&P Dow Jones Indices
24%
FTSE Russell19%
NASDAQ8%
Qontigo4%
Bloomberg4%
ICE2% Other
14%
$4.1bn Market in 202011% 5-yr CAGR
Source: Burton-Taylor International Consulting
14
Financial Market Data Industry
Industry Overview
• Double-digit growth rate
• OTC markets are fastest growing sub-sectors e.g.:
o 15% growth Fixed Income indices
o 31% growth Environmental, Social and Governance (“ESG”) indices
Market Trends Benefitting Parameta Solutions
• Passive investment growing, needing specialist benchmarks
• Non-traditional benchmarks needing bespoke data to accurately compare performance against their asset allocation strategy
• Increasing conflicts of interest from banks managing OTC indices make our independent neutral data more valuable
• Benchmarks increasingly important in Energy transition products
Targeting Growth SectorsUnique position to target OTC Benchmarks and Indices
Benchmarks and Indices
TP ICAP Classification: Public15
3. Post Trade Solutions Industry
1. Introduction
2. Financial Market Data Industry
3. Post Trade Solutions Industry
4. Strategy
o Product & Demo
o Distribution
o Clients
5. Targets and Investment Case
6. Q&A

TP ICAP Classification: Public
Our Services Description Competitors Est. market size1
Resetting• “Cleaning up” residual fixing risks
• From LIBOR portfolios or other underlying index-based products2
• CME Reset
• Capitalab
• Tradeweb
Compression• Replacing multiple offsetting derivative contracts
• Results in fewer contracts of the same net risk to reduce notional value of portfolio
• TriOptima
• Quantile
• Capitolis
Repo• Electronic Trading Solution for "Repurchasing agreements"
• Dealers in government securities where both parties commit to repo the same asset at a future date
• CME Brokertec
• MTS Repo
• Eurex Repo
1. Based on management estimates 2. LIBOR is a forward-looking term rate. Fixing applies for a period of time (1-month, 3-month etc.) creating mismatches between fixings that need mitigating
$140m
$35m
$70m
Post Trade Solutions – Crucial for efficient financial systems
PTS
16
Post Trade Solutions Industry
What are Post Trade SolutionsLarge addressable market for multi-lateral optimisation

TP ICAP Classification: Public17
4. Strategy 1. Introduction
2. Financial Market Data Industry
3. Post Trade Solutions Industry
4. Strategy
o Product & Demo
o Distribution
o Clients
5. Targets and Investment Case
6. Q&A

TP ICAP Classification: Public
Product
Distribution
Client Diversify and expand our client and user base
Build products and services that increase the addressable market size
Grow the direct and multi-channel model
18
Strategy
Strategy OverviewThree pronged approach to sustain success

TP ICAP Classification: Public
Product
Distribution
Client Diversify and expand our client and user base
Build products and services that increase the addressable market size
Grow the direct and multi-channel model
19
Strategy - Product
Strategy OverviewTargeting high growth sectors

TP ICAP Classification: Public
Asset Class Pricing Data
Evaluated Pricing
Post Trade Analytics
Predictive Analytics
Wisdom
Data
Information
Knowledge
Wisdom
Increasing value to client
20
Strategy - Product
How are we accessing new addressable markets?
• Precise targeting of resources for greatest revenue
impact
• Adjacent product areas focuses on building market
relevance
• Client engagement for early stage production idea
generation
• Leverage data multiple times to create additional
value-added solutions
• Repeatable process reducing time to market for
subsequent product launches
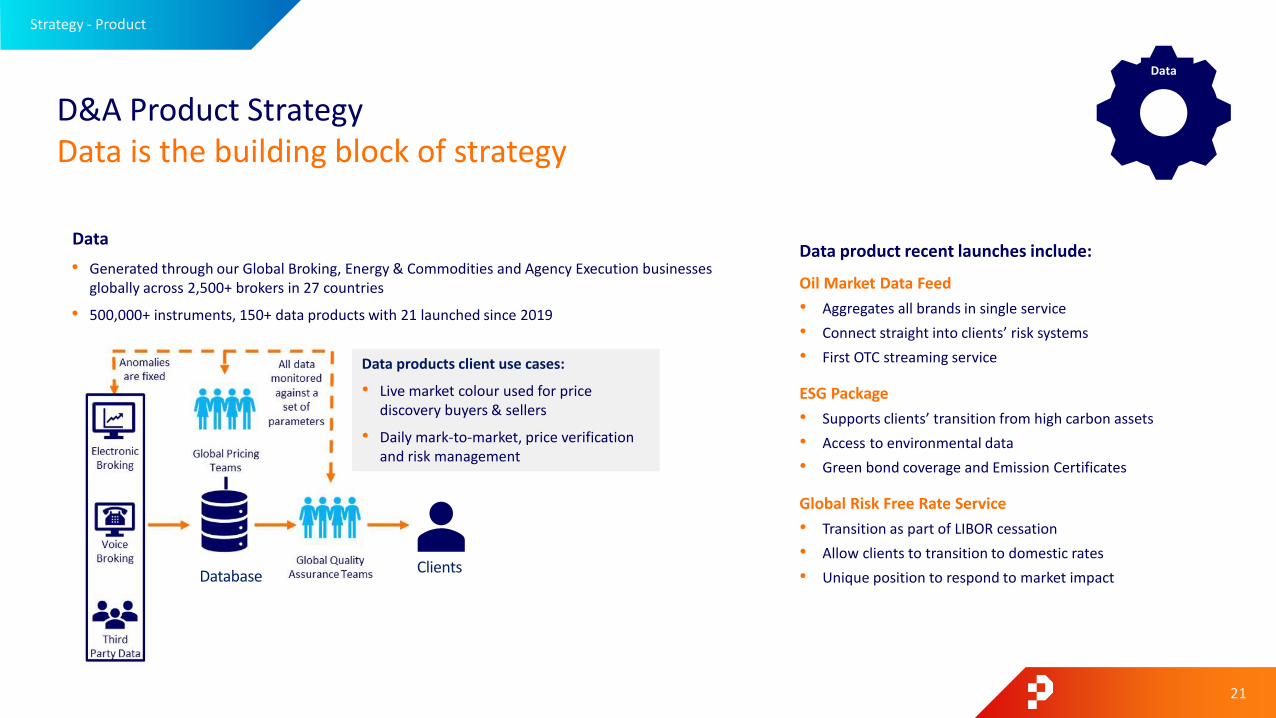
D&A Product StrategyPrecision in pursuing new addressable markets
TP ICAP Classification: Public
Data product recent launches include:
Oil Market Data Feed
• Aggregates all brands in single service
• Connect straight into clients’ risk systems
• First OTC streaming service
ESG Package
• Supports clients’ transition from high carbon assets
• Access to environmental data
• Green bond coverage and Emission Certificates
Global Risk Free Rate Service
• Transition as part of LIBOR cessation
• Allow clients to transition to domestic rates
• Unique position to respond to market impact
Data
• Generated through our Global Broking, Energy & Commodities and Agency Execution businesses globally across 2,500+ brokers in 27 countries
• 500,000+ instruments, 150+ data products with 21 launched since 2019
Data
ClientsDatabase
21
Strategy - Product
D&A Product StrategyData is the building block of strategy
Data products client use cases:
• Live market colour used for price discovery buyers & sellers
• Daily mark-to-market, price verification and risk management

TP ICAP Classification: Public22
Strategy - Product
New Product MomentumRFR driving significant new subscription revenue
Delivering Valuable Insight
• One of the 21 new products
• Unique position at heart of OTC markets
• Actively responding to new market themes with
data products
• Significant high-margin subscription revenues from
new products
Data
RFR Adoption vs. New Subscriptions
1. Percentage of DV01 traded in SOFR USD overnight index swaps. Represents the adoption level of SOFR as the USD risk free rate in the transition away from USD LIBORSource: ISDA-Clarus
1
0
20
40
60
80
100
120
140
160
180
200
0%
2%
4%
6%
8%
10%
12%
14%
Jan-19 Apr-19 Jul-19 Oct-19 Jan-20 Apr-20 Jul-20 Oct-20 Jan-21 Apr-21 Jul-21
ISDA-Clarus USD RFR Adoption Indicator PS D&A RFR Subscriptions
# SubscribersAdoption Indicator

TP ICAP Classification: Public
Evaluated Pricing use cases
• Used by buy side and sell side clients for trading and risk decision
• Regulations such as IFRS 12, Prudential Valuation and FRTB2 require clients to show observability of data
Information
23
Strategy - Product
1. Value-added services such as: Indices, Transaction Cost Analysis (“TCA”) or independent portfolio valuations2. Fundamental Review of the Trading Book (“FRTB“)
0
50
100
150
200
250
300
TOM NXT 02W 01M IM1 04M IM2 07M IM3 10M IM4 15M 21M 03Y 05Y
Bas
is P
oin
ts
GBPUSD tenors
FEP MID TRADES BID ORD ASK ORD
Why Target Evaluated Pricing?
• Regulatory scrutiny driving need for observable, order and trade data
• Lack of observable OTC data we are uniquely positioned to provide
• Drives other value-added services1
Creation of Evaluated Pricing Solutions
• Proprietary machine learning model developed to price securities
• Began with Bonds in 2020, FX launched in H1 2021
• Comprehensive statistical detail in hourly snaps for varying valuation times
Growth Sector ProductsEvaluated Pricing – our unique solution leveraging unique data
Future products include:
• Rates, Credit, Equity Derivatives and E&C products
• Risk products:
o Liquidity modelling
o Independent derivatives valuations
o Risk as a service solutions
Evaluated Pricing Product Example

TP ICAP Classification: Public24
Strategy - Product
Benchmark Regulation
ControlsOversight
Transparency
Information
Why Target Benchmarks and Indices?
• Independent, neutral, conflict free data from global venues
• Producer of 19 key Benchmarks in Interest Rates
• Provider to systemically important Benchmarks e.g. ICE Swap Rate
Growth Sector ProductsOTC Benchmarks and Indices - driving continued growth
Creation of Benchmarks and Indices
• Index must represent the ‘economic reality’ of a market
• Use as reference in contracts, or to price products makes index a Benchmark
• Aim – to become the Benchmark standard or reference rate
Current and Future Revenue Opportunities
1. Licensing data for Benchmarks and Indices use
2. Data fuels global Risk Free Rates
3. Potential to launch indices in the future
a. Where TP ICAP liquidity is “Economic Reality”
b. Tradeable products drive activity to venues for hedging or exposure
Benchmarks and Indices use cases
• Benchmarks used by issuers of securities e.g. in bonds
• Bank Quantitative Investment Solutions groups use indices in derivative products sold to buy side
Information

TP ICAP Classification: Public
Financial Stability
Financial Integrity
Consumer Protection
REGULATORY AIMS
25
Strategy - Product
Information
Growth Sector ProductsRegulatory Products meet clients’ increasing obligations
1. Fundamental Review of the Trading Book (“FRTB”)
Why Target Regulatory Products?
• Clients have increased reporting obligations to clients and regulators
• Large client fines driving demand for comprehensive surveillance data
• Client focus on reducing capital requirements for derivatives positions
Creation of Analytics Services
• MiFID II introduced regulatory reporting for OTC venues and participants
• Surveillance regulations require order and trade overview globally
• FRTB1 driving demand for “real & observable prices”
Regulatory Products use cases
• Large tier one banks need to demonstrate oversight of traders for market abuse
• FRTB1 internal model approach reduces capital requirements for illiquid instruments →needs evidence of trades and orders data from Parameta Solutions
Regulatory Product Examples
• Clients Use MiFID Trade and Order Recap Service
– For reporting and record keeping requirements
• Expanding Market Abuse Surveillance Solution
– Aggregate clients’ order & Trade data globally
• FRTB service to be launched using Evaluated Pricing
– To include order and trade flags for all OTC asset classes
Information

TP ICAP Classification: Public26
Strategy – Product
Growth Sector ProductsTrading Analytics creates valuable client insights
Why Target Trading Analytics?
• Best execution and transparency driving demand for analytics
• Buy side product focus increases client diversity
• Solution integrates client data, increasing ‘stickiness
Creation of Analytics Services
• Evaluated Pricing enables clients to Benchmark performance
• Cloud technologies allowed faster time to market
• Combining position data, market and external data to create predictive analytics
Trading Analytics use cases
• Asset manager must show clients quality of execution achieved compared to external benchmarks and other metrics
• Will allow Portfolio Managers to find securities meeting fund parameters. Where a specific bond is illiquid, the system will suggest similar bonds
• Includes asset classes as Evaluated Pricing launched
• Observable OTC transaction data is a competitive advantage
• Simple web interface maximises utility at a lower cost
Wisdom
Knowledge

TP ICAP Classification: Public27
Strategy - Product
Trading Analytics Demonstration

TP ICAP Classification: Public28
Strategy - Product
Technology Case StudyTrading Analytics leveraging key technology
Overview
• Leverages best-of-breed technology solutions to better serve client needs:
o Cost efficient distribution of data and services
o Appeals to buy side and promotes diversification objectives
o Supported by Data Science and Engineering principles
o Big Query underpinning Analytics Power
o Future proof for growth and diversification of solutions
o AI Driven Analytics dashboards reduces time to market
• Cloud database with secure data share and on-demand storage and compute
• Platform accesses full Indicative data and transactions archive
• AI Driven Business Intelligence platform used for client dashboards
• Enables clients to perform Google type searches on transactional data
• Search engine technology powering Google powers TCA metrics
• Ability to scale based on clients’ needs rather than limits on compute
• Workflow management system originally built by Airbnb
• Efficient transport of data at scale between systems used in TCA platform

TP ICAP Classification: Public
Partner Testimonial – View from Google
29
"Google Cloud is delighted to collaborate with TP ICAP Parameta Solutions on its
Trading Analytics solution, which leverages the best of our cloud capabilities to
develop an innovative data and analytics platform. The solution will help address
the ever-changing regulatory landscape and adds new value to the financial
services industry through better trade execution services."
Jasmine Arora, Head of Capital MarketsFinancial Services UKI, Google Cloud Platform

TP ICAP Classification: Public30
Strategy - Product
MatchbookEstablished high margin electronic solution
Competition/ Addressable Market*
• Addressable market: $70m
• Matchbook market share: 30%
Trends / Products
• Increased competition
• Structural headwinds in Rates market
• Indicators of improving macro conditions
Competitive Advantages
• Powered by best OTC data
• Agile proprietary technology
Clients and Revenue model
• Client mix: 100% dealer activity
• Revenue model: Traded volume based
• Market share growth opportunity in Asian Non-Deliverable Forward (NDF)
• Expansion of RFR index coverage
• Increased currency coverage
• Add new non-LIBOR products
• Enhance efficiency of algorithmic solver to improve "fill rates" and execution
• Increase sales capacity
• Continued client acquisition drives opportunity to benefit from exponential matching results
* Management estimates
GROWTH OPPORTUNITIES
$70m
Matchbook

TP ICAP Classification: Public31
Strategy - Product
$140m
ClearCompress
GROWTH OPPORTUNITIES
ClearCompressFinTech compression service
Competition/ Addressable Market*
• Addressable market: $140m
• ClearCompress is a new market entrant
Trends / Products
• Client driven solutions
• Solving for evolving regulations
• LIBOR cessation creates an opportunity
Competitive Advantages
• Established industry working group of 27 dealers
• Agile proprietary technology
• Award winning
• Leveraging Parameta Solutions
Clients and Revenue model
• Client mix: 100% dealer activity
• Revenue model: Compressed notional based
• Market share growth opportunity • Expansion of current solutions
• Launch LIBOR to RFR transition service
• Working group engagement enables innovation
• Increase sales capacity
• Continued client acquisition
• Regional expansion (APAC & LATAM)* Management estimates

TP ICAP Classification: Public32
Strategy - Product
$35m
eRepo
GROWTH OPPORTUNITIES
eRepoElectronic platform with increasing client engagement
Competition/ Addressable Market*
• Addressable market: $35m
• eRepo market share: 10%
Trends / Products
• Clients want increased competition in the electronic repo space
Competitive Advantages
• Competitive fee schedule
• Subscription fee option
Clients and Revenue model
• Revenue model: Mix of traded volume based and subscription (65% / 35% split)
• Client mix: 100% dealer activity (LCH Clearing members only)
• Market share growth opportunity • Expand breadth of government securities offered
• Enrich system functionality to enhance client workflow and user experience
• Increase sales capacity
• Extend platform membership
• Continue the deployment of new subscription model
* Management estimates

TP ICAP Classification: Public
Summary:
33
Strategy - Product
Build on continued growth of data
Client-led product development
Focus where Parameta Solutions has a differentiated offering
Progressive, agile, component based development
Post Trade Solutions benefits from being part of Parameta Solutions
Product Strategy Increasing value for clients and expanding our addressable market

TP ICAP Classification: Public
Product
Distribution
Client Diversify and expand our client and user base
Build products and services that increase the addressable market size
Grow the direct and multi-channel model
34
Strategy - Distribution
Strategy OverviewFacilitating greater client optionality

TP ICAP Classification: Public
Major Market Data Vendors
Challenger Market Data Vendors
Carriers Public Cloud
35
Strategy - Distribution
Distribution OverviewEvolving network of partners
Major Market Data Vendors
• Continue to dominate financial services for market data provision
• Consolidation (LSEG, S&P/IHS Markit) shows strong relationship need
• Collaborating with and utilising emerging technology providers (challengers)
Challenger Market Data Vendors / Carriers
• Diversification reduces revenue concentration with largest vendors
• Carriers increasingly see content aggregation as a differentiation
• Consolidation in the market is blurring channel partner types
Public Cloud
• Most significant disruption to Market Data distribution
• Interoperability becoming a key feature of Client cloud requirement
• Main providers, AWS, GCP and Azure have unique key strengths

TP ICAP Classification: Public
CLIENTS
36
Strategy - Distribution
Comprehensive suite of solutions
• Direct Delivery → Fast path to subscription revenue
• Channel Partners → Instant global scale to network of professional users
• Public Cloud → Drives innovation and generates new revenue
Direct Delivery
• Data Feeds
• Internet Display
• Webstore
Public Cloud
• AWS
• Azure
Channel Partners
• Bloomberg
• Refinitiv/LSEG
• S&P Global/IHS Markit
DistributionEnabling client optionality

TP ICAP Classification: Public37
Strategy - Distribution
Distribution TechnologyData Share - Enabling client agility and lowering infrastructure costs
Delivery Applications
Market Data Aggregators
Internet or Leased Line
ClientClient side
ApplicationsUsers
Traditional Data Distribution
Parameta Solutions Data Share
Users
VERSUS
• Data Share used by Quants and Data Scientists
• Lowers cost of access
• Enables data to be combined from multiple sources
• Allows direct dialogue with the user
• Controls amount, range and timeliness of data for access
• Live commercialised platform

TP ICAP Classification: Public
Product
Distribution
Client Diversify and expand our client and user base
Build products and services that increase the addressable market size
Grow the direct and multi-channel model
38
Strategy - Client
Strategy OverviewGrowing clients and users

TP ICAP Classification: Public
Buyside New clients including Asset Owners, Hedge Funds, Pension Funds and Insurance Companies
E&C Helping the world's largest producers, trading firms, utilities and corporates execute their transition strategy
Strategic AccountsPartnering with the world's largest financial institutions to drive growth
Client Success Drive adoption/retention across Platinum Accounts in key products and solutions
Specialist Sales Supporting technical sales including Risk, Benchmarks & Indices and Technology
Americas EMEA APAC
39
Strategy - Client
Global SalesExecuting the strategy
Structured and scientific approach
• Shortened sales cycle → 16 months to 9 months
• Regional leadership → scale for growth
• Client segment-based resource → grow in strategic areas

TP ICAP Classification: Public40
Strategy - Client
Locations
Frequency of Service
Business Functions
Applications
Distribution
Subscription ServiceCommercial Use Case

TP ICAP Classification: Public41
Strategy - Client
Sparta Commodities Testimonial

TP ICAP Classification: Public
“Parameta Solutions provides data solutions to BFAM Partners across several asset classes. With the help of Parameta Solutions, we can commit to delivering high-quality outcomes to our funds. We are excited about their new data cloud offering.”
BT Pension FundBoris Molls
Head of Markets
“We enjoy a longstanding relationship with Parameta Solutions utilising their scarce, unique and highly accurate content to help drive our internal valuation and modelling capabilities. Their innovative and collaborative approach to product development is helping to shape future trading possibilities”
“Parameta Solutions has long been a trusted partner to Balyasny Asset management. Their unique pricing data drives investment decisions and power risk and valuations. We are extremely optimistic about Parameta's innovation in cloud delivery”
42
Strategy - Client
Strategy SummaryVoice of the Client

TP ICAP Classification: Public43
5. Targets and Investment Case
1. Introduction
2. Financial Market Data Industry
3. Post Trade Solutions Industry
4. Strategy
o Product & Demo
o Distribution
o Clients
5. Targets and Investment Case
6. Q&A

TP ICAP Classification: Public
£135m£145m
2019 2020 Mediumterm target
c.11% CAGR50.4% 51.0% c.50%
c.53%
2019 2020 2023 target
Mediumterm target
43.7% 44.1% c.45%
c.48%
2019 2020 2023 target
Mediumterm target
44
Targets and Investment Case
1. Post Trade Solutions was previously part of Global Broking at the time of Capital Markets Day in December 2020
Key Financial TargetsDelivering on our stated financial targets
Post Trade Solutions
• Nascent solutions have significant growth prospects
• Strong pipeline of new services and products
• Market share growth opportunities exist in all three services
TP ICAP Capital Markets Day in December 2020 gave three financial targets for Data & Analytics1
D&A Revenue Growth
• Medium term target of c.11% CAGR
D&A Contribution Margin
• 2023 target of c.50%
• Medium term target of c.53%
D&A Operating Margin
• 2023 target of c.45%
• Medium term target of c.48%

TP ICAP Classification: Public
Sell side
Buy side
Corporates
E&C
Data
Information
Wisdom
Knowledge
Data
Sell side
Buy side
Corporates
E&C
Medium term
Target
Medium term
Target
45
Targets and Investment Case
Revenue %
Clients %
Strategy ExecutionProgress towards achieving our strategic goals
Product - Increasing Value for Clients
• Potential for greater revenue, profitability and expanded market presence outside of IDBs
o Launched FX Evaluated Pricing (Information product) in H1
o Today launching Trading Analytics (Knowledge product)
o New products represents over a third of net new sales YTD
Distribution – Direct and Multi-channel
• Enable clients and improve optionality and accessibility
o First paying client for direct display and data share, cloud based distribution solution in H1 2021
o Increase number of channel partners with 3 additional new partners this year
Clients – Diversify and Expand
• Proactive focus on buy side clients and diversify client mix
o Added 30+ new buy side clients in H1 2021
o 40% of net new sales YTD have been to non sell side clients

TP ICAP Classification: Public
Targets and Investment Case
Investment Case
1
2
3
Scarce, neutral OTC data on an unmatched scale
Executing in high growth sectors with momentum
Double-digit growth with sticky, high margin revenues
Unique Solutions
Focused Strategy
Highly Valuable
46

TP ICAP Classification: Public47
6. Q&A

TP ICAP Classification: Public
This presentation has been prepared by TP ICAP plc (together with its subsidiaries, the “Group”) solely for informational purposes. No representation or warranty express or implied is made as to, and no reliance should be placed on, the fairness, accuracy, completeness or correctness of the information or any opinion contained herein. The information contained in this presentation should be considered in the context of the circumstances prevailing at the time and will not be updated to reflect material developments that may occur after the date of the presentation.
This presentation contains certain forward-looking statements. These forward-looking statements can be identified by the use of forward-looking terminology, including the terms “believes”, “estimates”, “anticipates”, “expects”, “intends”, “plans”, “may” or “will” or, in each case, their negative or other variations or comparable terminology or by their context. These forward-looking statements include all matters that are not historical facts, and in particular those items indicated as targets, ambitions or expectations of future results. They appear in a number of places and include, but are not limited to, statements regarding the Group’s intentions, beliefs or current expectations concerning, amongst other things, results of operations, financial condition, liquidity, prospects, growth and strategies. By their nature, forward-looking statements involve risks and uncertainties because they relate to events and depend on circumstances that may or may not occur in the future. A multitude of factors including, but not limited to, changes in demand, activity in the financial markets, competition and technology or the regulatory environment, can cause actual events, performance or results to differ materially from any anticipated development. Forward-looking statements are not guarantees of future performance and the actual results of operations, financial condition and liquidity, and the development of the industry in which the Group operates, may differ materially from those made in or suggested by the forward-looking statements set out in this presentation. Past performance of the Group cannot be relied on as a guide to future performance. Forward-looking statements speak only as at the date of this presentation and the Group expressly disclaims any obligations or undertaking to release any update of, or revisions to, any forward-looking statements in this presentation.
Nothing in this presentation should be considered to be a forecast of future profitability or financial position of the Group and none of the information in this presentation is or is intended to be a profit forecast, dividend forecast or profit estimate.
To the extent available, the industry, market and competitive position data contained in this presentation come from official or third-party sources, which may or may not be publicly available. Third-party industry publications, studies and surveys generally state that the data contained therein have been obtained from sources believed to be reliable, but that there is no guarantee of the accuracy or completeness of such data. While the Group reasonably believes that each of these publications, studies and surveys has been prepared by a reputable party, the Group has not independently verified the data contained therein. Accordingly, undue reliance should not be placed on any of the industry, market or competitive position data contained in the presentation. The information included in this presentation does not purport to be comprehensive.
This presentation does not constitute, and should not be construed as, part of any offer or invitation for the sale or purchase of securities or any businesses or assets described in it and it is not intended to provide the basis of any investment decision nor does it or is it intended to form the basis of any contract for acquisition of or investment in any member of the Group, financial promotion, or any offer or invitation in relation to any acquisition of or investment in any member of the Group in any jurisdiction, nor does it purport to give legal, tax or financial advice. Nothing herein shall be taken as constituting the giving of investment advice and this presentation is not intended to provide, and must not be taken as, the basis of any decision and should not be considered as a recommendation to acquire any securities of the Group. The recipient must make its own independent assessment and such investigations as it deems necessary. The information, statements and opinions contained in this presentation do not constitute a public offer under any applicable legislation or an offer to sell or a solicitation of an offer to buy any securities.
This presentation and its contents may not be viewed by persons within the United States other than (i) by qualified institutional buyers within the meaning of Rule 144A under the U.S. Securities Act of 1933, as amended (the “U.S. Securities Act”) or (ii) in “offshore transactions” within the meaning of Regulation S under the U.S. Securities Act. The distribution of this presentation in other jurisdictions may be restricted by law and persons into whose possession this presentation comes should inform themselves about, and observe, any such restrictions.
48
Disclaimer