Fixed Income Investor/Analyst Seminar June 8, 2004.
59
Fixed Income Investor/Analyst Seminar June 8, 2004
-
Upload
marvin-mckinney -
Category
Documents
-
view
217 -
download
1
Transcript of Fixed Income Investor/Analyst Seminar June 8, 2004.

Fixed Income Investor/Analyst Seminar
June 8, 2004

Payout Ratio Affords Substantial Flexibility
Net cash provided by operating activities Acquisition of Bridgelands
(included in land acquisition expenditures) Improvements to existing properties Dividends paid
Common 150Preferred 12
Cash from operations available for reinvestment
$ 376
22
(71)
(162)
$ 165
Millions
For the year endedDecember 31, 2003

Cash from Operations Supplemented byCapital Raising/Recycling
Cash from operations available for reinvestment
Proceeds from the disposition of properties to PREIT, Kravco and other properties
Proceeds from exercise of stock options
Net borrowings (note 1)
Other, net
Net proceeds from capital transactions
Total capital transactions and cash from operations
$ 165
396
110
95
(4)
$ 597
$ 762
Millions
Note 1 Net proceeds from the issuance and repayment of debt, excluding construction loan draws.
For the year ended December 31, 2003

How Did We Spend It ?
Acquisitions of interests in properties and other assets
Acquisitions of Christiana/Staten Island/ Mizner Park / Other
Acquisition of interest in Woodlands
9.25% QUIPS (preferred securities) retired
Repurchase of shares --- Hughes participation
Bridgelands acquisition
Equity in development (note 1)
Millions
Note 1 Includes expenditures for properties in development and investments in joint ventures in development, net of construction loan draws.
Net capital redeployed
$ 437
57
72
22
97
$ 685
253
184
For the year ended December 31, 2003
Net capital redeployments

Cash from operations available for reinvestment
Net proceeds from capital transactions
Net capital redeployments
$ 165
$ 597
$ 762
$ 685
MillionsFor the year ended December 31, 2003
$77

Reconciliation of cash from operations available for reinvestment, net proceeds from capital transactions and net capital redeployments to Statement of Cash Flows
Millions
Net cash provided by operating activities Expenditures for the acquisition of Bridgelands included in land acquisition expenditures Expenditures for improvements to existing properties Dividends paid
Cash from operations available for reinvestment
Proceeds from capital transactions Proceeds from the disposition of properties to PREIT, Kravco and other properties
Proceeds from the disposition of interests in properties Expenditures for acquisition of Christiana netted with proceeds from dispositions Proceeds from the exercise of stock options Net proceeds from the issuance and repayment of debt, excluding construction loan draws Net other investing and other financing activities
Net proceeds from capital transactions
Capital redeployments Total expenditures for acquisitions of interests in properties and other assets
Expenditures for acquisitions of interests in properties and other assets Expenditures for acquisition of Christiana netted with proceeds from dispositions
Purchase of Parent Company-obligated mandatorily redeemable preferred securities Repurchases of common stock Expenditures for the acquisition of Bridgelands included in land acquisition expenditures Equity in development
Expenditures for properties in development Expenditures for investments in unconsolidated real estate ventures in development Proceeds from borrowings on construction loans
Net capital redeployments
Net change in cash
Year ended 12/31/2003
$ 376 22
(71) (162)
165
396
110 95 (4)
597
(437)
(57) (72) (22)(97)
(685)
$ 77
35640
(397) (40)
(168) (27) 98
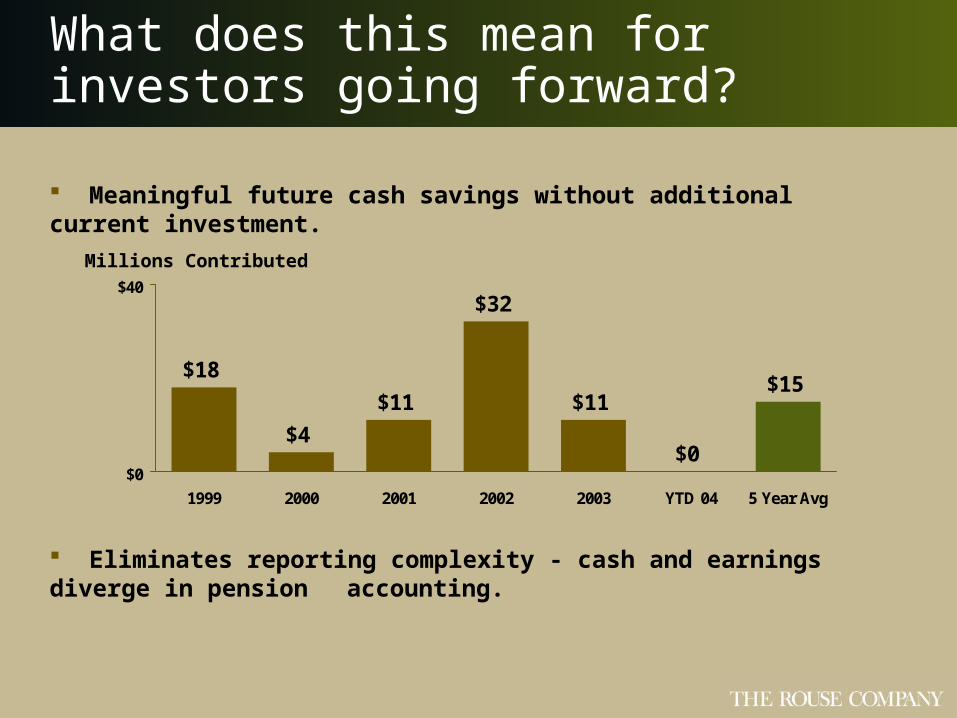
What does this mean for investors going forward?
Meaningful future cash savings without additional current investment.
$18
$4
$11
$32
$11
$0
$15
$0
$40
1999 2000 2001 2002 2003 YTD 04 5 Year Avg
Millions Contributed
Eliminates reporting complexity - cash and earnings diverge in pension accounting.

Organization Changes /Early Retirements
Provision for personnel changes
(Includes $11 M for retirementsof two Vice Chairmen & CFO)
$ 22
Millions
*Assumes 1/1/02 internal cost structure grows at CAGR of 4% and includes 2004 projected internal costs/savings.
$22*
January 1, 2002 –December 31, 2004
SAVINGS
January 1, 2002 - March 31, 2004

Fixed Income Investor/Analyst Seminar
June 8, 2004

Regional Centers
(1) Excludes urban centers, projects with less than two anchors, and centers open less than one year. (2) Includes current and recently opened development projects.
1993 Portfolio51 Centers
Current Portfolio31 Centers
Total RegionalCenters (1)
2007 Portfolio (2)
34 Centers
Mall RankingA+ or A B C
5 10% 13 25% 33
19 61% 10 32% 2 7%
Number Percent Number Percent Number Percent
22 65% 12 35% --
65%

Dispositions & Acquisitions
Dispositions in 2003
Cherry Hill Mall
Echelon Mall
Exton Square
Gallery at Market East
Moorestown Mall
Plymouth Meeting
Average Sales of $350 psf
Acquisitions in 2003 & 2004
Christiana Mall
Staten Island Mall
Mizner Park
2003
Providence Place
2004
Average Sales of $500 psf

$280.0
$327.2
$365.3 $368.3 $375.7
$469.8
$545-$555
$508.9
$100
$600
1997 1998 1999 2000 2001 2002 2003 2004Est.
Retail Centers Net Operating Income
Millions

Retail Centers
Occupancy
93%
Comp Tenant Sales
$439 psf
Comp Space Sales
+ 9%

1 Excludes urban centers, projects with less than two anchors, and centers open less than two years2 Comparable tenants, excluding spaces >10,000 s.f.
2004 Sales per Square Foot 2
Center Ranking
A+ or A
B
C
RegionalCenters 1
2004 AverageOccupancy
% 2004 NetOperating Income
$ 489
$ 357
$ 286
94 %
94 %
91 %
73 %
24 %
3 %
Rouse Regional CentersKey Performance Measures
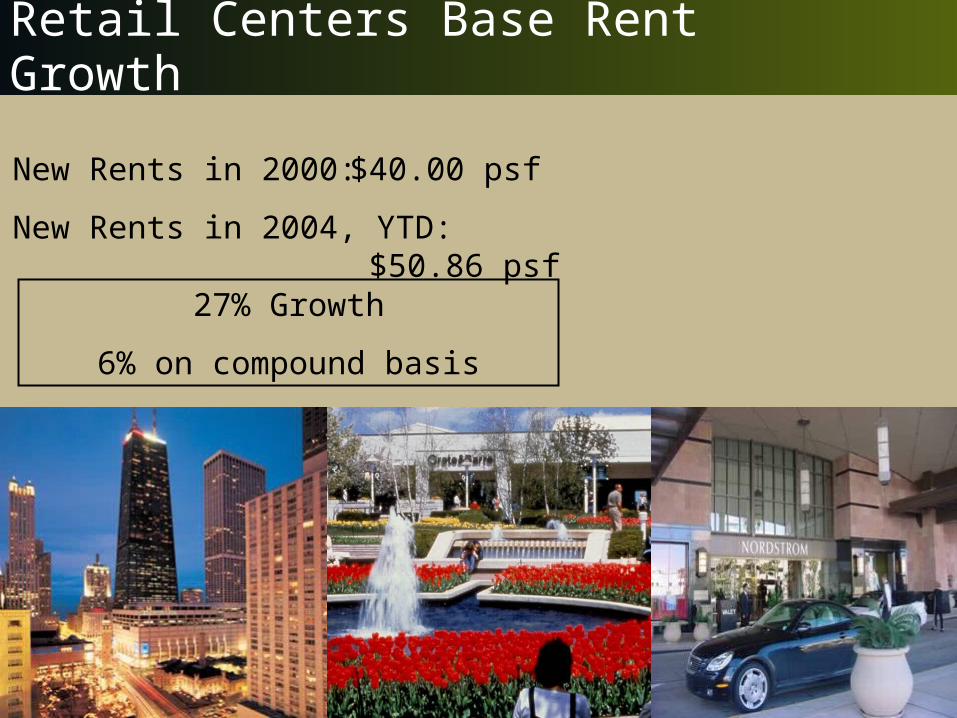
Retail Centers Base Rent Growth
New Rents in 2000:
New Rents in 2004, YTD:
$40.00 psf
$50.86 psf27% Growth
6% on compound basis
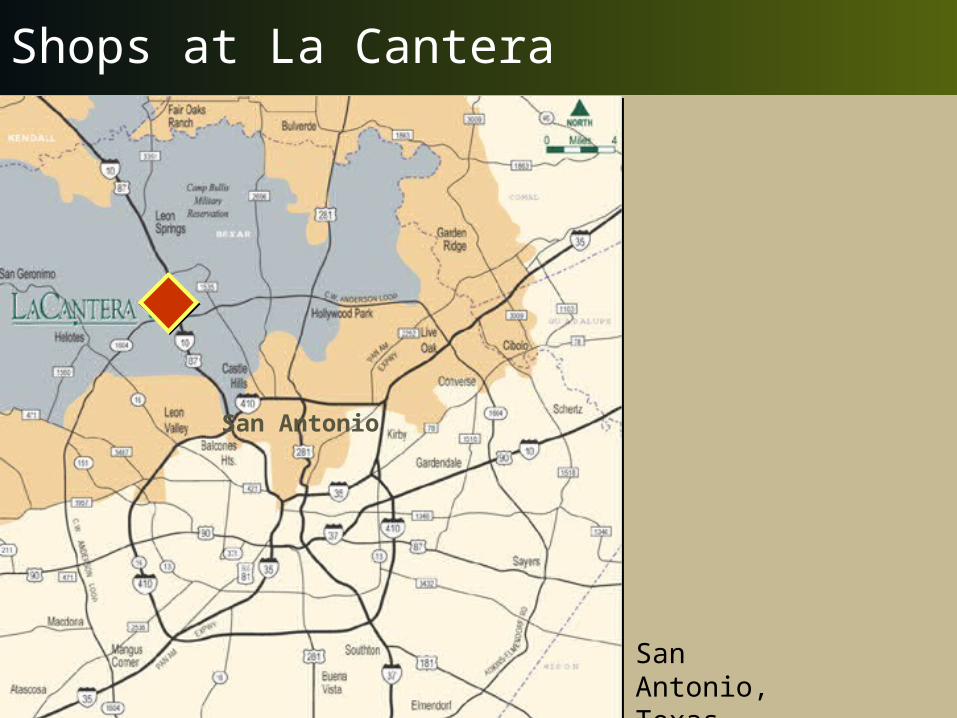
Shops at La Cantera
San Antonio
San Antonio, Texas

Shops at La Cantera
Nordstrom
Neiman Marcus
Dillard’sFoley’s
Future Expansion
Site

Shops at La Cantera

Shops at La Cantera

Kendall Town Center
Miami, Florida
Miami

Kendall Town Center
Dillard’s

Bridgewater Commons
New York
Trenton
Bridgewater, New Jersey
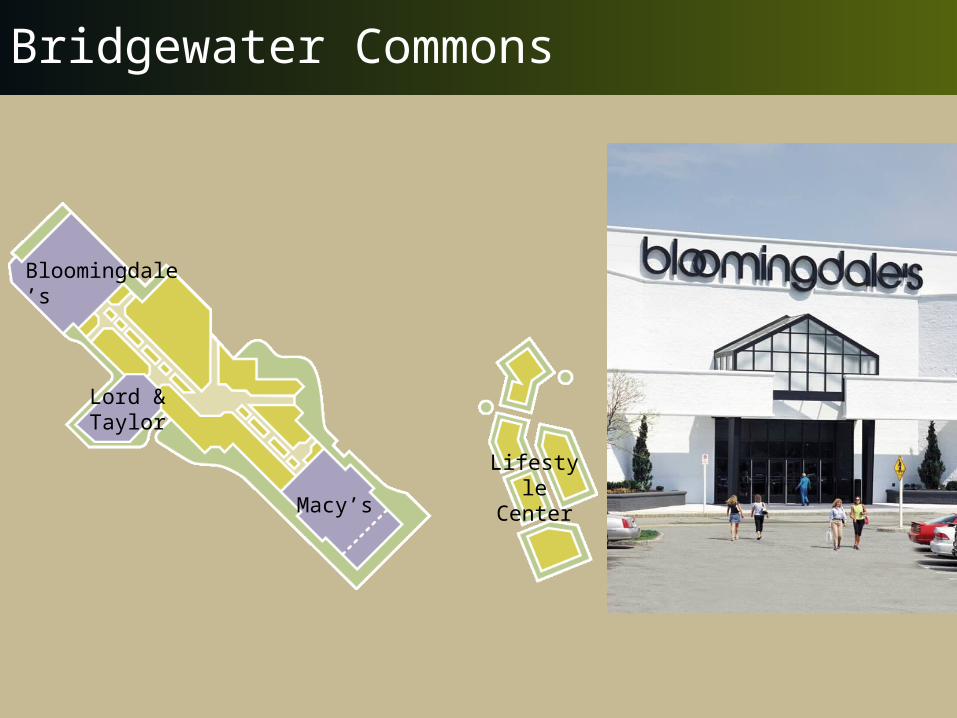
Bridgewater Commons
Bloomingdale’s
Lord & Taylor
Macy’s
Lifestyle Center

Retail Centers

Summerlin Town Centre
Summerlin, Nevada

Summerlin Town Centre
Dillard’s Robinsons - May
Anchor
AnchorAnchor

Fixed Income Investor/Analyst Seminar
June 8, 2004

Community Development

Quality of the AssetsColumbia, Maryland

Quality of the AssetsSummerlin, Nevada

Quality of the AssetsThe Woodlands, Texas

Size (acres)
Remaining Saleable acres
Current residents
Residents at completion
Current jobs
Jobs at completion
17,000
1,000
96,000
100,000
91,000
100,000
Columbia
22,500
6,600
67,000
170,000
20,000
50,000
Summerlin
1,160
475
500
4,500
--
500
Fairwood
76,660
19,575
233,500
454,500
141,000
240,500
Total
9,000
6,400
--
60,000
--
40,000
Bridgelands
27,000
5,100
70,000
120,000
30,000
50,000
Woodlands
Recent Acquisitions
Rouse Master Planned Communities
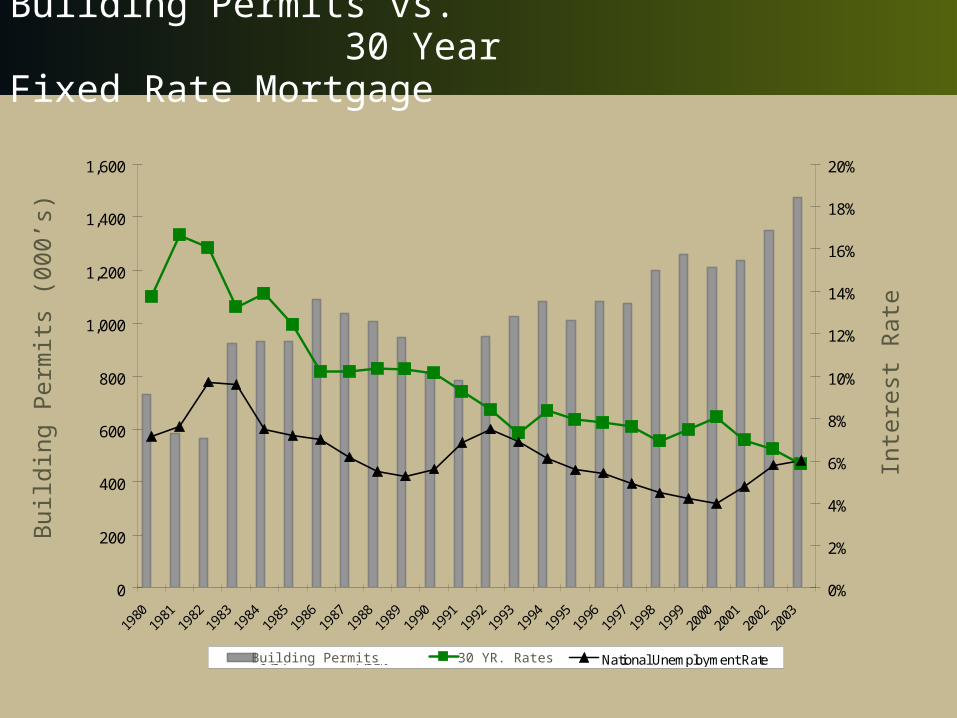
Building Permits vs. 30 Year Fixed Rate Mortgage
0
200
400
600
800
1,000
1,200
1,400
1,600
1980
1981
1982
1983
1984
1985
1986
1987
1988
1989
1990
1991
1992
1993
1994
1995
1996
1997
1998
1999
2000
2001
2002
2003
0%
2%
4%
6%
8%
10%
12%
14%
16%
18%
20%
U.S. 7.31% 30 YR. FMR National Unemployment Rate
Bui
ldin
g P
erm
its (
000’
s)
Inte
rest
Rat
e
Building Permits 30 YR. Rates

Columbia Land Sales vs. 30 Year Fixed Rate Mortgage
$0
$50
$100
$150
0%
5%
10%
15%Columbia land sales30 yr. fixed rate mortgage
Col
umbi
a La
nd S
ales
(M
illio
ns)
30 Y
ear
Fix
ed R
ate
Mor
tgag
e
*Revenue figures include builder participation

Factors Affecting Mortgage Rates
National & local employment trends
Land supply & barriers to entry
Diversity of product offerings
Geographic diversity
Pricing power
“Knowledge” advantage

Diversity of Assets

The Woodlands
The Woodlands
Bridgelands

The Woodlands
Canyon Gate/Stone Gate
Sienna Plantation
Shadow Creek Ranch
Cinco Ranch
Kingsbridge
Teal Run
Waterside
Grand Lakes
Gleannloch Farms
The Woodlands
Rank Community Annual Starts Price Range
Source: American Metrostudy
1
2
3
4
5
6
7
8
9
10
1,311
687
514
476
472
365
332
329
327
322
$3,000,000
$291,000
$1,587,000
$559,000
$740,000
$208,000
$220,000
$426,000
$505,000
$671,000
$67,000
$110,000
$102,000
$144,000
$62,000
$93,000
$89,000
$127,000
$127,000
$125,000
Master Planned Community RankingsRanked by 2003 starts

Bridgelands
Bridgelands
The Woodlands

Bridgelands

Creating Long Term Value - Urbanization
Columbia Town Center

Columbia Town Center

Columbia Town Center
Retention of parking fields
Utilization of shared parking
Strategic utilization of ground leases
Ongoing ownership of operating properties

Community Development – Columbia Based
Fairwood
Stone LakeEmerson
Baltimore
Washington

Fairwood Emerson
Stone Lake
Community Development – Columbia Based

Community Development – Summerlin Based

The Woodlands
Community Development – Houston Based

Community Development

Fixed Income Investor/Analyst Seminar
June 8, 2004

Total Debt /Gross Asset Value
Total Debt & Preferred Stock /Gross Asset Value
Secured Debt /Gross Asset Value
61.0 %
66.3 %
52.5 %
March 31,2004
53.7 %
53.7 %
37.3 %
December 31,1999
Total Leverage and Secured Leverage
65.0 %
--
55.0 %
CurrentCovenant
Requirements

Combined Interest Coverage
Combined Fixed Charge Coverage Pro Forma
Combined Fixed Charge Coverage Without Principal Amortization
Pro Forma
2.05 x
1.55 x--
March 31,2004
2.80 x
2.07 x2.18 x
December 31,1999
(1) Adjusted to give effect to the redemption of the 9.25% QUIPS and the conversion of the Series B preferred stock as of the beginning of the period
Interest and Fixed Charge Coverage
Twelve Months Ended
1.70 x
1.30 x--
CurrentCovenant
Requirements
(1)
1.83 x--
2.58 x2.76 x
----
(1)

Before Hughes Heirs Expense
Adjusting for Hughes Heirs Expense
26.9%
32.9%
39.8%
43.4%
12 Months12/31/03
3 Months3/31/04
Unencumbered NOI

Retail
Office & Other
Community Development
Unencumbered NOI
Hughes Heirs Expense
Unencumbered NOI Adjusted for Hughes Heirs Expense
Total Net Operating Income
Hughes Heirs Expense
Total NOI Adjusted for Hughes Heirs Expense
$ 64,369
6,210
123,890
194,469
64,293
$ 258,762
$ 722,177
64,293
$ 786,470
$ 30,335
1,772
41,165
73,272
11,545
$ 84,817
$ 184,081
11,545
$ 195,626
12 Months12/31/03
3 Months3/31/04
Unencumbered NOI
In Thousands

NOI
Interest expense
NOI of discontinued operations
Depreciation and amortization
Other provisions and losses, net
Impairment losses on operating properties
Income taxes, primarily deferred
Our share of interest expense, ground rent expense,
depreciation and amortization, other provisions and
losses, net, income taxes and gains (losses) on operating
properties of unconsolidated real estate ventures, net
Other
Earnings before net gains (losses) on dispositions of interests in
operating properties and discontinued operations in condensed
consolidated financial statements
$ 184,081
(58,284)
(1,724)
(47,910)
(5,109)
---
(18,616)
(19,966)
(1,796)
$ 30,676
$ 722,177
(222,766)
(45,163)
(173,280)
(32,513)
(7,900)
(42,500)
(68,894)
(16,270)
$ 112,891
Reconciliation of NOITo Most Comparable GAAP Measure
3 monthsMarch 31,
2004
12 monthsDecember 31,
2003
In Thousands

Notes / Definition of NOI
Segment operating data are presented in accordance with Statement of Financial Accounting Standards No. 131, “Disclosures about Segments of an Enterprise and Related Information.” As required by the Statement, segment data are reported using the performance measure and accounting policies followed by the Company for internal reporting to management which differ, in certain respects, from those used for reporting under accounting principles generally accepted in the United States of America (“GAAP”). The performance measure used by the Company is Net Operating Income (“NOI”). The Company defines NOI as segment revenues less segment operating expenses (including provision for bad debts, losses (gains) on marketable securities classified as trading, net losses (gains) on sales of properties developed for sale and partner’s share of NOI of the venture developing The Woodlands, but excluding income taxes, fixed charges, as defined below, and real estate depreciation and amortization). Prior to July 1, 2003, the Company included certain current income taxes in its definition of NOI. Effective July 1, 2003, the Company revised its definition to exclude these amounts from NOI, affecting primarily the definition of the Company’s community development activities. The amounts from prior periods have been reclassified to conform to the current definition. The accounting policies used to calculate NOI and other operating results data are the same as those used by the Company in its condensed consolidated financial statements prepared in accordance with GAAP, except that the NOI of the venture developing the community of The Woodlands is consolidated and the other partner’s share is classified as operating expense rather than using the equity method. In addition, real estate ventures in which the Company has joint interest and control and certain other unconsolidated ventures are accounted for using the proportionate share method rather than the equity method and the Company’s share of FFO of other unconsolidated ventures is included in revenues. Also, discontinued operations and minority interests are included in NOI rather than separately presented. These segment accounting policies affect only the reported revenues and expenses of the segments and have no effect on our reported net earnings.

Notes / Leverage Ratios
The leverage calculations presented above are calculated in accordance
with certain covenants applicable to our public debt and not in accordance
with GAAP. They are not liquidity measures and should not be considered
alternatives to cash flows. The terms “Gross Asset Value,” “Total Debt”
and “Secured Debt” include our consolidated amounts and our pro rata
share of unconsolidated real estate ventures and exclude minority interests
in consolidated amounts. Gross Asset Value for (1) operating properties is
calculated using NOI (less ground rents) divided by stated percentages, or,
if owned less than one year, the acquisition cost, (2) master-planned
communities is the latest annual current value as set forth in appraisals and
(3) other assets is the GAAP carrying value. Gross Asset Value is not
necessarily indicative of the fair values of our assets.

Notes / Coverage Ratios
The coverage ratios presented above are calculated in accordance with certain covenants in our
credit facility agreement and not in accordance with GAAP. These ratios are presented to
illustrate our level of compliance with these covenants. They are not liquidity measures and
should not be considered alternatives to cash flows. The terms “Combined EBITDA,” “Combined
Interest Expense” and “Combined Fixed Charges” include our consolidated amounts and our pro
rata share of unconsolidated real estate ventures and exclude minority interests in consolidated
amounts. Combined interest coverage means Combined EBITDA divided by Combined Interest
Expense. Combined Fixed Charge Coverage means Combined EBITDA plus base ground rent
divided by Combined Fixed Charges.
Combined EBITDA means net earnings before extraordinary items and cumulative effects of
changes in accounting principle, excluding gains and losses on operating properties, impairment
losses, plus Combined Interest Expense, depreciation and amortization expense (including our
share of that of unconsolidated real estate ventures), income taxes, distributions on preferred
securities and expenses pursuant to the Contingent Stock Agreement.
Combined Fixed Charges includes Combined Interest Expense, scheduled principal payments
(including our share of principal payments of unconsolidated real estate ventures), base ground
rents and distributions on preferred securities.
Notes / Unencumbered NOI
Unencumbered NOI is the NOI of properties that were not encumbered
by mortgages as of the dates presented and, at March 31, 2004, also
included Fashion Show, which was encumbered at that date by a
mortgage with a face value of approximately $33 million that the
Company intends to repay without penalty before December 31, 2004. In
January 2004, the Company repaid a $240 million construction loan that
had previously encumbered Fashion Show.

Fixed Income Investor/Analyst Seminar
June 8, 2004