Investor Relations Second Quarter...
24
Corporate Presentation Investor Relations Second Quarter 2017
Transcript of Investor Relations Second Quarter...

Corporate Presentation Investor Relations
Second Quarter 2017

Disclaimer
Statements made in this presentation relate to CCU’s future performance or financial results are “forward-looking statements” within the meaning of Section 27A of the U.S. Securities Act of 1933, as amended, which are not statements of fact and involve uncertainties that could cause actual performance or results to materially differ. Forward looking statements include, without limitation, any statement that may predict, forecast, indicate or imply future results, performance or achievements, and may contain words like “believe,” “anticipate,” “expect,” “envisages,” “will likely result,” or any other words or phrases of similar meaning.
Our forward-looking statements are not guarantees of future performance, and our actual results or other developments may differ materially from the expectations expressed in the forward-looking statements. As for forward-looking statements that relate to future financial results and other projections, actual results will be different due to the inherent uncertainty of estimates, forecasts and projections. Because of these risks and uncertainties, potential investors should not rely on these forward-looking statements. Our independent public accountants have not examined or compiled the forward-looking statements and, accordingly, do not provide any assurance with respect to such statements. No representation or warranty, express or implied, is or will be made or given by us or any of our affiliates or directors or any other person as to the accuracy or completeness of the information or opinions contained in this presentation and no responsibility or liability is or will be accepted for any such information or opinions
Although we believe that these forward-looking statements and the information in this presentation are based upon reasonable assumptions and expectations, we cannot assure you that such expectations will prove to have been correct. The forward-looking statements represent CCU’s views as of the date of this presentation and should not be relied upon as representing our views as of any date subsequent to the date of this presentation as we undertake no obligation to update any of these statements. Listeners are cautioned not to place undue reliance on these forward-looking statements as such statements and information involve known and unknown risks. These statements should be considered in conjunction with the additional information about risk and uncertainties set forth in CCU’s SEC filings: Prospectus supplements dated September 16, 2013 and September 13, 2013 and the accompanying Prospectus dated August 15, 2013; CCU’s annual report filed with the Chilean Superintendencia de Valores y Seguros (SVS) and in CCU’s 20-F for the year ended December 31, 2016, filed with the U.S. Securities and Exchange Commission (SEC).
This presentation and its contents are proprietary information and may not be reproduced or otherwise disseminated in whole or in part without our prior written consent. Recipients of this presentation are not to construe the contents of this summary as legal, tax or investment advice and recipients should consult their own advisors in this regard.
2

CCU overview 1.
3.
2.
Performance overview
Market overview 11
3
14
Content
3
4. Strategic Plan 23

Ownership structure (1)
Quiñenco S.A. Heineken
50.0% 50.0%
60.0% 14.7% 25.3%
LOCAL (3)
(1) Figures as of December 31st, 2016. Number of shares 369,502,872 ; (2) IRSA owns directly 53.2% of CCU’s equity and 6.8% through Inversiones IRSA LTDA, a
99.9% owned vehicle; (3) In Chile CCU´s shares are traded on the Santiago Stock Exchange, the Chile Electronic Stock Exchange and the Valparaíso Stock Exchange.
ADRs IRSA(2)
4

Regional multicategory beverages player
(1) Figures have been rounded to sum 100%; (2) Average exchange rate for 2016: CLP 676.83/USD; (3) Considered as Others/Eliminations in
CCU’s financial releases; (4) EBITDA is equivalent to ORBDA (Adjusted Operating Result Before Depreciation and Amortization) used in the 20-F
form; (5) Associate with 34% stake, and call option for 17%. (6) Beer 50/50 Joint Venture In Colombia, estimated local production 2018.
Contribution by Operating segment (As of December 31st, 2016)(1)
JVs and Associated
Beer Non
Alcoholic
Bolivia(5) Colombia(6)
Chile International Business Wine Other(3)
Beer Non Alcoholic
Spirits
Beer Non Alcoholic
Cider Spirits
Wine
Corporate Functions Centers of Excellence
Shared Services
Across all Operating segments
Chile & Export to 80 countries
Chile Argentina Uruguay Paraguay
Categories
Geographies
365 1,264 4,567 1,990 Employees
71% Volume
Net Sales
EBITDA(4)
EBITDA margin(4)
64%
76%
21.7%
23%
24%
12%
8.8%
6%
13%
16%
22.0%
-
(1%)
(4%)
-
Total(2)
24.8 mln HL
USD 2,303 mln
USD 420 mln
18.2%
JVs and Associated
8,186
6 geographies
5 categories
5

Leader with strong brands & long term alliances
(1) Weighted average volume market share. Source: Nielsen for Chile, Domestic Wine and Argentina, ID Retail for Uruguay, and Viñas de Chile for Export Wine. Annually
updated and weighted by Internal Market Size estimates; Market Size estimates annually updated. Last update December 2016; (2) Proportion of CCU volumes related to
proprietary brands; (3) Excludes HOD; (4) License until December 2025 in Argentina; (5) Includes Beer and Cider in Argentina; CSD, Beer, Nectar, Mineral Water and
Flavoured Water in Uruguay; CSD, Beer, Nectar and Mineral Water in Paraguay; (6) Domestic and export wines from Chile. Excludes bulk wine. 6
Core Categories Synergic Categories
Beer Non Alcoholic Wine, Cider and Spirits
2016
Market Share(1)
Proprietary Brands(2)
CSD
Waters
Functional & Juices
Pisco
Rum
Other Spirits
42.3%
14.0% (5)
18.1%
(6)
(3)
64.4%
60.6%
100.0%
(4)
CSD
Waters
Functional & Juices
Domestic & Export
Ciders
Inte
rnat
ion
al
Bu
sin
ess
Ch
ile
Win
e
28.1% 65.5%
Tota
l

(34% + call option for 17%) (50%)
Grupo Monasterio
-Today: premium beer imported from the Netherlands and USA and local craft production. -2018: Local production of premium and mainstream beer plus local craft production Construction of local beer plant with capacity 3 million HL. -Total investment: USD $400 million
Local beer and non-alcoholic production
Starting Joint Ventures in two new markets
Strategic Partner
Brands
Project Description
7
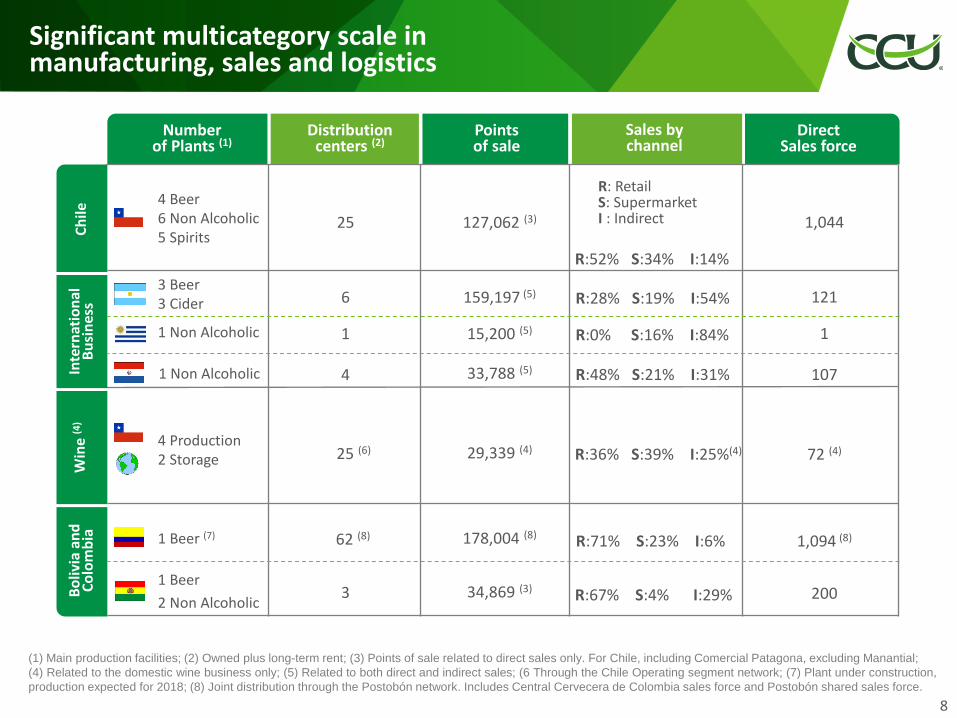
Significant multicategory scale in manufacturing, sales and logistics
(1) Main production facilities; (2) Owned plus long-term rent; (3) Points of sale related to direct sales only. For Chile, including Comercial Patagona, excluding Manantial;
(4) Related to the domestic wine business only; (5) Related to both direct and indirect sales; (6 Through the Chile Operating segment network; (7) Plant under construction,
production expected for 2018; (8) Joint distribution through the Postobón network. Includes Central Cervecera de Colombia sales force and Postobón shared sales force.
Number of Plants (1)
Distribution centers (2)
Points of sale
Sales by channel
Direct Sales force
Ch
ile
Inte
rnat
ion
al
Bu
sin
ess
Win
e (4
) B
oliv
ia a
nd
C
olo
mb
ia
4 Beer 6 Non Alcoholic 5 Spirits
3 Beer 3 Cider
1 Non Alcoholic
4 Production 2 Storage
1 Beer (7)
1 Beer
2 Non Alcoholic
6
25
62 (8)
3
25 (6)
1
4 33,788 (5)
159,197 (5)
127,062 (3)
178,004 (8)
34,869 (3)
29,339 (4)
1,044
121
107
72 (4)
1,094 (8)
200
R: Retail S: Supermarket I : Indirect
15,200 (5) 1
R:52% S:34% I:14%
R:28% S:19% I:54%
R:0% S:16% I:84%
R:48% S:21% I:31%
R:36% S:39% I:25%(4)
R:71% S:23% I:6%
R:67% S:4% I:29%
8
1 Non Alcoholic

Business Model combines focus and synergies
Marketing
Sales
Logistics
Production
Shared services
Centers of excellence
Corporate functions
Chile International Business Wine Bolivia and Colombia
SYNERGIES
SYNERGIES
SYNERGIES
SYNERGIES
SYNERGIES
SYNERGIES
FOCUS & SYNERGIES
FOCUS & MULTICATEGORY SYNERGIES BY COUNTRY
FOCUS BY CATEGORY
SYNERGIES SYNERGIES
Commercial
Industrial
Planning & logistics
SYNERGIES SYNERGIES FOCUS & SYNERGIES SYNERGIES SYNERGIES
9

Focus on sustainable growth
(1)Heineken joined CCU in 2003; (2) EBITDA is equivalent to ORBDA (Adjusted Operating Result Before Depreciation and Amortization) used in the 20-F form;
(3) Includes operations in Chile and Argentina, including domestic wine; Baseline targets are 2010 figures.
Volume 6.5% Net Sales 11.4% EBITDA (2) 9.4% Net Income 12.8%
Social
Responsible consumption Community support Art Sports
KG/HL 2020: -20%
2020 (H2O/Prod): -33%
2020 Valorization Industrial Waste: 100%
C02 (KG/ HL) Water Consumption (H20/ Prod)
Industrial Waste (% Valorization)
2010
2016
target 2020
Environmental – Vision 2020 (3)
Economic – CAGR 2002-2016(1)
8.81
7.32 6.99
5.19
3.38 3.44
91.7% 97.0% 100%
2002
67% 75% 73% 74%
2014 2015 2016
Organizational climate
10

CCU overview 1.
3.
2.
Performance overview
Market overview 11
3
14
Content
11
4. Strategic Plan 23

RTD Liters per Capita
(1)(2) 291 369 202 230 238 347 504
RTD Liters per Capita Growth(1)
(CAGR 2006-16) 1.8% 0.5% 6.5% 1.5% 3.4% 3.6% (0.9)%
Population
(Millions)(3) 17.9 43.8 10.9 48.7 6.7 3.4 322.2
Population Growth(3)
(CAGR 2006-16)
0.9% 1.0% 1.6% 1.0% 1.3% 0.3% 0.8%
GDP Growth(4) (CAGR 2006-16)
3.8% 1.7% 4.7% 3.8% 4.8% 4.3% 1.3%
Presence in growing attractive markets
Chile Argentina Bolivia Colombia Paraguay Uruguay USA
(1) Ready-to-drink categories. Source: Canadean Global Beverage Forecast, March 2017; (2) Considers all beverage categories listed on page 13; (3) Source:
International Monetary Fund (IMF), August 2017 (4) GDP growth at constant prices. Source: Bloomberg February 2017.
12

Presence in highly attractive categories
Beer 43 42 35 50 43 31 73
CSD 124 115 114 61 78 107 132
Nectar and Juices 23 8 15 13 9 9 41
Water(2) 37 119 16 23 44 111 131
Functional Drinks (3) 4 3 2 6 1 2 49
Spirits(4) 4 3 1 3 6 4 7
Cider 0 2 0 0 1 1 1
Milk(5) 43 55 19 71 49 60 61
Wine(6) 13 23 1 2 8 23 10
TOTAL 291 369 202 230 238 347 504
Chile Argentina Bolivia Colombia Paraguay Uruguay USA (RTD Liters per capita in 2016)(1)
(1) Source: Canadean Global Beverage Forecast, March 2017. Annually updated. Figures have been rounded; (2) Includes Packaged Water, HOD,
Flavored Water and Enhanced Water; (3) Includes Iced Tea, Iced Coffee, Sport Drinks and Energy Drinks; (4) Includes all Spirits as Canadean definition (5)
Considers liquid milk; (6) Includes sparkling wine.
13

Strong market position in fast growing segments
Beer 2.6% #1 Carbonated Softdrinks 0.6% #2 Juices / Nectar 6.8% #1 Water(3) 7.9% #1 Functional Drinks 27.6% #1 Spirits(4) 0.2% #1 Wine(5) (1.4)% #2 Powder Juices (1.4)% #2
Chile
Argentina
Uruguay
Paraguay
Colombia
Bolivia
(1) Source: Canadean Global Beverage Forecast, March 2017; Annually updated. Figures have been rounded; (2) Volume market share; (3) Includes
HOD, Flavored Water and Enhanced Water (4) Includes all Spirits as Canadean definition; (5) Includes sparkling wine.
Beer 0.7% #2 Functional Drinks 10.9% Cider (2.0)% #1 Wine(5) (2.3)% Beer 3.2% #2 Carbonated Softdrinks 2.8% #3 Juices / Nectar 8.2% Water(3) 7.9% #2 Beer 1.0% Carbonated Softdrinks 2.7% Juices / Nectar 13.4% #1 Water(3) 7.7% Beer 1.7% #2 Carbonated Softdrinks 7.7% #3 Water(3) 11.8%
Beer 1.6% #2
14
Industry per capita CAGR 06-16 (1) Categories
CCU´s Market Position (#1/#2/#3)(2)

CCU overview 1.
3.
2.
Performance overview
Market overview 11
3
14
Content
15
4. Strategic Plan 23

Proven track record for financial performance
(1) Under Chilean GAAP. Figures in CLP Billions as of December of each year
(2) IFRS, figures in nominal CLP billions
(3) Average inflation for the period based on UF variation: 3.3% (www.bcentral.cl)
(4) EBITDA is equivalent to ORBDA (Adjusted Operating Result Before Depreciation &
Amortization) used in the Form 20-F.
(5) Net Income attributable to Equity holders of the parent
(6) RONA (Return on Net Assets) = EBIT / [Total Assets – (Total Current Liabilities -
Other Current Financial Liabilities)]
(7) Please refer to page 6 notes.
(8) In CLP
billion CLP CAGR (3) 2002-2016
Volume (millions of HL)
Net Sales
EBITDA (4)
EBITDA Margin (4)
Net Income (5)
RONA (6)
Total Market Share (7)
EPS (8)
2002
10.2
346
80
23.9%
22
6.5%
21.5%
69.3
2003
11.1
384
86
22.5%
54
9.3%
22.2%
169.8
2004
11.4
421
99
23.4%
45
11.5%
22.1%
142.5
2005
12.3
492
108
21.9%
48
12.2%
22.2%
151.3
2006
13.4
546
122
22.3%
56
13.6%
22.4%
175.2
2007
14.2
628
147
23.4%
79
14.8%
22.5%
248.7
2008
15.7
710
164
23.1%
90
14.2%
23.3%
283.8
2009
16.3
777
182
23.4%
128
15.6%
23.6%
401.9
2010
17.3
838
207
24.7%
111
16.7%
23.7%
347.6
2011
18.4
970
241
24.8%
123
18.6%
24.1%
385.6
2012
19.9
1,076
236
21.9%
114
16.9%
24.2%
359.2
2013
21.9
1,197
253
21.1%
123
13.1%
25.8%
370.7
2014
22.9
1,298
249
19.1%
120
12.4%
26.8%
323.6
2015
23.9
1,498
287
19.1%
121
13.9%
27.6%
326.9
6.5%
11.4%
9.4%
12.8%
1.9%
11.6%
2016
24.8
1,559
284
18.2%
118
13.4%
28.1%
320.6
CHGAAP (1) IFRS (2)
16

Projects with high potential profitability in the medium run, with a possible limited dilutive short term effect;
Projects that enable us to buy or potentially build relevant and large scale operations;
Projects that enable us to keep developing multi-category;
Projects with proprietary brands and/or long term license agreements with strategic partners;
Projects that provide us competitive balance.
Proven track record for inorganic growth and alliances
Over the last 20 years successfully executing strategic M&A transactions (1)
Diversification from a Beer based company into a multi-category branded beverage company
Investment criteria for inorganic growth
(1) Some transactions occurred during more than one year, but they are presented as if they where executed in the first year
17

Including 2015 and 2016 efficiencies of
CLP 64 bln, of which
CLP 15 bln Revenue
Management
Last three years performance shows growing results
22.9 23.9 24.8
1,298
1,498 1,559
CAGR: 4.0% CAGR: 9.6%
Volume (mln HL) Revenues (mln CLP)
229.6
286.5 284.2 17.7%
19.1% 18.2%
CAGR: 11.2% Increase 54 bps
EBITDA (mln CLP)(3) EBITDA Margin(3)
2014-2016 mln CLP
EBITDA 2014 (1) 229,646
Estimated External Effects (2) -32,971
Business Growth (volume, price and efficiencies)
87,505
EBITDA 2016 284,180
2014-2015 mln CLP
EBITDA 2014 (1) 229,646
Estimated External Effects (2) -14,325
Business Growth (volume, price and efficiencies)
71,183
EBITDA 2015 286,504
2015-2016 mln CLP
EBITDA 2015 286,504
Estimated External Effects (2) -18,646
Business Growth (volume, price and efficiencies)
16,322
EBITDA 2016 284,180
(1) Excludes the one-time effect compensation of CLP 18,882 million at EBITDA level received by our Argentine subsidiary CICSA during 2Q´14 for the termination of the
contract which allowed us to import and distribute on an exclusive basis Corona and Negra Modelo beers in Argentina and to produce and distribute Budweiser beer in
Uruguay; (2) Includes estimated exchange rate and raw material cost effect; (3) EBITDA is equivalent to ORBDA (Adjusted Operating Result Before Depreciation &
Amortization) used in the Form 20-F;
20141 2015 2016 20141 2015 2016
20141 2015 2016 20141 2015 2016
18
ExCCelencia CCU

Recent consolidated performance Second quarter results
Consolidated (mln CLP)
Q2’17 Q2’16 Δ% YTD 2017 YTD 2016 Δ%
Volume (Th HL)
Net Sales
EBIT (1)
EBITDA (2)
EBITDA margin (2)
Net Income
5,116
345,043
22,795
44,367
12.9%
8,455
4,776
307,905
14,904
34,461
11.2%
6,281
7.1%
12.1%
52.9%
28.7%
(167) bps
34.6%
12,452
793,728
101,664
144,599
18.2%
55,054
11,777
722,098
88,831
127,564
17,7%
50,867
5.7%
9.9%
14.4%
13.4%
55 bps
8.2%
(1) EBIT, also referred to as Adjusted Operating Result, is defined as Net Income before other gains (losses), net financial expense, equity and income of joint ventures,
foreign currency exchange differences, result as per adjustment units and income taxes; (2) EBITDA is equivalent to ORBDA (Adjusted Operating Result Before
Depreciation & Amortization) used in the Form 20-F.
19

Operating segments (mln CLP) Q2’17 Q2’16 Δ% YTD 2017 YTD 2016 Δ%
Volume (Th HL)
Net Sales
EBIT (1)
EBITDA (2)
EBITDA Margin (2)
3,511
210,652
22,731
37,815
18.0%
3,419
197,106
16,316
30,518
15.5%
2.7%
6.9%
39.3%
23.9%
247 bps
8,788
502,286
87,333
117,661
23.4%
8,531
476,618
73,999
102,298
21.5%
3.0%
5.4%
18.0%
15.0%
196 bps
Ch
ile
Inte
rnat
ion
al
Bu
sin
ess
W
ine
Volume (Th HL)
Net Sales
EBIT (1)
EBITDA (2)
EBITDA Margin (2)
1,241
84,935
(2,809)
1,114
1.3%
981
59,497
(8,782)
(5,682)
(9.6)%
26.5%
42.8%
(68.0)%
(119.6)%
1,086 bps
2,982
198,039
9,300
16,911
8.5%
2,570
151,344
617
6,575
4.3%
16.1%
30.9%
1,407.2%
157.2%
419 bps
Volume (Th HL) Net Sales EBIT (1) EBITDA (2) EBITDA Margin (2)
364 52,707
7,354 9,269
17.6%
376 53,072 10,626 12,430 23.4%
(3.2)% (0.7)%
(30.8)% (25.4)%
(584) bps
682 98,101 13,208 17,000 17.3%
676 97,668 18,595 22,142 22.7%
0.9% 0.4%
(29.0)% (23.2)%
(534) bps
(1) EBIT, also referred to as Adjusted Operating Result, is defined as Net Income before other gains (losses), net financial expense, equity and income of joint ventures, foreign currency
exchange differences, result as per adjustment units and income taxes; (2) EBITDA is equivalent to ORBDA (Adjusted Operating Result Before Depreciation & Amortization) used in the Form
20-F.
20
Recent Operating segment performance Second quarter results
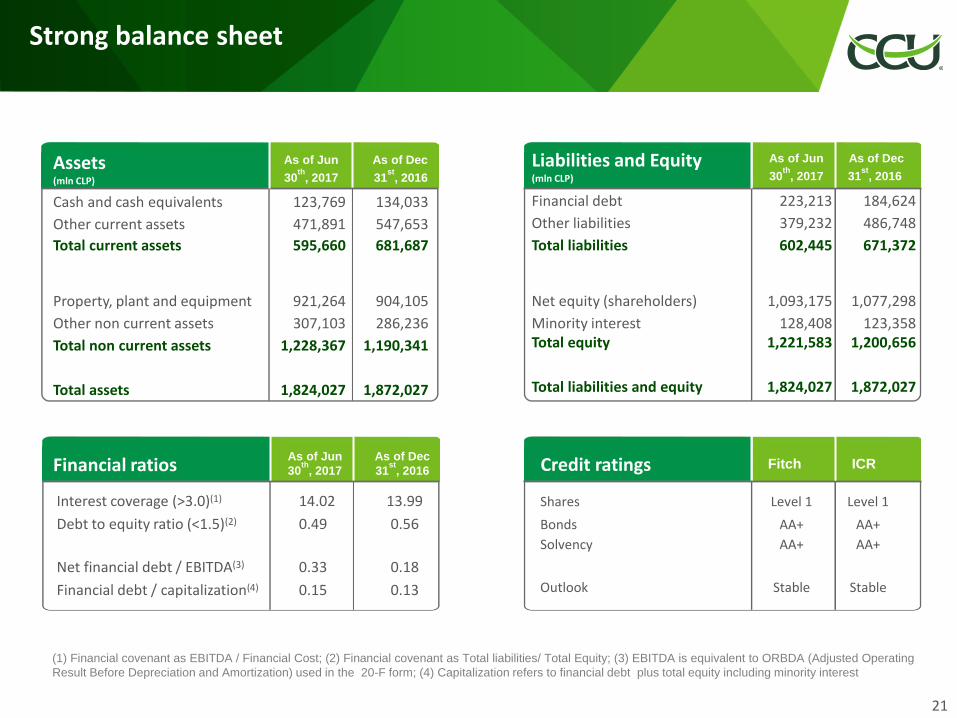
Interest coverage (>3.0)(1) 14.02 13.99
Debt to equity ratio (<1.5)(2) 0.49 0.56
Net financial debt / EBITDA(3) 0.33 0.18
Financial debt / capitalization(4) 0.15 0.13
Financial debt 223,213 184,624
Other liabilities 379,232 486,748
Total liabilities 602,445 671,372
Net equity (shareholders) 1,093,175 1,077,298
Minority interest 128,408 123,358 Total equity 1,221,583 1,200,656
Total liabilities and equity 1,824,027 1,872,027
Cash and cash equivalents 123,769 134,033
Other current assets 471,891 547,653
Total current assets 595,660 681,687
Property, plant and equipment 921,264 904,105
Other non current assets 307,103 286,236
Total non current assets 1,228,367 1,190,341
Total assets 1,824,027 1,872,027
Strong balance sheet
(1) Financial covenant as EBITDA / Financial Cost; (2) Financial covenant as Total liabilities/ Total Equity; (3) EBITDA is equivalent to ORBDA (Adjusted Operating
Result Before Depreciation and Amortization) used in the 20-F form; (4) Capitalization refers to financial debt plus total equity including minority interest
Assets (mln CLP)
As of Jun
30th
, 2017
As of Dec
31st
, 2016
Liabilities and Equity (mln CLP)
As of Jun
30th
, 2017
As of Dec
31st
, 2016
Financial ratios As of Jun
30th
, 2017
As of Dec
31st
, 2016
21
Shares Level 1 Level 1
Bonds AA+ AA+
Solvency AA+ AA+
Outlook Stable Stable
Credit ratings Fitch ICR

CCU overview 1.
3.
2.
Performance overview
Market overview 11
3
14
Content
22
4. Strategic Plan 23

Strategic plan 2016-2018 focused on growth and efficiencies
We have proposed ourselves to grow profitably in all our categories and businesses enhancing our value proposition to consumers with our portfolio and innovations, and reaching critical mass in every geography
We will seek with determination, by executing our Plan ExCCelencia CCU (costs, expenses and revenue management), best practices that will capture efficiencies and generate a culture of excellence in all our operations
We have proposed ourselves to deepen CCU’s Business Model, by spreading it and making it actionable in all our business units and countries, putting focus on the generation of sustainable value, based on our people, on managerial and operating processes and on a variety of tools and practices
We will have within CCU the necessary talent in order to conduct our businesses in every level and function, looking for our comprehensive development, putting focus on the adhesion to our Internal Corporate Values
We will assure our business long term sustainability by promoting, with focus on its external dimension, a responsible leadership and a close relationship with our different stakeholders
Growth
Efficiencies
Business Model
Talent
Sustainability
23


![SaaS & Cloud Alliances : What is IBM France's Club Alliances [SaaS, Cloud] ?](https://static.fdocuments.us/doc/165x107/554220a1550346cf068b45f1/saas-cloud-alliances-what-is-ibm-frances-club-alliances-saas-cloud-.jpg)