Investor presentation London 6 February 2020...ROSHNI Roshni is living with type 1 diabetes in...
18
Investor presentation London 6 February 2020 ROSHNI Roshni is living with type 1 diabetes in India
Transcript of Investor presentation London 6 February 2020...ROSHNI Roshni is living with type 1 diabetes in...

Investor presentation
London
6 February 2020
ROSHNIRoshni is living with type 1 diabetes in India

Slide 2
5,05
4,10
3,50
4,72
Agenda
Investor presentation Full year 2019
Highlights
R&D update
Financials and outlook
Sales update
Strategic aspirations 2025
Slide 2

5,05
4,10
3,50
4,72
Forward-looking statements
Novo Nordisk’s reports filed with or furnished to the US Securities and Exchange Commission (SEC), including this presentation as well as the company’s statutory Annual Report 2019 and Form 20-F, which are both expected to be filed with the SEC in February 2020 in continuation of the publication of the Annual Report 2019, and written information released, or oral statements made, to the public in the future by or on behalf of Novo Nordisk, may contain forward-looking statements. Words such as ‘believe’, ‘expect’, ‘may’, ‘will’, ‘plan’, ‘strategy’, ‘prospect’, ‘foresee’, ‘estimate’, ‘project’, ‘anticipate’, ‘can’, ‘intend’, ‘target’ and other words and terms of similar meaning in connection with any discussion of future operating or financial performance identify forward-looking statements. Examples of such forward-looking statements include, but are not limited to:
• Statements of targets, plans, objectives or goals for future operations, including those related to Novo Nordisk’s products, product research, product development, product introductions and product approvals as well as cooperation in relation thereto,
• Statements containing projections of or targets for revenues, costs, income (or loss), earnings per share, capital expenditures, dividends, capital structure, net financials and other financial measures,
• Statements regarding future economic performance, future actions and outcome of contingencies such as legal proceedings, and
• Statements regarding the assumptions underlying or relating to such statements.
These statements are based on current plans, estimates and projections. By their very nature, forward-looking statements involve inherent risks and uncertainties, both general and specific. Novo Nordisk cautions that a number of important factors, including those described in this presentation, could cause actual results to differ materially from those contemplated in any forward-looking statements.
Factors that may affect future results include, but are not limited to, global as well as local political and economic conditions, including interest rate and currency exchange rate fluctuations, delay or failure of projects related to research and/or development, unplanned loss of patents, interruptions of supplies and production, product recalls, unexpected contract breaches or terminations, government-mandated or market-driven price decreases for Novo Nordisk’s products, introduction of competing products, reliance on information technology, Novo Nordisk’s ability to successfully market current and new products, exposure to product liability and legal proceedings and investigations, changes in governmental laws and related interpretation thereof, including on reimbursement, intellectual property protection and regulatory controls on testing, approval, manufacturing and marketing, perceived or actual failure to adhere to ethical marketing practices, investments in and divestitures of domestic and foreign companies, unexpected growth in costs and expenses, failure to recruit and retain the right employees, and failure to maintain a culture of compliance.
For an overview of some, but not all, of the risks that could adversely affect Novo Nordisk’s results or the accuracy of forward-looking statements in this presentation, reference is made to the overview of risk factors in ‘Managing risks to protect value’ on pp 33-35 of the Annual Report 2019.
Unless required by law, Novo Nordisk is under no duty and undertakes no obligation to update or revise any forward-looking statement after the distribution of this presentation, whether as a result of new information, future events or otherwise.
Important drug information
• Victoza® is approved for the management of type 2 diabetes only
• Saxenda® is approved in the USA and the EU for the treatment of obesity only
Investor presentation Full year 2019 Slide 3

Strategic aspirations for 2025- Highlights 2019
Com
merc
ial
execution
Fin
ancia
ls
Patients reached with Novo Nordisk products increased by 3% to 30 million
Access to Insulin Commitment expanded with 29 middle-income countries, reaching 2.9 million patients
Circular for Zero environmental strategy introduced
Diabetes:
• Rybelsus® received approval for the treatment of type 2 diabetes in the US and positive EU CHMP opinion
• Ozempic® approved in the US for CV risk reduction
• Insulin icodec (LAI287) phase 2 trial successfully completed
Obesity:
• AM833 phase 2 trial initiated
Biopharm:
• Esperoct® approved in the US, the EU and Japan for the treatment of haemophilia A
Diabetes sales increased by 4%:
• Value market share leadership expanded by 0.8%-point to 28.6%
• Sales of GLP-1 increased by 22% reflecting solid launch of Ozempic®
Obesity sales increased by 42% to DKK 5.7 billion
Biopharm increased by 4% driven by key productsNovoEight®, Refixia®, and Esperoct®
Sales increased by 6% to DKK 122.0 billion• 11% and 1% growth in IO and NAO, respectively
Operating profit increased by 6% to DKK 52.5 billion
Free cash flow of DKK 34.5 billion
Total dividend of DKK 8.35 per share of DKK 0.20
Investor presentation Full year 2019
Note: Unless otherwise specified growth rates are at constant exchange rates; CV: Cardiovascular; IO: International operations; NAO: North America operations
Purp
ose a
nd
susta
inability
Innovation a
nd
thera
peutic focus
Slide 4

Slide 5
0
10
20
30
40
50
60
70
IO Region
Europe
Region
AAMEO
Region
China
Region
J&K
Region
LATAM
NAO
11%
Reported sales split for FY 2019
Sales growth of 6% at CER, driven by solid sales growth in International Operations
Investor presentation Full year 2019
GLP-1 Other diabetesInsulin
BiopharmDKKbillion
1%
7%
14%12%
5% 24%
Obesity
International Operations regions
IO: International Operations; AAMEO: Africa, Asia, Middle East & Oceania; J&K: Japan & Korea; LATAM: Latin America; NAO: North America Operations; FY: Full year
Growth at CER
Growth drivers for FY 2019
International Operations sales growth of 11% at CER supported by all regions
• Increasing sales across all therapy areas
• Broad innovative portfolio of products and new product launches
• Solid commercial execution applying a Market Fit approach
• Underlying demographic trends across IO countries
North America Operations sales increased by 1% at CER
• Sales growth in GLP-1 (+19%), Obesity (+28%), and Biopharm (+2%), offset by declining insulin sales (-16%)
Slide 5

Slide 6
-2
0
2
4
6
8
10
12
Total Insulin GLP-1 Obesity Biopharm
Sales growth of 6% at CER, driven by GLP-1, Obesity, and Biopharm, partly offset by declining US insulin sales
Investor presentation Full year 2019
Added reported sales and growth per therapy area and operational unit at CER
International Operations North America Operations
1 “Other diabetes“ is included in TotalCER: Constant exchange rates
1%
11%
7%
-16%
19%
32%
28%
73%5%
2%
1
6% -3% 22% 42% 4%
Growth at CER• Novo Nordisk expands global diabetes value market
leadership by 0.8%-point to 28.6%
• Global insulin volume market share increased 0.2%-point to 46.5%
• Novo Nordisk expands GLP-1 market leadership by 1.3%-points to 47.5% value market share
• Saxenda® now launched in 46 countries
• Biopharm sales increased 4%, at CER, driven by new products and both operating units
Growth drivers for FY 2019
Therapy areas
Source: IQVIA MAT, Nov 2019
DKKbillion
Slide 6

Slide 7
36.8%
13.3%
7.1%
56.6%
6.4%0%
10%
20%
30%
40%
50%
60%
USA GLP-1 NBRx market share
Ozempic® and Rybelsus® US launches have increased Novo Nordisk GLP-1 NBRx market share, resulting in TRx market leadership
Investor presentation Full year 2019
USA GLP-1 TRx market growth and market share
Source: TRx-IQVIA Xponent, Dec 2019TRx: Total prescriptions1 Q4 2019 vs. Q4 2018
Jan2019
Dec2019
Weekly NBRx share
Source: NBRx-IQVIA National LRx Weekly, week ending 27 Dec 2019NBRx: New-to-brand prescriptions
NN GLP-1
Victoza®
Ozempic®
dulaglutide other
Rybelsus®
Jan2019
Dec2019
46.8%
44.9%
8.3%
20.6%
0%
20%
40%
60%
80%
0.0
0.5
1.0
1.5
2.0Market growth: 32%1
TRx volume (million)
TRx share
NN GLP-1 dulaglutide otherOzempic®
36.4%
Slide 7

Slide 8
0
3
6
9
IO Region
Europe
Region
AAMEO
Region
China
Region
LATAM
Region
Japan &
Korea
60.0%
61.4%
0%
20%
40%
60%
80%
NN share of growthNN market share
Source: IQVIA 3 months rolling value, Nov 2019SoG: Share of growth Countries included: Belgium, Czech Republic, Denmark, Finland, France, Hungary, Ireland, Italy, Luxembourg, Netherlands, Norway, Slovakia, Spain, Sweden, Switzerland and the UK
Strong GLP-1 sales growth in IO driven by Ozempic® launch uptake in Europe and GLP-1 portfolio across regions
Investor presentation Full year 2019
Nov 2017
Nov2019
Reported GLP-1 sales, growth, and share of regional growth per region
1st European launch
GLP-1 value market share and share of growth in select European launch markets
DKKbillion
31%
70%15% 14%55%
GLP-1 growth at CER
32%
76%
7% 26% 31% 29%
GLP-1 share of growth
IO: International Operations
International Operations regions35%
Market Share
Slide 8

Slide 9
56%
0%
20%
40%
60%
0.0
0.4
0.8
1.2
1.6
Reported sales split in operational units Novo Nordisk remains global market leader
Global rollout and promotional activities drive 42% at CER, Saxenda® sales growth for 2019
Investor presentation Full year 2019
DKK billion
Source: IQVIA monthly, Nov 2019Note: Growth rates are at CERIO: International Operations; NAO: North America Operations
Q2 Q3 Q4 Q2
North America OperationsInternational Operations
ION
AO
• Sales growth of 73% driven by all regions
• Novo Nordisk currently has a value market share of 36% in the obesity market
• Sales growth of 28% driven by both the USA and Canada
• Novo Nordisk currently has a value market share of 70% in the obesity market
Glo
bal
• Novo Nordisk expands market leadership to 56% value market share from 48%
• Saxenda® is now launched in 46 countries
• Continued investments in market development activities
Growth at CER
Q1Q3 Q1Q4Q2Q1
64%
42%
Note: Numbers in the graph are reported quarterly salesCER: Constant exchange rates
51%
2017 2018 2019
Q3 Q4
Value market share Market Share
Slide 9

Slide 10
0.0
0.2
0.4
0.6
0.8
1.0
1.2
Haemophilia
Investor presentation Full year 2019
Solid commercial execution and new product launches drive 4%, at CER, Biopharm sales growth
Increase in reported Biopharm sales across products Biopharm sales driven by global commercial execution
Biopharm sales growth driven by 5% in International Operations and by 2% in North America Operations
Haemophilia sales increased by 4% driven by
• Continued global rollout of NovoEight®, Refixia® ,and Esperoct®
• Stable NovoSeven® sales, reflecting the solid position in a competitive market
Novo Nordisk retains global market leadership in the human growth disorder market with a 33% value market share
Note: ‘Other haemophilia’ includes Esperoct®, NovoThirteen® and Refixia®; ‘Other Biopharm’ includes primarily Vagifem® and Activelle®
Total Novo-Seven®
NovoEight® Other haemo-philia
Nordi-tropin®
Other Biopharm
4% 0% 10% 81% 2% 6%
Growth at CERDKK billion
Note: Sales growth reported at constant exchange rates
Slide 10

Slide 11
5,05
4,10
3,50
4,72
Ozempic® receives CV risk reduction indication in the US, Rybelsus®
receives CV safety label update in the US and positive CHMP opinion
Investor presentation Full year 2019
Cardiovascularindication in the US
Ozempic® is indicated for1:• Adults with type 2 diabetes• Reducing the risk of major
adverse cardiovascular events in adults with type 2 diabetes and established cardiovascular disease 0
5
10
15
0 4 8 12 16 20 24
Patients
with a
n
event
(%)
Months
MACE
Placebo: 8.9%
Semaglutide: 6.6%
The proportion of patients who experienced at least one MACE was 3.8% with Rybelsus® and 4.8% with placebo
Non-inferiority was established, with a hazard ratio equal to 0.79 [95% CI: 0.57, 1.11]
SOUL Cardiovascular Outcomes trial
9,642 people
with type 2 diabetes Placebo + SOC
Oral sema 14 mg + SOC
Event-driven
Positive CHMP opinion in the EU
Rybelsus® is indicated as monotherapy when metformin is considered inappropriate for the treatment of type 2 diabetes1
Cardiovascular
update in the US
CV: Cardiovascular; CVD: Cardiovascular disease; MACE: Major adverse cardiovascular event; 1 Abbreviated version of the approved product information
Slide 11

5,05
4,10
3,50
4,72
Insulin icodec (LAI287), a novel once-weekly insulin analog, versus insulin glargine
Icosema (LAIsema), a combination of once-weekly icodec and once-weekly semaglutide
Insulin icodec (LAI287) phase 2 and icosema (LAIsema) phase 1 trials successfully completed
Investor presentation Full year 2019
247 peoplewith type 2
diabetes
Icodec (weekly) + metformin ± DPP-4i (+ daily placebo)
Results• Change in HbA1c from baseline: insulin icodec, -1.33%-points
vs. insulin glargine U100, -1.15%-points
• Low rates of hypoglycaemic events for both arms
• No unexpected safety events
• Phase 3 initiation planned for second half of 2020
Icosema Sema Icodec30 people with type 2
diabetes
Details
• Investigated safety, tolerability and pharmacokinetics
• Following the completion of the phase 1 trial, icosema is now being evaluated for further clinical trial development
5 weeks PK
1:1
Insulin glargine U100 (daily) + metformin ± DPP-4i (+ weekly placebo)
1 A phase 2, double-blinded and treat-to-target trialPK: PharmacokineticsNote: Insulin icodec is the international non-proprietary name
1-4 week washout
5 weeks PK
5 weeks PK
1-4 week washout
1
2 A phase 1 trial with only one of six possible treatment sequences shownSema: Semaglutide; PK: Pharmacokinetics Note: Icosema is the international non-proprietary name
2
Slide 12

R&D milestones in 2020Project Q1 2020 Q2 2020 Q3 2020 Q4 2020
Rybelsus®
(Oral semaglutide)
Clinical milestones1 Regulatory milestones1
√
Investor presentation Full year 2019
1 Expected to be published in the given quarter or in the subsequent quarterly company announcement; 2 Obesity projects include GG-co-agonist and Tri-agonist 1706 Sema: Semaglutide; GIP: Gastric inhibitory polypeptide; EU: European Union; JP PMDA: Japanese Pharmaceutical and Medical Devices Agency; OW: Once-weekly; AGHD: Adult growth hormone deficiency; PoC: Proof of Concept
✓
✓JP PMDA decisionEU CHMP decision
Xultophy® China submission
Icodec
✓
Obesity Projects2 Phase 1 results
Mim8
✓
Sema+OW GIP
Semaglutide NASH Phase 2 results
Diabetes Haemophilia Growth disordersObesity Other serious chronic diseases
Amylin - AM833
Phase 1 initiation
✓
✓
✓
PCSK9i
Phase 2 initiation
Phase 3 initiation
EU commission decision
Semaglutide Phase 3 results
Phase 2 results
LA-GDF 15 Phase 1 results
Phase 1/2 initiation
Somapacitan(AGHD) JP submission US/EU decision
Phase 2 results (PoC, Gilead)
FGF-21 NASH
Phase 1 results
✓
Phase 2 results ✓
CV label update ✓
Ozempic® CV label indication ✓China submission
SUSTAIN FORTE –Phase 3 results
✓
Slide 13

Slide 14
Financial results – Full year 2019
Investor presentation Full year 2019
CER: Constant exchange rates
In DKK million 2019 2018
Change (reported)
Change (CER)
Sales 122,021 111,831 9% 6%
Gross profit 101,933 94,214 8%Gross margin 83.5% 84.2%
Sales and distribution costs 31,823 29,397 8% 6%
Percentage of sales 26.1% 26.3%
Research and development costs 14,220 14,805 (4%) (6%)Percentage of sales 11.7% 13.2%
Administration costs 4,007 3,916 2% 1%Percentage of sales 3.3% 3.5%
Other operating income, net 600 1,152 (48%)
Operating profit 52,483 47,248 11% 6%Operating margin 43.0% 42.2%
Financial items (net) (3,930) 367
Profit before income tax 48,553 47,615 2%
Income taxes 9,602 8,987 7%Effective tax rate 19.8% 18.9%
Net profit 38,951 38,628 1%
Diluted earnings per share (DKK) 16.38 15.93 3%
Slide 14

5,05
4,10
3,50
4,72
11 12 12 13
7 7 7
17 15 1517
0
15
30
45
2017 2018 2019 2020E
Expected cash return to shareholders in 2020 and long-term financial targets have been met
1 For 2020, expected free cash flow is DKK 36-41 billion.
Note: Share repurchase programmes run for 12 months starting Feb until end-Jan of the following year.
Investor presentation Full year 2019
Cash return prioritiesAnnual cash return to shareholders
• For 2019, the proposed total dividend increased 2.5% to DKK 8.35 per share including interim dividend of DKK 3.00 per share paid in August 2019.
• For 2020, a new share repurchase programme of up to DKK 17 billion is expected
• Total programme may be reduced in size if significant bolt-on acquisition opportunities arise during 2020
DKK billion
Share repurchase
Dividend
Free cash flow
Interim dividend
Free cash flow guidance
Novo Nordisk has met its long-term financial targets
Cash Conversion (three-year average)
Target: 85%2019: 86%
OPAT/NOATarget: 80%2019: 98%
Average operating profit growthTarget: 5%
2016-2019: 4.9%1
Slide 15

Slide 16
Financial outlook for 2020
The financial outlook is based on an assumption of a continuation of the current business environment and given the current scope of business activities and has been prepared assuming that currency exchange rates remain at the level as of 31 January 2020. CER: Constant exchange rates
Investor presentation Full year 2019
Sales growth – at CER
Sales growth - reported
Operating profit growth – at CER
Operating profit growth - reported
Financial items (net)
Effective tax rate
Capital expenditure
Free cash flow
Depreciation, amortisation and impairment losses
Expectations5 Feb 2020
3% to 6%
1% to 5%
Loss of around DKK 1.5 billion
20% to 22%
Around DKK 6.5 billion
Around DKK 5 billion
DKK 36 to 41 billion
Around 1 percentage point higher
Around 1 percentage point higher
Slide 16
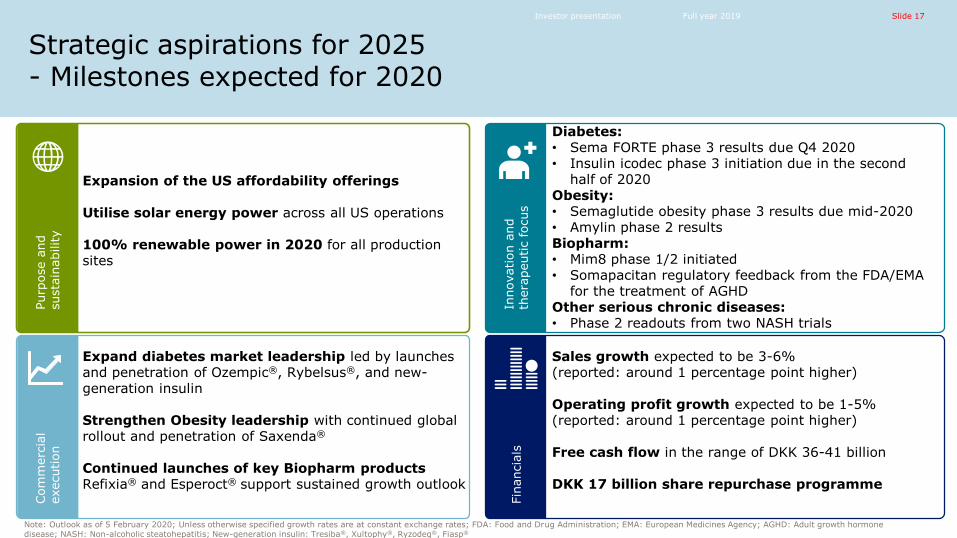
Strategic aspirations for 2025- Milestones expected for 2020
Purp
ose a
nd
susta
inability
Com
merc
ial
execution
Innovation a
nd
thera
peutic focus
Fin
ancia
ls
Expansion of the US affordability offerings
Utilise solar energy power across all US operations
100% renewable power in 2020 for all production sites
Diabetes:• Sema FORTE phase 3 results due Q4 2020• Insulin icodec phase 3 initiation due in the second
half of 2020Obesity:• Semaglutide obesity phase 3 results due mid-2020• Amylin phase 2 resultsBiopharm:• Mim8 phase 1/2 initiated• Somapacitan regulatory feedback from the FDA/EMA
for the treatment of AGHDOther serious chronic diseases:• Phase 2 readouts from two NASH trials
Expand diabetes market leadership led by launches and penetration of Ozempic®, Rybelsus®, and new-generation insulin
Strengthen Obesity leadership with continued global rollout and penetration of Saxenda®
Continued launches of key Biopharm products Refixia® and Esperoct® support sustained growth outlook
Sales growth expected to be 3-6% (reported: around 1 percentage point higher)
Operating profit growth expected to be 1-5% (reported: around 1 percentage point higher)
Free cash flow in the range of DKK 36-41 billion
DKK 17 billion share repurchase programme
Investor presentation Full year 2019
Note: Outlook as of 5 February 2020; Unless otherwise specified growth rates are at constant exchange rates; FDA: Food and Drug Administration; EMA: European Medicines Agency; AGHD: Adult growth hormone disease; NASH: Non-alcoholic steatohepatitis; New-generation insulin: Tresiba®, Xultophy®, Ryzodeg®, Fiasp®
Slide 17

Slide 18
Share information Investor Relations contacts
Investor contact information
Investor presentation Full year 2019
Novo Nordisk’s B shares are listed on the stock exchange in Copenhagen under the symbol ‘NOVO B’. Its ADRs are listed on the New York Stock Exchange under the symbol ‘NVO’.
For further company information, visit Novo Nordisk on: www.novonordisk.com
Peter Hugreffe Ankersen +45 3075 9085 [email protected]
Valdemar Borum Svarrer +45 3079 0301 [email protected]
Ann Søndermølle Rendbæk +45 3075 2253 [email protected]
Mark Joseph Root +45 3079 4211 [email protected]
Kristoffer Due Berg (USA) +1 609 235 2989 [email protected]
Novo Nordisk A/S Investor Relations Novo AlléDK-2880 Bagsværd
Upcoming events
26 Mar 2020 Annual General Meeting
06 May 2020 Financial statement for the first three months of 2020
06 Aug 2020 Financial statement for the first six months of 2020
30 Oct 2020 Financial statement for the first nine months of 2020
Slide 18