Investor presentation Full year 2017 - novonordisk.com 5 5,05 4,10 3,50 4,72 11,82 11,82 Executive...
111
Investor presentation Full year 2017 Manato Ohara, diagnosed with type 1 diabetes Kanagawa, Japan
-
Upload
hoangkhanh -
Category
Documents
-
view
217 -
download
0
Transcript of Investor presentation Full year 2017 - novonordisk.com 5 5,05 4,10 3,50 4,72 11,82 11,82 Executive...

Slide 1
5,05
4,10
3,50
4,72
11,82 11,82
Investor presentation
Full year 2017
Manato Ohara, diagnosed with type 1 diabetes Kanagawa, Japan

Slide 2
5,05
4,10
3,50
4,72
11,82 11,82
Agenda
Investor Presentation Full year 2017
Highlights and key events
R&D update
Financials and outlook
Sales update

Slide 3
5,05
4,10
3,50
4,72
11,82 11,82
Forward-looking statements
Novo Nordisk’s reports filed with or furnished to the US Securities and Exchange Commission (SEC), including the company’s Annual Report 2016 and Form 20-F, which are both filed with the SEC in February 2017 in continuation of the publication of the Annual Report 2016, and written information released, or oral statements made, to the public in the future by or on behalf of Novo Nordisk, may contain forward-looking statements. Words such as ‘believe’, ‘expect’, ‘may’, ‘will’, ‘plan’, ‘strategy’, ‘prospect’, ‘foresee’, ‘estimate’, ‘project’, ‘anticipate’, ‘can’, ‘intend’, ‘target’ and other words and terms of similar meaning in connection with any discussion of future operating or financial performance identify forward-looking statements. Examples of such forward-looking statements include, but are not limited to:
• Statements of targets, plans, objectives or goals for future operations, including those related to Novo Nordisk’s products, product research, product development, product introductions and product approvals as well as cooperation in relation thereto
• Statements containing projections of or targets for revenues, costs, income (or loss), earnings per share, capital expenditures, dividends, capital structure, net financials and other financial measures
• Statements regarding future economic performance, future actions and outcome of contingencies such as legal proceedings, and
• Statements regarding the assumptions underlying or relating to such statements.
These statements are based on current plans, estimates and projections. By their very nature, forward-looking statements involve inherent risks and uncertainties, both general and specific. Novo Nordisk cautions that a number of important factors, including those described in this presentation, could cause actual results to differ materially from those contemplated in any forward-looking statements.
Factors that may affect future results include, but are not limited to, global as well as local political and economic conditions, including interest rate and currency exchange rate fluctuations, delay or failure of projects related to research and/or development, unplanned loss of patents, interruptions of supplies and production, product recall, unexpected contract breaches or terminations, government-mandated or market-driven price decreases for Novo Nordisk’s products, introduction of competing products, reliance on information technology, Novo Nordisk’s ability to successfully market current and new products, exposure to product liability and legal proceedings and investigations, changes in governmental laws and related interpretation thereof, including on reimbursement, intellectual property protection and regulatory controls on testing, approval, manufacturing and marketing, perceived or actual failure to adhere to ethical marketing practices, investments in and divestitures of domestic and foreign companies, unexpected growth in costs and expenses, failure to recruit and retain the right employees, and failure to maintain a culture of compliance.
Please also refer to the overview of risk factors in ‘Risk Management’ on pp 40-43 of the Annual Report 2016.
Unless required by law, Novo Nordisk is under no duty and undertakes no obligation to update or revise any forward-looking statement after the distribution of this presentation, whether as a result of new information, future events or otherwise.
Important drug information
• Victoza® (liraglutide 1.2 mg & 1.8 mg) is approved for the management of type 2 diabetes only
• Saxenda® (liraglutide 3 mg) is approved in the US and EU for the treatment of obesity only
Investor Presentation Full year 2017
Slide 4
5,05
4,10
3,50
4,72
11,82 11,82
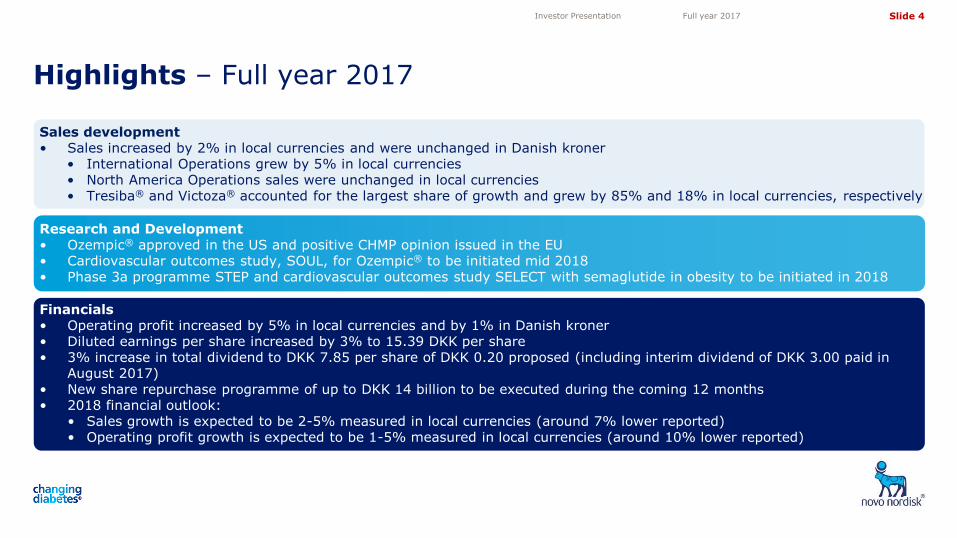
Highlights – Full year 2017
Investor Presentation Full year 2017
Research and Development • Ozempic® approved in the US and positive CHMP opinion issued in the EU • Cardiovascular outcomes study, SOUL, for Ozempic® to be initiated mid 2018 • Phase 3a programme STEP and cardiovascular outcomes study SELECT with semaglutide in obesity to be initiated in 2018
Sales development • Sales increased by 2% in local currencies and were unchanged in Danish kroner
• International Operations grew by 5% in local currencies • North America Operations sales were unchanged in local currencies • Tresiba® and Victoza® accounted for the largest share of growth and grew by 85% and 18% in local currencies, respectively
Financials • Operating profit increased by 5% in local currencies and by 1% in Danish kroner • Diluted earnings per share increased by 3% to 15.39 DKK per share • 3% increase in total dividend to DKK 7.85 per share of DKK 0.20 proposed (including interim dividend of DKK 3.00 paid in
August 2017) • New share repurchase programme of up to DKK 14 billion to be executed during the coming 12 months • 2018 financial outlook:
• Sales growth is expected to be 2-5% measured in local currencies (around 7% lower reported) • Operating profit growth is expected to be 1-5% measured in local currencies (around 10% lower reported)

Slide 5
5,05
4,10
3,50
4,72
11,82 11,82
Executive management as of 15 February 2018
Investor Presentation Full year 2017
President & CEO
Doug Langa1
Maziar Mike Doustdar1
Mads Krogsgaard Thomsen
Karsten Munk Knudsen
Henrik Wulff
North America Operations
International Operations
Research & Development
Biopharm & Legal Affairs
Product Supply
Lars Fruergaard Jørgensen
Business Services & Compliance
Lars Green
1 Not registered with the Danish Business Authority
Commercial Strategy &
Corporate Affairs
Camilla Sylvest
Finance, Investor Relations &
Procurement
Jesper Brandgaard
Slide 6
5,05
4,10
3,50
4,72
11,82 11,82
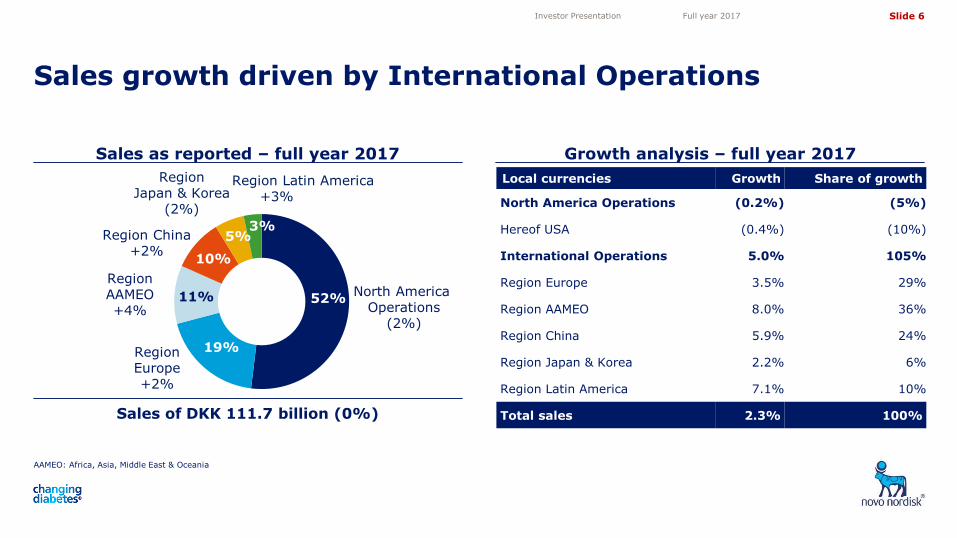
Growth analysis – full year 2017
Sales growth driven by International Operations
Investor Presentation Full year 2017
Sales as reported – full year 2017
Sales of DKK 111.7 billion (0%)
Local currencies Growth Share of growth
North America Operations (0.2%) (5%)
Hereof USA (0.4%) (10%)
International Operations 5.0% 105%
Region Europe 3.5% 29%
Region AAMEO 8.0% 36%
Region China 5.9% 24%
Region Japan & Korea 2.2% 6%
Region Latin America 7.1% 10%
Total sales 2.3% 100%
Region AAMEO +4%
Region China +2%
Region Japan & Korea
(2%)
Region Europe +2%
North America Operations
(2%)
Region Latin America +3%
AAMEO: Africa, Asia, Middle East & Oceania
19%
11%
10%
5% 3%
52%

Slide 7
5,05
4,10
3,50
4,72
11,82 11,82
Local currencies Growth Share of growth
New-generation insulin1 98% 173%
Modern insulin (4%) (76%)
Human insulin (7%) (29%)
Victoza® 18% 140%
Other diabetes care2 (3%) (5%)
Total diabetes care 6% 203%
Obesity (Saxenda®) 64% 40%
Diabetes care and obesity total 7% 243%
Haemophilia3 2% 7%
Growth disorders (22%) (76%)
Other biopharmaceuticals4 (52%) (74%)
Biopharmaceuticals (16%) (143%)
Total 2% 100%
Sales growth derived from diabetes care and obesity, driven by Tresiba®, Victoza® and Saxenda®
Investor Presentation Full year 2017
Sales as reported – full year 2017 Growth analysis – full year 2017
1 Comprises Tresiba®, Xultophy®, Ryzodeg® and Fiasp®
2 Primarily NovoNorm® and needles 3 Comprises NovoSeven®, NovoEight®
, NovoThirteen® and Refixia®
4 Primarily Vagifem® and Activelle®
Other biopharmaceuticals
(53%)
7% Haemophilia 0%
11% Diabetes care
+3%
79%
3%
Growth hormone
(24%)
Sales of DKK 111.7 billion (0%)
Obesity +62%
2% 9%
6% 2%
81%

Slide 8
5,05
4,10
3,50
4,72
11,82 11,82
Basal insulin market penetration with Tresiba® supported by Xultophy® launches
0%
20%
40%
60%
0 10 20 30 40 50
0%
10%
20%
30%
40%
0 10 20 30 40 50
Investor Presentation Full year 2017
Combined value market share of Tresiba® and Xultophy® in selected countries
Months from launch1
Switzerland Sweden Greece
59%
43%
24%
Tresiba® share
Tresiba® value market share of basal insulin segment in selected countries outside the US
Note: Limited IQVIA (formerly IMS) coverage in India Source: IQVIA (formerly IMS), Monthly value figures, Nov 2017
Months from launch
Mexico
Switzerland
Japan Denmark
Netherlands
Brazil
UK Greece
Italy Spain
13%
7%
32%
25%
13%
28%
42%
32%
19%
Source: IQVIA (formerly IMS), Monthly value figures, Nov 2017 1 Switzerland, Sweden and Greece: Months from Tresiba® launch. France: Months from Xultophy® launch (Tresiba® is not launched in France).
France (Xultophy® only)
14%
19%
Argentina
23%

Slide 9
5,05
4,10
3,50
4,72
11,82 11,82
glargine U100
0%
10%
20%
30%
40%
50%
60%
70%
01/01/2016
Weekly TRx volume market shares in the US
Total Novo Nordisk basal insulin volume market share has increased to 34% in the US
Tresiba® launch in the US
• The ambition to reach 10% Tresiba® TRx volume market share in 2017 achieved
• Tresiba® TRx volume market share is now 10.7%
• Tresiba® formulary access expected to remain largely unchanged at approximately 70% for commercial and Medicare Part D combined in 2018
• Opportunity for Tresiba® to grow volume market share further in early 2018 due to changes in the Part D formulary access
Basal volume TRx MS
Levemir® NN Total Basal
Tresiba® glargine U300
biosimilar glargine U100
Source: IQVIA weekly Xponent Plantrak (excludes Medicaid), 12 Jan, 2018, VANTAGE FingerTip Formulary bridge, Nov 2017
Note: The graph does not show NPH, which accounts for the residual market share Source: IQVIA weekly Xponent Plantrak (excludes Medicaid), 12 Jan 2018 TRx volume: Insulin volume in mega units (MU) associated with total number of prescriptions; MS: Market share
Jan 2018
Jan 2016
Investor Presentation Full year 2017
45%
34%
23%
8% 6%
11%

Slide 10
5,05
4,10
3,50
4,72
11,82 11,82
GLP-1 TRx market share
GLP-1 TRx volume (000)
albiglutide
MAT GLP-1 TRx volume (million)
0%
20%
40%
60%
80%
100%
0
50
100
150
200
250
300
350
400
Investor Presentation Full year 2017
US GLP-1 market development
Source: IQVIA NPA monthly, Nov 2017
US GLP-1 volume market share
Total TRx Growth rate MAT volume growth rate
Nov 2017
Nov 2014
0%
5%
10%
15%
20%
25%
30%
35%
0
2
4
6
8
10
Mill
ions
Nov 2014
Nov 2017
US GLP-1 market monthly TRx
Nov 2014
Nov 2017
exenatide Victoza®
dulaglutide
Victoza® continues strong growth trajectory in the US driven by GLP-1 market volume growth of 23%
albiglutide
exenatide Victoza®
dulaglutide
44%
37%
15%
4%

Slide 11
5,05
4,10
3,50
4,72
11,82 11,82
Ozempic® label in the USA CHMP endorsed inclusion of CV data
from SUSTAIN 6 trial in Ozempic® EU label
approved in the USA and positive CHMP opinion issued in the EU
1 95% confidence interval [0.58;0.95]. 2 95% confidence interval [0.78;0.97] CV: Cardiovascular; MACE: Major adverse cardiovascular events; HR: Hazard ratio
Investor Presentation Full year 2017
Ozempic® label recommended Victoza® label
Trial SUSTAIN 6 LEADER
Patients 3,297 9,340
Reference to CV results in indication
Recommended Included
MACE HR: 0.741 HR: 0.872
Kaplan-Meier Recommended Included
Safety
Efficacy
Safety
• Guidance on retinopathy similar to wording in insulin labels
• Cardiovascular safety with number of MACE events in clinical section
Safety • Reduction in HbA1c vs comparators1
• Reduction in body weight vs comparators1
Safety Conve-nience
• Administered once-weekly
• To be launched in the Ozempic® pen
1 Statistically significant reduction compared to comparators: placebo, sitagliptin, exenatide extended-release and insulin glargine U100 (phase 3a SUSTAIN trial programme)
Slide 12
5,05
4,10
3,50
4,72
11,82 11,82
Investor Presentation Full year 2017
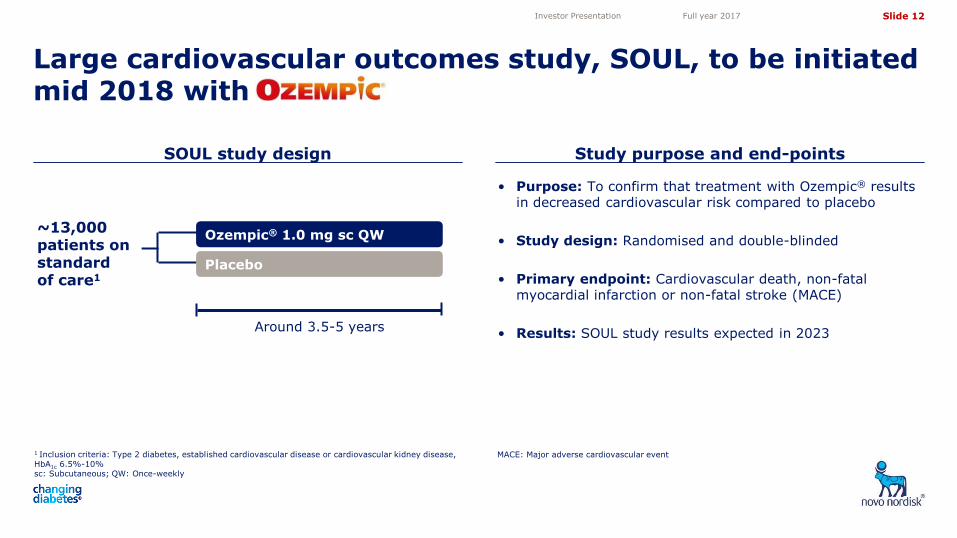
1 Inclusion criteria: Type 2 diabetes, established cardiovascular disease or cardiovascular kidney disease, HbA1c 6.5%-10% sc: Subcutaneous; QW: Once-weekly
SOUL study design Study purpose and end-points
Large cardiovascular outcomes study, SOUL, to be initiated mid 2018 with
• Purpose: To confirm that treatment with Ozempic® results in decreased cardiovascular risk compared to placebo
• Study design: Randomised and double-blinded
• Primary endpoint: Cardiovascular death, non-fatal myocardial infarction or non-fatal stroke (MACE)
• Results: SOUL study results expected in 2023
Ozempic® 1.0 mg sc QW
Around 3.5-5 years
Placebo
~13,000 patients on standard of care1
MACE: Major adverse cardiovascular event

Slide 13
5,05
4,10
3,50
4,72
11,82 11,82
Phase 3a programme STEP and CV outcomes study SELECT with semaglutide 2.4 mg in obesity to be initiated
Investor Presentation Full year 2017
1 Inclusion criteria: Male or female, age ≥18 years, BMI: ≥30 kg/m2 or ≥27 kg/m2 and ≥1 comorbidity Note: All treatment arms are adjunct to diet and exercise CV: Cardiovascular; T2D: Type 2 diabetes
Semaglutide in obesity phase 3a programme, STEP, expected to include ~4,500 patients1
Expected phase 3a programme completion: 2020
STEP 1: Weight loss 1,950 patients, 68 weeks
STEP 2: T2D non-insulin patients 1,200 patients, 68 weeks
STEP 3: Maximising weight loss 600 patients, 68 weeks
STEP 4: Maintained weight loss 900 patients, 68 weeks
2018 2019 2020
Cardiovascular outcomes study, SELECT, planned for semaglutide in obesity
1 Inclusion criteria: Male or female >45 years, BMI >27 kg/m2, myocardial infarction or stroke >60 days, HbA1c <6.5% QW: Once-weekly; sc: Subcutaneous
~17,500 people with obesity1
Semaglutide 2.4 mg sc QW
Placebo
Event-driven
Completion: Pre-defined number of events
Slide 14
5,05
4,10
3,50
4,72
11,82 11,82
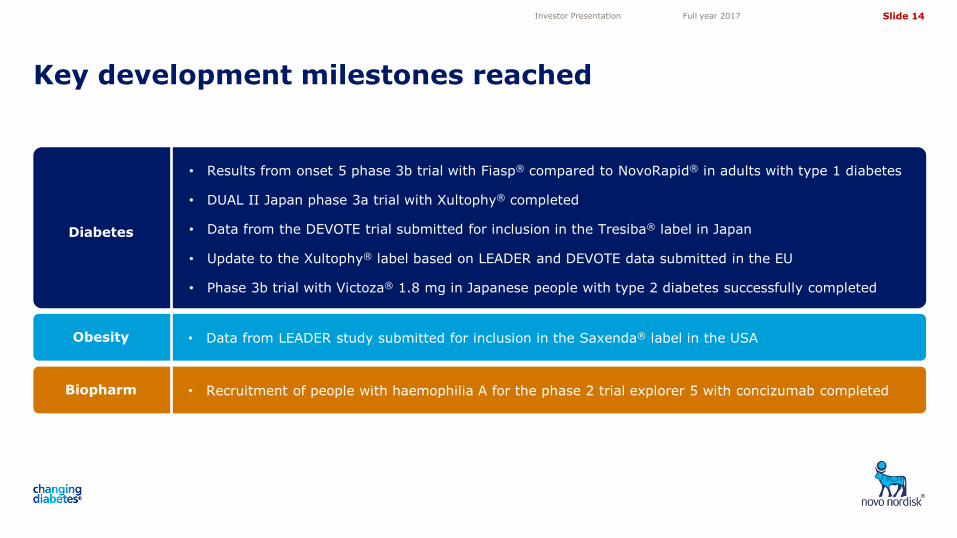
• Recruitment of people with haemophilia A for the phase 2 trial explorer 5 with concizumab completed Biopharm
Key development milestones reached
• Results from onset 5 phase 3b trial with Fiasp® compared to NovoRapid® in adults with type 1 diabetes
• DUAL II Japan phase 3a trial with Xultophy® completed
• Data from the DEVOTE trial submitted for inclusion in the Tresiba® label in Japan
• Update to the Xultophy® label based on LEADER and DEVOTE data submitted in the EU
• Phase 3b trial with Victoza® 1.8 mg in Japanese people with type 2 diabetes successfully completed
• Data from LEADER study submitted for inclusion in the Saxenda® label in the USA
Diabetes
Obesity
Investor Presentation Full year 2017

Slide 15
5,05
4,10
3,50
4,72
11,82 11,82
R&D milestones in 2018
Project Q1 2018 Q2 2018 Q3 2018 Q4 2018
Tresiba®
Xultophy®
Ozempic®
N9-GP
somapacitan
Results available1 Regulatory milestone
REAL 3 data
√
Japan regulatory decision
DUAL I Japan Phase 3a
oral semaglutide PIONEER 1 data
LAI287 Phase 1 data
AM833 Phase 1 data
N8-GP US/EU submission
DEVOTE and SWITCH US regulatory decision
EU and Japan regulatory decision
Tresiba® vs insulin glargine U300 data
PIONEER 5 and 10 data PIONEER 2, 3, 4 and 7
data PIONEER 6, 8 and 9
data
Investor Presentation Full year 2017
Japan submission
Japan submission
Fiasp® Japan submission
G530L Phase 1 data
concizumab explorer 5 data explorer 4 data
Diabetes Haemophilia Growth disorders Obesity
1 Expected to be published in the given quarter or in the subsequent quarterly company announcement AGHD: Adult growth hormone deficiency
REAL 1 AGHD data
DUAL II Japan Phase 3a

Slide 16
5,05
4,10
3,50
4,72
11,82 11,82
Financial results – full year 2017
Investor Presentation Full year 2017
DKK million FY 2017 FY 2016 Change
(reported DKK) Change
(local currency)
Sales 111,696 111,780 (0%) 2%
Gross profit 94,064 94,597 (1%) 2% Gross margin 84.2% 84.6%
Sales and distribution costs 28,340 28,377 (0%) 2% Percentage of sales 25.4% 25.4%
Research and development costs 14,014 14,563 (4%) (3%) Percentage of sales 12.5% 13.0%
Administration costs 3,784 3,962 (4%) (3%) Percentage of sales 3.4% 3.5%
Other operating income, net 1,041 737 41% 45%
Operating profit 48,967 48,432 1% 5% Operating margin 43.8% 43.3%
Financial items (net) (287) (634)
Profit before income tax 48,680 47,798 2%
Income taxes 10,550 9,873 7% Effective tax rate 21.7% 20.7%
Net profit 38,130 37,925 1%
Diluted earnings per share (DKK) 15.39 14.96 3%
Slide 17
5,05
4,10
3,50
4,72
11,82 11,82
40
60
80
100
120
140
160
75
80
85
90
95
100
105
110
115
120
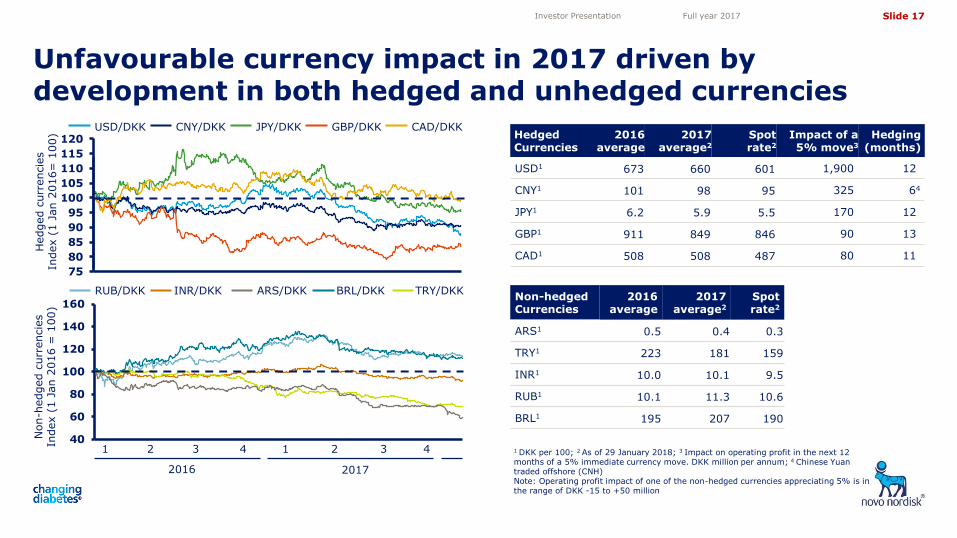
Unfavourable currency impact in 2017 driven by development in both hedged and unhedged currencies
Investor Presentation Full year 2017
Hedged c
urr
encie
s
Index (
1 J
an 2
016=
100)
CNY/DKK JPY/DKK USD/DKK CAD/DKK GBP/DKK
3 1 2 4
2016 2017
1 2
Non-h
edged c
urr
encie
s
Index (
1 J
an 2
016 =
100)
1 DKK per 100; 2 As of 29 January 2018; 3 Impact on operating profit in the next 12 months of a 5% immediate currency move. DKK million per annum; 4 Chinese Yuan traded offshore (CNH) Note: Operating profit impact of one of the non-hedged currencies appreciating 5% is in the range of DKK -15 to +50 million
INR/DKK ARS/DKK RUB/DKK TRY/DKK BRL/DKK Non-hedged Currencies
2016 average
2017 average2
Spot rate2
ARS1 0.5 0.4 0.3
TRY1 223 181 159
INR1 10.0 10.1 9.5
RUB1 10.1 11.3 10.6
BRL1 195 207 190
Hedged Currencies
2016 average
2017 average2
Spot rate2
Impact of a 5% move3
Hedging (months)
USD1 673 660 601 1,900 12
CNY1 101 98 95 325 64
JPY1 6.2 5.9 5.5 170 12
GBP1 911 849 846 90 13
CAD1 508 508 487 80 11
3 4

Slide 18
5,05
4,10
3,50
4,72
11,82 11,82
Financial outlook for 2018
The financial outlook is based on an assumption of a continuation of the current business environment and given the current scope of business activities and has been prepared assuming that currency exchange rates remain at the level as of 29 January 2018
Investor Presentation Full year 2017
Sales growth - local currencies
Sales growth - reported
Operating profit growth - local currencies
Operating profit growth - reported
Financial items (net)
Effective tax rate
Capital expenditure
Free cash flow
Depreciation, amortisation and impairment losses
Expectations 1 February 2018
2% to 5%
Around 7 percentage points lower
1% to 5%
Around 10 percentage points lower
Gain of around DKK 2.5 billion
20-22%
Around DKK 9.5 billion
Around DKK 3 billion
Around DKK 27-32 billion

Slide 19
5,05
4,10
3,50
4,72
11,82 11,82
12 13 16
11 12
7.6
7.4 15
17
15
17 14
0
5
10
15
20
25
30
35
40
45
2014 2015 2016 2017 2018E*
Cash return priorities
Cash return to shareholders in 2018
Investor Presentation Full year 2017
• New share repurchase programme of up to DKK 14 billion to be executed during the coming 12 months
• Total programme may be reduced in size if significant product in-licensing or bolt-on acquisition opportunities arise during 2018
• For 2017, the proposed total dividend increased to DKK 7.85 per share of DKK 0.20 (including interim dividend of DKK 3.00 paid in August 2017)
• Dividend distributed twice a year as interim dividend in August and final dividend following Annual General Meeting in March of the following year
• Share repurchase to correspond to at least the remaining free cash flow
Annual cash return to shareholders
* Interim dividend for 2018 to be determined. For illustration only. Note: For 2018 expected free cash flow is DKK 27-32 billion. Share repurchase programmes run for 12 months starting February until end January of the following year.
DKK billion
Share repurchase Dividend
Free cash flow
Interim dividend
Free cash flow guidance

Slide 20
5,05
4,10
3,50
4,72
11,82 11,82
Source: IQVIA (formerly IMS) MAT Nov 2017 volume and value (DKK) figures
Solid leadership positions and continued market opportunities Promising pipeline and product launches
Closing remarks
Investor Presentation Full year 2017
> > • The only company with a full portfolio of novel insulin and GLP-1 products
• Semaglutide portfolio offers expansion opportunity with both once-weekly Ozempic® and oral administration
• Xultophy® supports promising outlook for insulin and GLP-1 combination therapy
• Saxenda® and multiple clinical stage development projects hold potential within obesity
• Broad pipeline within haemophilia
27% Novo Nordisk value market share in diabetes care and solid leadership position
~4% insulin market volume growth
45% Novo Nordisk insulin volume market share with leadership position across all regions
>20% GLP-1 volume market growth
51% Novo Nordisk GLP-1 volume market share with global leadership position
37% Saxenda® value market share with a global leadership in the anti obesity market

Slide 21
5,05
4,10
3,50
4,72
11,82 11,82
Share information Investor Relations contacts
Investor contact information
Investor Presentation Full year 2017
Novo Nordisk’s B shares are listed on the stock exchange in Copenhagen under the symbol ‘NOVO B’. Its ADRs are listed on the New York Stock Exchange under the symbol ‘NVO’. For further company information, visit Novo Nordisk on the internet at: novonordisk.com
Peter Hugreffe Ankersen +45 3075 9085 [email protected]
Hanna Ögren +45 3079 8519 [email protected]
Anders Mikkelsen +45 3079 4461 [email protected]
Christina Kjær
+45 3079 3009
In North America:
Kasper Veje +1 609 235 8567 [email protected]
Novo Nordisk A/S Investor Relations Novo Allé, DK-2880 Bagsværd
Upcoming events
22 Mar 2018 Annual General Meeting 2018
02 May 2018 Financial statement for the first three months of 2018
08 Aug 2018 Financial statement for the first six months of 2018
01 Nov 2018 Financial statement for the first nine months of 2018
01 Feb 2019 Financial statement for 2018

Slide 22
5,05
4,10
3,50
4,72
11,82 11,82
Appendix
Investor Presentation Full year 2017
1. Novo Nordisk at a glance 23
3. Obesity 80
5. Other serious chronic diseases 98
2. Diabetes 37
6. Financials 100
7. Sustainable business 108
4. Biopharmaceuticals 88

Slide 23
5,05
4,10
3,50
4,72
11,82 11,82
Global leader in diabetes care Global insulin market leadership
Novo Nordisk at a glance
Source: IQVIA (formerly IMS) MAT Nov 2017 volume figures
Investor Presentation Full year 2017
R&D facility Manufacturing Global/regional headquarter
North America Operations: Market share 39%
Region Japan & Korea: Market share 50%
Region Europe: Market share 44%
Region China: Market share 53%
Global insulin market share: 46% • A focused pharmaceutical company with leading positions in
diabetes, haemophilia and growth hormone
• Significant growth opportunities driven by the diabetes
pandemic, fuelled by global presence and strong research
and development pipeline
• High barriers to entry in biologics
• Operating profit growth targeting 5% yearly on average
(measured in local currencies)
• Earnings conversion to cash targeting 90%
• Cash generated returned to shareholders
Region AAMEO: Market share 55%
AAMEO: Africa, Asia, Middle East & Oceania
Region Latin America: Market share 42%

Slide 24
5,05
4,10
3,50
4,72
11,82 11,82
Novo Nordisk strategic foundation
STRATEGIC PRIORITIES
Expand leadership in DIABETES
Pursue leadership in OBESITY
Expand leadership in GROWTH DISORDERS
Pursue leadership in HAEMOPHILIA
Strengthen leadership in GROWTH DISORDERS
Strengthen leadership in OBESITY CARE
Strengthen leadership in DIABETES CARE
Pursue leadership in HAEMOPHILIA
Expand into other SERIOUS CHRONIC DISEASES
Novo Nordisk Way
Engineering, formulating, developing and delivering protein-based treatments
Deep disease understanding
Efficient large-scale production of proteins
Global commercial reach and leader in chronic disease care
Driving change to defeat diabetes and other serious chronic conditions
CORE CAPABILITIES
Investor Presentation Full year 2017

Slide 25
5,05
4,10
3,50
4,72
11,82 11,82
0
5
10
15
20
25
30
35
Novo Nordisk reported quarterly sales by therapy
Top line growth driven by the diabetes pandemic
1 CAGR for 10-year period 2 Haemophilia includes NovoSeven®, NovoThirteen®, NovoEight® and Refixia®
Investor Presentation Full year 2017
DKK billion
Diabetes and obesity Haemophilia2
Norditropin® Other
Reported sales CAGR1: 9.8%
6.3%
6.1%
11.2%
-2.7%
Q4 2007
Q4 2017
Reported sales split by product segments for the full year of 2017
8%
40%
9%
21%
6%
9% 6%
2%
Other diabetes care and obesity
Sales of DKK 111.7 billion (0%)
New-generation insulin Human insulin
Haemophilia Growth disorders
Modern insulin
GLP-1 diabetes
Other biopharmaceuticals

Slide 26
5,05
4,10
3,50
4,72
11,82 11,82
0%
10%
20%
30%
40%
50%
0
2
4
6
8
10
Novo Nordisk has leading positions in diabetes, haemophilia and obesity
Investor Presentation Full year 2017
DKK billion
1 CAGR for 5-year period Source: IQVIA (formerly IMS) MAT Nov, 2017 value figures
Haemophilia Diabetes
DKK billion
Note: Value data is based on Australia, Belgium, Brazil, Canada, Chile, Denmark, Germany, Italy, Mexico, Russia, Spain, UAE, USA
2 CAGR for 2-year period Source: IQVIA (formerly IMS) MAT Nov, 2017 value figures
0%
10%
20%
30%
40%
50%
0
100
200
300
400
500 #1 #1
CAGR1 value: 16.2% CAGR2 value: 46.6%
Nov 2012
Nov 2017
Dec 2015
Nov 2017
Novo Nordisk value market share
Global market position
Market value
0%
10%
20%
30%
40%
50%
0
10
20
30
40
50
60
70
DKK billion
Obesity
Note: Annual sales figures for Haemophilia A, B and inhibitor segment Source: Company reports
#2
CAGR1 value: 1.7%
FY 2012
FY 2016
Market value
Novo Nordisk value market share
Global market position
Market value
Novo Nordisk value market share
Global market position

Slide 27
5,05
4,10
3,50
4,72
11,82 11,82
Region Europe
0
200
400
600
800
Source: Adapted from International Diabetes Federation: Diabetes Atlas 8th Edition 2017
Around 10% of all adults globally have diabetes The number of people with diabetes is expected
to increase by 48% by 2045
Global diabetes prevalence is increasing and 629 million people are expected to have diabetes by 2045
J&K: Japan & Korea; AAMEO: Africa, Asia, Middle-East and Oceania; LATAM: Latin America Source: International Diabetes Federation: Diabetes Atlas 1th Edition 2000 and Diabetes Atlas 8th Edition 2017
Region LATAM Region AAMEO
Region China Region J&K
2000 2017 2045
North America
+48%
151
425
629
Million
<4%
4-5%
5-7%
7-9%
9-12%
>12%
Investor Presentation Full year 2017

Slide 28
5,05
4,10
3,50
4,72
11,82 11,82
Only 6% of all people with diabetes are treated with Novo Nordisk products
Focus on driving global insulin growth by increasing the number of people benefitting from Novo Nordisk products
Around 26 million people are currently treated with Novo Nordisk insulin and GLP-1 products
1.4 mio treated with GLP-1
0.9 mio treated with new-generation insulin
12.5 mio treated with modern insulin
11.2 mio treated with Human insulins
NN: Novo Nordisk Source: International Diabetes Federation: Diabetes Atlas 8th Edition 2017
26 of 425 million people with diabetes are treated with NN products
Investor Presentation Full year 2017

Slide 29
5,05
4,10
3,50
4,72
11,82 11,82
0%
10%
20%
30%
0
100
200
300
400
500
1 CAGR for 10-year period OAD: Oral Anti-diabetic Source: IQVIA (formerly IMS) MAT Nov, 2017 value figures
Global diabetes care market by treatment class
Global diabetes care value market share
Novo Nordisk has a strong leadership position within the growing diabetes care market
Source: IQVIA (formerly IMS) MAT Nov, 2017 value figures
Investor Presentation Full year 2017
Nov 2007
Nov 2017
27%
GSK
Merck Eli Lilly Sanofi
Takeda
Novo Nordisk
AstraZeneca Novartis DKK billion
OAD Insulin GLP-1
Total market: CAGR1 15.1%
CAGR1 17%
Injectables: CAGR1 18.8%
CAGR1 10.9%
Nov 2007
Nov 2017
CAGR1 33.9%
J&J

Slide 30
5,05
4,10
3,50
4,72
11,82 11,82
0%
20%
40%
60%
80%
100%
0
40
80
120
160
200
0%
20%
40%
60%
80%
100%
0
40
80
120
160
200
Continued single digit volume growth within the insulin segments globally
1 CAGR for 5-year period. 2 Includes new-generation Insulin. tMU: Thousand mega units Note: Modern insulin (MI) penetration is of total segment, ie including animal and human insulin; Data is sensitive to changes in IQVIA data collection and reporting methodology Source: IQVIA (formerly IMS) MAT Nov, 2017 volume figures
Investor Presentation Full year 2017
Fast-acting insulin Long-acting insulin
tMU
Levemir® share Segment volume NovoRapid® market share Segment volume
NovoMix® market share Segment volume
tMU tMU
0%
20%
40%
60%
80%
100%
0
40
80
120
160
200
Nov 2012
Nov 2017
Nov 2012
Nov 2017
Nov 2012
Nov 2017
Premix insulin
CAGR1 volume: 5.8% MI penetration2: 82.5%
CAGR1 volume: 4.9% MI penetration: 77.9%
CAGR1 volume: 1.5% MI penetration: 46.4%
Tresiba® share

Slide 31
5,05
4,10
3,50
4,72
11,82 11,82
Return to growth
in Biopharm
NovoSeven® and Norditropin®
account for 84% of Biopharm sales1
‘Return to Growth’ strategy builds on organic, non-organic and organisational initiatives
Biopharm constitutes 17% of Novo Nordisk sales and a strategy has been defined to return to growth
Investor Presentation Full year 2017
0
1
2
3
4
5
6
7
Q4 2012
Q4 2017
DKK billion
Norditropin®
NovoSeven®
Other biopharmaceuticals
Other haemophilia products
Pursue licensing or acquisition of complementary assets or companies
Drive in-market brands beyond current plans and ensure successful pipeline launches
Strengthen the organisation to drive the Biopharm return to growth agenda
1 Reported sales for the full year 2017

Slide 32
5,05
4,10
3,50
4,72
11,82 11,82
Novo Nordisk Corporate Strategy
STRATEGIC PRIORITIES R&D PRIORITIES
Innovate to improve patient outcomes and drive growth
Strengthen leadership in DIABETES CARE
• Develop disruptive insulin and GLP-1 based products with distinct clinical and/or delivery advantages
• Develop novel mechanisms that reverse the course of diabetes, act as insulin sensitisers and improve hard clinical endpoints
Strengthen leadership in GROWTH DISORDERS
• Bring once-weekly growth hormone to market and expand indications
Pursue leadership in HAEMOPHILIA
• Pursue subcutaneous delivery of long-acting coagulation factors and bypassing agents
Expand into other SERIOUS CHRONIC DISEASES
• Enter NASH, CVD and CKD by leveraging GLP-1 and other internal assets as well as licensing external opportunities
Strengthen leadership in OBESITY CARE
• Develop new biologics combined with GLP-1 to achieve >15% weight loss
Novo Nordisk R&D strategy and priorities
Investor Presentation Full year 2017
CKD: Chronic kidney disease; CVD: Cardiovascular disease; NASH: Non-alcoholic steatohepatitis

Slide 33
5,05
4,10
3,50
4,72
11,82 11,82
NovoEight®
NovoSeven®
NovoThirteen®
Norditropin®
Significant growth opportunities fuelled by strong pipeline across all four strategic focus areas
1 Study conducted in adult growth hormone disorder 2 Rebinyn® is the brand name in the US and Refixia® in the EU QW: Once-weekly; GG: Glucagon GLP-1; Sc: Subcutaneous; QD: Once daily; GH: Growth hormone
Investor Presentation Full year 2017
Saxenda®
Semaglutide – QW GLP-1 Oral semaglutide
PHASE 1 PHASE 2 PHASE 3 APPROVED
NovoRapid®
NovoMix®
Victoza®
Levemir®
Somapacitan – QW GH1
N8-GP – Long-acting rFVIII
Tresiba®
Ryzodeg®
Diabetes Obesity Haemophilia Growth disorders
Xultophy®
SUBMITTED
Semaglutide obesity
Semaglutide NASH
Anti-IL-21 and liraglutide NN1436 – LAI287
Concizumab NN9030 – G530L
NN9838 – Amylin analogue
NN9747 – PYY analogue
NN1406 – PI406
NN9277 – GG-co-agonist
Fiasp®
NN9499 – FGF21 obesity
NN7170 – Sc N8-GP
NN9423 – Tri-agonist 1706
Rebinyn®/Refixia®2
Other serious chronic diseases
Slide 34
5,05
4,10
3,50
4,72
11,82 11,82
FTEs in sales regions1
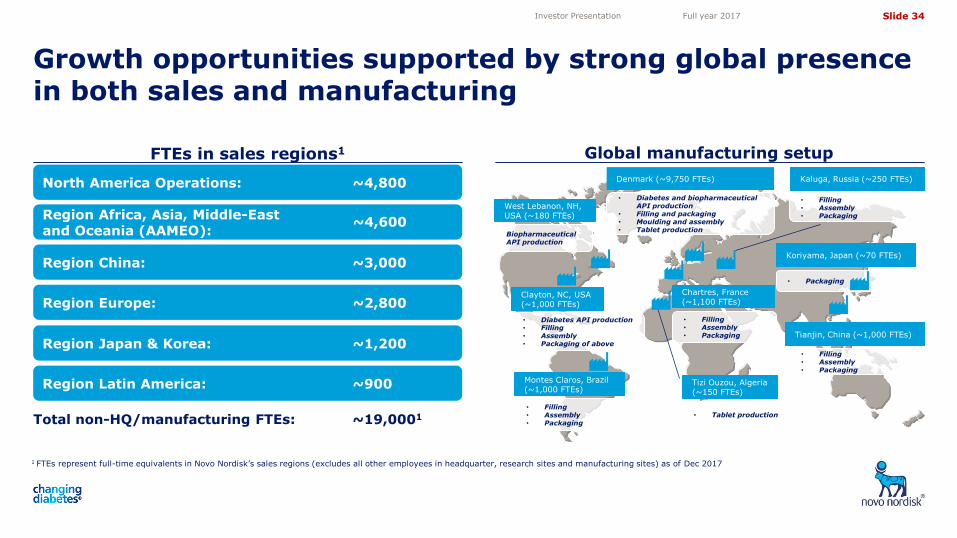
Growth opportunities supported by strong global presence in both sales and manufacturing
1 FTEs represent full-time equivalents in Novo Nordisk’s sales regions (excludes all other employees in headquarter, research sites and manufacturing sites) as of Dec 2017
Investor Presentation Full year 2017
Region Japan & Korea: ~1,200
Region China: ~3,000
Region Africa, Asia, Middle-East and Oceania (AAMEO):
North America Operations: ~4,800
Region Europe: ~2,800
Total non-HQ/manufacturing FTEs: ~19,0001
West Lebanon, NH, USA (~180 FTEs)
Biopharmaceutical API production
• Diabetes API production • Filling • Assembly • Packaging of above
Clayton, NC, USA (~1,000 FTEs)
Montes Claros, Brazil (~1,000 FTEs)
• Filling • Assembly • Packaging
Denmark (~9,750 FTEs)
• Filling • Assembly • Packaging
Chartres, France (~1,100 FTEs)
• Filling • Assembly • Packaging
Kaluga, Russia (~250 FTEs)
• Packaging
• Filling • Assembly • Packaging
Tianjin, China (~1,000 FTEs)
Koriyama, Japan (~70 FTEs)
• Diabetes and biopharmaceutical API production
• Filling and packaging • Moulding and assembly • Tablet production
Global manufacturing setup
Region Latin America: ~900
~4,600
Tizi Ouzou, Algeria (~150 FTEs)
• Tablet production

Slide 35
5,05
4,10
3,50
4,72
11,82 11,82
Novo Nordisk’s position is protected by patents and value chain setup Barriers to entry for biosimilar players
Solid patent protection of innovative drugs
1 List does not include all marketed products. 2 Assuming paediatric extension. 3 Protected by patents on the individual compounds insulin degludec and liraglutide as listed. 4 Expired in 2015. 5 Expired in 2017. Note: Saxenda patent identical to the Victoza® patent.
PK: Pharmacokinetic, PD: Pharmacodynamic; CAPEX: Capital expenditure
Investor Presentation Full year 2017
Manufacturing
US patent protection1
20192
Expired5
Expired5
20235
Expired5
20292
20292
202932
20302
• Large and fragmented target audience
• Cost pressure from payers
• On-going conversion to next generation drugs and slow market dynamics
Commercialisation
• Economies of scale for incumbents
• Up-front CAPEX requirements with slow return on investment
Manufacturing
• Need to show comparability in PK/PD trials
• Strict regulatory requirements in EU and the US
• Requirement for both drug and device offering
Research & Development
20182
Expired4
Expired5
20235
Expired5
2028
20282
202932
20302
EU patent protection1
203222 20312

Slide 36
5,05
4,10
3,50
4,72
11,82 11,82
• Expected to decline with approximately 1-3%-points over the next 3-4 years
• Lower realised prices and new product launches expected to negatively impact gross margin partly offset by product mix and manufacturing efficiency
Expected future sales drivers Expected future cost drivers
Key assumptions supporting the long-term financial target of an average of 5% operating profit growth1
Insulin
• Continued underlying 3-4% volume growth of the global insulin market
• Market share gains and value upgrades driven by the new-generation franchise
Investor Presentation Full year 2017
Obesity
• Continued expansion of the obesity market with Saxenda® in the US
• Successful launches in new markets
Biopharm
• Limited growth of the biopharm franchise mainly due to increased competition in the haemophilia space
• Potential for bolt-on activity to support growth
GM
S&D
R&D
Admin
• To be streamlined leading to savings of 1-2%-points over the next 3-4 years
• Continued focus on administration costs leading to savings and an administration cost to sales ratio approaching 3%
• Expected to remain unchanged around 13%, but flexible should external opportunities arise
• Refocused research efforts free up resources for investment in other serious chronic disease areas
Note: Guidance provided at the Capital Markets Day, 21 November, 2017 GM: Gross margin; S&D: Sales and distribution cost
GLP-1
• Continued expansion of the GLP-1 market with underlying volume growth of >10% annually
• Solid market leadership with Victoza® and Ozempic®
1 New long term financial target established in connection with the Q3 2016 report. The target of 5% operating profit growth is an average for the period of 4-5 years, with 2015 as the base year.

Slide 37
5,05
4,10
3,50
4,72
11,82 11,82
Diabetes
CARLA PRISCO, Brazil Carla Prisco has type 1 diabetes
Full year 2017

Slide 38
5,05
4,10
3,50
4,72
11,82 11,82
Diabetes is a chronic disease that occurs either when the pancreas does not produce enough insulin or when the body cannot effectively use the insulin produced by the pancreas
Primary classifications:
Type 1 diabetes: Complete insulin deficiency due to destruction of beta-cells in the pancreas
Type 2 diabetes: Characterised by some degree of insulin resistance and insulin deficiency
Insulin:
• Facilitates uptake of blood sugar into cells
• Inhibits glucose release from the liver
Facts about diabetes The aim of insulin therapy is to recreate normal
blood insulin profile
Investor Presentation Full year 2017
Liver Pancreas
Muscle
Fat cell
6:00
0
10
20
30
40
50
60
70
10:00 14:00 18:00
Insulin (
µ U
/ m
L )
22:00 2:00 6:00
Short-lived, rapidly generated meal-related peaks (prandial)
Sustained Insulin profile (basal)
Time of day
Breakfast Lunch Dinner
Diabetes – the inability to manage blood sugar levels appropriately
Slide 39
5,05
4,10
3,50
4,72
11,82 11,82
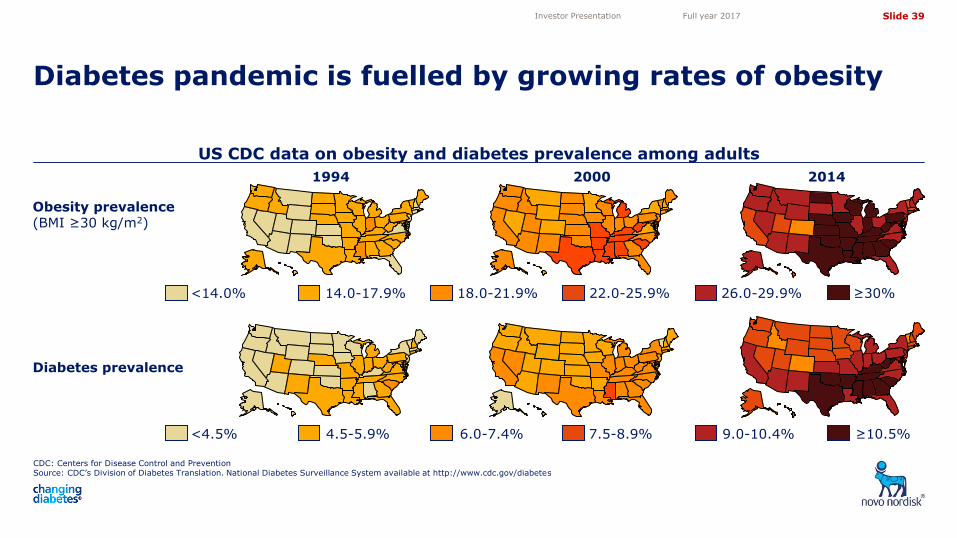
<4.5% 4.5-5.9% 6.0-7.4% 7.5-8.9% 9.0-10.4% ≥10.5%
US CDC data on obesity and diabetes prevalence among adults
CDC: Centers for Disease Control and Prevention Source: CDC’s Division of Diabetes Translation. National Diabetes Surveillance System available at http://www.cdc.gov/diabetes
Diabetes pandemic is fuelled by growing rates of obesity
Investor Presentation Full year 2017
Obesity prevalence (BMI ≥30 kg/m2)
Diabetes prevalence
1994 2000 2014
<14.0% 14.0-17.9% 18.0-21.9% 22.0-25.9% 26.0-29.9% ≥30%
Slide 40
5,05
4,10
3,50
4,72
11,82 11,82
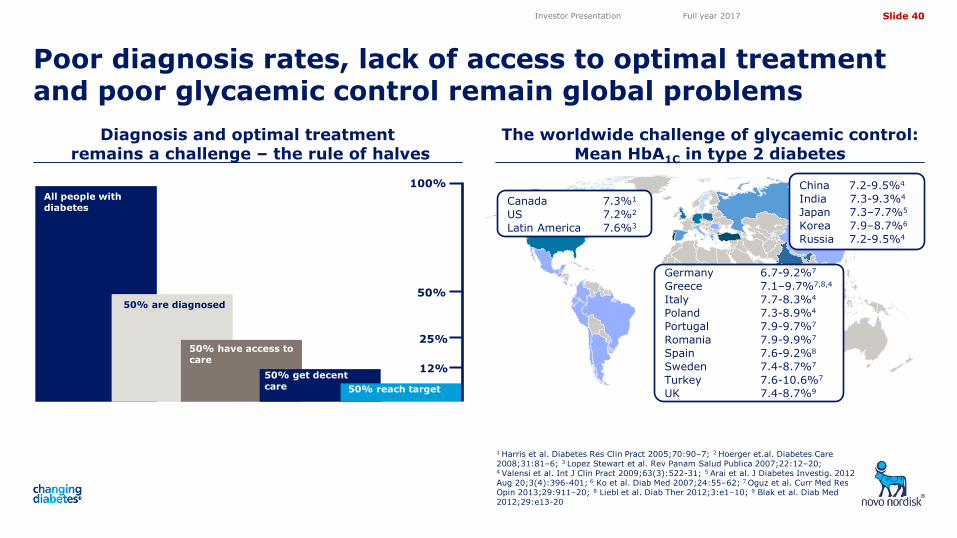
Diagnosis and optimal treatment remains a challenge – the rule of halves
The worldwide challenge of glycaemic control: Mean HbA1C in type 2 diabetes
Poor diagnosis rates, lack of access to optimal treatment and poor glycaemic control remain global problems
1 Harris et al. Diabetes Res Clin Pract 2005;70:90–7; 2 Hoerger et.al. Diabetes Care 2008;31:81–6; 3 Lopez Stewart et al. Rev Panam Salud Publica 2007;22:12–20; 4 Valensi et al. Int J Clin Pract 2009;63(3):522-31; 5 Arai et al. J Diabetes Investig. 2012 Aug 20;3(4):396-401; 6 Ko et al. Diab Med 2007;24:55–62; 7 Oguz et al. Curr Med Res Opin 2013;29:911–20; 8 Liebl et al. Diab Ther 2012;3:e1–10; 9 Blak et al. Diab Med 2012;29:e13-20
Investor Presentation Full year 2017
50% reach target 50% reach target
All people with diabetes
50% are diagnosed
50% have access to care
50% get decent care
100%
50%
25%
12%
Canada 7.3%1
US 7.2%2
Latin America 7.6%3
China 7.2-9.5%4
India 7.3-9.3%4
Japan 7.3–7.7%5
Korea 7.9–8.7%6
Russia 7.2-9.5%4
Germany 6.7-9.2%7
Greece 7.1–9.7%7,8,4
Italy 7.7-8.3%4
Poland 7.3-8.9%4
Portugal 7.9-9.7%7
Romania 7.9-9.9%7
Spain 7.6-9.2%8
Sweden 7.4-8.7%7
Turkey 7.6-10.6%7
UK 7.4-8.7%9

Slide 41
5,05
4,10
3,50
4,72
11,82 11,82
Progression of type 2 diabetes and treatment intensification
Distribution of patients and value across treatment classes
Insulin is the ultimate care for people with diabetes
OAD: Oral anti-diabetic Note: Patient distribution across treatment classes is indicative and based on data for US, UK, Germany and France. Value figures based on IQVIA (formerly IMS) MAT Nov, 2017 Source: IQVIA (formerly IMS) PharMetrix claims data, IQVIA (formerly IMS) disease analyser, IQVIA (formerly IMS) MIDAS
Investor Presentation Full year 2017
-c
ell f
un
cti
on
Time
Diet and exercise
OAD
GLP-1
Insulin
OAD GLP-1 Insulin
Patients Value
28%
51% 4%
12%
68%
37%
0%
20%
40%
60%
80%
100%

Slide 42
5,05
4,10
3,50
4,72
11,82 11,82
0
100
200
300
400
500
Insulin action profiles Global insulin volume market by segment
The insulin market is comprised of three segments
1 CAGR for 5-year period. Value in DKK Source: IQVIA (formerly IMS) monthly MAT volume and value Nov 2017(DKK) figures
Investor Presentation Full year 2017
Time of day
6:00 10:00 14:00 18:00 22:00 2:00 6:00
Breakfast Lunch Dinner
Long-acting
Premix
Fast-acting
CAGR volume1: 4.4% CAGR value1: 16.8%
37%
29%
34%
35%
26%
40%
Nov 2012
Fast-acting
Premix
Long-acting
tMU
Nov 2017

Slide 43
5,05
4,10
3,50
4,72
11,82 11,82
Commonly prescribed product classes for the treatment of type 2 diabetes
Class HbA1C
change Hypoglycae-
mia risk
Weight
change CVD risk
Dosing
(pr. day)
Contraindication/ undesired effects
Metformin 1.5 No Neutral Minimal 2 OADs Kidney, liver
Sulfonylurea 1.5 Yes Gain None 1 OAD Essentially none
TZDs 0.5 - 1.4 No Gain Varies 1 OAD CHF, liver
DPP-IV inhibitors 0.6 - 0.8 No Neutral TBD 1-2 OADs None
SGLT-2 inhibitors 0.5 - 0.9 No Loss Varies 1 OAD Genital infections, urinary
tract infections
GLP-1 1.0 - 2.0 No Loss Varies Varies GI side effects, MTC
Long-acting insulin 1.5 - 2.5 Yes Gain TG and HDL 1 injection Hypoglycaemia
Fast-acting insulin 1.5 - 2.5 Yes Gain TG and HDL 1-4 injections Hypoglycaemia
Note: TG and HDL: Beneficial effect on triglycerides and high-density lipoprotein cholesterol; CHF: Congestive heart failure; GI: Gastro intestinal; MTC: Medullary thyroid cancer; TZD: thiazolidinediones; OAD: Oral anti-diabetic; TBD: to be defined. Sources: Adapted from: Nathan DM, et al. Diabetes Care. 2006; 29:1963-1972; Nathan DM, et al. Diabetes Care. 2007;30:753-759; Nathan DM, et al. Diabetes Care. 2008;31:173-175. ADA. Diabetes Care. 2008;31:S12-S54. WelChol PI. 1/2008.
Medications used for the treatment of type 2 diabetes
Investor Presentation Full year 2017

Slide 44
5,05
4,10
3,50
4,72
11,82 11,82
Overview of current and future products in Novo Nordisk’s diabetes portfolio
1 Pending clinical development programmes and regulatory processes for oral semaglutide and semaglutide
Novo Nordisk current and future product portfolio covers the type 2 diabetes treatment cascade1
Investor Presentation Full year 2017
When basal insulin is not enough
Once-daily optimisation
When metformin is not enough
When it's time for insulin
Mealtime insulin control
Actrapid® Mixtard® 30 Insulatard®
or
First generation analogues
Second generation analogues
Human insulin
or
oral semaglutide

Slide 45
5,05
4,10
3,50
4,72
11,82 11,82
Novo Nordisk product portfolio includes three generations of insulin products
Commercial focus depends on market maturity and market access situation
Novo Nordisk holds a broad insulin portfolio with three generations of products covering the treatment cascade
Basal insulin
Bolus insulin
GLP & basal combination
Mix insulin
Human insulin
Modern insulin
New- generation insulin
Insulatard®
Levemir®
Mixtard® Actrapid®
NovoLog® NovoMix®
Tresiba® Ryzodeg® Xultophy® Fiasp® Differentiation
Commercial focus
Volume strategy
Value strategy
Familiarity
Affordability
New- generation insulin
Human insulin
Modern insulin
Investor Presentation Full year 2017

Slide 46
5,05
4,10
3,50
4,72
11,82 11,82
Region AAMEO
0%
5%
10%
15%
20%
25%
30%
0%
20%
40%
60%
80%
100%
Regional insulin volume growth
Reg: Region; J&K: Japan & Korea; AAMEO: Africa, Asia, Middle-East and Oceania; LATAM: Latin America Note: Data is sensitive to changes in IQVIA data collection and reporting methodology Source: IQVIA (formerly IMS) monthly MAT Nov, 2017 volume figures
Stable global insulin volume growth
Investor Presentation Full year 2017
Nov 2012
Nov 2017
Nov 2012
Nov 2017
34%
29%
Reg: Region; J&K: Japan & Korea; AAMEO: Africa, Asia, Middle-East and Oceania; LATAM: Latin America Note: Data is sensitive to changes in IQVIA data collection and reporting methodology Source: IQVIA (formerly IMS) monthly MAT Nov, 2017 volume figures
Regional insulin volume market split
World
North America Region AAMEO
Region China Region J&K
Region Europe
Region LATAM
North America
Region J&K Region China
Region Europe
Region LATAM
21%
10%
3%
3%
3%

Slide 47
5,05
4,10
3,50
4,72
11,82 11,82
0%
20%
40%
60%
80%
100%
0
100
200
300
400
500
Th
ou
san
ds
0%
20%
40%
60%
80%
100%
0
100
200
300
400
500
Thousands
0%
20%
40%
60%
80%
100%
0
100
200
300
400
500
Thousands
Novo Nordisk global volume market share across insulin classes
1 Includes animal insulin. 2 Annual value of total insulin class. tMU: Thousand mega units Note: Data is sensitive to changes in IQVIA data collection and reporting methodology Source: IQVIA (formerly IMS) monthly MAT Nov, 2017 value and volume figures
Maintaining global insulin leadership by sustaining modern and new-generation insulin market share
Investor Presentation Full year 2017
Nov 2012
Nov 2017
Nov 2012
Nov 2017
Nov 2012
Nov 2017
Novo Nordisk market share (%) volume
Human insulin1
Market value2: DKK 24 billion
Modern and new-generation insulin
Market value2: DKK 223 billion
Total insulin
Market value2: DKK 248 billion
tMU tMU tMU

Slide 48
5,05
4,10
3,50
4,72
11,82 11,82
0%
10%
20%
30%
40%
50%
60%
Global insulin market Global modern and new-generation insulin
volume market shares
Strong underlying insulin market growth and sustained global volume market share
1 MI: Modern insulin. NGI: New-generation insulin 2 CAGR for 5-year period Note: Data is sensitive to changes in IQVIA data collection and reporting methodology Source: IQVIA (formerly IMS) monthly MAT Nov, 2017 volume and value (DKK) figures
Note: Data is sensitive to changes in IQVIA data collection and reporting methodology, does not add up to 100% as only selected pharmaceutical companies are included Source: IQVIA (formerly IMS) monthly MAT Nov, 2017 volume figures
Investor Presentation Full year 2017
Nov 2017
Nov 2012
Nov 2017
Eli Lilly Novo Nordisk Sanofi
0%
20%
40%
60%
80%
100%
0
100
200
300
400
500
MI and NGI1
Human insulin
tMU Penetration
Device penetration Modern insulin penetration1
CAGR volume2: 4.4% CAGR value2: 16.8%
45%
34%
20%
Nov 2012

Slide 49
5,05
4,10
3,50
4,72
11,82 11,82
0%
20%
40%
60%
80%
100%
0
20
40
60
80
100
120
140
160
0%
10%
20%
30%
40%
50%
60%
USA insulin market by segment Modern insulin and new-generation insulin
volume market shares in the USA
Novo Nordisk is now the market leader in the USA within the modern and new-generation insulin segment
1 CAGR for 5-year period Source: IQVIA (formerly IMS) monthly MAT Nov, 2017 volume and value (DKK) figures
Source: IQVIA (formerly IMS) monthly MAT Nov, 2017 volume figures
Investor Presentation Full year 2017
Modern Insulin penetration Device penetration
Nov 2012
Nov 2017
Nov 2012
Nov 2017
Eli Lilly Novo Nordisk Sanofi tMU Penetration
CAGR volume1: 2.5% CAGR value1: 22.7%
36%
40%
24%
Fast-acting
Long-acting
Premix
Slide 50
5,05
4,10
3,50
4,72
11,82 11,82
Tresiba® share
0%
20%
40%
60%
80%
100%
0
10
20
30
40
50
60
70
80
0%
20%
40%
60%
80%
100%
0
10
20
30
40
50
60
70
80
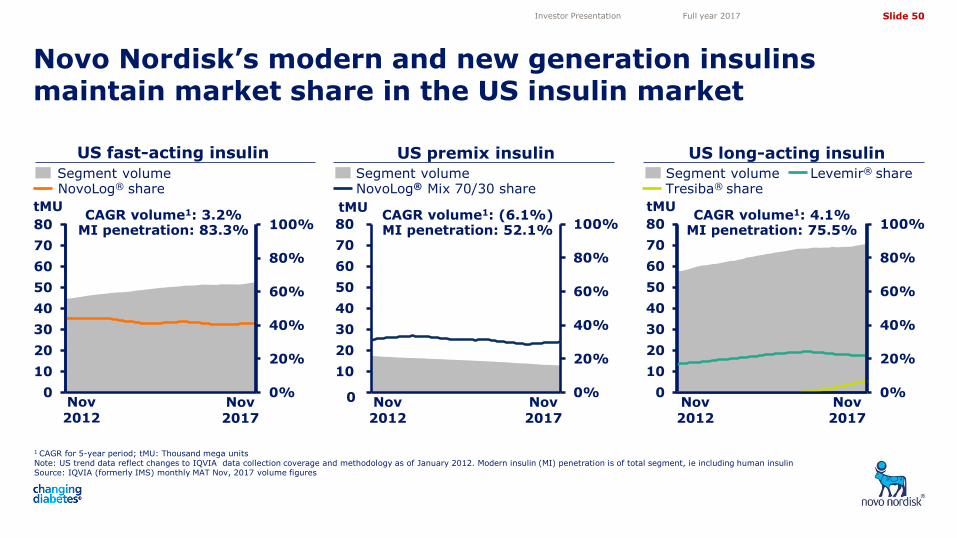
Novo Nordisk’s modern and new generation insulins maintain market share in the US insulin market
1 CAGR for 5-year period; tMU: Thousand mega units Note: US trend data reflect changes to IQVIA data collection coverage and methodology as of January 2012. Modern insulin (MI) penetration is of total segment, ie including human insulin Source: IQVIA (formerly IMS) monthly MAT Nov, 2017 volume figures
Investor Presentation Full year 2017
US long-acting insulin
tMU
Levemir® share Segment volume
CAGR volume1: 4.1% MI penetration: 75.5%
Nov 2012
Nov 2017
0%
20%
40%
60%
80%
100%
-
10
20
30
40
50
60
70
80
0
US fast-acting insulin
NovoLog® share Segment volume
NovoLog® Mix 70/30 share Segment volume
tMU tMU
US premix insulin
CAGR volume1: 3.2% MI penetration: 83.3%
CAGR volume1: (6.1%) MI penetration: 52.1%
Nov 2012
Nov 2017
Nov 2017
Nov 2012
Slide 51
5,05
4,10
3,50
4,72
11,82 11,82
31%
30%
23%
8% 3%
2%
3%
45% 44%
18% 18%
23% 22%
9% 8%
0%
20%
40%
60%
80%
100%
All other PBMs
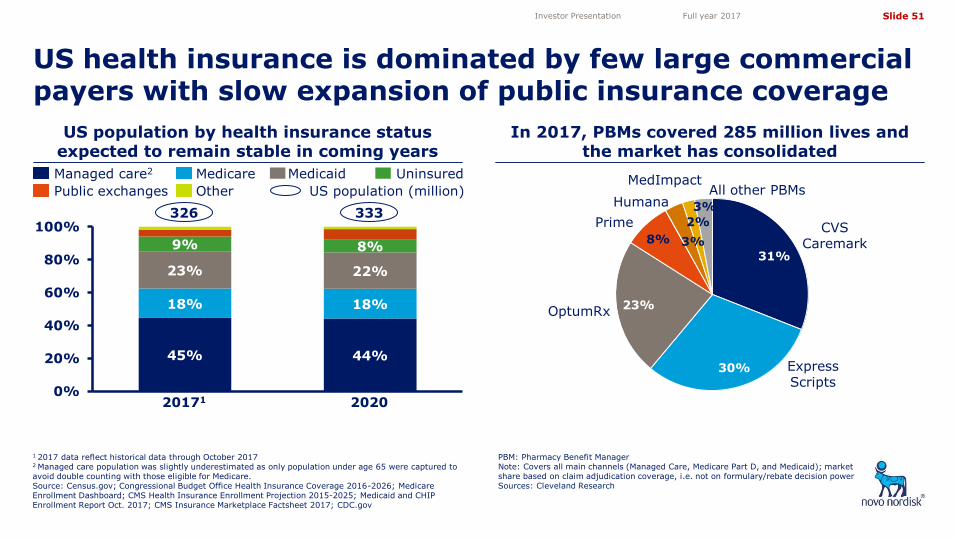
US population by health insurance status expected to remain stable in coming years
In 2017, PBMs covered 285 million lives and the market has consolidated
US health insurance is dominated by few large commercial payers with slow expansion of public insurance coverage
1 2017 data reflect historical data through October 2017 2 Managed care population was slightly underestimated as only population under age 65 were captured to avoid double counting with those eligible for Medicare. Source: Census.gov; Congressional Budget Office Health Insurance Coverage 2016-2026; Medicare Enrollment Dashboard; CMS Health Insurance Enrollment Projection 2015-2025; Medicaid and CHIP Enrollment Report Oct. 2017; CMS Insurance Marketplace Factsheet 2017; CDC.gov
Investor Presentation Full year 2017
PBM: Pharmacy Benefit Manager Note: Covers all main channels (Managed Care, Medicare Part D, and Medicaid); market share based on claim adjudication coverage, i.e. not on formulary/rebate decision power Sources: Cleveland Research
Express Scripts
CVS Caremark
OptumRx
Prime
Humana 326 333
US population (million)
Medicaid Managed care2 Medicare Uninsured
Public exchanges Other
20171 2020
MedImpact

Slide 52
5,05
4,10
3,50
4,72
11,82 11,82
0%
20%
40%
60%
80%
100%
0%
20%
40%
60%
80%
Value market shares of key Novo Nordisk products in the USA
% share of unrestricted market access of key Novo Nordisk products in the USA
Value market share
Unrestricted Market access
Key Novo Nordisk diabetes care products remain broadly available in the USA
Source: IQVIA NSP Nov 2017; Note: Market shares: NovoLog®: share of rapid acting insulin segment; Levemir®: share of basal insulin segment; Tresiba® share of basal insulin segment; Victoza®: share of GLP-1 segment
Nov 2014
Nov 2017
Aug 2014
Nov 2017
Source: FingerTip Formulary bridge, Nov 2017 Nomenclature and Xponent PlanTrak, Dec 2017; only considers bridged volume; excludes cash and mail order data; Note: Unrestricted access excludes prior authorisation, step edits and other restrictions Levemir® access based on FlexTouch® Pen; NovoLog® access based on FlexPen®; only considers bridged volume; Tresiba® launched in January 2016
Victoza® NovoLog® Levemir®
Tresiba®
Investor Presentation Full year 2017
Victoza® NovoLog® Levemir®
Tresiba®

Slide 53
5,05
4,10
3,50
4,72
11,82 11,82
0%
10%
20%
30%
40%
50%
60%
0%
20%
40%
60%
80%
100%
0
20
40
60
80
100
120
140
160
180
European modern insulin and new-generation insulin volume market shares
Sustained leadership position in the European modern and new-generation insulin market
Investor Presentation Full year 2017
1 CAGR for 5-year period 2 MI: Modern insulin; NGI: New-generation insulin Source: IQVIA (formerly IMS) monthly MAT Nov, 2017 volume and value (DKK) figures
MI and NGI penetration Device penetration
Nov 2012
Nov 2017
Eli Lilly Novo Nordisk Sanofi tMU Penetration
44%
36%
19%
Source: IQVIA (formerly IMS) monthly MAT Nov, 2017 volume figures, numbers do not add up to 100% due to smaller insulin manufacturers
Nov 2017
Nov 2012
European insulin market by segment
CAGR volume1:
CAGR value1:
2.1%
2.4%
Fast-acting
Long-acting
Premix

Slide 54
5,05
4,10
3,50
4,72
11,82 11,82
0%
10%
20%
30%
40%
50%
60%
70%
0%
20%
40%
60%
80%
100%
0
20
40
60
80
100
120
Region AAMEO insulin market by segment Region AAMEO modern and new-generation
insulin volume market shares
Stable insulin leadership position in Region AAMEO comprising Africa, Asia, Middle-East and Oceania
1 CAGR for 5-year period. Note: IQVIA only covers the following 8 markets in AAMEO (retail data): Algeria, Egypt, India, New Zealand, Russia, Saudi Arabia, South Africa & Turkey, which together account for 82% of Novo Nordisk insulin sales in AAMEO Source: IQVIA (formerly IMS) monthly MAT Nov, 2017 volume and value (DKK) figures MI: Modern insulin; NGI: New-generation insulin
Source: IQVIA (formerly IMS) monthly MAT Nov, 2017 volume figures, numbers do not add up to 100% due to smaller insulin manufacturers
Investor Presentation Full year 2017
tMU
Biocon
55%
14%
21%
Nov 2012
3%
Sanofi Novo Nordisk
Fast-acting
Long-acting
Premix
Nov 2017
Eli Lilly
Nov 2017
Nov 2012
MI and NGI penetration Device penetration Penetration
8.3%
5.4%
CAGR volume1:
CAGR value1:

Slide 55
5,05
4,10
3,50
4,72
11,82 11,82
0%
10%
20%
30%
40%
50%
60%
70%
0%
20%
40%
60%
80%
100%
0
2
4
6
8
10
12
14
16
Japan & Korea insulin market by segment Japan & Korea modern and new-generation
insulin volume market shares
Solid insulin market leadership position in Region Japan & Korea
1 CAGR for 5-year period MI: Modern insulin; NGI: New-generation insulin Source: IQVIA (formerly IMS) monthly MAT Nov, 2017 volume and value (DKK) figures
Source: IQVIA (formerly IMS) monthly MAT Nov, 2017 volume figures
Investor Presentation Full year 2017
tMU
Fast-acting
Long-acting
Premix
50%
25%
25%
Nov 2012
Nov 2017
Nov 2017
Nov 2012
Penetration MI and NGI penetration Device penetration Eli Lilly Novo Nordisk Sanofi
CAGR volume1:
CAGR value1:
0.5%
(4.4%)

Slide 56
5,05
4,10
3,50
4,72
11,82 11,82
0%
10%
20%
30%
40%
50%
60%
70%
6% 13%
0%
20%
40%
60%
80%
16%
Japanese basal value market shares Japanese total insulin value market shares
Solid Tresiba® performance strengthens basal insulin market share in Japan
Source: IQVIA (formerly IMS) monthly MAT Nov, 2017 value figures Source: IQVIA (formerly IMS) monthly MAT Nov, 2017 value figures
Investor Presentation Full year 2017
Nov 2014
Eli Lilly Novo Nordisk Sanofi
Nov 2017
59%
23%
18%
Nov 2014
Nov 2017
NN Total Basal
Levemir®
NPH biosimilar glargine U100
50%
18%
42%
3%
glargine U100 Tresiba® glargine U300

Slide 57
5,05
4,10
3,50
4,72
11,82 11,82
10%
0%
10%
20%
30%
40%
50%
60%
70%
0%
20%
40%
60%
80%
100%
0
5
10
15
20
25
30
35
40
45
50
55
Chinese insulin market by segment Chinese insulin volume market shares
Solid volume growth in the Chinese insulin market
1 CAGR for 5-year period Note: IQVIA covers around 50% of the total Chinese market (hospital data) Source: IQVIA (formerly IMS) monthly MAT Nov, 2017 volume and value (DKK) figures
Note: Only selected competitors shown Source: IQVIA (formerly IMS) monthly MAT Nov, 2017 volume figures, numbers do not add up to 100% due to smaller insulin manufacturers not included
Investor Presentation Full year 2017
tMU Penetration CAGR volume1: 10.7%
CAGR value1: 14.7%
Long-acting
Premix
Eli Lilly Novo Nordisk
Sanofi
Tonghua Dongbao
53%
7%
12%
6% Nov 2012
Nov 2017
Nov 2017
Nov 2012
Gan & Lee
Modern insulin penetration Device penetration
Fast-acting
12%
Other

Slide 58
5,05
4,10
3,50
4,72
11,82 11,82
0%
20%
40%
60%
80%
100%
0.0
0.0
0.0
0.1
0.1
0.1
0%
10%
20%
30%
40%
50%
60%
70%
Chinese insulin market by segment Chinese total insulin value market shares
Continued value growth in the Chinese long-acting insulin segment
Investor Presentation Full year 2017
bDKK
50%
17%
11% 6%
Nov 2012
Nov 2017
Nov 2017
Nov 2012
1 CAGR for 5-year period Note: IMS covers around 50% of the total Chinese market (hospital data) Source: IQVIA (formerly IMS) Rolling MAT Nov, 2017 value (DKK) figures
Note: Only selected competitors Source: IQVIA (formerly IMS) Rolling MAT Nov, 2017 value figures, numbers do not add up to 100% due to smaller insulin manufacturers not included
Long-acting
Premix
12%
CAGR value1: 14.7%
Modern insulin penetration Device penetration
Penetration
Fast-acting
4%
Eli Lilly Novo Nordisk
Sanofi
Tonghua Dongbao
Gan & Lee Other

Slide 59
5,05
4,10
3,50
4,72
11,82 11,82
Eli Lilly
0%
10%
20%
30%
40%
50%
60%
70%
0%
20%
40%
60%
0
3
6
9
12
15
Latin America insulin market by segment Latin America modern and new-generation
insulin volume shares
Strengthened insulin volume market share in Region Latin America
1 CAGR for 5-year period Note: IMS only covers the following 4 markets in Latin America (retail data): Argentina, Brazil, Colombia, Mexico Source: IQVIA (formerly IMS) monthly MAT data Nov, 2017 volume and value (DKK) figures MI: Modern insulin; NGI: New-generation insulin
Note: Only top-3 shown Source: IQVIA (formerly IMS) monthly MAT data Nov, 2017 volume figures, numbers do not add up to 100% due to smaller insulin manufacturers not included MI: Modern insulin; NGI: New-generation insulin
Investor Presentation Full year 2017
tMU Penetration
Fast-acting
Long-acting
Premix 42%
31%
15%
Nov 2012
Nov 2017
Nov 2017
Nov 2012
Novo Nordisk Sanofi Modern insulin penetration Device penetration
CAGR volume1: 12.4% CAGR value1: 10.7%

Slide 60
5,05
4,10
3,50
4,72
11,82 11,82
Patients Study Hazard ratio
[95% CI]
T1D
BEGIN 1.12 [0.68; 1.86]
SWITCH 1 0.65 [0.48; 0.89]*
0.74 [0.61; 0.90]*
T2D
BEGIN 0.81 [0.42; 1.56]
SWITCH 2 0.54 [0.21; 1.42]
0.49 [0.26; 0.94]*
DEVOTE 0.60 [0.48; 0.76]*
0.00781250.0156250.031250.06250.125 0.25 0.5 1 2 4
1 P. D. Home, A. Fritsche, S. Schinzel & M. Massi-Benedetti, Diabetes, Obesity and Metabolism 12: 772–779, 2010
2 DEVOTE, American Diabetes Association 77th Scientific Sessions, 3-CT-SY22, June 12 2017 IGlar U100: Insulin glargine U100
Tresiba® is a leap on the innovation ladder by further reducing nocturnal hypoglycaemia
Tresiba® has consistently demonstrated relevant reductions in severe hypoglycaemia
Tresiba® sets a new standard for basal insulin initiation by lowering the risk of hypoglycaemia
Half life: 25 hours
Variability: Low
New-generation insulin
Human insulin
Half life: 5-10 hours
Variability: High
53% reduction in nocturnal
hypoglycaemia2
50% reduction in nocturnal
hypoglycaemia1
Half life: 12-19 hours
Variability: Medium
Modern insulin
* Statistically significant difference Note: Phase 3a BEGIN: Severe=third-party assistance; Phase 3b SWITCH: severe=third-party assistance and adjudicated; Phase 3b DEVOTE: severe=third-party assistance. T1D: Type 1 diabetes; T2D: Type 2 diabetes; CI: Confidence interval Source: Ratner et al. Diabetes Obes Metab 2013; Lane et al. Diabetologia 2016;59; Wysham et al. Diabetologia 2016; DEVOTE, American Diabetes Association 77th Scientific Sessions, 3-CT-SY22, June 12 2017
Favours Tresiba®
2 1 0.5 0.25 0.125 Maintenance period
Full treatment period
IGlar U100
Tresiba®
Insulatard®
Favours comparator
Investor Presentation Full year 2017

Slide 61
5,05
4,10
3,50
4,72
11,82 11,82
Tresiba® label characteristics in triad markets
1 Observed in majority of the trials
Competitive Tresiba® label across all three triad markets
Investor Presentation Full year 2017
US Europe Japan
Efficacy
• Non-inferior HbA1c reduction
• Numerically greater FPG reduction
• Numerically lower insulin dose1
• Non-inferior HbA1c reduction
• Numerically greater FPG reduction
• Non-inferior HbA1c reduction
• Numerically greater FPG reduction
Profile • Half-life of 25 hours and duration of
action of at least 42 hours
• Day to day variability of 20%
• Duration of action beyond 42 hours • Four times lower day-to-day
variability vs insulin glargine
• Duration of action up to 26 hours in Japanese patients
• Four times lower day-to-day variability vs insulin glargine
Safety
• Overall safety consistent with insulin
• Lower rate of overall and nocturnal hypoglycaemia
• Overall safety consistent with insulin
• Lower rate of nocturnal hypoglycaemia in Asian subjects
Convenience • Injection any time of day
• Up to 80 and 160 units per injection
• Adjusting injection time when needed
• Up to 80 and 160 units per injection
• In case of missed dose take as soon as possible
• Overall safety consistent with insulin
• Hypoglycaemia rates for Tresiba®, but not comparator

Slide 62
5,05
4,10
3,50
4,72
11,82 11,82
GLP-1 mechanism of action when blood sugar levels increase
GLP-1 lowers blood glucose in patients with type 2 diabetes
GLP-1 effect dependent on level of blood glucose
Source: Rachman et al. Diabetologia 1997;40:205–11
Investor Presentation Full year 2017
• Increases insulin secretion in the pancreas
• Reduces glucagon secretion in the liver
• Slows gastric emptying in the gut
• Creates sense of satiety in the brain
Glucose (mmol/L)
12
8
6
0
22.00 02.00 06.00 10.00 14.00
10
4
14
16
Time
2 Breakfast Lunch Snack
18.00
18
Type 2 diabetes patients, no GLP-1
Healthy controls receiving saline
Type 2 diabetes patients, with GLP-1
Pancreas
Liver
Brain
Gut

Slide 63
5,05
4,10
3,50
4,72
11,82 11,82
0%
2%
4%
6%
8%
10%
0
10
20
30
40
50
60
70
other
0%
5%
10%
15%
11%
3%
GLP-1 value in bDKK
Share of total diabetes care
market
GLP-1 value and patient share of the total diabetes care market
The GLP-1 segment accounts for 12% of the global diabetes care market value
Investor Presentation Full year 2017
Global GLP-1 market
exenatide GLP-1 value share of total diabetes
GLP-1 patient share1 of total diabetes
Victoza® dulaglutide Share of total diabetes care market
Reg: Region; AAMEO: Africa, Asia, Middle-East and Oceania; J&K: Japan & Korea; LATAM: Latin America. 1 Patient share is indicative and based on data for US, UK, Germany and France only. Source: Value data; IQVIA (formerly IMS) monthly MAT Nov, 2017. Patient data; IQVIA Disease Analyser (DE, FR, UK), QuintilesIQVIA LRx (USA), Aug 2017
Reg AAMEO
Reg J&K
Reg LATAM
Reg China
5%
World North America
Reg EU
1 CAGR for 5-year period Source: IQVIA (formerly IMS) monthly MAT Nov, 2017 value figures (DKK)
CAGR value1: 33.0%
Nov 2012
Nov 2017
12%
14%
6% 5%
5%
1%

Slide 64
5,05
4,10
3,50
4,72
11,82 11,82
0%
10%
20%
30%
40%
50%
60%
70%
Region Europe
Regional GLP-1 volume growth
J&K: Japan & Korea; AAMEO: Africa, Asia, the Middle East and Oceania; LATAM: Latin America Note: Data is sensitive to changes in IMS data collection and reporting methodology
Source: IQVIA (formerly IMS) monthly MAT Nov, 2017 volume figures
Strong GLP-1 volume growth in all regions
Investor Presentation Full year 2017
0%
20%
40%
60%
80%
100%
Nov 2014
Nov 2017
Nov 2014
Nov 2017
4%
7%
46%
J&K: Japan & Korea; AAMEO: Africa, Asia, the Middle East and Oceania; LATAM: Latin America Note: Data is sensitive to changes in IMS data collection and reporting methodology Source: IQVIA (formerly IMS) monthly MAT Nov, 2017 volume figures
Regional GLP-1 volume market split
39%
3% Region China
Region Europe North America Region AAMEO
Region J&K Region LATAM World
North America Region AAMEO
Region China Region J&K Region LATAM
22%
1%

Slide 65
5,05
4,10
3,50
4,72
11,82 11,82
0%
20%
40%
60%
80%
100%12% 12%
0%
20%
40%
60%
80%
100%
SGLT-2 Victoza® Other GLP-1
Share of segment value growth Segment value market shares
0
50
100
150
200
250
1 CAGR for 5-year period Note: Segment only includes DPP-IV, GLP-1 & SGLT-2. Other oral anti-diabetic agents and insulin excluded Source: IQVIA (formerly IMS) MAT Nov, 2017 value figures
Victoza® maintains a 14% value market share in the GLP-1, SGLT-2 and DPP-IV segment
Investor Presentation Full year 2017
DKK billion
Nov 2012
Nov 2017
Nov 2012
Nov 2017
CAGR1 value: 26.1%
Victoza®: 14%
2016 vs 2017
2015 vs 2016
Segment value
DPP-IV

Slide 66
5,05
4,10
3,50
4,72
11,82 11,82
5%
51%
9%
29%
5%
Treatment naïve
OAD
GLP-1
Insulin
Insulin and GLP-1
GLP-1 source of business (new-to-brand prescription market share)
Share of patients on OADs achieving HbA1c below 7% in major European countries
GLP-1 patients primarily switch from OADs and untapped potential is large with many OAD patients not in control
Note: Data based on data from France, Germany and UK only Source: IQVIA (formerly IMS) Disease Analyser (France, Germany and UK), Sep 2017
Investor Presentation Full year 2017
57% 43%
HbA1c <7%
HbA1c >7%
Note: Data based on data from France, Germany, UK and USA only OAD: Oral anti-diabetic (includes but is not limited to DPP-IV, SGLT-2, metformin and sulfonylurea) Source: IQVIA (formerly IMS) Disease Analyser (France, Germany and UK) and IQVIA (formerly IMS) LRx (USA), Sep 2017
Slide 67
5,05
4,10
3,50
4,72
11,82 11,82
0
2
4
6
8
10
12
14
16
18
20
Region China
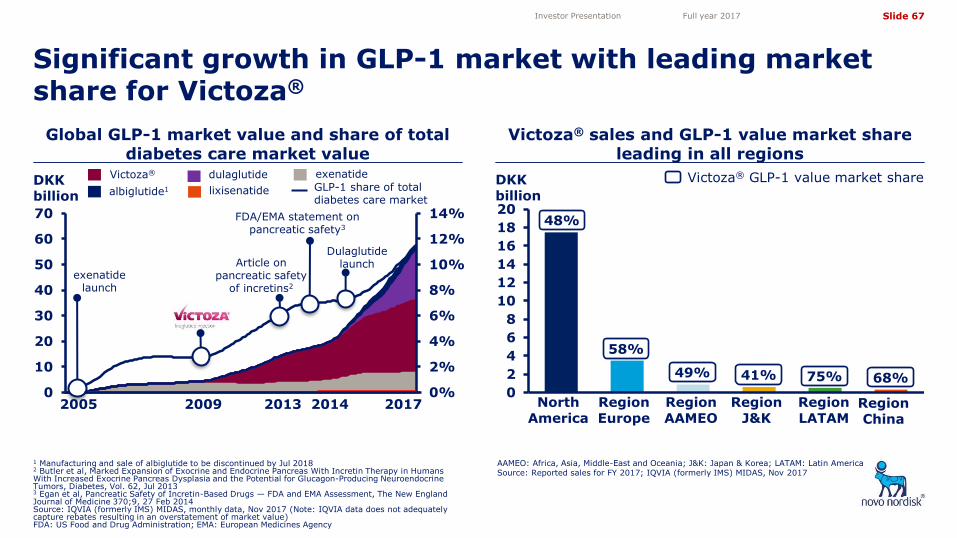
Global GLP-1 market value and share of total diabetes care market value
Victoza® sales and GLP-1 value market share leading in all regions
Significant growth in GLP-1 market with leading market share for Victoza®
Investor Presentation Full year 2017
0%
2%
4%
6%
8%
10%
12%
14%
0
10
20
30
40
50
60
70
albiglutide1
exenatide dulaglutide Victoza®
DKK billion
GLP-1 share of total diabetes care market
exenatide launch
Dulaglutide launch
2017
lixisenatide
2009
Article on pancreatic safety
of incretins2
2013 2014
FDA/EMA statement on pancreatic safety3
2005
1 Manufacturing and sale of albiglutide to be discontinued by Jul 2018 2 Butler et al, Marked Expansion of Exocrine and Endocrine Pancreas With Incretin Therapy in Humans With Increased Exocrine Pancreas Dysplasia and the Potential for Glucagon-Producing Neuroendocrine Tumors, Diabetes, Vol. 62, Jul 2013 3 Egan et al, Pancreatic Safety of Incretin-Based Drugs — FDA and EMA Assessment, The New England Journal of Medicine 370;9, 27 Feb 2014 Source: IQVIA (formerly IMS) MIDAS, monthly data, Nov 2017 (Note: IQVIA data does not adequately capture rebates resulting in an overstatement of market value) FDA: US Food and Drug Administration; EMA: European Medicines Agency
AAMEO: Africa, Asia, Middle-East and Oceania; J&K: Japan & Korea; LATAM: Latin America Source: Reported sales for FY 2017; IQVIA (formerly IMS) MIDAS, Nov 2017
Victoza® GLP-1 value market share
48%
58%
49% 41% 68%
North America
Region Europe
Region AAMEO
Region J&K
Region LATAM
75%
DKK billion

Slide 68
5,05
4,10
3,50
4,72
11,82 11,82
Victoza® patent expiry1
oral semaglutide
Promotional focus to shift from Victoza® towards Ozempic® as market access emerges
Aim for Ozempic® and oral semaglutide to replace Victoza® as market leaders
Ambition for Ozempic® to become leading weekly GLP-1, with daily GLP-1 use shifting to oral semaglutide
1 Victoza patent expiry expected in 2022/2023 in most markets
Investor Presentation Full year 2017
Co
mm
ercia
l fo
cu
s
Illustrative
Time
Prescrip
tio
n
vo
lum
e
Illustrative
Ozempic® market access

Slide 69
5,05
4,10
3,50
4,72
11,82 11,82
0%
2%
4%
6%
8%
10%
12%
14%
0
10
20
30
40
50
60
1 CAGR for 5-year period Source: IQVIA (formerly IMS) monthly MAT Nov, 2017 value figures (DKK)
North America GLP-1 market
The GLP-1 segment accounts for 14% of total diabetes care market value in North America
Investor Presentation Full year 2017
Nov 2017
Nov 2012
CAGR value1: 38.8%
Key observations for Victoza® in the US market
• Victoza® value market share within the GLP-1 segment is 48%
• Around 80% of commercial and around 90% of Medicare Part D lives are covered without restrictions
• Around 93% of new patients who start on Victoza® have not used GLP-1 before
• Around 70% of prescriptions are for the higher dose 1.8 mg
GLP-1 value in bDKK
Share of total diabetes care
market
Source: QIMS monthly, MAT Nov 2017
other
Victoza®
exenatide
dulaglutide

Slide 70
5,05
4,10
3,50
4,72
11,82 11,82
0%
2%
4%
6%
8%
10%
0
1
2
3
4
5
6
7
CAGR value1: 15.2%
European GLP-1 market Victoza® value market share in Europe
The GLP-1 segment accounts for around 11% of total diabetes care market value in Europe
Investor Presentation Full year 2017
Nov 2017
Nov 2012
1 CAGR for 5-year period Source: IQVIA (formerly IMS) monthly MAT Nov, 2017 value figures (DKK)
Source: IQVIA (formerly IMS) monthly MAT Nov, 2017 value figures (DKK)
GLP-1 value market share other
Victoza®
exenatide
dulaglutide Share of total diabetes care
market
GLP-1 value in bDKK other
Victoza®
exenatide
dulaglutide
0%
20%
40%
60%
80%
100%
Nov 2012
Nov 2017
26%
13%
58%
3%

Slide 71
5,05
4,10
3,50
4,72
11,82 11,82
0%
20%
40%
60%
80%
100%
0%
1%
2%
3%
0.0
0.1
0.2
0.3
0.4
0.5
0.6
CAGR value1: 27.2%
Region AAMEO GLP-1 market Victoza® value market share in Region AAMEO
The GLP-1 segment accounts for 3% of total diabetes care market value in Region AAMEO
Investor Presentation Full year 2017
Nov 2017
Nov 2012
GLP-1 value market share
Nov 2012
Nov 2017
1 CAGR for 5-year period AAMEO: Africa, Asia, the Middle East and Oceania Source: IQVIA (formerly IMS) monthly MAT Nov, 2017 value figures (DKK)
Source: IQVIA (formerly IMS) monthly MAT Nov, 2017 value figures (DKK)
49%
33%
17%
1%
lixisenatide
Victoza®
exenatide
dulaglutide Share of total diabetes care
market
GLP-1 value in bDKK lixisenatide
Victoza®
exenatide
dulaglutide
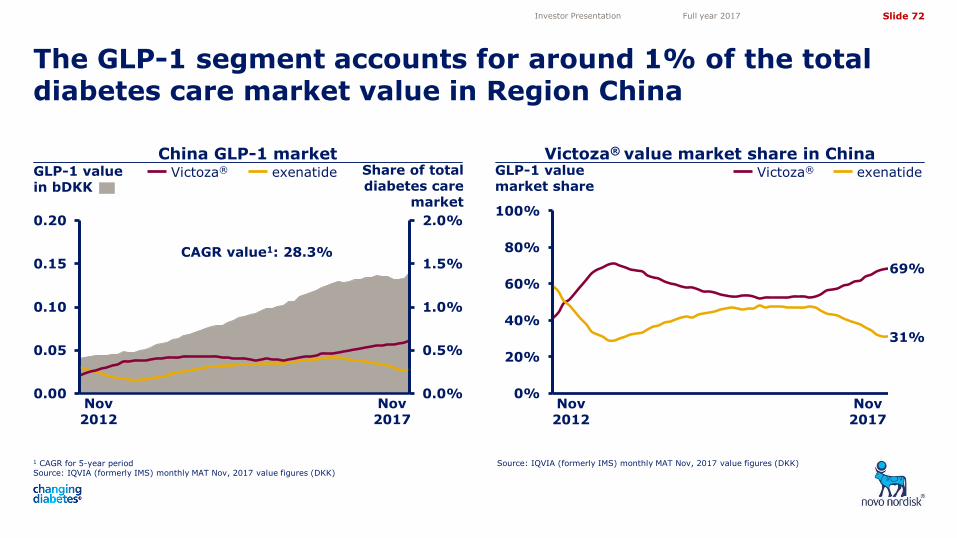
Slide 72
5,05
4,10
3,50
4,72
11,82 11,82
0%
20%
40%
60%
80%
100%
0.0%
0.5%
1.0%
1.5%
2.0%
0.00
0.05
0.10
0.15
0.20
CAGR value1: 28.3%
China GLP-1 market Victoza® value market share in China
The GLP-1 segment accounts for around 1% of the total diabetes care market value in Region China
Investor Presentation Full year 2017
Nov 2017
Nov 2012
Nov 2012
Nov 2017
1 CAGR for 5-year period Source: IQVIA (formerly IMS) monthly MAT Nov, 2017 value figures (DKK)
Source: IQVIA (formerly IMS) monthly MAT Nov, 2017 value figures (DKK)
69%
31%
GLP-1 value market share
Victoza® exenatide Share of total diabetes care
market
GLP-1 value in bDKK
Victoza® exenatide
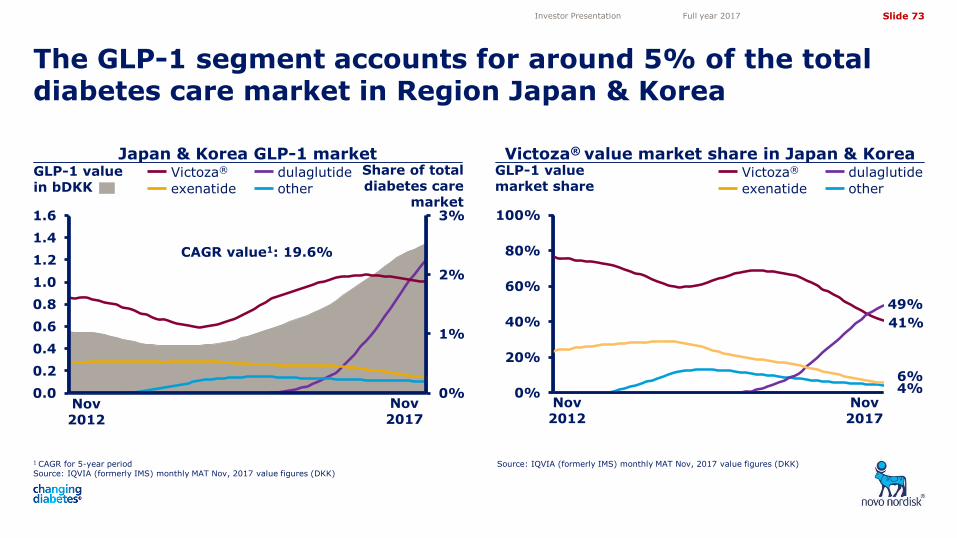
Slide 73
5,05
4,10
3,50
4,72
11,82 11,82
0%
1%
2%
3%
0.0
0.2
0.4
0.6
0.8
1.0
1.2
1.4
1.6
0%
20%
40%
60%
80%
100%
Investor Presentation Full year 2017
Nov 2017
Nov 2012
Nov 2012
Nov 2017
1 CAGR for 5-year period Source: IQVIA (formerly IMS) monthly MAT Nov, 2017 value figures (DKK)
Source: IQVIA (formerly IMS) monthly MAT Nov, 2017 value figures (DKK)
Japan & Korea GLP-1 market Victoza® value market share in Japan & Korea
The GLP-1 segment accounts for around 5% of the total diabetes care market in Region Japan & Korea
49%
6%
41%
4%
other
Victoza®
exenatide
dulaglutide
other
Victoza®
exenatide
dulaglutide Share of total diabetes care
market
GLP-1 value in bDKK
GLP-1 value market share
CAGR value1: 19.6%

Slide 74
5,05
4,10
3,50
4,72
11,82 11,82
0%
1%
2%
3%
4%
5%
6%
7%
8%
0.0
0.1
0.2
0.3
0.4
0.5
0.6
other
Victoza®
exenatide
dulaglutide
other
Victoza®
exenatide
dulaglutide GLP-1 value in bDKK
GLP-1 value market share
0%
20%
40%
60%
80%
100%
Latin America GLP-1 market Victoza® value market share in Latin America
Strong Victoza® market leadership in Region Latin America
Investor Presentation Full year 2017
Nov 2017
Nov 2012
Nov 2012
Nov 2017
1 CAGR for 5-year period Source: IQVIA (formerly IMS) monthly MAT Nov, 2017 value figures (DKK)
Source: IQVIA (formerly IMS) monthly MAT Nov, 2017 value figures (DKK)
75%
1%
23%
1%
Share of total diabetes care
market
CAGR value1: 5.4%
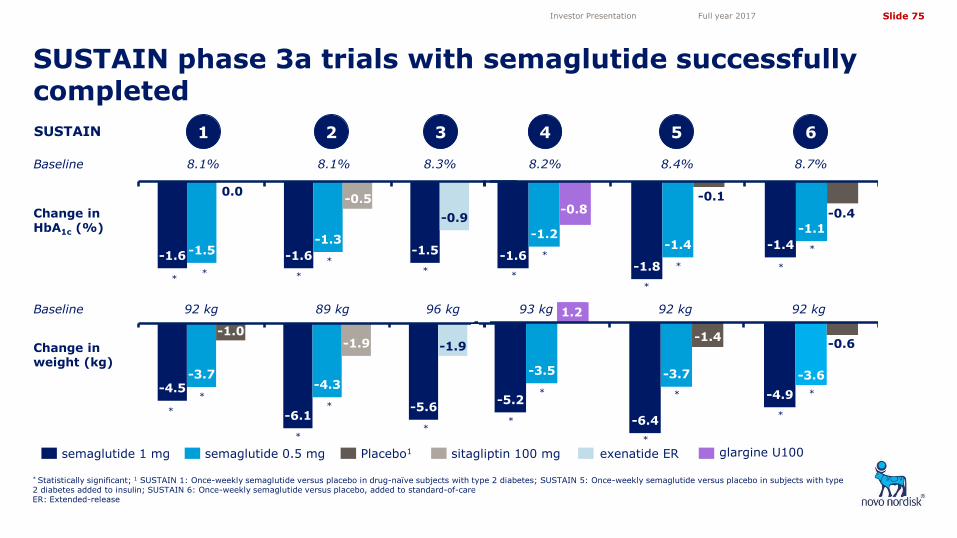
Slide 75
5,05
4,10
3,50
4,72
11,82 11,82
-1.6 -1.8
-1.4 -1.2
-1.4
-1.1
-0.8 -0.1
-0.4
-5.2
-6.4
-4.9
-3.5 -3.7 -3.6
1.2
-1.4
* Statistically significant; 1 SUSTAIN 1: Once-weekly semaglutide versus placebo in drug-naïve subjects with type 2 diabetes; SUSTAIN 5: Once-weekly semaglutide versus placebo in subjects with type 2 diabetes added to insulin; SUSTAIN 6: Once-weekly semaglutide versus placebo, added to standard-of-care ER: Extended-release
Baseline
SUSTAIN
8.1% 8.3% 8.2% 8.1%
Change in HbA1c (%)
8.4% 8.7%
92 kg 89 kg
Change in weight (kg)
*
*
* *
*
* *
*
3 2 1 4 5 6
* * *
* *
-1.6 -1.6 -1.5 -1.5 -1.3
-0.9
-0.5 0.0
-4.5
-6.1 -5.6
-3.7 -4.3
-1.9
-1.0 -1.9
Baseline
semaglutide 1 mg semaglutide 0.5 mg exenatide ER glargine U100 sitagliptin 100 mg Placebo1
93 kg 92 kg 92 kg
*
-0.6
96 kg
*
*
*
*
*
*
* *
* *
*
SUSTAIN phase 3a trials with semaglutide successfully completed
Investor Presentation Full year 2017

Slide 76
5,05
4,10
3,50
4,72
11,82 11,82
Semaglutide demonstrated superiority on both glucose control and weight loss vs dulaglutide in SUSTAIN 7 trial
semaglutide 0.5 mg semaglutide 1.0 mg dulaglutide 1.5 mg dulaglutide 0.75 mg
-8.0
-6.0
-4.0
-2.0
0.0
0 4 8 12 16 20 24 28 32 36 40
Weeks
6.0
6.5
7.0
7.5
8.0
8.5
0 4 8 12 16 20 24 28 32 36 400.0
Weeks
6.7%*
7.1%
6.4%*
6.9%
-4.6 kg*
-2.3 kg
-6.5 kg*
-3.0 kg
* p-value < 0.0001 Note: Inclusion criteria: Male or female, age ≥18 years, stable treatment with metformin, HbA1c 7.0-10.5%; from a mean baseline of 8.2% HbA1c
HbA1c (%) Weight loss (kg)
Investor Presentation Full year 2017

Slide 77
5,05
4,10
3,50
4,72
11,82 11,82
5.5
6.0
6.5
7.0
7.5
8.0
0 2 4 6 8 10 12 14 16 18 20 22 24 26
-8.0
-6.0
-4.0
-2.0
0.0
0 2 4 6 8 10 12 14 16 18 20 22 24 26
HbA1c reduction from a mean baseline of 7.9% Weight loss from a mean base line of 92 kg
Oral semaglutide reduced HbA1c and body weight in a 26-week phase 2 trial in type 2 diabetes
Inclusion criteria: Type 2 diabetes; 7.0% ≤ HbA1c ≤ 9.5%; treatment with diet and exercise with or without metformin; sc: subcutaneous; sema: semaglutide
Investor Presentation Full year 2017
Placebo Sema 2.5 mg Sema 5 mg Sema 10 mg Sema 20 mg Sema 1 mg sc Sema 40 mg HbA1c (%) Weight loss (kg)
0.0
Time (weeks) Time (weeks)

Slide 78
5,05
4,10
3,50
4,72
11,82 11,82
Preparation of global filing of oral semaglutide expected during 2019 pending successful completion of phase 3 trials
2016 2017
PIONEER 1: Monotherapy
PIONEER 2: vs empagliflozin
PIONEER 3: vs sitagliptin
PIONEER 4: vs liraglutide
PIONEER 5: Moderate renal impairment
PIONEER 6: Cardiovascular outcomes2
PIONEER 7: Flexible dose escalation3
PIONEER 8: Insulin add-on
PIONEER 9: Japan monotherapy
PIONEER 10: Japan OAD combination
2019 2020+ 2018 Q11
2018 Q21
2018 Q31
2018 Q41
Preparation of global filing
Trial Filing Potential launch 1 Expected to be published in the given quarter or in the subsequent quarterly company announcement; 2 Trial to rule out cardiovascular risk; 3 To be followed by 52-week extension trial Note: Estimated timing of trials from first patient first visit to last patient last visit and subsequent completion of trial OAD: Oral anti-diabetic
Regulatory decision and potential launch
Investor Presentation Full year 2017

Slide 79
5,05
4,10
3,50
4,72
11,82 11,82
Ozempic® approved in the USA
Competitive USA label for Ozempic®
Investor Presentation Full year 2017
• Statistically significant reduction in HbA1c compared with placebo, sitagliptin, exenatide extended-release and insulin glargine U100
• Statistically significant reduction in body weight confirmed in all trials against all comparators
• To be launched in the Ozempic® Pen, the latest generation of Novo Nordisk prefilled devices
• Once-weekly subcutaneous injections
• Ozempic® is indicated as an adjunct to diet and exercise to improve glycaemic control in adults with type 2 diabetes
• Ozempic® is approved for use in two therapeutic dosages, 0.5 mg and 1 mg
Convenience
Safety
Efficacy
Profile
• Ozempic® demonstrated a safe and well-tolerated profile across the SUSTAIN programme
• In SUSTAIN 6, there were 108 MACE events with Ozempic® compared to 146 events with placebo, equivalent to an event rate of 6.6% with Ozempic® and 8.9% with placebo
MACE: Major adverse cardiovascular event

Slide 80
5,05
4,10
3,50
4,72
11,82 11,82
Financials
Investor Presentation Full year 2017
Obesity

Slide 81
5,05
4,10
3,50
4,72
11,82 11,82
The set-point theory portrays how metabolic changes affect the ability to lose weight
The body fights weight loss for people with obesity
Obesity is a chronic disease that requires treatment
Investor Presentation Full year 2017
• The body “remembers” its highest body weight and defends this body weight as the “new normal weight”
• During weight loss, changes occur in appetite-regulating hormones, which increase hunger
• If people with obesity do not eat enough, the hormones trigger the body to conserve energy
• Changes in hormones persist for at least 5-10 years following weight loss
Weight gain Diet and exercise to
reduce weight
Increased appetite and slowing of
metabolism
Hormone levels signal change to keep weight
up
Set-point
New set-point
New set-point

Slide 82
5,05
4,10
3,50
4,72
11,82 11,82
Treatment rate is low and an increase requires a change of mindset and physician engagement
Investor Presentation Full year 2017
Only 2% of the 650 million people with obesity are treated with prescription medication Key barriers to effective obesity management
Note: The figure illustrates some of the intervention points to treat obesity with prescription medication 1 Attempt to manage weight through lifestyle modification or surgery 2 2% of people with obesity are estimated to be treated with anti-obesity medication Source: IQVIA (formerly IMS) MIDAS 2017
650 million people with obesity
Visit the doctor
Discussion and evaluation of next steps
Actively managed1
2% treated2
Few prescribers engaged
Mindset
Limited patient access
• Belief that obesity is self-inflicted
• Focus on acute weight loss rather than chronic weight management
• Physicians not equipped to engage in and treat obesity
• Funding and reimbursement a hurdle for physicians and patients

Slide 83
5,05
4,10
3,50
4,72
11,82 11,82
The healthcare cost associated with obesity expected to increase
Source: WHO, October 2017; World Obesity Federation, 2017
Investor Presentation Full year 2017
• Today, 650 million people have obesity globally
• By 2025, ~1 billion people are expected to have obesity
• If left untreated, by 2025, the costs of treating complications of obesity is expected to reach USD ~550 billion in the US and USD ~1.2 trillion globally
• The increased healthcare costs are primarily driven by obesity-related comorbidities such as type 2 diabetes and cardiovascular disease
Source: World Obesity Federation, 2017
Global healthcare costs related to obesity expected to increase by 50% by 2025
Increase in healthcare costs primarily driven by obesity-related comorbidities
USD ~0.8 trillion
USD ~1.2 trillion
2017 2025
USD ~1.0 trillion
2020
+50%

Slide 84
5,05
4,10
3,50
4,72
11,82 11,82
Saxenda® value share of anti-obesity medications in selected countries Countries with highest Saxenda® sales in 20171
Saxenda® now launched in 25 countries
Investor Presentation Full year 2017
Canada
0%
20%
40%
60%
80%
100%
0 5 10 15 20 25 30
USA Canada Brazil
Spain Denmark Italy Germany
Australia Mexico
UAE
Source: IQVIA (formerly IMS) Nov 2017 Note: The market for anti-obesity medication varies significantly in size between countries
Months from launch
79% 86%
72%
52% 47%
30%
19%
6% 14%
40%
0
400
800
1,200
1,600
2,000
DKK million
Saxenda® value market share 52%
30% 86%
USA Brazil Australia Canada
14%
Saxenda® volume market share 4%
4% 74% 6%
UAE
1 Reported sales for the full year 2017 Source: IQVIA (formerly IMS) MIDAS, Nov 2017
79%
43%

Slide 85
5,05
4,10
3,50
4,72
11,82 11,82
AOM: Anti-obesity medication; TRx: Total prescriptions Source: IQVIA (formerly IMS) NPA and NSP moving annual total through Nov 2017
Despite strong Saxenda® growth, US obesity care market remains small at USD ~700 million
Novo Nordisk is investing in overcoming the barriers preventing effective obesity care
Saxenda® has rapidly grown value market share, but market development efforts are required to expand the market
Investor presentation Full year 2017
Generic AOM Other branded AOM Saxenda®
Volume Value
82%
0%
20%
40%
60%
80%
100%
48%
44%
8%
0
200
400
600
800
TRx market share mUSD /value market share
Mindset Acute weight loss focus
with Saxenda® stay-time ~5 months
Less than 3,000 physicians write ≥10 AOM prescriptions per
month
Only 2 in 5 of ~95 million adults with
obesity have access to reimbursed medication
Advocate for chronic treatment through
partnerships
Launch obesity educator programme
Obtain Medicare coverage
through support of “Treat and Reduce
Obesity Act”
Current state Key initiatives
Limited patient access
Few
prescribers engaged
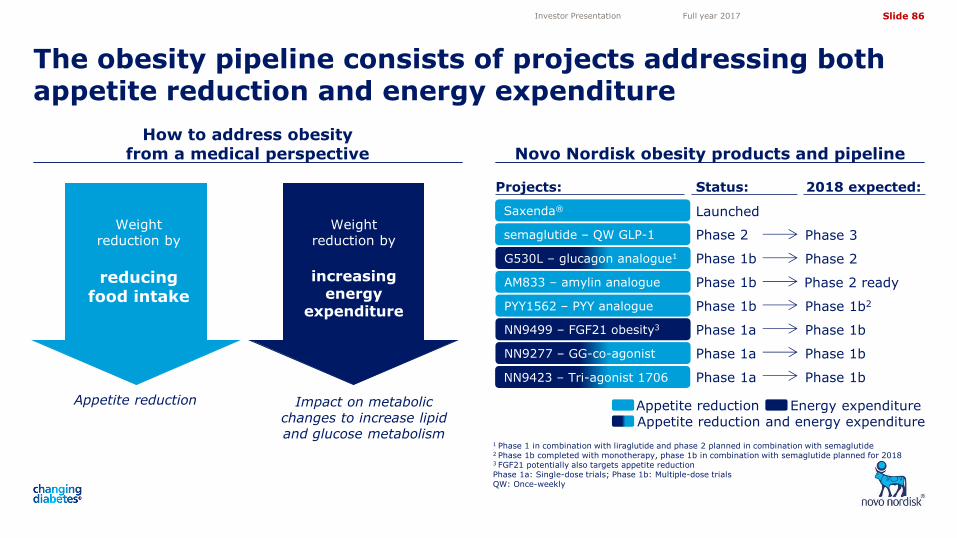
Slide 86
5,05
4,10
3,50
4,72
11,82 11,82
How to address obesity from a medical perspective Novo Nordisk obesity products and pipeline
The obesity pipeline consists of projects addressing both appetite reduction and energy expenditure
1 Phase 1 in combination with liraglutide and phase 2 planned in combination with semaglutide 2 Phase 1b completed with monotherapy, phase 1b in combination with semaglutide planned for 2018 3 FGF21 potentially also targets appetite reduction Phase 1a: Single-dose trials; Phase 1b: Multiple-dose trials QW: Once-weekly
Investor Presentation Full year 2017
G530L – glucagon analogue1
AM833 – amylin analogue
PYY1562 – PYY analogue
NN9277 – GG-co-agonist
NN9499 – FGF21 obesity3
NN9423 – Tri-agonist 1706
Saxenda®
semaglutide – QW GLP-1 Weight
reduction by
increasing energy
expenditure
Projects: Status:
Launched
Phase 2
Phase 1b
Phase 1b
Phase 1b
Phase 1a
Phase 1a
Phase 1a
Appetite reduction and energy expenditure
Appetite reduction Energy expenditure
2018 expected:
Phase 3
Phase 2
Phase 2 ready
Phase 1b2
Phase 1b
Phase 1b
Phase 1b
Weight reduction by
reducing food intake
Appetite reduction Impact on metabolic changes to increase lipid and glucose metabolism

Slide 87
5,05
4,10
3,50
4,72
11,82 11,82
-20
-15
-10
-5
0
0 4 8 12 16 20 28 36 44 52
Key results and next steps
Semaglutide demonstrated unprecedented weight loss in phase 2 obesity trial
Investor Presentation Full year 2017
16.2% weight reduction with the highest semaglutide dose in phase 2 obesity trial
• Participants in the highest dose arms continued to lose weight over the duration of the trial as the response curve did not plateau in the highest dose arm
• Nearly two out of three patients experienced a weight loss of 10% or more with the highest dose of semaglutide
• 80% of patients completed the trial
• Once-daily semaglutide had a well-tolerated safety profile, with the most common adverse events being gastrointestinal
• Next steps: Phase 3 programme STEP and cardiovascular outcomes study SELECT to be initiated in 2018
sema 0.05 mg sema 0.1 mg
sema 0.2 mg sema 0.3 mg
sema 0.4 mg lira 3.0 mg
Placebo
Change in body weight (%)
16.2%
Note: All treatment arms are adjunct to diet and exercise QD: Once-daily; sema: Semaglutide; lira: Liraglutide
Weeks

Slide 88
5,05
4,10
3,50
4,72
11,82 11,82
Biopharm
ADMIRE MUSHURWA, UK Admire has haemophilia A with inhibitors
Slide 88
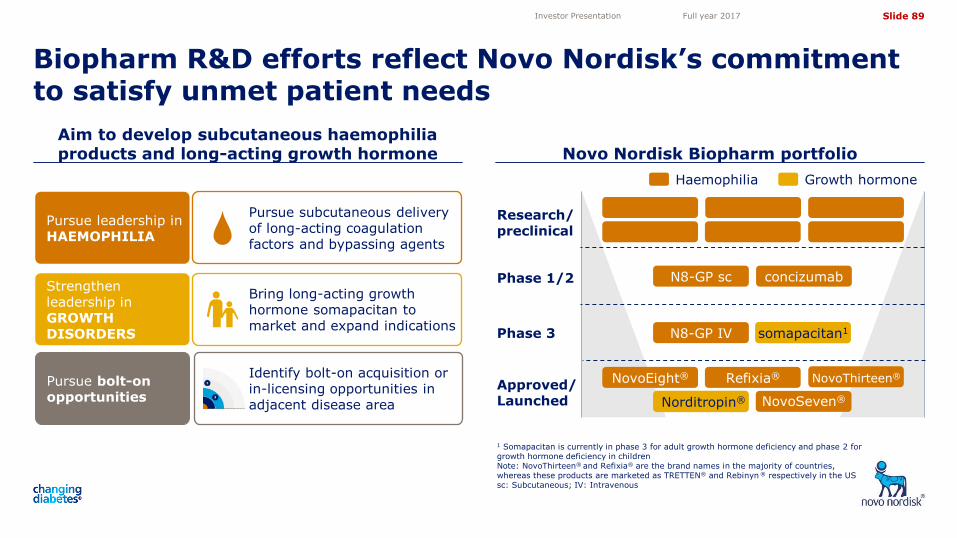
Slide 89
5,05
4,10
3,50
4,72
11,82 11,82
Aim to develop subcutaneous haemophilia products and long-acting growth hormone Novo Nordisk Biopharm portfolio
Biopharm R&D efforts reflect Novo Nordisk’s commitment to satisfy unmet patient needs
1 Somapacitan is currently in phase 3 for adult growth hormone deficiency and phase 2 for growth hormone deficiency in children Note: NovoThirteen® and Refixia® are the brand names in the majority of countries, whereas these products are marketed as TRETTEN® and Rebinyn ® respectively in the US sc: Subcutaneous; IV: Intravenous
Investor Presentation Full year 2017
Strengthen leadership in GROWTH DISORDERS
Pursue leadership in HAEMOPHILIA
Pursue subcutaneous delivery of long-acting coagulation factors and bypassing agents
Bring long-acting growth hormone somapacitan to market and expand indications
Pursue bolt-on opportunities
Identify bolt-on acquisition or in-licensing opportunities in adjacent disease area
Growth hormone Haemophilia
Research/ preclinical
Phase 1/2
Phase 3
Approved/ Launched
N8-GP IV somapacitan1
concizumab N8-GP sc
Refixia®
Norditropin®
NovoEight® NovoThirteen®
NovoSeven®

Slide 90
5,05
4,10
3,50
4,72
11,82 11,82
Note: The inhibitor segment represents people with haemophilia and high titre inhibitors to their normal replacement treatment Source: Estimates based on prevalence data in literature (Stonebraker JS et al. Haemophilia. 2010; 16: 20-32), World Federation of Haemophilia – Annual Global Survey 2012, UDC database in the US
Number of people with haemophilia A and B and haemophilia with inhibitors
Low diagnosis and treatment rates within haemophilia
Haemophilia is a rare disease with severe unmet medical needs
Source: World Federation of Haemophilia – Annual Global Survey 2016
Investor Presentation Full year 2017
Haemophilia A
App. 350,000 patients
Haemophilia B
App. 70,000 patients
Inhibitor segment app. 3,500-4,000
patients
Average percentage of people with haemophilia
0
100
200
300
400
500
People withhaemophilia
Diagnosed Treated Prophylactic Pristinejoints
45%
15%
3% 6%
Number of people (000)

Slide 91
5,05
4,10
3,50
4,72
11,82 11,82
1 Obizur® only indicated for acquired haemophilia 2 CAGR for 5-year period
Sales of recombinant coagulation factors Strategic positioning of Novo Nordisk’s
haemophilia portfolio
Novo Nordisk compound
Status Strategic position
NovoSeven® Launched Maintain market leadership
NovoEight® Launched Establish presence in a competitive market place
N8-GP Phase 33 Contribute to market conversion
Refixia®/ REBINYN® Approved4 Contribute to new treatment paradigm
NovoThirteen® Launched Launch first recombinant product
Global haemophilia market is growing by high-single digit
3 Submission of N8-GP expected Q1 2018 in the US and the EU 4 Refixia® is the brand name for N9-GP in the EU, and REBINYN® is the brand name in the US
Investor Presentation Full year 2017
0
5
10
15
20
25
30
35
2011 2016 2011 2016 2011 2016
DKK billion
rFVIIa rFVIII rFIX
CAGR2: 4% CAGR2: 10% CAGR2: 16%
NovoSeven®
Coagil VII®
Obizur®1 Xyntha®/Refacto®
Recombinate®/Advate®
Kogenate®/Helixate®
Eloctate®
NovoEight®
Rixubis®
Alprolix®
Benefix®
Idelvion®

Slide 92
5,05
4,10
3,50
4,72
11,82 11,82
Investor Presentation Full year 2017
Estimated NovoSeven® sales by indication1
NovoSeven® sales of DKK 9.2 billion3
Challenge
• Roche’s Emicizumab launched recently, leading to intensified competition in the segment for haemophilia A with inhibitors
Opportunities
• Maintain position as preferred agent for all bleeds including breakthrough bleeds for patients on prophylactic treatment
• Improving diagnosis and treatment of select indications outside of haemophilia A with inhibitors with special focus on acquired haemophilia
• Drive development of NovoSeven® franchise in underdeveloped Chinese market following inclusion on National Drug Reimbursement List
Opportunities and challenges for NovoSeven® franchise
CHwI PPx (A&B)
Other indications2 CHwI surgery (A&B)
CHwI on demand (A&B)
~25%
~10%
~50% of historic NovoSeven® sales exposed to competition, but opportunities remain in other indications
~50%
~15%
Haemophilia A PPx and on demand sales exposed
to competitive entry
~50%
1 Based on internal Novo Nordisk estimate 2 Other indications include areas like acquired haemophilia, Glanzmann’s thrombastenia and congenital FVII deficiency 3 Reported sales for full year 2017 CHwI: Congenital haemophilia with inhibitors; PPx: Prophylaxis; A&B: Haemophilia A and B

Slide 93
5,05
4,10
3,50
4,72
11,82 11,82
Competitive positioning for NovoEight®
• Temperature stabilty at high room temperature and best-in-class portability
• Uptake driven by Novo Nordisk’s strong customer focus and company recognition within the haemophilia community
• Continued volume growth especially in less mature markets with tender opportunities, despite increasing penetration of long-acting FVIII products
Next generation
• Global roll-out of NovoEight® and N8-GP to pave the way for subcutaneous N8-GP
NovoEight® roll-out continues and the number of patients has steadily increased
NovoEight® has potential to increase volume share in select segments and markets
NovoEight® volumes continue to grow despite increasing penetration of long-acting FVIII products
Investor Presentation Full year 2017
0
500
1,000
1,500
2,000
2014 2015 2016 2017
Number of launch countries
Number of patients
2
Estimated number of patients1
1 Novo Nordisk estimated accumulated patient number 2 Novo Nordisk estimated accumulated patient number as of October 2017 FVIII: Coagulation factor VIII
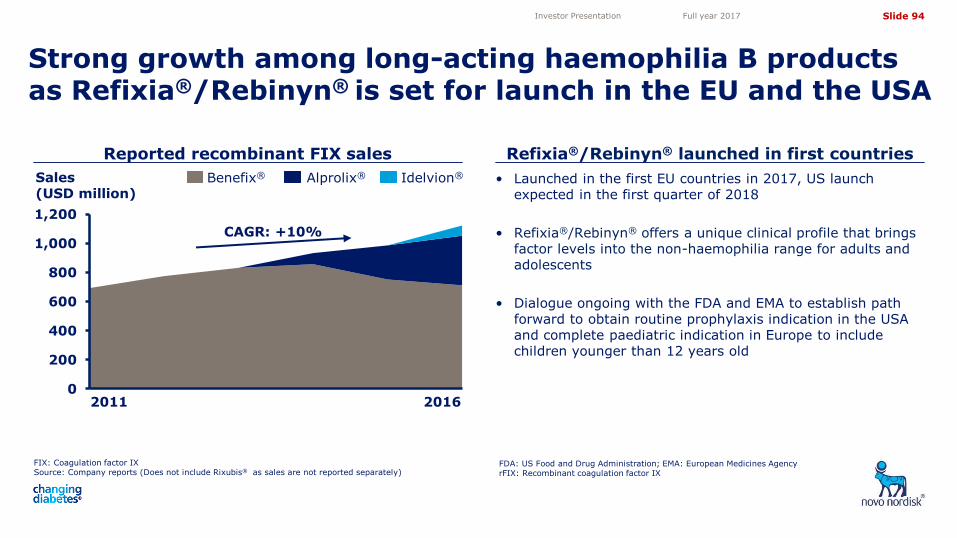
Slide 94
5,05
4,10
3,50
4,72
11,82 11,82
• Launched in the first EU countries in 2017, US launch expected in the first quarter of 2018
• Refixia®/Rebinyn® offers a unique clinical profile that brings factor levels into the non-haemophilia range for adults and adolescents
• Dialogue ongoing with the FDA and EMA to establish path forward to obtain routine prophylaxis indication in the USA and complete paediatric indication in Europe to include children younger than 12 years old
FIX: Coagulation factor IX Source: Company reports (Does not include Rixubis® as sales are not reported separately)
Reported recombinant FIX sales Refixia®/Rebinyn® launched in first countries
Strong growth among long-acting haemophilia B products as Refixia®/Rebinyn® is set for launch in the EU and the USA
Investor Presentation Full year 2017
0
200
400
600
800
1,000
1,200
2011 2012 2013 2014 2015 2016
Sales (USD million)
Alprolix® Idelvion® Benefix®
2016 2011
CAGR: +10%
FDA: US Food and Drug Administration; EMA: European Medicines Agency rFIX: Recombinant coagulation factor IX
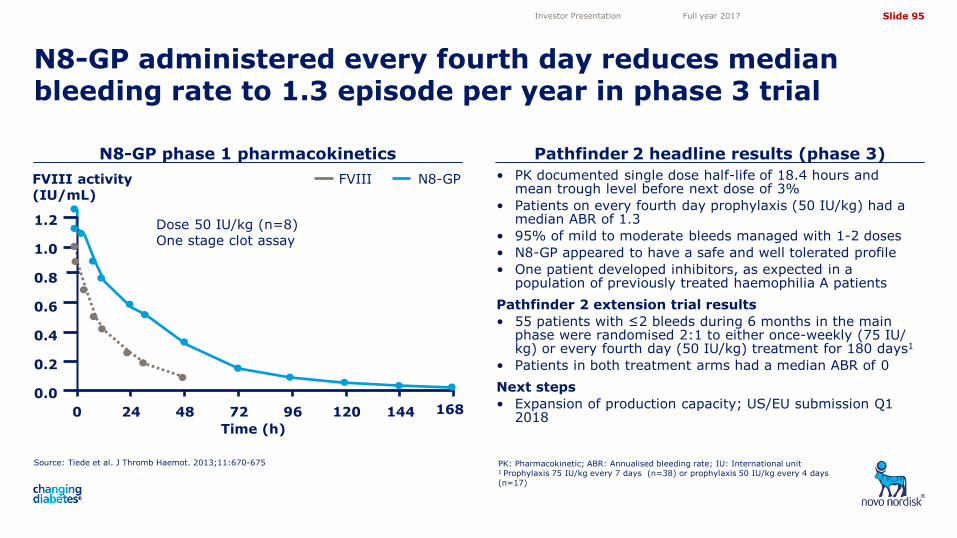
Slide 95
5,05
4,10
3,50
4,72
11,82 11,82
N8-GP
Source: Tiede et al. J Thromb Haemot. 2013;11:670-675
N8-GP phase 1 pharmacokinetics Pathfinder 2 headline results (phase 3)
N8-GP administered every fourth day reduces median bleeding rate to 1.3 episode per year in phase 3 trial
PK: Pharmacokinetic; ABR: Annualised bleeding rate; IU: International unit 1 Prophylaxis 75 IU/kg every 7 days (n=38) or prophylaxis 50 IU/kg every 4 days (n=17)
Investor Presentation Full year 2017
FVIII activity (IU/mL)
FVIII
Dose 50 IU/kg (n=8) One stage clot assay
1.2
1.0
0.8
0.6
0.4
0.2
0.0
0 24 48 72 96 120 144 168
Time (h)
• PK documented single dose half-life of 18.4 hours and mean trough level before next dose of 3%
• Patients on every fourth day prophylaxis (50 IU/kg) had a median ABR of 1.3
• 95% of mild to moderate bleeds managed with 1-2 doses
• N8-GP appeared to have a safe and well tolerated profile
• One patient developed inhibitors, as expected in a population of previously treated haemophilia A patients
Pathfinder 2 extension trial results
• 55 patients with ≤2 bleeds during 6 months in the main phase were randomised 2:1 to either once-weekly (75 IU/ kg) or every fourth day (50 IU/kg) treatment for 180 days1
• Patients in both treatment arms had a median ABR of 0
Next steps
• Expansion of production capacity; US/EU submission Q1 2018

Slide 96
5,05
4,10
3,50
4,72
11,82 11,82
23%
0%
5%
10%
15%
20%
25%
30%
35%
0
20
40
60
80
100
0
5
10
15
20
Development in global growth hormone market Growth hormone volume market share
Novo Nordisk maintains leadership within growth hormone market
1 CAGR for 5-year period
Source: IQVIA (formerly IMS) monthly MAT Nov, 2017 volume figures and value (DKK) figures
Source: IQVIA (formerly IMS) monthly MAT Nov, 2017 volume figures
Investor Presentation Full year 2017
Nov 2012
Nov 2017
Sandoz
Eli Lilly
Novo Nordisk Pfizer
Merck Kgaa
Nov 2012
Nov 2017
CAGR volume1: 7.5% CAGR value DKK1: 0.0%
MAT value DKK MAT volume kg kg
DKK billion

Slide 97
5,05
4,10
3,50
4,72
11,82 11,82
Somapacitan IGF-1 levels similar to daily Norditropin® in REAL 1 phase 3 AGHD trial
Phase 3a AGHD trial succesfully completed, phase 2 GHD read-out expected in 2018
Phase 3 extension trial in adults and phase 2 trial in children for once-weekly somapacitan to conclude in 2018
Note: Filing for first indication (AGHD) expected in 2018 GHD: Growth hormone deficiency; SGA: Small for gestational age
Investor Presentation Full year 2017
Completed trial
Ongoing trial Trial in planning
2021 2017 2018 2020 2019 2016
Extension trial
REAL 4: Phase 3, GHD Objective: Efficacy (height velocity)/safety
REAL 3: Phase 2, GHD Objective: Dose finding (height velocity)/safety
REAL 1: Phase 3a, naïve AGHD Objective: Efficacy (truncal fat %)/safety
REAL 5: Phase 3, SGA Objective: Efficacy (height velocity)/safety
Baseline
Placebo Norditropin® Cumulative
frequency
-5 -4 -3 -2 -1 0 1 2 3 4
somapacitan
IGF-1: Insulin-like growth factor 1; AGHD: Adult growth hormone deficiency Source: Novo Nordisk data on file; REAL 1, NN8640-4054
IGF-1 standard deviation score
0%
20%
40%
60%
80%
100%
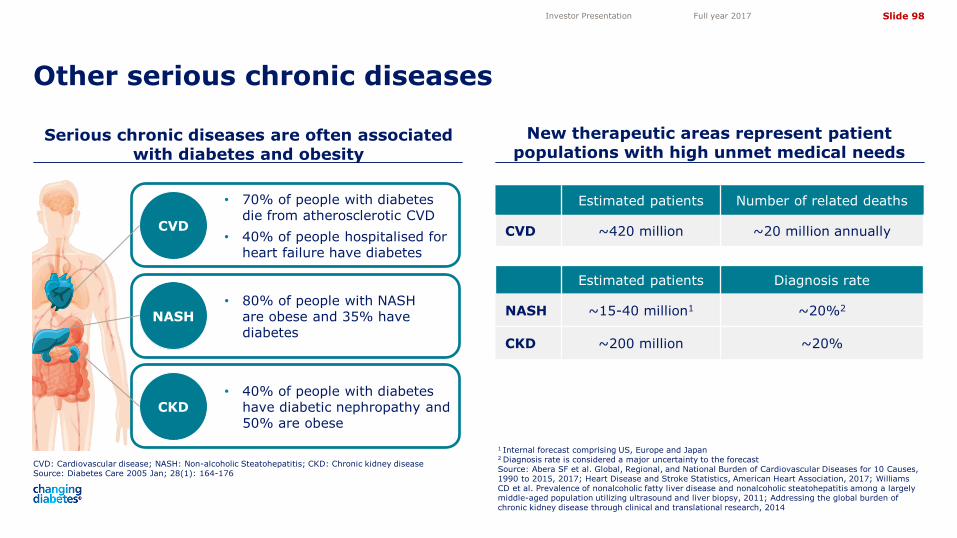
Slide 98
5,05
4,10
3,50
4,72
11,82 11,82
Other serious chronic diseases
Serious chronic diseases are often associated with diabetes and obesity
New therapeutic areas represent patient populations with high unmet medical needs
Investor Presentation Full year 2017
• 80% of people with NASH are obese and 35% have diabetes
• 70% of people with diabetes die from atherosclerotic CVD
• 40% of people hospitalised for heart failure have diabetes
• 40% of people with diabetes have diabetic nephropathy and 50% are obese
CKD
CVD
NASH
Estimated patients Diagnosis rate
NASH ~15-40 million1 ~20%2
CKD ~200 million ~20%
1 Internal forecast comprising US, Europe and Japan 2 Diagnosis rate is considered a major uncertainty to the forecast Source: Abera SF et al. Global, Regional, and National Burden of Cardiovascular Diseases for 10 Causes, 1990 to 2015, 2017; Heart Disease and Stroke Statistics, American Heart Association, 2017; Williams CD et al. Prevalence of nonalcoholic fatty liver disease and nonalcoholic steatohepatitis among a largely middle-aged population utilizing ultrasound and liver biopsy, 2011; Addressing the global burden of chronic kidney disease through clinical and translational research, 2014
Estimated patients Number of related deaths
CVD ~420 million ~20 million annually
CVD: Cardiovascular disease; NASH: Non-alcoholic Steatohepatitis; CKD: Chronic kidney disease
Source: Diabetes Care 2005 Jan; 28(1): 164-176

Slide 99
5,05
4,10
3,50
4,72
11,82 11,82
1 Inclusion criteria: Histological confirmation of NASH, BMI 25–45 kg/m2, NASH fibrosis stage 2 or 3, Histological NAFLD Activity Score ≥ 4 mg: Milligram; sc: Subcutaneous; QD: Once-daily; MR: Magnetic resonance; NAFLD: Non-alcoholic fatty liver disease
CVD: Cardiovascular disease; NASH: Non-alcoholic steatohepatitis; CKD: Chronic kidney disease
Trials in obesity and other serious chronic disease areas building on the semaglutide molecule
Ongoing phase 2 trial with daily semaglutide vs placebo in patients with NASH
semaglutide 0.4 mg sc QD
semaglutide 0.2 mg sc QD
72 weeks
Placebo 0.1, 0.2 or 0.4 mg
semaglutide 0.1 mg sc QD
Liver biopsy (recent or new)
Liver biopsy
372 patients1
NASH CVD CKD Obesity
semaglutide
Next steps: • Phase 2 trial expected to complete 2020
Planned or ongoing trials with semaglutide addressing other serious chronic diseases
Investor Presentation Full year 2017

Slide 100
5,05
4,10
3,50
4,72
11,82 11,82
Financials
Investor Presentation Full year 2017
Financials

Slide 101
5,05
4,10
3,50
4,72
11,82 11,82
0
20
40
60
80
100
120
2,013 2,014 2,015 2,016 2,017
Th
ou
san
ds
Reported annual sales 2013-2017 Reported annual sales split by region
Solid sales growth driven by the US
1 CAGR for 5-year period AAMEO: Africa, Asia, Middle-East and Oceania; J&K: Japan and Korea; LATAM: Latin America
Investor Presentation Full year 2017
Biopharmaceuticals Diabetes
2013 2014 2015 2016 2017
CAGR1 7.5%
78% 79%
79% 80% 83%
47% 52%
24% 19%
11% 11%
9% 10% 6% 5% 3% 3%
2013 2017
Region China
Region Europe North America Region AAMEO
Region J&K Region LATAM
DKK billion
22% 21%
21% 20% 17%

Slide 102
5,05
4,10
3,50
4,72
11,82 11,82
Reported currencies Sales full year 2017 (mDKK) Sales split Sales Q4 2017 (mDKK) Sales split
Tresiba® 7,327 7% 1,880 7%
Levemir® 14,118 13% 3,346 12%
NovoRapid® 20,025 18% 4,568 16%
NovoMix® 10,257 9% 2,457 9%
Victoza® 23,173 21% 6,305 23%
Saxenda® 2,562 2% 697 2%
Diabetes care and Obesity1 92,877 83% 23,143 83%
NovoSeven® 9,206 8% 2,431 9%
Norditropin® 6,655 6% 1,709 6%
Biopharmaceuticals1 18,819 17% 4,849 17%
Total1 111,696 100% 27,992 100%
Victoza® accounts for 21% of total sales in 2017
Investor Presentation Full year 2017
1 Values are higher than the sum of the total elements listed due to residual values from products not listed

Slide 103
5,05
4,10
3,50
4,72
11,82 11,82
0%
10%
20%
30%
40%
50%
60%
0
10
20
30
40
50
60
1 2 3 4 5
Operating profit Operating profit therapy split
Solid operating profit growth driven by diabetes
* Adjusted for the partial divestment of NNIT A/S and inflammatory out-licensing in 2015
Investor Presentation Full year 2017
Diabetes Biopharm
2013 2017
22%
78% 73%
27%
7% 10% 4% 35%
Reported operating profit growth
Operating profit as % of sales Operating profit
2013 2014 2015 * 2016* 2017
Operating profit growth in local currencies
15% 13% 13% 6%
DKK billion
5%
1%
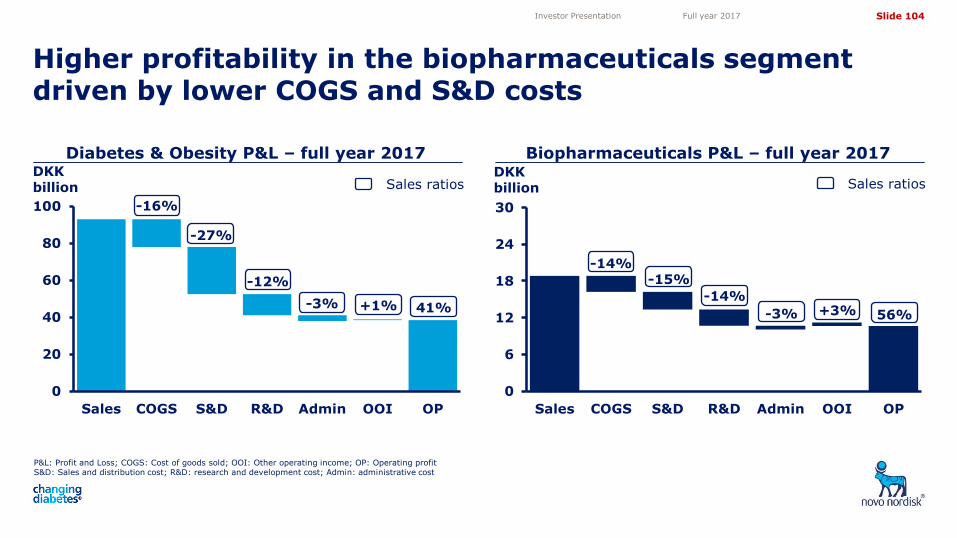
Slide 104
5,05
4,10
3,50
4,72
11,82 11,82
Higher profitability in the biopharmaceuticals segment driven by lower COGS and S&D costs
Investor Presentation Full year 2017
Diabetes & Obesity P&L – full year 2017 Biopharmaceuticals P&L – full year 2017
P&L: Profit and Loss; COGS: Cost of goods sold; OOI: Other operating income; OP: Operating profit S&D: Sales and distribution cost; R&D: research and development cost; Admin: administrative cost
0
20
40
60
80
100
Sales COGS S&D R&D Admin OOI OP
-16%
-27%
-12%
-3% 41% +1%
0
6
12
18
24
30
Sales COGS S&D R&D Admin OOI OP
-14% -15%
-14%
-3% 56% +3%
DKK billion
DKK billion Sales ratios Sales ratios

Slide 105
5,05
4,10
3,50
4,72
11,82 11,82
0%
5%
10%
15%
20%
25%
0
5
10
15
20
Th
ou
san
ds
Cost of Goods Sold (COGS) Capital Expenditure (CAPEX)
Stable COGS level as % of sales and increasing CAPEX level
Investor Presentation Full year 2017
2013 2014 2015 2016 2017
COGS as % of sales
COGS
DKK billion
DKK billion
CAPEX CAPEX as % of sales
0%
2%
4%
6%
8%
10%
0
2
4
6
8
10
12
1 2 3 4 5 6 7
Expected CAPEX
2014 2015 2016 2017 2018E 2019E 2020E

Slide 106
5,05
4,10
3,50
4,72
11,82 11,82
0%
5%
10%
15%
20%
0%
25%
50%
75%
100%
125%
150%
175%
Long-term financial targets support focus on profitable growth, capital allocation and cash conversion
1 Long-term target established in connection with the Q3 2016 report. The target of an average operating profit growth of 5% is an average for the period of 4-5 years, with 2015 as the base year. Operating profit after tax to net operating assets target unchanged at 125% and Cash to earnings (three year average) target unchanged at 90%
Note: The long-term financial targets are based on an assumption of a continuation of the current business environment; 2015 and 2016 figures are adjusted for the partial divestment of NNIT A/S and inflammatory out-licensing in 2015
Investor Presentation Full year 2017
Operating profit growth in local currencies
Cash to earnings (three-year average)
Operating profit after tax to net operating assets
2013 2014 2015 2016 2017
Current long-term financial target1
Previous long-term financial targets
2013 2014 2015 2016 2017
Current long-term financial target1
0%
20%
40%
60%
80%
100%
120%
Current long-term financial target1
2011- 2013
2012- 2014
2013- 2015
2014- 2016
2015- 2017

Slide 107
5,05
4,10
3,50
4,72
11,82 11,82
Note: Treasury shares are included in the capital but have no voting rights
Share structure The Novo Nordisk Foundation
Stable ownership structure - secured through A and B-share structure
Investor Presentation Full year 2017
• The Novo Nordisk Foundation is a self-governing institution that: • provides a stable basis for Novo Nordisk • supports scientific, humanitarian and social purposes
• All strategic and operational matters are governed by the board and management of Novo Nordisk
• Overlapping board memberships ensure that the Novo Nordisk Foundation and Novo Nordisk share vision and strategy
Novo Nordisk A/S
Novo Nordisk Foundation Institutional and private
investors Novo Holdings A/S
A shares
537m shares
B shares
1,963m shares
76.1% of votes
28.1% of capital
23.9% of votes
71.9% of capital

Slide 108
5,05
4,10
3,50
4,72
11,82 11,82
The Novo Nordisk Way The Triple Bottom Line Business Principle
Sustainable business
Investor Presentation Full year 2017
We build on the purpose set by our founders and live by their values: The Novo Nordisk Way sets the direction and unites us around a common purpose in the pursuit of our aspirations: Driving change to defeat diabetes and other serious chronic diseases
The Triple Bottom Line Principle, anchored in the Articles of Association, guides how we do business responsibly and how we make decisions that consider the interests of stakeholders and the long-term interests of our shareholders
Financially responsible
Socially responsible
Environmentally responsible

Slide 109
5,05
4,10
3,50
4,72
11,82 11,82
Employee health and safety and engagement are key focus areas for management
Novo Nordisk is committed to building a diverse and inclusive organisation
Novo Nordisk offers a healthy, engaging and inclusive workplace with development opportunities for employees
Investor Presentation Full year 2017
11.0% employee turnover
2.7 accidents with absence per million working hours
90% sustainable engagement score
1 All appointments to management positions, incl. internal promotions and external hires, ex. NNIT
~42,100 FTE employees
2013 2017
All managers
Management appointments1 Sr. Managers
2013 2017 2013 2017
61%
39% 40%
60% 57%
43%
14%
86%
15%
85%
59%
41%
Men
Women
Note: Full social statements to be found in Novo Nordisk Annual Report 2017
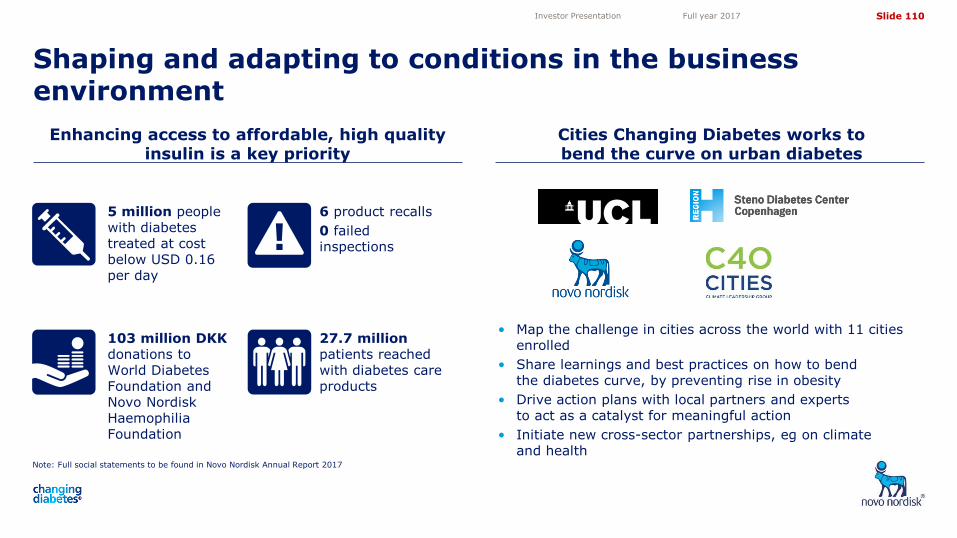
Slide 110
5,05
4,10
3,50
4,72
11,82 11,82
Cities Changing Diabetes works to bend the curve on urban diabetes
Shaping and adapting to conditions in the business environment
Investor Presentation Full year 2017
• Map the challenge in cities across the world with 11 cities enrolled
• Share learnings and best practices on how to bend the diabetes curve, by preventing rise in obesity
• Drive action plans with local partners and experts to act as a catalyst for meaningful action
• Initiate new cross-sector partnerships, eg on climate and health
Enhancing access to affordable, high quality insulin is a key priority
Note: Full social statements to be found in Novo Nordisk Annual Report 2017
103 million DKK donations to World Diabetes Foundation and Novo Nordisk Haemophilia Foundation
27.7 million patients reached with diabetes care products
6 product recalls
0 failed inspections
5 million people with diabetes treated at cost below USD 0.16 per day

Slide 111
5,05
4,10
3,50
4,72
11,82 11,82
Target
Least possible use of resources, lower emissions and less waste are priorities
On track to have all production sites run 100% on renewable power by 2020
Novo Nordisk prioritises minimisation in use of non-depletable or scarce natural resources
Investor Presentation Full year 2017
2% decrease in CO2 emissions from production
since 2016
96% of total waste is recycled, used for biogas or recovered as energy for heat and power production
93% of water consumption is in areas not subject to water stress
Slight decrease in water and energy consumption for production since 2016
Note: Full social statements to be found in Novo Nordisk Annual Report 2017
0%
20%
40%
60%
80%
100%
120%
Realised
2013 2014 2015 2016 2017