Investor Presentation January 2021 - Pemex
27
Sonda de Campeche Investor Presentation
Transcript of Investor Presentation January 2021 - Pemex

Sonda de Campeche
Investor
Presentation

2
Forward-Looking Statement &
Cautionary NoteVariationsIf no further specification is included, comparisons are made against the same realized period of the last year.
RoundingNumbers may not total due to rounding.
Financial InformationExcluding budgetary and volumetric information, the financial information inc luded in this report and the annexes hereto is based on unaudited cons olidated financia l statements pr epar ed in accor danc e with Inter national Financia l Reporting Standards as issued by the International Accounting Standar ds Boar d (“IFRS”), which PEMEX hasadopted effective January 1, 2012. Information from prior per iods has been retrospectively adjusted in certain accounts to mak e it comparable with the unaudited cons olidated financ ial information under IFRS. For mor e inform ation r egar ding the trans ition to IFRS, see Note 23 to the cons olidated financ ial statem ents inc luded in Petróleos
Mexicanos’ 2012 Form 20-F filed with the Secur ities and Exchange Comm ission (SEC) and its Annual Report filed with the Com isión Nac ional Bancaria y de V alor es (CNBV). EBITDA is a non-IFRS measur e. We show a reconcil iation of EBITDA to net inc ome in Table 33 of the annexes to PEMEX ’s Res ults Report as of Marc h 31, 2015.Budgetary information is bas ed on standards from Mex ican governm ental accounting; therefor e, it does not inc lude information from the subs idiary companies or affiliates of Petró leos Mex icanos. It is important to mention, that our current financ ing agreem ents do not include financia l covenants or events of default that would be trigger ed as a
result of our having negative equity.MethodologyWe might change the methodology of the information disclosed in order to enhance its quality and usefulness, and/or to comply with international standards and best practices.
Foreign Exchange ConversionsConvenience trans lations into U.S. dollars of amounts in Mex ican pesos have been m ade at the exchange r ate at clos e for the corres ponding per iod, unless otherwise noted. Due to market volatility, the difference between the av erage exchange rate, the exc hange rate at close and the s pot exchange rate, or any other exc hange rate us ed
could be material. Such translations should not be construed as a repr esentation that the Mex ican peso am ounts have been or c ould be converted into U.S. dol lars at the foregoing or any other rate. It is important to note that we m ainta in our c onsolidated financial statements and acc ounting recor ds in pesos. As of Septem ber 30, 2020, theexchange rate of MXN 22.4573 = USD 1.00 is used.Fiscal RegimeBeginning January 1, 2015, Petróleos Mex icanos’ fisc al regime is governed by the Ley de Ingr esos sobre Hidr ocarburos (Hy drocar bons Rev enue Law). From January 1, 2006 and to Decem ber 31, 2014, PEP was subject to a fiscal r egim e governed by the Federal Duties Law, while the tax regimes of the other Subsid iary E ntities weregoverned by the Federal Revenue Law.
On April 18, 2016, a decree was published in the Official Gazette of the Federation that a llows assignment operators to c hoos e between two schem es to calculate the c ap on perm itted deductions applicable to the Profit-Shar ing Duty: (i) the schem e established within the Hydr ocarbons Revenue Law, based on a perc entage of the value ofextracted hydrocarbons; or (ii) the scheme proposed by the SHCP, calculated upon established fixed fees, USD 6.1 for shallow water fields and USD 8.3 for onshore fields.The Specia l Tax on Production and Serv ices (IEPS) appl icable to autom otive gas oline and dies el is establis hed in the Production and Servic es Special Tax Law “Ley del Impuesto Especia l sobre Pr oducc ión y Servic ios”. As an intermediary between the Min istry of Finance and Public Credit (SHCP) and the fina l cons umer, PEMEX retains the
amount of the IEPS and transfers it to the Mexican Government. In 2016, the SHCP published a decree trough which it modified the calculation of the IEPS, based on the past five months of international reference price quotes for gasoline and diesel.As of January 1 2016, and until Dec ember 31, 2017, the SHCP wil l estab lish monthly fixed max imum pr ices of gasoline and diesel bas ed on the fol lowing: max imum pric es wil l be referenced to pr ices in the U.S. Gulf Coast, plus a margin that includes retai ls, freight, transportation, quality adjustment and m anagement costs, plus the appl icab le
IEPS to automotive fuel, plus other concepts (IEPS tax on fossil fuel, established quotas on the IEPS Law and value added tax).PEMEX’s “producer pric e” is calc ulated in refer ence to that of an efficient refinery operating in the Gulf of Mexic o. Until December 31, 2017, the Mexic an Gover nment is authoriz ed to continue issuing pric ing decrees to regulate the max imum pric es for the retai l sale of gasoline and dies el fuel, taking into account transportation costs betweenregions, inflation and the volatil ity of international fuel prices, am ong other factors. Beginning in 2018, the pric es of gas oline and diesel fuel will be free ly determined by market conditions. However the Federa l Comm ission for Economic Com petition, based on the existenc e of effective com petitive c onditions, has the authority to dec lare that
prices of gasoline and diesel fuel are to be freely determined by market conditions before 2018.Hydrocarbon Reserves
In accordanc e with the Hy drocar bons Law, published in the Official Gazette on August 11, 2014, the National Hydr ocarbons Comm ission (CNH) wil l establ ish and wi ll manage the National Hy drocar bons Information Center, comprised by a system to obtain, safeguar d, manage, use, analyze, keep updated and publish information and statisticsrelated; which includes estimations, valuation studies and certifications. On August 13, 2015, the CNH published the Guidelines that rule the valuation and certification of Mexico’s reserves and the related contingency resources.As of January 1, 2010, the Sec urities and Exc hange Commission (SEC) c hanged its rules to permit oil and gas com panies, in their fil ings with the SE C, to disc lose not only prov ed res erves, but a lso pr obable r eserves and poss ible reserv es. Nevertheless, any descr iption of probable or poss ible reserv es inc luded herein may not meet the
recoverability thresholds established by the SEC in its definitions. Investors are urged to consider closely the disclosure in our Form 20-F and our Annual Report to the CNBV and SEC, available at http://www.pemex.com/.Forward-looking Statements
• This report contains forward- look ing statements. We may also make written or oral forward- look ing statements in our per iodic reports to the CNBV and the SEC, in our annual reports, in our offering circ ulars and pros pectuses, in pr ess releases and other written mater ials and in or al statements made by our officers, directors or em ploy eesto third parties. We may include forward-looking statements that address, among other things, our:
• exploration and production activities, including drilling;
• activities relating to import, export, refining, petrochemicals and transportation, storage and distribution of petroleum, natural gas and oil products;• activities relating to our lines of business, including the generation of electricity;
• projected and targeted capital expenditures and other costs, commitments and revenues;• liquidity and sources of funding, including our ability to continue operating as a going concern;• strategic alliances with other companies; and
• the monetization of certain of our assets.• Actual results could differ materially from those projected in such forward-looking statements as a result of various factors that may be beyond our control. These factors include, but are not limited to:
• changes in international crude oil and natural gas prices;• effects on us from competition, including on our ability to hire and retain skilled personnel;• limitations on our access to sources of financing on competitive terms;
• our ability to find, acquire or gain access to additional reserves and to develop the reserves that we obtain successfully;• uncertainties inherent in making estimates of oil and gas reserves, including recently discovered oil and gas reserves;
• technical difficulties;• significant developments in the global economy;• significant economic or political developments in Mexico;
• developments affecting the energy sector; and• changes in our legal regime or regulatory environment, including tax and environmental regulations.
Accordingly, you should not place undue reliance on these forwar d-looking statements. In any event, these statements speak only as of their dates, and we undertake no obligation to update or revis e any of them, whether as a res ult of new inform ation, future events or otherwis e. These risks and uncertainties are mor e fully deta iled in our mostrecent Annual Report filed with the CNBV and available through the Mexican Stock Exchange (http://www.bmv.com.mx/) and our most recent Form 20-F filing filed with the SEC (http://www.sec.gov/). These factors could cause actual results to differ materially from those contained in any forward-looking statement.

Campo Ayatsil

4
Year End Relevant Factors
• COVID-19
• Decrease in sales
• Strategy to control financial déficit
• Efficiency and cost reduction strategy

5
2020 Taxes and Duties
Despite the adverse environment, PEMEX has complied with the timely payment of its contributions to
the public treasury.
46,256
Federal GovernmentSupport
Dos Bocas New Refinery
capitalization2/
PEMEX transfers to theGovernment
598,330 Total
Direct
(DUC1/ & others)
Indirect
(IEPS & IVA)
PEMEX received
this support from the
Federal Government
PEMEX delivered to the
Federal Government
552,074 million
pesos net during 2020.
For every peso the
Federal Government
invested in PEMEX, it has
received 12.9 pesos in return from the
company.
199,119
399,757
1. Corresponds to the net payment of the Profit-Sharing Duty (DUC), net of tax benefits accrued as of November.2. Includes 4,999 for Investment in PEP.

6
Gasoline Domestic Sales, 2019-2020Thousand barrels per day
707730 723
745 741724
735721
688701 694
733
667 676
644
447473
536558 552 562
579560
608
400
500
600
700
800
Jan Feb Mar Apr May Jun Jul Aug Sep Oct Nov Dec
2019 2020
Observed as of December 31, 2020
At December
31, 2020

7
Diesel Domestic Sales, 2019-2020Thousand barrels per day
At December
31, 2020
Observed as of December 31, 2020
291
309 312 308316
304298 295
270275 277
265
259264
256
199192
222 219
198 199
221215
244
150
180
210
240
270
300
330
Jan Feb Mar Apr May Jun Jul Aug Sep Oct Nov Dec
2019 2020

1,080 1,091 1,105 1,116 1,118 1,102 1,090 1,067 1,048 1,041 1,0361,075
8
Main Drivers of Budgetary Income in 2020
667 676 644447 473 535 558 552 561 579 560 607
259 264 256
199 192207 209 195 196 217 209 209
86 84 64
5 515 29 27 32 31 39 49
jan feb mar apr may jun jul aug sep oct nov dec
1,012 1,025 964
651 670758 796 774
Gasolines
Diesel
Jet fuel
Distilates domestic sales
(thousand barrels per day)
789
47.9 45.2 44.5 43.6 45.8 47.1 48.9 51.0 52.0 52.9 53.8 54.6
48.740.3
28.5
17.122.7
33.8 36.6 39.1 38.3 36.9 38.745.6
jan feb mar apr may jun jul aug sep oct nov dec
Crude oil price
(USD per barrel)
35.8
(real)
49.0
(budget)
1,081
(budget)
828
(real)
827 808 865

9
2020 Financial Balance Evolution MXN billion
Preliminary figures as of January 4, 2021.
-46.2
-80.6
-124.4
-152.8-171.4
-160.6
-184.5-196.8
-216.9-208.7
-115.3
-46.2
-10.6
-39.1
-63.8-76.5 -72.3
-81.7-92.2 -92.3
-105.0
-78.7-67.5
-62.6
-230.0
-180.0
-130.0
-80.0
-30.0
20.0
Jan Feb Mar Apr May Jun Jul Aug Sep Oct Nov Dec
Temporary Indebtedness
Financial deficit
Original program

10
Budgetary Cash Flow and Crude Oil Prices 2007-2020
1. 2020 preliminary figures.
31.4
-67.2 -56.6
-96.5
-61.1 -54.6 -49.5
-174.6 -183.5
-123.7-109.5
-66.9
28.0
-46.2
2007 2008 2009 2010 2011 2012 2013 2014 2015 2016 2017 2018 2019 2020
61.6
84.4
57.4
72.5
101.1 102.0 98.586.0
43.3 35.6 46.761.3 55.6
35.8
2007 2008 2009 2010 2011 2012 2013 2014 2015 2016 2017 2018 2019 2020
Mexican Mix Crude Oil Price
USD per barrel
Budgetary Cash Flow
MXN billion
1
1

11
PEMEX lifting costsUSD per barrel
-1.8% -2.4% -5.3% -2.9%-1.8% -2.4% -5.3% -2.9%-2.1%0.0%
6.8
7.98.2
9.4
7.8
10.9
13.7
2012 2013 2014 2015 2016 2017 2018
14.3%
-16.8%
39.5%
26%
3.9%16%
13.714.1
11.2
2018 2019 2020 2021 2022 2023 2024
+2.4%
-26.6%
The extraction
cost per barrel of
crude oil has
been reduced by
20.7%.
1
2012-2018 2018-2024
1. 2020 preliminary figures.

12
Results of Austerity and Expense Discipline 2015-2020MXN million
2015 2016 2017 2018 20192020
(Jan-Nov)
Cleaning and sanitation materials and others 72 59 45 33 8 14
Mobile phones 13 11 8 7 2 0
Technical consulting 3,435 3,361 2,884 2,276 751 578
Research and Investigation 275 65 22 109 13 16
Social Communication 119 165 211 244 12 17
Travel expenses 3,154 2,683 2,436 883 471 296
Conferences, conventions and events 26 12 42 11 0 0
TOTAL 7,094 6,356 5,648 3,563 1,257 921
7,094 6,356 5,6483,563
1,257 921
Efficiency, austerity and
expense discipline at PEMEX

13

14
Mexico’s Total Oil ProductionThousand barrels per day
1. For PEMEX+Partners are figures for 2020: PEMEX (1,686 mbd) + Partners (19 mbd). For the private companies is the last figure published in the Information System of the National Hydrocarbons Commission.
2. Includes partner production
1,705
2020
Private companies (oil rounds)21 Mbd (1.2%)
98.8%PEMEX2
Nearly 6 years after the energy reform, Petróleos Mexicanos is responsible
for almost all of the country's oil production.

15
Contribution of PEMEX’s New DevelopmentsThousand barrels per day
Source: PEMEX production data is provided by Pemex Exploración y Producción. Private figures correspond to data published by the National Hydrocarbons Commission, contract production www.cnh.gob.mx.
0
20
40
60
80
100
120
140
160
Jan
-14
Ma
r-14
Ma
y-1
4Jul-
14
Sep
-14
Nov-1
4Jan
-15
Ma
r-15
Ma
y-1
5Jul-
15
Sep
-15
Nov-1
5Jan
-16
Ma
r-16
Ma
y-1
6Jul-
16
Sep
-16
Nov-1
6Jan
-17
Ma
r-17
Ma
y-1
7Jul-
17
Sep
-17
Nov-1
7Jan
-18
Ma
r-18
Ma
y-1
8Jul-
18
Sep
-18
Nov-1
8Jan
-19
Ma
r-19
Ma
y-1
9Jul-
19
Sep
-19
Nov-1
9Jan
-20
Ma
r-20
Ma
y-2
0Jul-
20
Sep
-20
Nov-2
0
21.2 Mbd
Start of the Energy reform
Start of PEMEX’s
new developmentsPEMEX in
1.7 years:
144 Mbd
Private companies in
6 years:
PEMEX's production of new developments
is 6.8 times greater as compared with the
private sector and was achieved in a third
of the execution time of the private sector.

16
PEMEX total oil productionThousand barrels per day
Considers production of crude oil and condensates produced in fields, including production from partners.
-1.8% -2.4% -5.3% -2.9%-1.8% -2.4% -5.3% -2.9%-2.1%
2,5482,522
2,429
2,267
2,154
1,948
1,833
2012 2013 2014 2015 2016 2017 2018
-6.7%
-5%
-9.6%
-5.9%
-3.7%
-1%
2012-2018
1,833
1,701 1,705
1,9442,033
2,079
2,176
2018 2019 2020 2021 2022 2023 2024
2018-2024
Preliminary
-7.2% 0.1%
14.0%
4.6%2.3%
4.7%
EstimatedReal
IMPORTANT: Without the OPEC+
production reduction, the annual
average in 2020 would have been
1,732 Mbd.
1,732
17
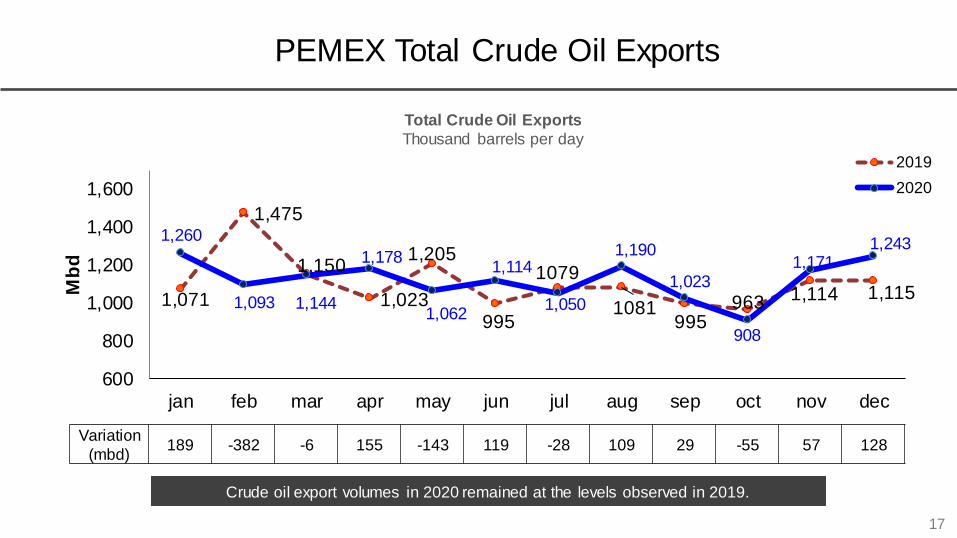
PEMEX Total Crude Oil Exports
1,071
1,475
1,150
1,023
1,205
995
1079
1081995
963 1,114 1,115
1,260
1,093 1,144
1,178
1,062
1,114
1,050
1,190
1,023
908
1,1711,243
600
800
1,000
1,200
1,400
1,600
jan feb mar apr may jun jul aug sep oct nov dec
Mb
d
2019
2020
Variation
(mbd)189 -382 -6 155 -143 119 -28 109 29 -55 57 128
Crude oil export volumes in 2020 remained at the levels observed in 2019.
Total Crude Oil Exports
Thousand barrels per day

19
Access to the Market
48.0%
40.8%
5.5%
4.1%
1.5%0.1%
Distribution by region
North America
Europe
Latinamerica
Asia
Middle East
Oceania
On October 8, PEMEX issued a USD 1.5 bn benchmark bond in the international debt capital markets
due in 5 years and a coupon rate of 6.875%.
• Reductionof financial cost initially announced thanks to investors’ interest.
• Approximate demand of USD 10 billion, equivalent to approximately 7 times the amount.
• Participation mainly from asset managers and financial institutions from the USA and Europe.
43.4%
26.2%
20.9%
3.1%
2.2%2.2%
1.7%0.2%
Distribution by type of investor
AssetmanagerInvestmentfundHedge fund
Private bank
Bank treasury

20
PEMEX 10-year Bond
Yield Rate EvolutionN
ov-1
8
Dec-1
8
Jan-1
9
Feb-1
9
Mar-
19
Apr-
19
May-1
9
Jun-1
9
Jul-19
Aug-1
9
Sep-1
9
Oct-
19
Nov-1
9
Dec-1
9
Jan-2
0
Feb-2
0
Mar-
20
Apr-
20
May-2
0
Jun-2
0
Jul-20
Aug-2
0
Sep-2
0
Oct-
20
Nov-2
0
Dec-2
0
Jan-2
1

21
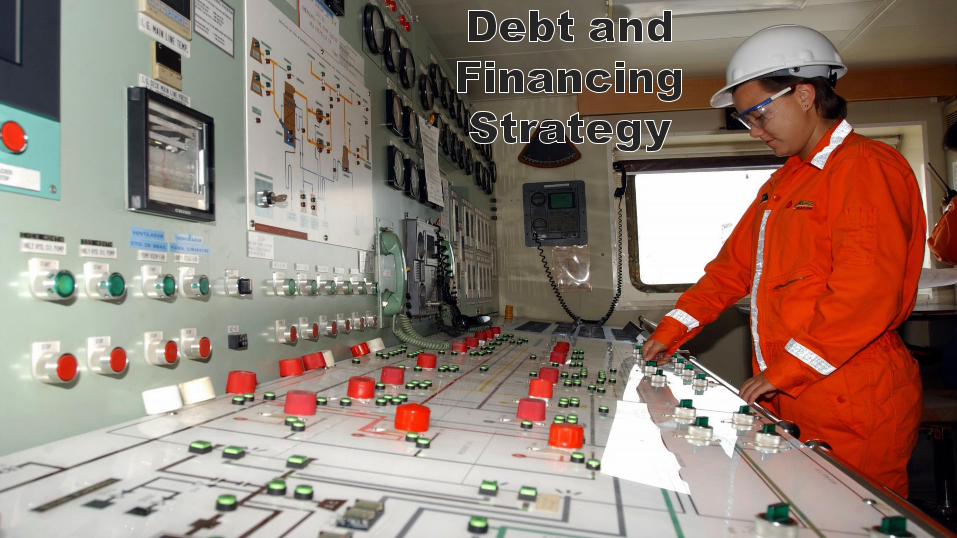
Alternative Financing Transaction:
SHCP’s Promissory Notes Monetization
In the last quarter of the year and in coordination with the Ministry of Finance (SHCP), PEMEX
implemented a financing strategy that does not constitute public debt to bolster the company’s liquidity:
➢ PEMEX and SHCP agreed on the exchange of 16 promissory notes in favor of PEMEX (notes 5 to 20) for 18 series of local bonds from the Mexican government issued by the United
Mexican States.
➢ PEMEX executed a monetization of the new securities through a transaction with a financial
institution using those new securities as underlying assets.
➢ The proceeds were used to pay revolving credit lines.
PEMEX received MXN 95.6 bn in a three-year financing structure

22
Maturity ProfileUSD billion
6.7
9.6 9.48.7 8.6
6.7
4.2
9.17.5
4.43.6
0.3 0.1
23.7
20
19
20
20
20
21
20
22
20
23
20
24
20
25
20
26
20
27
20
28
20
29
20
30
20
31
20
32
20
33
→
1.6
20
20
20
21
20
22
20
23
20
24
20
25
20
26
20
27
20
28
20
29
20
30
20
31
20
32
20
33
→
Before
As of December 31, 2018
Current
As of September 30, 2020
This administration has performed the largest refinancing operations in the history of
PEMEX: more than USD 30 billion of refinanced financial liabilities.
1. Represents the pending amount to be covered by the 2020’s financing program, considering the refinancing operations performed in the first half of the year. Does not considers revolving credit facilities and short-term credits, nor accrued interests.


24
Budgetary InvestmentMXN billion
312
334
359
306 299
194189
2012 2013 2014 2015 2016 2017 2018
-14.7%-2.3%
-35.3%-2.6%
7.6%
6.9%
189201
234
2018 2019 2020 2021 2022 2023 2024
16.0%
6.8%
EstimatedReal
2012-2018 2018-2024
Preliminary

25
CAPEX EvolutionMXN billion
97
10786
180
535
45
2018 2019 2020 2021
CAPEX Dos Bocas
Preliminary
111 121
225
Estimated

26
2020 Budgetary Cash FlowMXN million
Approved
Budget
(1)
Real
(Preliminary)
(2)
Variation
(2) - (1)
Income 1,871,336 1,283,361 -587,975
Domestic Sales 1,360,102 880,282 -479,820
Exports 421,488 343,780 -77,708
Other incomes 89,746 59,299 -30,447
Expenditures 1,820,226 1,296,908 -523,318
Budgetary Expenditure 523,425 423,013 -100,412
OPEX 190,821 188,952 -1,869
Investment 332,604 234,061 -98,544
Re-sale acquisitions 426,122 277,547 -148,575
Net third-party operations 0 -1,982 -1,982
Direct taxes 472,706 399,342 -73,364
Duties 397,974 198,989 -198,985
Budgetary Cash Flow Primary Balance 51,110 -13,547 -64,657
Net interest payments 113,734 32,626 -81,108
Budgetary Cash Flow Financial Balance -62,624 -46,173 16,451